What is Macroeconomics?1.7.1 Structure 24 1.7.2 Controversies and Consensus 24 1.7.3 Rigour and...
25
What is Macroeconomics? 1.1 Overview of Macroeconomics 4 1.2 Macroeconomic Concepts 5 1.2.1 Income and Output 5 1.2.2 Unemployment 5 1.2.3 Factors of Production and Income Distribution 8 1.2.4 Inflation 8 1.2.5 Financial Markets and the Real Economy 10 1.2.6 Openness 11 1.3 Macroeconomics in the Long Run : Economic Growth 12 1.4 Macroeconomics in the Short Run: Business Cycles 13 1.s Macroeconomics as a Sc ien ce 15 1.5.1 The Genesis of Macroeconom ics 15 1.5.2 Macroeconomics and Microeconomics 18 1.5.3 Demand and Supply 20 1.6 The Methodology of Macroeconomics 21 1.6.1 What is to be Explained? 21 1.6.2 Theory and Realism 21 1 .6.3 Positive and Normative Analysis 22 1.6.4 Testing The ories: The Role of Data 22 1.6.5 Macroeconomic Modelling and Forecasting 22 1.7 Preview of the Book 24 1.7.1 Structu re 24 1.7.2 Controversies and Consensus 24 1.7.3 Rigour and Intuition 24 1.7.4 Data and Institutions 24 1.7.5 Europe 25
Transcript of What is Macroeconomics?1.7.1 Structure 24 1.7.2 Controversies and Consensus 24 1.7.3 Rigour and...

What is Macroeconomics?
1.1 Overview of Macroeconomics 4
1.2 Macroeconomic Concepts 5
1.2.1 Income and Output 5
1.2.2 Unemployment 5
1.2.3 Factors of Production and Income Distribution 8
1.2.4 Inflation 8
1.2.5 Financial Markets and the Real Economy 10
1.2.6 Openness 11
1.3 Macroeconomics in the Long Run: Economic Growth 12
1.4 Macroeconomics in the Short Run: Business Cycles 13
1.s Macroeconomics as a Science 15
1.5.1 The Genesis of Macroeconomics 15
1.5.2 Macroeconomics and Microeconomics 18
1.5.3 Demand and Supply 20
1.6 The Methodology of Macroeconomics 21
1.6.1 What is to be Explained? 21
1.6.2 Theory and Realism 21
1.6.3 Positive and Normative Analysis 22
1.6.4 Testing Theories: The Role of Data 22
1.6.5 Macroeconomic Modelling and Forecasting 22
1.7 Preview of the Book 24
1.7.1 Structu re 24
1.7.2 Controversies and Consensus 24
1.7.3 Rigour and Intuition 24
1.7.4 Data and Institutions 24
1.7.5 Europe 25

4 PART I INTRODUCTION TO MACROECONOMICS
The Theory of Economics does not furnish a body of settled conclusions immediately applicable to policy. It is a method rather than a doctrine, an apparatus of the
mind, a technique of thinking, which helps its possessor to draw correct conclusions.
]. M. Keynes
Overview of Macroeconomics
Unemployment, inflation, booms and busts, financial markets, interest rates, and exchange rates are everyday fare in the news. All these phenomena affect our well-being. This why macroeconomics is so exciting. Macroeconomics is more than just headlines, however: it is a fascinating intellectual adventure. The breadth of issues it covers is evidence enough of its inherent complexity. Yet, a few simple ideas can go a long way seeing through complex situations. Macroeconomics is also enormously useful. People, rich or poor, are affected as jobs appear or vanish and as prices change. Businesses can gain or lose large amounts of money when their environment changes, regardless of how well they are managed. Citizens want to understand what their governments are up to. Dramatic events like depressions, when overall economic activity is very far below average and unemployment soars, or hyperinflations, when prices are increasing at monthly rates of 50% or more, can tear at a society's social fabric, and yet can be prevented when policy-makers apply sound economic principles.
But are 'sound economic principles' valid? The events that started in 2007 and led to the Great Recession and the Eurozone crises have led some observers to conclude that macroeconomics needs to be overhauled. Yet it is also common to blame medical doctors for epidemics, and or messengers for bringing bad news, and that doesn't sound fair. Macroeconomists are in a similar situation today. We will argue that macroeconomics as a field has proved its mettle. To be sure, our understanding is very far from perfect. In particular, macroeconomists are not good at making forecasts and the profession has failed to see the crisis coming. Yet, the principles underlying our field made it possible to understand these dramatic events surprisingly well
as they unfolded. They also contained prescriptions for what needed to be done. When governments heeded this advice, the economic situation in fact improved. In any case, we did not experience the Great Depression of the 1930s, and we know why. Besides helping diagnose such situations, the material in this book will teach you humility: Some events , both economic and political, cannot be predicted. This includes banking and financial crises, which contain strong behavioural elements.
A key feature of macroeconomics is that it is geared to finding solutions. Its principles may look abstract at first, but they readily lead to policy prescriptions. These prescriptions are directly related to the observation of economic events with undesirable consequences, which in turn presumes agreement on what is to be measured and how measurements are made. Before the arrival of macroeconomics, concepts such the gross domestic product (GDP), the consumer price index, or the unemployment rate simply did not exist. Some of these concepts are presented in Section 1.2, many more will be introduced as we move through the book. The next step is to formulate a diagnosis. A
key challenge at this stage is to distinguished between business cycles, or short-run fluctuations of output and employment, and long-run trends. This distinction, which is presented in Sections 1.3 and 1.4, shapes the structure of the book; both represent the subject of macroeconomics and the objective of macroeconomic policies. Equipped with these preliminary essentials, we can then examine in what sense macroeconomics is a science (Section 1.5) and how it helps us to reason about the world around us (Section 1.6). The chapter concludes with a preview of the book's contents (Section 1.7).
1.2.1 In
-:be mm nomic v.
income ' gross don
cus ed i.r J.ar!!e DW
cheir ma 2015 am
German) 0.68 trill ner.1 Obi ay size. capita,\~
che samt hould b
time bee 1 more
change.1 this issu constant 1 for this 1
course ol
A quid
cries are ' · e, bu1
uctuatic cycles.'-" andcydt rant obsE annual g fe.rences in Arger
e lattei - e peric
rae com
1 A crillio1 zeros {le
? A usefuJ
peranm

; its possessor
rescriptions wernments tion in fact erience the know why. ;, the mateility: Some mot be preicial crises, ~nts .
; that it is s may look policy pre:tly related with unde-
presumes I and how tl ofmacro
domestic lex, or the t . Some of 1.2, many
Lrough the iagnosis. A tinguished ruations of rends. This ns 1.3 and oth reprethe objec>ped with 1 examine a science about the
tpter con-contents
CHAPT ER 1 WHAT IS MACROECONOMICS? 5
1.2 Macroeconomic Concepts
1.2.1 Income and Output
The most important indicator of a nation's economic well-being is a measure of its output and income during a given year, which is called the gross domestic product (GDP). The concept will be discussed in greater detail in Chapter 2. GDPs are very large numbers, and it is good to develop a feel for their magnitudes. In 2015, the GDP of the UK in 2015 amounted to about 1.89 trillion pounds; in Germany, 3.02 trillion euros; in the Netherlands 0.68 trillion euros; in Denmark 1.981 trillion kroner.1 Obviously, these numbers are related to country size, which is why we often look at GDP per capita, which range from 25,000 to 40,000 euros in the same year across the countries of Europe. We should be careful when comparing these data over time because GDPs can change for two reasons: (1) more is produced, and (2) prices of those goods change. We will learn in Chapter 2 how to deal with this issue using so-called real GDP numbers-at constant prices, so to speak. Table 1.1, which corrects for this using prices in the year 2000, displays the course of GDP over the past century.
A quick look at the table reveals that (1 ) most countries are characterized by steady growth of GDP over time, but that (2) there are significant and recurring fluctuations of GDP around its trend, called business cycles. We return to the distinction between trends and cycles in separate sections later. Another important observation is that small differences in average annual growth rates cumulate over time to huge dif
ferences in levels. A striking example: GDP per capita in Argentina was about 15% larger than that of Sweden in 1900; 110 years later, it had fallen to half the latter's value. The reason? While both grew over the period, Sweden's economy expanded at a 2.1% rate compared with Argentina's 1.3%.2 Sinlilarly, it is
1 A trillion (1 000 000 000 000) (US usage) is 1 followed by 12 zeros (1012
). 2 A useful rule of thumb is that a country growing at rate g%
per annum needs about 70/g years to double in size.
striking to note how much poorer the Asian countries were in comparison to Western Europe and the US in 1900. Some of them caught up Oapan), or started to catch up recently (China after the late 1970s) while others still have not (Bangladesh).
A natural concern is whether GDP, or GDP per capita, is a good indicator of individual well-being. GDP says nothing about the distribution of income in the economy, which may also matter to its residents. Many researchers are now examining issues related to happiness and quality of life , not just economic output. One of the robust findings on research in this area is that while GDP is not everything, it is certainly one important determinant of economic and social well-being. Some evidence is provided in Figure 1.1, which displays on the vertical axis the results of coordinated public opinion polls. People were asked how satisfied they were with their lives. The horizontal axis corresponds to that year's GDP per capita in each country. The figures show that deep unhappiness is only found in poor countries. Yet, people in some countries seem to be poor and happy (e.g. Bhutan) while the French and the Germans seem less happy than the Danes and the Finns, who have similar standards of living. A number of explanations are currently being explored, but this is an entirely different subject!
1.2.2 Unemployment
One important phenomenon associated with cyclical fluctuations is unemployment, the fact that people seeking paid work cannot or do not find it, sometimes even when the economy is growing rapidly. The unemployment rate is the proportion of unemployed workers in the labour force. The labour force consists of those who are either working or are actively looking for a job. In comparison with the total population, the labour force leaves out young people who are not yet working, the old who are retired, and those who cannot or do not wish to work-or have given up hope of working.

6 PART I INTRODUCTION TO MACROECONOMICS
,, Real Income per Capita (GDP in euros, 2000 prices) ~o /) -
1900 1913 1929 1950 1987 1992 1999 2002 2007 201 O 2015 Av. growth rate
Austria 2.462 2,961 3, 160 3, 167 13,085 14,937 17, 145 17,920 20,289 20,280 20,824 1.9%
Belgium 3, 188 3,606 4,3 19 4,667 13,280 15,078 17,010 17,987 20,069 20,071 20, 104 1.6%
Denmark 2,578 3,343 4,337 5,933 15.401 16, 192 19,017 19,717 21.414 20,346 20,552 1.8%
Finland 1.426 1,804 2,322 3,634 13.144 12,837 15,931 17, 152 21,051 20,008 19,582 2.3%
France 2.457 2,978 4,025 4,504 14, 144 15.774 17,549 18,61 O 19,040 18,562 18,904 1.8%
Germany 2,550 3, 117 3.462 3,316 13.417 14.433 15.737 16,399 18,066 18,018 19.420 1.8%
Italy 1,526 2, 191 2,643 2,992 12,771 14,216 15,612 16,339 17,229 16,329 15,330 2.0%
Netherlands 2,925 3,459 4,861 5, 124 13.447 15, 165 17,966 18.493 20,854 20,489 20,715 1.7%
Norway 1,604 2,091 2,895 4,639 15,521 16,715 21,019 22,093 24,399 24,096 24,714 2.4%
Sweden 2,188 2,646 3,306 5.759 14.483 14,509 16,962 18,144 21,688 21,192 22,285 2.1%
Switzerland 3,275 3,645 5,410 7.745 16,912 17,800 18,590 19, 179 21, 175 21,534 21,944 1.7%
United
Kingdom
Canada
3,838 4,205 4,703 5,930 13, 154 13,785 16,650 1 7,817 20, 183 19, 158 20,311 1.5%
1.9% 2.488 3,800 4,328 6,231 15,678 15,511 18,347 19,654 21,619 21,292 22,446
USA 3,496 4,529 5,895 8, 170 18,618 19,908 23,669 24,383 27,052 26,348 28,065 1.8%
Argentina
Bangladesh
China
2,355 3,245 3.732 4,261 6,237 6.406 7,443 6,083 8,803 9.310 10,069 1.4%
1.1%
2.6%
1.7%
2.6%
417
466
512
443
472
575
445
481
461 515 574 708 778 960 1,088 1,396
383 1.484 1,822 2.702 3,586 4,857 6,299 8,948
India 622 529 961 1,146 1,568 1.719 2,402 2,847 3,639
Japan 1,008 1, 185 1,731 1,641 13,887 16,648 17,597 17,918 19,505 19,005 19,699
Source: www.eco.rug.nl/-Maddison/and The Conference Board and Groningen Growth and Development Centre, Total Economy Database, January
2011, http} /www.conference-board.org/economics/The Maddison-Project, http} /www.ggdc.net/maddison/maddison-project/home.htm, 2013
version. IMF, World Economic Outlook Database April 2016.
There are many reasons to be concerned about unemployment. A first reaction to the image of idle workers is one oflost production and income. At the same time, we need to ask whether the unemployed are able to find offers of work, whether they are turning down job offers, and if so, for what reason. Are the jobs that workers are searching at all, or are workers really unavailable for jobs on offer, perhaps because their expectations are unreasonable? Or are they simply frustrated not to find a job and have given up looking?
Unemployment is generally not a pleasant affair. Even with well-developed and efficient unemployment assistance programmes, long-term jobless workers can experience emotional stress and their skills may deteriorate. Even if they are not measurable, the social and psychological costs of unemployment are high for the affected individuals and for society as a whole. By that criterion, Europe has not done well over the last decades , as Figure 1.2 shows. The average rate of unemployment has grown inexorably to reach double-digit numbers. In the USA, in contrast, unemployment has closely
co

-~ r=;: ~ tll tl"'j s: V) g ~ :.:s ~ ~ .3 .~ ~ ~ ~ ~ 00 i.o ~ :: N ~ 'i b OJ 00 ~ OJ °' \o a ~~~~Ei§"g,,...,.~S~~ ~~ c?c?c?c?c?c?<l'c? c?c?c?c?c?c?c?c?c?c?c? ~ n ~ :::i C O PJ ,... S o.. '-· ~ rt w c .. ........ p t-1~~ .... ro 0Pp.J ~ I» 0o"rtrt>l"l>"':::lPJrto"'t:)....,, '< .. "'rt> ::rPJrt>cn::r'--t"tl ID I!. ...., g !""""' PJ :::i s c ~- ~ 0 ~-~~ t/l NC/') 0.. 1 '";1t-1C/l~;1
8
'Denmark e Switzerland
• Finl!wJ!,ve~er, •Norway
• Cw;ta Rica •• : Aus ra 1a • United States
- uo~• • U~d Kingd~,Keland
• Pallu • United Arab Emirates • Luxembourg
•Germany •Singapore
7
• .• Argenti<j •France Qatar•
•• •Suriname 1#1 Spain
• Saudi Arabia •Taiwan
_ •Guatemala • Trinidad and Tobago
c 0 ·13 .!!!
6 - l~icara~a = • = JU,..UO • • e L1ty~ ~ ~olaid
' Russ1ae Cyprus
• • • •Estonia • e • Bh'ii!n • • Turkey
I •-Phi lin !~~gina• • •Portugal
• e • !I' ";'")Wlnia e • • • ongelia e• Greece ·~ 5 Vl
J!' :.::; 9'~i'a~a~r•n• ~q
• e j'b9'lic;eorg1a • • Egypt • Bulgaria ....
~ger • Gabon 4
~-~had A ghanistan •Rwanda •Benin
3
'Togo
2 0 20000 40000
• ~anra1n
e Hong Kong SAR
60000
•Kuwait
80000
GDP per capita in 2014 International Dollars {from IMF WEO)
Fig. 1.1 GDP per Capita and Life Satisfaction in 2014
100000 120000 140000
Money is not everything in life. While public opinion polls show a clear link between life satisfaction-a measure of happiness-and GDP per capita, that link is far from tight.
Sources: GDP per capita from World Economic Outlook, IMF; Index of satisfaction with life: http://en.wikipedia.org/wiki/Satisfaction_with_Life_lndex
n ::c J> .,, -i m ;JO
~ :r: )> --i
<.n
s: )> n :xJ
0 m n 0 z 0 s: n <.n ·~
'-l

8 PART I INTRODUCTION TO MACROECONOMICS
12.0
~ 10.0 ~
~ 8.0 E .Q 6.0 0..
~ 4.0 c
::::>
2.0
0.0 -+-~~~~-=~-~~----_J 1970 1975 1980 1985 1990 1995 2000 2005 2010 2015
- Switzerland - Eurozone - United States
Fig. 1.2 Unemployment Rates in the
Eurozone, Switzerland, and the USA, 1970- 201 S
The unemployment rate, measured as the proportion of
workers who do not have a job but are looking for one, varies
considerably across countries. In the USA, the
unemployment rate moves tightly with the business cycle.
In those European countries that use the euro today,
unemployment rose markedly in the 1970s and 1980s and
stayed there for a long time. In contrast, Switzerland avoided
high unemployment for the entire period, but has also
suffered a significant increase over the past two decades.
Source: OECD.
followed the business cycle, rising in periods of slowdown, declining when growth returned. At the same time, not all European countries have shared this misery, as the case of Switzerland shows. Chapters 4 and 18 will help explain these different outcomes.
1.2.3 Factors of Production and Income Distribution
The output of an economy, its GDP, is by and large the result of work effort by men and women combined with equipment- 'machines', but also buildings and other structures. Labour
and capital are the technical names given to the two main inputs , or factors of production. 3 The distribution of total income between these two factors of production is often a political matter, even if it is largely determined by economic
Land, energy, intellectual property, and many other inputs also matter, but are quantitatively less important in macroeconomics and will be ignored to make matters simpler.
forces. The employees are paid in the form of salaries, benefits, fees, and bonuses. Governments take their share in the form of various taxes. What is left are profits, or the capital share of income. These profits go to the owners. In stock markets, ownership of companies, or shares, are traded in open markets and valued on the basis of the firms ' profitability. Figure 1.3 shows the fraction of total income in manufacturing that goes to labour, the labour share. It also plots the evolution of the stock market index over the same period, which tracks the value of shares in companies traded on the stock exchange or bourse. An index is an indicator of the evolution of some phenomenon over time, designed to take a standardized value (e.g. 1 or 100) on a particular date to highlight relative changes. The figure reveals a clear, but not perfect, inverse relationship between the labour share and average stock prices. When the share of income going to labour is high, less is available for the firms ' owners, and stock prices tend to be lower. While it would be premature to assert that one causes the other, it is certainly plausible that both are driven by common economic phenomena. In Chapter 8, we will see that depressed stock prices may adversely affect the accumulation of productive equipment and, ultimately, the growth and size of the economic pie itself.
1.2.4 Inflation
The consumer price index measures the evolution of the cost of a basket of goods meant to represent average spending by consumers. Its per cent increase is the rate of inflation. The inflation rate is usually stated in terms of percentage change per year, even when it is measured more frequently, such as every quarter or every month. Most of the time, inflation is low or moderate at rates ranging from just above 0% to 4%. In the 1970s, many European countries experienced double-digit inflation, with rates rising to 10%, 20%, or even more. In the 2010s , prices declined in a number of countries leading to negative inflation rates . In Latin America or in the transition countries of Eastern Europe, inflation rates of several hundred per
""' ~ E c: Qi 0
0 U') M
(C g M
U') 0 00 00
(O 0 0 U') 0
Qi u c: ~ "-
M M
< U') 0 00 00

::J 0 n !u ;5. n o.......,~o ,..,.o '"11:Tl::l,....~::r ..... (1) llJ ..... ::i ..... p..Vlr-'::i ....,::i
M Q.J q rt Q.J q ~ ~ o. ro· ::r rti ro· ....,::i::iVll'bVJVJ
8S
80
c:-0 7S l?
~ 70
~ ~ 6S
llJ c; · '§ ~- ~ ~ s s S-a ::i P-> -· o ro ro ro 0 - · ...., VJ 0 :i ...., llJ (1) <:VJ(tit:l.....,. :"::l<: 1'1>-'"1P'°d>-J MQ 0 Q Q (1) (1) ::l" ~ M -~ ~ ~ ~ ~ ro g o 7
France
~
~-Q) 160
SS
:;. (1)
o.:i 0
~ P"
t:: ti> - en llJ (1)
o. 0.. 0 en ::l M 0 0 () ....., ~
3SO
~~~00" ::J -· rt c:J ro 0 g P" (1)
sro~-8' (1) M 0 '"1 ~ g § ~ M
• M (1) '1 [
8S
300 - 80 0 0 c:-
2SO J\ 0 7S
"' l?
"' 0 200 ~ ~ 70
Q) u Q)
lSO -~ ~ 6S -"' ~
u Q)
100 g 160 ""iii
Q)
so "' SS
~ 0
0 fl)
....., llJ
-· ::i ~ p.. 0 llJ s ;;i (1) ';'
() ilJ .;-' ::i -· ~
..... (1)
0 ~. 0 (IQ ~ ::i ::l en
<: . 0 (1) p..
IL.I i'J (1) P" <: llJ 0 ::i - (IQ c (1) '1. (1) >--3 ::i
;:;J P" "' (1) (1) -
M Q 0 0 ::i ....,
0 2" en ; 0 'd ::i. g llJ ;;i 0 Jg ~ ~ ~ g rt U'}
C/l rt rt P" rt
5· [ [ ~ [
;:;., ><
Denmark
::J Vl ~ Ill ~. ,..,.P" · -o P"~~enC l'1> l'1> ::l P" en cr'(/)C/)Q.Jrt
~ ~ 8 ~ ~ ~· ~ ~ ~ ~
3SO
< ;::i-1'1> (1) ...., ::i 8' s ...., (1) s ::i M Q en .....,
300 -0 0
2SO J\ "' "' 200 c ~ u
lSO ·~ -"' u
100 g ""iii
Q)
so "'
19SO 19SS 1960 196S 1970 197S 1980 198S 1990 199S 2000 200S 2010 201 S 19S6 1961 1966 1971 1976 1981 1986 1991 1996 2001 2006 2011
I- Labour Share% of GDP at Factor Cost - Real Stock Prices 199S=100 I
Netherlands 8S 3SO
80
c:-8 7S
0 ~ 70
~ ~ 6S Q)
~ 60 3:
SS
300 0 0
2SO J\ "' "' 200 ~ Q) u
lSO ·~ -"' u
100 g ""iii Q)
so "'
~ 0 19Sl 19S6 1961 1966 1971 1976 1981 1986 1991 1996 2001 2006 2011 2016
I- Labour Share % of GDP at Factor Cost - Real Stock Prices 199S=lOOI
1-- Labour Share % of GDP at Factor Cost -- Real Stock Prices 199S= 100 f
Sweden 8S 3SO
80
c:-8 7S
0 ~ 70
~ ~ 6S Q)
~ 60 3:
SS
19S6 1961 1966 1971 1976 1981 1986 1991 1996 2001 2006 2011
1-- Labour Share% of GDP at Factor Cost -- Real Stock Prices 1995= 100 I
300 g 2SO J\
"' "' 200 ~ Q) u
lSO -~ -"' u
100 g ""iii Q)
so "'
Fig. 1 .3 Labour Share of Income in Manufacturing and Stock Prices, Four Countries, 1950-2016
Labour and capital share the fruits of the economic activity. The labour share is the fraction of economic output which is paid to workers in wages and other forms of
compensation. The valuation of companies, reflected in stock prices, is negatively associated with the labour share. Real stock prices are computed as a share price index
divided by the GDP deflator, a measure of the price level.
Sources: Labour share: AMECO database, European Commission; Stock prices: Economic Outlook, OECD.
n :r
"' ~ -I m :i:i
~ :r: ~
s: )> n :0 0 m n 0 z 0 s: n "' ·~
\D

10 PART I IN TR OD UCTION TO MA CROECONO MICS
cent were quite common in the 1980s. When inflation is very high it is usually measured on a monthly basis; the term hyperinflation describes situations when this monthly inflation rate exceeds 50%. A sign of exceptional economic distress, hyperinflation has been observed in Central Europe in the early 1920s, in Latin America in the 1980s, and in many countries which emerged from the collapse of the Soviet Union in the early 1990s.
In normal times, inflation is related to the business cycle. Figure 1.4 shows how the rate of inflation changes when the rate of capacity utili
zation varies. The rate of capacity utilization measures the degree to which companies are truly employing their available plant and equipment, and it serves as a good indicator of cyclical conditions. The inflation rate is generally procy
clical: it tends to rise when activity is high and declines in periods of slack. In contrast, the unemployment rate is countercyclical : it moves
5
4
E" 3
" c: c:
2 "' w 0..
~ ., ~ 0 c: 0
·~ 0:: -1 .!O .!O ., QI)
-2 c:
"' ..c: -3 u
-4
against the cyclical behaviour of output, falling when output is growing rapidly and rising when output is growing more slowly or falling. The behaviour of inflation is investigated in Parts III and IV of this book.
1.2.5 Financial Markets and the Real Economy
Financial markets play a central role in modern economies. Either literally or with the help of sophisticated communications technologies , they represent arenas where buyers and sellers of financial assets such as bonds, stocks, currencies, and other financial instruments meet to trade. Together with banks and other financial institutions, financial markets gather resources from households and firms in the form of savings and lend them out to others who will spend them. One specific feature of these markets is the extreme day-to-day variability of prices at which financial instruments are traded.
90
85
80 E" " c: c:
"' w 75 0..
~ c ·c;
"' 0.. 70 "' u
65
1967 1971 1975 1979 1983 1987 1991 1995 1999 2003 2007 2011 2015
-- Change in inflation {left axis) -- Capaci ty utilization rate (right axis)
Fig. 1.4 Capacity Utilization Rates and Changes in Inflation Rates, USA, 1967-201 S
When measures of the utilization of capacity indicate a high level of activity in factories, the rate of inflation tends to rise, i.e.
prices rise at an increasing rate. Conversely, low levels of activity are accompanied by declining rates of inflation.
Sources: Bureau of Labor Statistics (CPI) and Federal Reserve Bank of Saint Louis (capacity utilization).
Physical i ductive cap financial cc which fina1 The other , households. resent one prices rise, The real ecc or monetary
duction anc and the inc< ties . The lat etary and fu the real and together to rates are de1 explores thi when the ec financial ass the issues c deterrninatii
1.2.6 Ope1 In the mode national trai and services increasing n Lhrough trac country's op
omicinflue -- the ratio o -o its GDP. 1 - erably inc
cess of incri goods, servic ..,~ently callE
utput, falling l rising when · falling. The ~d in Parts III
~Real
le in modern the help of
10logies, they ·Hers offinan-1rrencies, and ·ade. Together utions, finan-1 households .end them out ~ specific feane day-to-day 1 instruments
E' ::i c: c:
"' ti; 0.
~ 2:-~ 0.
"' .)
Is to rise, i.e.
Physical investment, the accumulation of productive capital by firms, is intimately related to financial conditions. It is one channel through which financial markets affect the real economy.
The other channel is consumption spending by households. Stocks- shares in corporations-represent one form of private wealth. When share prices rise, people feel richer and consume more. The real economy is contrasted with the financial or monetary economy: the former concerns the production and consumption of goods and services, and the incomes associated with productive activities. The latter deals with trade in assets, i.e. monetary and financial instruments. Chapter 11 brings the real and the monetary spheres of the economy together to understand how output and interest rates are determined from year to year. Chapter 12 explores these short-run linkages in more detail when the economy is open to international trade in financial assets. Chapters 13 and 14 bring together the issues of inflation, output, and exchange rate
determination.
1.2.6 Openness
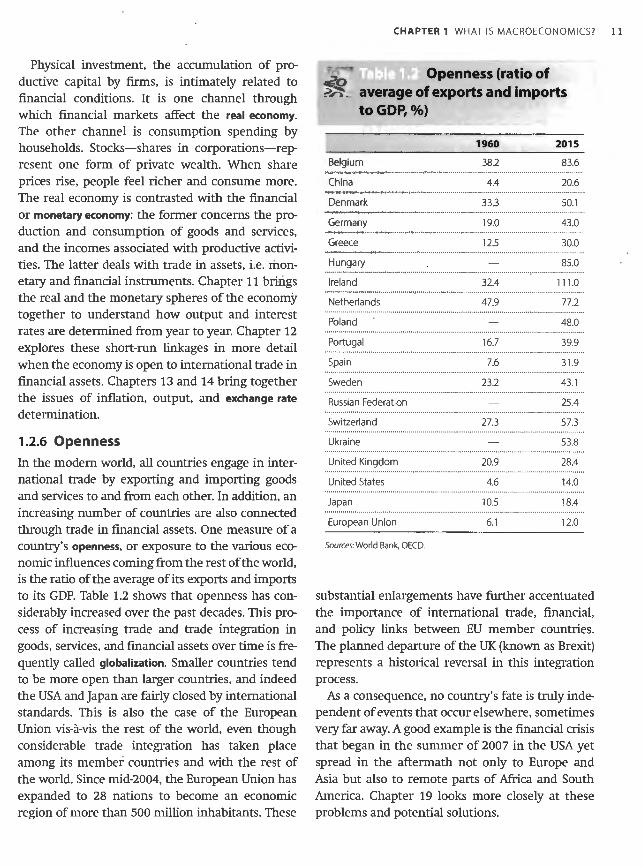
In the modern world, all countries engage in international trade by exporting and importing goods and services to and from each other. In addition, an increasing number of countries are also connected through trade in financial assets. One measure of a country's openness, or exposure to the various economic influences coming from the rest of the world, is the ratio of the average of its exports and imports to its GDP. Table 1.2 shows that openness has considerably increased over the past decades. This process of increasing trade and trade integration in goods, services, and financial assets over time is frequently called globalization. Smaller countries tend to be more open than larger countries, and indeed the USA and Japan are fairly closed by international standards. This is also the case of the European Union vis-a-vis the rest of the world, even though considerable trade integration has taken place among its member countries and with the rest of the world. Since mid-2004, the European Union has expanded to 28 nations to become an economic
CHAPTER 1 WHAT IS MACROECONOMIC57
;.;~ .... _.,.,
~
Openness (ratio of b
~'1" _ average of exports and imports to GDP,%)
1960 2015
Belgium 38.2 83.6
China 4.4 20.6
Denmark 33.3 50.1
Germany 19.0 43.0
Greece 12.5 30.0
Hungary 85.0
Ireland 32.4 111.0
Netherlands 47.9 77.2
Poland - 48.0
Portugal 16.7 39.9
Spain 7.6 31.9
Sweden 23.2 43.1
Russian Federation 25.4
Switzerland 27.3 57.3
Ukraine 53.8
United Kingdom 20.9 28.4
United States 4.6 14.0
Japan 10.5 18.4
European Union 6.1 12.0
Sources: World Bank, OECD.
substantial enlargements have further accentuated the importance of international trade, financial, and policy links between EU member countries. The planned departure of the UK (known as Brexit) represents a historical reversal in this integration process.
As a consequence, no country's fate is truly independent of events that occur elsewhere, sometimes very far away. A good example is the financial crisis that began in the summer of 2007 in the USA yet spread in the aftermath not only to Europe and Asia but also to remote parts of Africa and South America. Chapter 19 looks more closely at these
region of more than 500 million inhabitants. These problems and potential solutions.
11

12 PART I INTRODUCTION TO MACROECONOMICS
Macroeconomics in the Long Run: Economic Growth
Figure 1.S(a) displays estimates of GDP for France, Germany, and the UK since 1870. A positive long-run general tendency, or trend, clearly dominates shorterrun fluctuations. The trend rate of growth has been fairly stable, perhaps with a slight increase after the
Second World War. Another way of seeing this is to plot the natural logarithm of GDP against time, as in panel (b) of Figure 1.5. With this so-called logarithmic
scale the slope of the curve is a direct measure of the annual growth rate: a constant growth rate would
~ e " <lJ
0 0 0 N
0 ~
c ~ cc
(a) 1800
1600
1400
1200
1000
800
600
400
200
0
{b)
1-- France -- Germany -- United Kingdom I
o~o~o~o~o~o~o~o~o~o~o~o~o~o~o~ ~~oooo~~oo ~~ NNMM~v~~~~~~oooo~~oo ~~ 000000000000~~~~~~~~~~~~~~~~~~~~0000 ~~~~~~~~~~~~~~~~~~~~ ~~~~ ~~ NNNN
7.5 ~---------------------------~
E I -- France -- Germany -- United Kingdom I £ 7 -~
.2 6.5 ~ ~ 6 c c ~ 5.5 e " <lJ 5 8 0
~ 4.5
4
o~o~o~o~o~o~o~o~o~o~o~o~o~o~o~ ~~oooo~~oo ~~ NNmmv~~~~~~~oooo~~oo ~~ 000000000000~~~~~~~~~~~~~~~~~~~~0000 ~~~~~~~~~~~~~ ~ ~~~~~~~~~~~~ NNNN
Fig. 1.5 Gross Domestic Product (GDP), France, Germany, and the UK, 1870-2015
National output and income, as captured by the gross domestic product, exhibits a robust growth trend. Growth tends to be
exponential; that is, annual percentage increases are reasonably stable in the long run. This does not preclude significant year
to-year variations (panel a). When the data are displayed on a logarithmic scale instead (panel b), the slope of the curve
measures the annua l rate of growth.
Source: 1870- 1949: Maddison (1991 ) (http://www.ggdc.net/maddison/oriindex.htm); 1950-2015: Conference Board's Total Economy Database
(https://www.conference-board.org/data/economydatabase/ index.cfm?id =27762).
yield a st:l
seem VeI)
This tre able incre look at Ta income in since 190I
Japan. Yet by all cou income pe1
period. Son
ch as expanded ~~ed for D
·oo ofr.
!?CJSeS a p.o explosive G
world'

•ing this is to LSt time, as in ~d logarithmic
,easure of the h rate would
tends to be
1nificant year
curve
my Database
yield a straight line.4 In the long run, on average, we seem very close to a rather robust and steady trend.
This trend growth in total output implies remarkable increases in living standards. Let's take another look at Table 1.1. Note that per capita, or average, income increased to more than sixfold in Belgium since 1900, ninefold in Sweden, and 18-fold in Japan. Yet the growth phenomenon is not shared by all countries at all times. In Bangladesh, real income per capita rose by only 120% over the same period. Some countries have faced serious setbacks, such as wars and famines, while others have expanded rapidly. Some, like China and India, stagnated for many decades before suddenly entering a period of rapid increase in living standards. China
CHAPTER 1 WHAT IS MACROECONOM IC57 13
Because of these momentous increases in standards of living, economic growth is one of the most exciting issues in macroeconomics. Chapter 3 explores in detail the reasons why economies grow. One reason is an increase in population, since more people can work and produce more output. Another is the accumulation of means of production: plant and equipment, roads, communication networks, and other forms of infrastructure make workers more productive. Most important is the development and harnessing of knowledge and technology to economic ends. The sharp acceleration of scientific discoveries towards the end of the eighteenth century is thought to have triggered the industrial revolution, and some
poses a particularly interesting case because its believe we are now witnessing the onset of a new explosive take-off was so recent, and because it was wave of advances related to information and telethe world's most advanced economy 700 years ago. communications technology.
1.4 Macroeconomics in the Short Run: Business Cycles
While output and income have increased by staggering amounts over many decades, growth is not constant or even steady. Figure 1.5 shows that real output tends to fluctuate around its trend. This is even more apparent in Figure 1.6, which plots the quarterly rate of change in GDP for the UK. Quarterly data tend to accentuate the relative importance of short-run fluctuations. These sustained periods of ups and downs are called business cycles. One important challenge of macroeconomics is to explain such deviations of GDP from its underlying trend, referred to as the out
put gap. Why do these fluctuations occur and persist over periods ranging from three to 10 years, and what can be done, if anything, to avoid the disruptions that are associated with them? This is the common theme of Parts III and IV of this book.
4 For mathematically inclined readers, if x(t), the value of x at time t, grows at constant rate g, defined as (1/x)dx/dt, then x(t) = x(O)egt and ln x(t) = ln x(O) + gt.
While business cycles are hardly identical across countries and across time, they have a number of common features. These features are represented in Burns-Mitchell diagrams. The idea is simple. Imagine cutting up a curve like those depicted in Figures 1.5 or 1.6 into a set of cycles and superposing all these cycles on top of each other. To do this, it is necessary to identify calendar dates for cyclical turning points of output (GDP)-here we will be concerned with peaks, but the procedure can be used for troughs as well. Having identified those cyclical peaks, simple numerical averages of other macroeconomic variables of interest can be calculated around the calendar date of the output's peak. The behaviour of those variables around the turning points of output tells us something about whether the variables are leading-meaning that they can help forecast future turning points in output. More importantly, they can help inform the formulation of theories which will help us better understand how business cycles arise and develop over time. Box 1.1 provides more details on the Burns-Mitchell methodology.

14 PART I INTRODUC TION TO MACRO ECONOM ICS
12
10
8
0 tlO 6 "' :. Q)
>-
"' :;; 4 t:: "' ~ 0-Q) 2 E [)( E g 0 Q) tlO c
"' .r:; -2 u ~
-4
-6
-8 ~~~~~~~~~~~~~~~~~~~~~~~~~~~~~~~~~~~
1956 1961 1966 1971 1977 1982 1987 1992 1998 2003 2008 2013
Fig. 1.6 Quarterly Gross Domestic Product, UK, 1956:1-2015:3
With growth rates, fluctuations of economic activity become more apparent.
Source: Office of National Statistics.
Burns-Mitchell Diagrams, Now and Then
The fluctuations of economic activity in the rapidly industri
alizing economies of Europe and the USA attracted much
interest in the early part of the twentieth century. In the
1920s and 1930s, the National Bureau of Economic Research
(NBER) in New York was a centre of such research, associ
ated with Gottfried Haberler, Simon Kuznets, Wassily
Leontief, Allyn Young, and many other economic luminaries
of the day. A common view of these researchers was that
the emergence of powerful statistical methods made it
possible to study economic phenomena in general, and the
business cycle in particular, in a more scientific fashion.
Two NBER researchers, Arthur Burns and Wesley Mitchell,
were somewhat sceptical of the statistical approach but
committed to a data-driven, descriptive assessment of busi-
ness cycle regularities. Mitchell had already written a book
in 1927 that more or less laid out the research programme,
but together with Burns the project ultimately came to frui
tion after the Second World War. The idea was to reduce the
time series of data to a sequence of cycles and then study
the average behaviour of other important variables a
number of periods before and after the peak of the average
cycle. This highly data-intensive empirical approach was
considered modern and useful, even if it was criticized in
some quarters as 'measurement without theory '.
The identification of business cycles is always a tricky
procedure with some element of arbitrariness. We
employ a particular method which has gained accep
tance in recent years and apply it to eight advanced
economies ov1
result is a refen
of Figure 1 .7. T
used to produ
give the behavl
1.5.1 The Ge
Why do we ob downs-in the is unemploym1 changes in infl time, economi: nomena. In fac tioning marke collective outc least, and that aggregate beh 'laissez-faire'. C
some form of port for partin ing subsidies competition. This does not ignored comp] lengths were ic inventory cyclE long-wave cyclE vides details o cycles were st
The method is di summarized as ti che original serie GDP is higher th. quarters. In case only the highest lowest points in :

\
ten a book
rogramme,
1me to frui
reduce the
then study
•ariables a
1e average
roach was
riticized in
ys a tricky
iness. We
ed accep
advanced
CHAPTER 1 WHAT IS MACRO ECONOMICS? 15
Burns-Mitchell Diagrams, Now and Then (Continued)
economies over about 35 years of quarterly data.5 The
result is a reference cycle which appears in the first panel
of Figure 1.7. The cycles identified by this procedure are
used to produce the other panels of Figure 1.7, which
give the behaviour of variables 10 quarters before and 1 O
quarters after the cyclical peak, usual ly stated in propor
tion to the average value over that period. In Figure 1.8,
we present the original findings of Burns and Mitchell,
who worked on primarily monthly US data from the late
nineteenth and especially the early twentieth century.
1.s Macroeconomics as a Science
1.5.1 The Genesis of Macroeconomics
Why do we observe cyclical fluctuations-ups and downs-in the level of GDP around its trend? Why is unemployment generally countercyclical, while changes in inflation appear procyclical? For a long time, economists paid little attention to such phenomena. In fact, it was believed that properly ft.mctioning markets would deliver the best possible collective outcome, to a good approximation at least, and that there was no point in looking into aggregate behaviour. This principle was called 'laissez-faire'. Opponents of laissez-faire endorsed some form of interventionism- government support for particular markets and industries , including subsidies and protection from foreign competition. This does not mean that business cycles were ignored completely. In fact, cycles of varying lengths were identified and studied, ranging from inventory cycles of one or two years' duration to long-wave cycles lasting half a century. Box 1.2 provides details on these cyclical movements. Such cycles were seen as the cumulative outcomes
5 The method is due to Harding and Pagan (2001) and can be summarized as follows. For a four-quarter moving average of the original series, define a peak as the quarter for which GDP is higher than the two preceding and the two successive quarters. In case two or more consecutive peaks are found, only the highest is retained. Next examine the highest and lowest points in a neighbourhood of the peaks. Now repeat
of disturbances such as discoveries, inventions, exceptionally good or bad crops, wrong bets by firms on goods that customers want to buy, or even changing tastes of consumers at home and abroad. Inflation was seen as the consequence of rapidly growing money stocks, first because of gold discoveries in the nineteenth century, afterwards because of reckless paper money creation by central banks. As will be seen in Chapter 16, much of this wisdom remains valid today. Yet the Great Depression of the 1930s, which spread throughout the world and sent millions into unemployment and misery, seemed too severe to be simply bad luck. Reflecting upon the Great Depression in 1936, British economist John Maynard Keynes published The General Theory of Employment, Interest and Money, a book that is often said to have started the field of macroeconomics. Keynes stressed the role of aggregate demand in macroeconomic fluctuations . His followers later persuaded policy-makers to engage in aggregate demand management, that is, to manipulate government demand in order to smooth out fluctuations , mainly to avoid protracted recessions.
the procedure using an unweighted short-term moving average of the original series. In the neighbourhood of these intermediate turning points, troughs and peaks are determined in the unsmoothed time series. If these pass a set of additional restrictions on the magnitude of the fluctuation, they are selected as the final cyclical turning points.

16 PART I INTRODUCTIO N TO MACRO ECONOM ICS
Real GDP
1,04 Q) OD ~ Q)
1,02 ~ ~ t:'. "' ::: 1,00 '! ;::; 2 0,98 Q) > ·~
~ Q)
0,96 :::
~ 0,94
- 10 -5 0 5 10
Quarter relative to peak
Unemployment
1,30 Q) OD ~ Q)
1,20 > "' ~ Q)
t:'.
"' ::: 1,10 '! ;::; 2 1,00 Q)
> ·~
~ 0,90 Q) :::
~ -5 0 10
Quarter relative to peak
Short term interest rate
1,40 Q) OD ~ Q)
1,30 > "' 1,20 ~ Q)
t:'.
"' 1,10 ::: '! ;::; 1,00 2
0,90 Q) > ~ 0,80 ~ Q)
0,70 :::
~ -5 0 10
Quarter relative to peak
Q)
~ ~ 2,00 Q)
t:'. "' ?- 1,00
;::; ~ 0,00 > ·~
~ -1 00 Q) ' :::
~
Real GDP (growth rate)
-2,00 ~-~-~-~~ -10 -5 0 10
Quarter relative to peak
Price inflation
1,30 Q) OD ~ Q) 1,20 > "' ~ t:'. 1,10 "' ::: '! ;::; 1,00 2 Q)
0,90 > ·~
~ Q) 0,80 :::
~ -5 0 5 10
Quarter relative to peak
Total employment
1,02 Q) OD ~ 1,02 "' > "' 1,01 ~ t:'. "' 1,01 ::: '! ;::; 1,00 2
1,00 "' > ·~
0,99 ~
"' 0,99 :::
~ -5 0 10
Quarter relative to peak
Fig. 1.7 Burns-Mitchell, Now: Eight Countries, 1970-2015
These six figures display the average behaviour of variables around cyclical peaks, where the cycle is measured using a
procedure described in the text. The vertical line around zero shows the quarter in which real GDP reaches its peak (upper left
panel). The peak is followed on average by a sharp drop in the growth rate of output (upper right panel). Unemployment is
countercyclical, rising most after the peak in GDP has been passed, but is rising across cycles, indicating that average
unemployment rates in the sample were increasing over time. The inflation rate is procyclical but lagging, peaking in the
quarter after output. Short-term interest rates and employment are strongly procyclical.
Source: OECD; authors' calcu lations.
Industrial ar
- lndustria - Agricultu
T 1---, ---- -1
' ' ' ' ' ' 130~ 120---
110---
100~
90-/-
80---
I I T
- Smooth - Raw
T .---,-------' ' ' ' ' '
160; : :
150~~-
140---
130---
120 ---
110---
100~ 90
80
70
T
- Factory en - Factorypa - lncomep<
T ,--i----· ' ' ' '
130 ----+:~·--
120----
110----
100~ 90 q__
T

ig a
(upper left
yment is
~e
in the
L
Industrial and agricultural production
- Industrial production } 5 cycles, - Agricultural marketings 1919-1938
T P T :- - -j"'- - - - - ,- - - - - -,- - - - - - - - - -
130
: l ! i l ! -T----r--: ' I I : :
120 /'\ 11070 s ~ 100 s: 90 ~
80
T p T
Production of durable and nondurable goods
- Durable } _ Nondurable 5 cycles, 1919-1938
T p T :- -7- - - - -1- - - ---;- - -,- - r- - - - -.- - - - -.-- -, I I I I I I I I I I I I I I I I I I
130 I I t I I : I I
' ' 120: :
110 ---+---.,,,,,c:.~........:\.---
100 ---=~~---~~--90 ,.,r----------4--80 #-----------l.--
70 -----------l T p T
Call money rates
- Smoothed } 14 cycles, 1858-1914 - Raw
T p T :- - ~- - - - - -,- - - - -1- -,- - -1- - - - -r-- -- - ., - --.
: : : : ' : : : : 160 I I I I I : : I
! ! i : : ! 150 I I I I
140 ---+-.\---------
130 ---Y-~-
120 ---+-+~-
11 0 --1---+------ll.---
l ~ l 1I1 ~ T p T
Employment and incomes
- Factory employment (6 cycles, 1914-1938) - Factory payrolls (5 cycles, 1919-1938) - Income payments (4 cycles, 1921-1938)
T p T
130
---, -----;-----r- -,--r----:----:--: ! ! ! ! ! ! ! : : : '
120-----~--~---
11 0 ,$.-'~
1 00 7"l' '""" 90 ... sr ~
T p T
- Smoothed } 5 cycles, 1914-1933 - Raw
p T --------:-----r--:--:----·r----r--~
160: I I : I : i ! : I I I I I I I I I
I I I :
' ---~A---__'.__:
'
110---n'----___J~--
100--J~----_\,,..__
90 .-~--,--l---~Li
80 r--t--+-+-+--+--1~ ?o ~r---+-+--i-+-+-JJ
T p
Wholesale and retail prices, foods
- Wholesale}4 cycles, 1921-1938 Relail
T p
T
T -- ------:------r--1---:----,---- --
, I I I I
120 : :
110 -----------
100~ :::::>..
~ ~----90~ ~ 80
I I I I I I I I I T p T
CHAPTER 1 WHAT IS MACROECONOMICS? 17
Fig. 1.8 Burns-Mitchell, Back Then: US Monthly Data, 1914-1938
These original figures document the
work of Burns and Mitchell on US
monthly pre-World War II data for
industrial and agricultural production
as well as durable and non-durable
goods, interest rates, employment,
payrolls, and food prices (GDP data did
not exist at the time these diagrams
were constructed). As in Figure 1 .7, the
cyclical peak is identified using a well
defined procedure, and averages of the
cycles around that peak (denoted 'P') to
trough (denoted 'T'). Production,
employment, wages, wholesale prices,
and interest rates are procyclical and
coincident, while retail prices seem to
lag slightly. The procyclical behaviour
of interest rates became significantly
less pronounced after 1914, which was
the year after the US central bank, the
Federal Reserve System, was founded.
Source: Mitchell (1951 ).

18 PART I INTRODUCTION TO MACROECONOMICS
An evaluation of the success of demand management policies is presented in Chapters 16 and 17. Since the Second World War, the amplitude of the business cycle appears to have diminished considerably, as can be seen in Figure 1.5. Of course, the global recession of 2008-2009, sometimes called the 'Great Recession', is a major setback. For centuries, earlier generations assumed that favourable periods of growth were inevitably followed by periods of declining activity. Following Keynes, concern initially centred on fluctuating demand. The attention then turned toward the supply side-meaning the productive capacity of an economy- and the efficient utilization of labour and capital resources. This applies especially to unemployment, which remains a big problem in much of Europe. These topics are the subject of Chapter 18.
Another remarkable change in the behaviour of the post-war economy concerns the general price
level, or the cost of goods in terms of money. Until the First World War, prices were as likely to rise as they were to fall, as can be seen from Figure 1.9. Apart from war periods, the price level was trendless; over long periods of 20 to 50 years, the consumer price index-a measure of the average price level-was remarkably stable. One interpretation of the post-war era-a controversial one, as we
All Kinds of Cycles
shall see-is that macroeconomics has led to more steady output growth at the cost of inflation. In the mid-1980s, concern with high inflation triggered a change of heart. In particular, most central banks have toned down demand management policies and refocused their energy on keeping inflation low. The crisis that started in 2007 is now forcing central banks to recognize that they have a broader duty than price stability; in particular, they have to be concerned with financial stability and the health of the banking system.
1.5.2 Macroeconomics and Microeconomics
The macroeconomy is just the sum of hundreds or thousands of markets, each of which is explained by microeconomic principles. Microeconomics is devoted to the study of prices of individual goods and of the markets where these goods are produced and sold. Why do we need two separate disciplines? To a great extent they are linked. Microeconomics is dedicated to the analysis of market behaviour of individuals. Macroeconomics is concerned with collective behaviour, the outcome of individual decisions taken without full knowledge of what others do. Thus macroeconomics should be built on microeconomic principles. This is how the field has
Business cycles, like comets, bear the names of their dis- human births, deaths, and marriages before turning his
coverers. Simon Kuznets (1901-1985) was a Russian- skills to interest rates and credit conditions. These Juglar
born US economist who received a Nobel Prize for his
work on growth. Russian economist Nikolai Kondratieff
(1892-1938) developed his theory of long-wave cycles in
the 1920s before he was arrested and disappeared; the
official Soviet Encyclopaedia then wrote about his work:
'this theory is wrong and reactionary'. It was also in the
1920s that Joseph Kitchin (1861-1932), a South African
cycles-which involve fluctuations of investment spend
ing, GNP, inflation, and unemployment-are perhaps the
closest thing to the business cycle that we will study in
th is book.
Interestingly, one of the most robust and regular cycles
in economic activity is the cycle that coincides with the
seasons of the year. Movements of output in agriculture,
statistician and gold trader, uncovered his own more manufacturing, construction, and tourism have obvious
rapid cycles of 2-4 years' periodicity, which are associ
ated with inventory movements, bank clearings, and
wholesale prices. Clement Juglar (1819-1905), a nine
teenth-century French physician, first studied cycles in
seasonal components which sometimes swamp business
cycle fluctuations in magnitude, as do patterns in overall
output associated with bank holidays, summer and win
ter weather, and harvests.
Fig. 1.9 Pric
Until the outbri
Second World\
the 1980s, decl1
Source: Maddison
evolved over seeking to b1 framework is we go half tht

d to more .on. In the riggered a ral banks t policies inflation
w forcing a broader ~y have to he health
hundreds which is rinciples. of prices ts where iy do we at extent icated to iividuals. :ollective decisions thers do. m microfield has
·n ing his
;e Jug lar
tspend
haps the
study in
ar cycles
with the
·iculture,
obvious
Jusiness
1 overall
ind win-
g 'ii a U">
"' OJ ] ~ =
CHAPTER 1 WHAT IS MACROECONOMICS7 19
(a) Price levels
10000.-~~~~~~~~~~~~~~~~~~~~~~~~~~~---,
- - France
-- United Kingdom
1000
100
Qi 10 .3 ., u ·c c..
E :::> c c "' ~ ., 0..
~ ., ~ c 0
·~ 0:: c
0.1 '--~~~~~~~~~~~~~~~~~~~~~~~~~~~~~~~ Ot.nO t.n OLJ'"lO LJ'"lOLJ'"lOUIO Ll)Q L/'lO U")QLl)QLl)Q Ll"'lOl.rlO U""I O I.() r--.. r--. co co °' 0\ o o r- .-- N N rn rn -q- ~ ui LI) \D \D r--.. r--.. co co 0\ 0\ o o .-- .-co 00 co 00 00 co 0\ °' 0\ 0\ 0\ 0\ 0\ 0\ 0\ 0\ 0\ 0\ 0\ 0\ 0\ 0\ 0\ 0\ 0\ 0\ 0 0 0 0
N N N N
(b) Inflation rates
70% ..--~~~~~~~~~~~~~~~~~~~~~~~~~~~~~~
60% -- France
50% -- United Kingdom
40%
30%
20%
10%
0% 1~ l~c».11= r-~ "::!'A _,hj
-10%
-20%
-30% L-~~~~~~~~~~~~~~~~~~~~~~~~~~~~~_J
0 tJ') 0 LI) 0 Lf'I 0 U1 0 LJ) 0 LI) 0 I.Ji 0 I.I) 0 l/) 0 LJ1 0 L/) 0 Lf) 0 LJ'"l 0 Lt') 0 LI) f". I' 00 00 0\ 0\ 0 0 r- .-- N N M M ~ ~ U"'I ll"I \D \D f""-. I""-- 00 CO 0\ 0\ 0 0 r- r-C000000000000\0\ 0\ 0\ 0\ 0\ 0\ 0\ 0\ 0\ 0\ 0\ 0\ 0\ 0\ 0\ 0\ 0\ 0\ 0\ 0000
N N N N
Fig. 1.9 Price Levels and Inflation Rates, France and the UK, 1870-2015
Until the outbreak of the First World War, the price level was stable, and inflation was close to zero on average. Since the
Second World War, the price level has risen secularly, average inflation has been positive, high in the late 1970s and much of
the 1980s, declining over the 1990s and becoming very low, close to zero, in the 201 Os.
Source: Maddison (1991 ); OECD.
evolved over the past three decades. However, seeking to bring together all markets into one framework is a daunting challenge. In this book, we go half the way. We recall the microeconomic
principles that are needed to understand decisions like consumption and productive investment, as well as the overriding importance of budget constraints. Yet, we do not insist on

20 PART I INTRODUCTION TO MACROECONOMICS
grounding the overall picture in these principles. We do so for two reasons.
First, bringing together microeconomic principles leads to considerable complexity. We believe that simplicity and clarity are an essential ingredient of a textbook. Of course, simplicity should not come at the expense of accuracy. It turns out that, at this stage of the development of the discipline, the complexity of the effort has led to a large number of arbitrary simplifications that do not ensure accuracy. Second, in creating macroeconomics , Keynes stressed the notion of coordination
failures , which arise in decentralized markets as illustrated in the following example. A consumer wants to purchase a car, but her income is insufficient for her to do so. A car manufacturer could actually hire her to build cars, and with her salary she would then be able to buy one. That one sale, however, would not suffice to pay her salary, so other buyers would need to be found. In order to generate sufficient demand for her employment, several other individuals would need to be hired, perhaps in different industries. For this scheme to work, a considerable amount of coordination among producers and consumers would be required.
The laissez-faire principle is that prices and markets automatically and perfectly perform this coordinating role. Keynes' critique of markets was that sometimes they fail to produce the desired result as quickly as we would like to see. There may be many consumers wishing to buy goods and willing to work to produce them, and many firms that would benefit from hiring them if only they could be persuaded that their sales would increase. But this potential may not be realized and we have both recession (fewer sales) and unemployment (fewer jobs). Even if market forces tend to correct this imbalance-which they eventually do-the period of time necessary may be long enough to involve significant social costs. Macroeconomics started with the idea that prices and markets do not continuously resolve all the coordination requirements of a modern economy.
1.5.3 Demand and Supply
In its most concentrated form, macroeconomics boils down to separating events into two categories: {1) those that affect the demand for goods and services, and (2) those that affect the supply of those goods and services. The demand side relates to spending decisions by economic agents-households, firms, and government agencies-both at home and abroad. The principle of aggregate demand management policies is that the government can take actions to offset or smooth out those of private agents-firms and households-in order to dampen or eliminate fluctuations in total spending. The idea is to take the edge off recessions as well as booms. Two traditional demand management instruments are fiscal and monetary policy. Fiscal policy manipulates government expenditures or taxes in an attempt to affect the volume of national spending. This subject is studied in detail in Chapter 17. Monetary policy is directed at influencing interest and exchange rates, and more generally conditions in financial markets. This in turn affects spending on goods and services. Chapters 9 and 10 provides an in-depth analysis of money and monetary policy.
The supply side relates to the productive potential of the economy. The choice of hours worked by households , the productivity of their labour, and in general the efficiency with which resources are allocated in generating output, all affect an economy's aggregate supply. Accordingly, supply-side policies represent government's effort to increase an economy's long-run capacity as well as its overall efficiency. Frequently, this effort is about reducing or eliminating government-induced inefficiencies, which were introduced before the importance of the supply side was understood, or as the result of successful lobbying by interest groups. It is also about bringing idle or underutilized resources into productive uses. Unemployment policy-designed to fight the scourge of market economies-occupies a key role in the supply side. Chapter 18 explores these issues and shows how the government can improve or worsen the economic climate.
1.6.1 Whi
Macroecorn ity, the leve tion, wage~
goods, sen Before begi is essential explain anc realm of a: using econ variables. T to explaintinction is 1
variables o: instrument: cies), econo activity anc sometimes, business op
The distil nous variabl nous variab endogenous steps. Many
Exogenous var
Fig. 1. 10 E
Variables
Endogenous
economic me
out5ide the e
d ecisions are
obeexogen

)economics wo categor goods and ~ supply of te relates to nts- house~s-both at 0 aggregate the governth out those ls-in order total spend~cessions as nd manage~tary policy. xpenditures
volume of ied in detail ted at influd more genThis in turn . Chapters 9 0 money and
1ctive poten·s worked by labour, and
esources are ~ ct an econo-
su pply-side t to increase 11 as its overabout reduc~d inefficien~ importance as the result Jps. It is also ~sources into :y-designed )mies-occu-Chapter 18
r the govern.e economic
CHAPTER 1 WHAT IS MACROECONOMICS? 21
1.6 The Methodology of Macroeconomics
1.6.1 What is to be Explained?
Macroeconomics is concerned with aggregate activity, the level of unemployment, interest rates, inflation, wages, the exchange rate, and the trade in goods , services and assets with other countries. Before beginning to think about these questions, it is essential to be clear about what we want to explain and what we take as given, or outside the realm of analysis. The variables to be explained using economic principles are called endogenous
variables. The other variables-those we do not try to explain-are called exogenous variables. This distinction is represented in Figure 1.10. Examples of variables often considered exogenous are policy instruments (the tools of fiscal and monetary policies), economic conditions abroad (foreign levels of activity and interest rates), the price of oil, and sometimes even domestic social conditions such as business optimism or trade union militancy.
The distinction between endogenous and exogenous variables is necessarily arbitrary. Many exogenous variables are not strictly independent of the endogenous variables. In fact, the book progresses in steps. Many variables initially are considered exoge-
Exogenous variables """
t Endogenous variables
Fig. 1.10 Endogenous and Exogenous Variables
Endogenous variables are the object of analysis in an
economic model. Exogenous variables are determined
outside the economic model. The weather and political
decisions are examples of variables generally considered
to be exogenous.
nous and then progressively made endogenous, or endogenized. For example, fiscal and monetary policy decisions are often responses to the course of inflation or unemployment. While it is convenient to regard policy variables as exogenous, it is sometimes interesting and useful to understand how these exogenous variables themselves are determined. For example, we will often treat monetary policy as a systematic response to economic conditions.
1.6.2 Theory and Realism
Macroeconomics proceeds by making simplifying assumptions. We never literally believe in our assumptions, but we need them in order to see through the vast complexity of an economy. This is why the distinction between endogenous and exogenous variables is artificial. Truly exogenous variables are rare. Earthquakes are truly exogenous but what about climatic conditions or scientific discoveries and inventions? The task of systematically linking the behaviour of endogenous variables to changes in exogenous variables is accomplished by specifying relationships between all the variables of interest. You might say that economics-and in particular macroeconomics-is in the business of establishing relationships involving causality.
All these relationships, when brought together, constitute a theory. Almost by definition, in social sciences, theory must be an abstraction, an intentional departure from realism. If the real world could be understood without simplifying assumptions, theories would be unnecessary. The problem is not with economics, but rather with the world's inherent complexity. Karl Marx, who was no friend of conventional political economy, seemed to hit it on the head:
The body in its entirety is easier to study than are the cells of that body. In the analysis of economic forms, moreover, neither microscopes nor chemical reagents are of use. The force of abstraction must replace both. ((1867} Foreword to Volume I, Das Kapital)

22 PART I INTRODUCTION TO MACROECONOMICS
Progress is made by weeding out those assumptions and theories that lead us to false conclusions. As time passes, some theories prove to be unfounded, while others gain acceptability. This process is long and complex, and far from complete. Because macroeconomics is a young discipline, a number of controversies continue, and this aspect is discussed in Section 1.7.
1.6.3 Positive and Normative Analysis
Macroeconomic analysis and policy are closely linked. Because a number of exogenous variables are under the control of government, it makes sense to ask what is good and what is bad policy. At its best, macroeconomics can explain the economy. For example, it can link particular events to exogenous events or policy decisions. This is positive eco
nomics: it refrains from value judgements. Normative
economics takes a further step and passes judgement or makes policy recommendations. In so doing, it must specify what criteria are used in arriving at particular conclusions. This inevitably implies a value judgement. Economists generally like to make policy recommendations. As long as they are truthful about their own preferences and reveal their criteria, this is part of their professional activity. In this textbook, we will generally refrain from normative economic analysis.6 At the same time, we believe and hope that many readers will make use of their newly acquired knowledge to indulge in the normative side of macroeconomics: this is what makes it fun.
1.6.4 Testing Theories: The Role of Data
The generally accepted way of evaluating theories is to subject them to scientific testing. In macroeconomics, this means looking at the facts, i.e. at data. This is easier said than done, and there are a number of unusual difficulties. First, data often correspond to elusive concepts, as Chapter 2 will show. Second, constructing aggregate data implies enquiring into the behaviour of millions of individuals, who sometimes have good or bad reasons
6 Many are motivated by 'social conscience' to study economics. Much like idealistic health professionals who want to cure the sick, economists can also be interested in ways to provide relief to the disadvantaged and suffering.
to misrepresent the truth. Third, economics shares a predicament common to other social sciences: experimentation is not really possible-when observed, people often change their behaviour. Not only is it possibly immoral-no macroeconomist would wish to start a hyperinflation just to test a theory-but more crucially, many important variables simply are not observable. This is the case of people's expectations of the future, for example. Macroeconomists are forced to conduct empirical tests with the data that they have. They develop statistical techniques, often sophisticated ones, to deal with observation and measurement errors. They refine their techniques for gathering and analysing data. This allows the elimination of inadequate theories and the modification of others. The surviving theories will be those that withstand the test of time in this scientific process.
1.6.5 Macroeconomic Modelling and Forecasting
Economists are frequently asked to make forecasts. Governments, international organizations, and large financial institutions employ large teams of economists to prepare them. If macroeconomics were to be judged by the performance of forecasts, the verdict would not be unkind. However, the respectable track record of forecasters has been sullied by some large historical errors. Box 1.3 illustrates this fact by examining the accuracy of forecasts, after the fact, for the disastrous crisis years 2009 and 2010.
There are several reasons why economic forecasting is inherently difficult. First, even an excellent understanding of an economy's structure-how its endogenous variables interactcan fall victim to unexpected changes in exogenous variables. Good examples of this are the oil price increases of 1973 and 2000, their fall in 2015-2016, the high-tech crash of 2001 and, of course, the latest crisis. Second, expectationswhich are volatile in nature-wield an important influence over the economy. Governments sometimes react to their own forecasts by implementing policies designed to prevent those forecasts from happening. Political changes occur quickly and can disrupt the economic environment. Finally, it takes time-often several months-to

omics shares :ial sciences: ;sible-when ~haviour. Not :roeconomist just to test a 1portant variis the case of for example. Jct empirical lhey develop ated ones, to ment errors. ring and anaion of inade,f others. The vithstand the
~
ake forecasts. )ns, and large lffiS of econo-1mics were to :asts, the verte respectable llied by some es this fact by l.fter the fact, 2010. onomic fore·st, even an 1omy's struc~s interact~es in exoge.is are the oil their fall in 2001 and, of :pectationsm important ments somer implementose forecasts >ccur quickly ~nvironment.
. months-to
Forecasting the Crisis Years
Economic forecasts can be wrong, and often spectacularly
so. Table 1.3 presents a few examples about the crisis years.
The collapse of the investment bank Lehman Brothers in
September 2008 triggered banking crises in the US and
Europe. The result was a deep, unforeseeable recession in
2009. Determined action by governments and central banks
often limited the recession to just one year. The table shows
how forecasts of GDP growth have changed over time. We
use the forecasts published every six months by the
Organisation for Economic Co-operation and Development
(OECD), an organization of industrialized countries. These
forecasts usually reflect the consensus of professional public
and private forecasters. The eventual outcome is also shown.
The Year 2009
CHAPTER 1 WHAT IS MACROECONOMICSl 23
explains why the initial GDP growth forecasts, produced in
December 2007, were fairly optimistic. Six months later, in
June 2008, concern started to grow for the US and Europe,
but it was perceived that the rest of the world (here Japan
and Korea) would not be much affected. The December
2008 forecast, after the Lehman collapse, became alarmist
but, with hindsight, still much too optimistic.
TheYear2010
The initial forecasts, in December 2008, correctly expected
that the recession would only last one year; they projected
relatively modest but positive growth rates for 2010.
However, as 2009 turned out much worse than expected,
in mid-2009 forecasters became overly pessimistic and
revised downward their numbers for 2010. The last fore-
The financial crisis began in mid-2007, but was hardly casts, from December 2009, show that pessimism had
noticed and downplayed by most analysts at the time. This declined, yet they remained too pessimistic.
know what has really happened at any given point, so forecasts are always based on provisional information which becomes more precise only with time.
Most forecasts are generated by computer-based models. These models resemble those that we present in this book. They consist of hundreds, sometimes thousands, of equations. Constructing these equations is a long and difficult task. The
exogenous variables must be guessed by forecasters before they can ask their computers for an answer. This introduces many margins of error. The models can never be fully reliable, and the exogenous variables may be difficult to pinpoint. For these reasons, the forecasters themselves take their results with a grain of salt, and often, when the outcome is not completely satisfactory, 'drop in' their own subjective factor to the results.
~ ----- GDP Growth Forecasts, 2009 and 2010 (%per annum)
~--- . - -
2009 France Germany Japan Korea UK USA
Forecast (Dec 2007) 2.0 1.6 1.8 5.1 2.4 2.2
Forecast (June 2008) 1.5 1.1 1.5 5.0 1.4 1.1
Forecast (Dec 2008) -0.4 -0.8 -0.1 2.7 -1.1 -0.9
Actual Outcome -2.7 -4.7 -6.3 0.3 -4.9 -2.6
2010 France Germany Japan Korea UK USA
Forecast (Dec 2008) 1.5 1.2 0.6 4.2 0.9 1.6
Forecast (June 2009) 0.2 0.2 0.7 3.5 0.0 0.9
Forecast (Dec 2009) 1.4 1.4 1.8 4.4 1.2 2.5
Actual Outcome 1.4 3.5 4.0 6.2 1.3 2.9
Source: OECD, Economic Outlook .

:O CO OMI CS
.7 Preview of the Book
1.7.1 Structure
The book proceeds in steps. Parts I-III build up an understanding of the measurement and the behaviour of the underlying economy. Part I is concerned mostly with defining terms and constructing a macroeconomic vocabulary. Part II studies the behaviour of the economy in the long run: growth and output, labour markets, and prices and exchange rates. Part III develops our understanding of macroeconomy in the short run, that is, from quarter to quarter or from year to year. This part spans many subjects, ranging from the demand of households and firms for goods and services, the financial system, the short-run determination of output, interest rates, and the exchange rate. It also extends the analysis to include the analysis of inflation, output, asset prices, and exchange rates over a longer horizon. It introduces a framework for thinking about inflation and the business cycle. Part N then uses this framework to explore policy issues facing governments: demand management, fiscal policy, and macroeconomic policies designed to enhance long-run performance. The book concludes with an extensive look at the world international financial system, and the current state of economic thought.
1.7.2 Controversies and Consensus
Economists often make a bad name for themselves by quarrelling in public. Visible disagreements among economists frequently have to do with finer points, if not outright hair-splitting. This discourse is intellectually healthy, but misleading to outside observers, whose opinions are often based on accounts in the popular press and who are more apt to recall sensational talk-show appearances rather than sober analysis of theory and data. It is unfortunate that many disagreements have important policy implications. Perhaps as a result, politicians often see economics as a sort of debating event, with economists acting as advocates for one
particular ideology or another, and may even abuse economists ' opinions to get a stamp of approval for a particular policy.
In this textbook we do not shy away from presenting some of the most important disagreements among economists, leaving the reader free to judge. Yet we do not dwell upon these controversies either, choosing to focus rather on the common ground. Because there is so much that is not controversial, it is best first to understand the broad areas of consensus. Box 1.4 provides more details.
1.7.3 Rigour and Intuit ion
The only possible scientific approach to the complexities of the real world is to employ the rigour of reasoning. However, to be useful, macroeconomics must be versatile and easily put to work when we want to understand particular events. This is why a great deal of macroeconomics amounts to the organized accumulation of intuition about particular phenomena. Our objective is, therefore, to leave readers with a natural understanding of how the economy functions. We do this by trying to draw robust yet simple conclusions from the various and often intricate principles presented. Such intuition is never completely rigorous, but can be useful in practice. Rigour plays a crucial role in telling us when our intuition is correct, and when it is leading us astray.
1.7.4 Data and Institutions
Macroeconomics is fascinating because it tells us a great deal about the world in which we live. It is not merely a set of abstract principles with interesting logical properties. Some theories will look odd at first sight, yet they capture key aspects of the real world. This is why at each important step we pause to look at facts . Facts can be data or particular episodes. Studying them carefully shows how theories work and shape our understanding of
Almost from i1 divided into t
their neo-Keyn~
etarists) contin1
of the marketpl
are more likel~
fectly and that~
policy actively t
reject this view,
cracies as barrie
omy away from
failures, which t
mportance. Gi~
ries and data to
These labels
sometimes ma<
economists. Sal·
croeconomi1 owledge of i
- e lives of mil On the other e for more r
onstrating ely togethe1
ca es the othe t:a e economic _ r economics i
suggested re< means meai:
rant to learn n • macroeconor Finally, good der different
;:-espo nse of difii - often shaped ~litical institu
The term 'moner; signalling their 0 1
as the sole cause ,

r even abuse approval for
1y from pre:agreements der free to e controverm the com-1 that is not erstand the )Vides more
to the comthe rigour of :oeconomics rk when we lhis is why a ; to the orga-1t particular >re, to leave of how the
ring to draw : various and 1ch intuition be useful in [n telling us en it is lead-
e it tells us a we live. It is v:ith interestv:ill look odd :pects of the tant step we :a or particu. shows how rstanding of
CHAPTER 1 WHAT IS MACROECONOMICS? 2 5
Macroeconomic Schools of Thought: A Primer
Almost from its beginning, macroeconomics has been
divided into two main schools of thought. Keynesians (and
their neo-Keynesian heirs) and monetarists (and neo-mon
etarists) continue to pursue the old debate about the role
of the marketplace and government in society. Keynesians
are more likely to believe that markets function imper
fectly and that governments can and should use economic
policy actively to combat recessions. Monetarists7 tend to
reject this view, seeing politics and the power of bureau
cracies as barriers to government efforts to steer the econ
omy away from business cycles and more generally market
failures, which they see as either unavoidable or of lesser
importance. Given these premises, each school uses theo
ries and data to build and support its case.
These labels are not exclusive. In the USA reference is
located on the two US seaboards (Harvard, MIT, Yale,
Stanford, Berkeley) and tend to defend the Keynesian leg
acy. Freshwater economists are more frequently associated
with monetarism and laissez-faire; they hail from universi
ties located nearthe Great Lakes, e.g. Chicago, Rochester, or
Minnesota. In Europe, similar controversies characterize
national, and increasingly European, debates. National tra
ditions tend to make British and French economists more
Keynesian, while German or Swedish economists are more
monetarist. Dutch, Italian, and Spanish economists are hard
to classify, having as many exceptions as examples for any
rule. In recent years, the differences have tended to dimin
ish, both among researchers and policy-makers and a syn
thesis was in sight. When the Great Recession came, a
predictable new polarization emerged of views on theory
sometimes made to saltwater versus freshwater macro- and policy, as many economists mixed normative and posi-
economists. Saltwater economists come from universities tive aspects in their public pronouncements.
macroeconomic phenomena. It broadens our knowledge of important events that have shaped the lives of millions of people.
On the other hand, a graph or a table is no substitute for more rigorous analysis of the data. Merely demonstrating that two economic variables move closely together is a far cry from proving that one causes the other. Our motive in using data to illustrate economic phenomena is to give readers a feel for economics itself. On our website we offer a list of suggested reading for each chapter-which is by no means meant to be exhaustive-for those who want to learn more about the theory and practice of macroeconomics.
Finally, good economic theories must be valid under different conditions. At the same time, the response of different countries to economic shocks is often shaped by their particular economic and political institutions. These include their form of
7 The term 'monetarist ' derives from the Latin 'moneta'
signalling their original emphasis on excess money growth as the sole cause of inflation. Now the term is sometimes
government, the roles oflabour unions and employers' associations, and regulations. The interplay of macroeconomic principles and institutions is an essential part of a proper understanding of the field, and this is why we spend a lot of time reviewing them. The economics of these institutions is, however, far beyond the level of this textbook.
1.7.5 Europe
Our textbook bears the subtitle 'A European Text'. Does this mean that we think that macroeconomics in Europe is fundamentally different from macroeconomics in the USA, Asia, or Latin America? Most certainly not! To the contrary, we take the view that macroeconomics is sufficiently global in scope to apply to economies around the world. On the other hand, we do wish to send a more subtle signal: we believe strongly that European economies have important distinguishing features that
applied to those who advocate unregulated markets and criticize government intervention at both the microeconomic and the macroeconomic level.

26 PART I INTRODUCTION TO MACRO ECO NOMICS
make them hard to study through the lens of, say, the leading textbooks from North America.
There is much in Europe that warrants such a European emphasis. Rather than a collection of states under a federal government, Europe is a mosaic of nation-states, each with a sovereign macroeconomic policy-maker, but also with distinct preferences and endowments. The completion of the Single European Market, the creation of a monetary union, and the significant enlargement of the European Union increase the pres-
~ Key Concepts
• exchange rate
• macroeconomics
• business cycle
•trend
• gross domestic product (GDP)
• unemployment. unemployment rate
• labour force
•labour
•capital
• factors of production
• labour share
•index
• inflation
• hyperinflation
• capacity utilization
• procydical and countercyclical
• real economy, monetary economy
•openness
sure towards integration, ra1smg specific new challenges along the way. To varying degrees, European countries also share a common view of the relationship between market forces and social justice. The attachment to fairness and economic solidarity is deeply ingrained in Europe's traditions and history, which explain why her labour markets differ so much from those in the USA. This observation alone warrants a markedly different perspective, even if the underlying theory is the same.
• globalization
• logarithmic scale
• economic growth
• outputgap
• Bums-Mitchell diagram
• laissez-faire versus interventionism
• aggregate demand management
• supply side
• price level
• coordination failures
• demand side
• economic agents
• fiscal policy
• monetary policy
• endogenous
•exogenous
• positive and normative economics
Students can !' economic sect cations with t prejudices) an The Economist. '. on the intern1 read in Wikipi
Data are pn tutes and cent tutions prodrn

specific new 'ing degrees, Lmon view of :es and social nd economic urope's trad-1y her labour in the USA.
narkedly difrlying theory
Students can greatly benefit from reading daily the economic section of their newspaper. Some publications with high-quality analyses (but not free of prejudices) are (in English): the Financial Times and The Economist. There is also a wealth of information on the internet, but don't believe everything you read in Wikipedia!
Data are produced by national statistical institutes and central banks. Some international institutions produce comparable data and are of easy
CHAPTER 1 WHAT IS MACROECONOMICS? 27
access : the IMF's International Financial Statistics and its biannual survey World Economic Outlook, the OECD's biannual Economic Outlook, the World Bank's World Development Report and Global Economic Prospects, the European Commission's European Economy, and the European Bank for Reconstruction and Development's annual Transition Report. All maintain websites, more or less generous in allowing access to their data and publications.