Study of scarcity and choice. People, firms, and governments make choices because of scarcity.
date post
19-Dec-2015Category
view
218download
3
What is Economi
cs?

The study of choice under the conditions of scarcity.
• Microeconomics-study of the behavior and decision making by small units such as individuals and businesses.
• Macroeconomics-study of the behavior and decision making of large units such as governments.
What is Economics?


Scarcity and Shortage
Scarcity~ The concept that there are limited resources for unlimited wants
Shortage~ A condition that occurs when producers will not or cannot offer goods and services at the current price.
What is the difference between scarcity and shortage?

FOP ACTIVITYIn small groups you will complete the following:
PART I
Terms and Concepts
1. Definition of the term factors of production
2. List and define the “four” factors of production
PART II
Scavenger Hunt
3. Take four index cards. Label them with each of the FOP
4. Walk around and find examples of each in the creation of “education”.

Chapter 1, Section 2:“Choosing is Refusing”Trade-offs- All the alternatives that we give up
whenever we choose one course of action over another. – Individuals– Businesses– Governments
Opportunity Cost- The most desirable alternative given up as the result of a decision. The next best thing!!
Thinking at the Margin- Deciding whether to do or use one additional unit of some resource.
Discussion Topic: “There is no such thing as a free lunch.”

The Government Trade-Off: GUNS OR BUTTER?

Our Role in Funding the Government
We authorize the government, through the Constitution and elected officials, to raise money through taxes.– Must originate in the House (Ways and Means)– House-Senate-President
Taxation is the primary way that the government collects money.
Without revenue, or income from taxes, government would not be able to provide goods and services.

Power and Limits of Taxation
The Power to Tax Article 1, Section 8, Clause 1 of the
Constitution grants Congress the power to tax.
The Sixteenth Amendment (introduced 1909, ratified 1913) gives Congress the power to levy an income tax.
Great Depression Social Security Act (1935) and the
Internal Revenue Service (IRS)– Administrative agency of the Dept.
of Treasury– Headquarters in DC, 7 regional
offices– Main functions are to collect
income taxes and enforce tax laws WWII
Limits on the Power to Tax1. The purpose of the
tax must be for “the common defense and general welfare.”
2. Federal taxes must be the same in every state.
3. The government may not tax exports.

Tax Activity
Person A (Low-Income)- $15,000 Person B (Middle-Income)- $75,000 Person C (High-Income)- $225,000
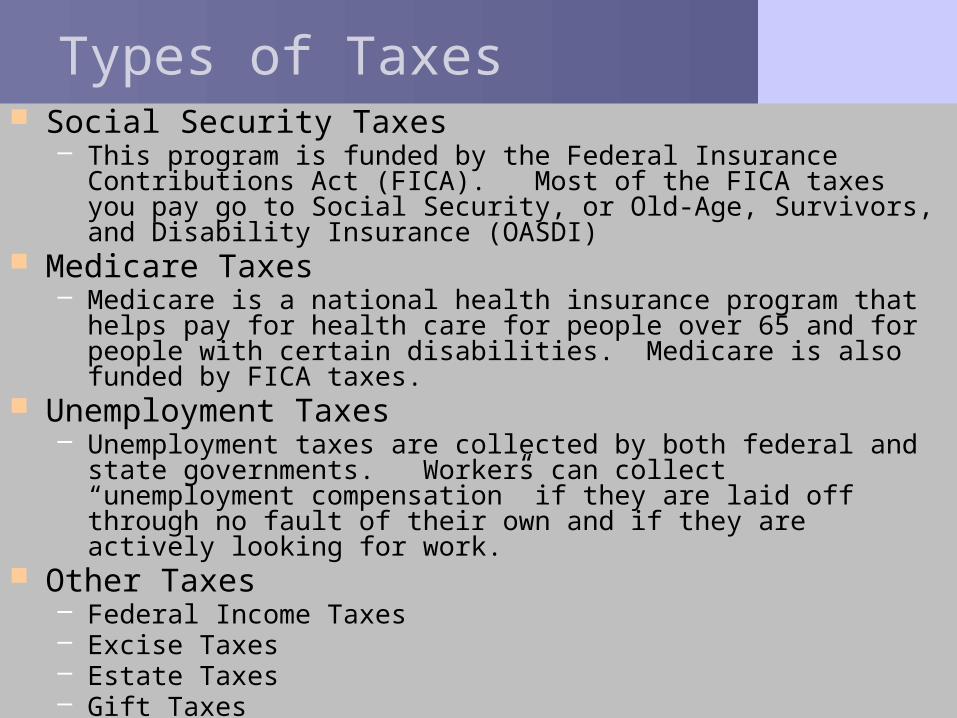
Types of Taxes Social Security Taxes
– This program is funded by the Federal Insurance Contributions Act (FICA). Most of the FICA taxes you pay go to Social Security, or Old-Age, Survivors, and Disability Insurance (OASDI)
Medicare Taxes– Medicare is a national health insurance program that helps pay
for health care for people over 65 and for people with certain disabilities. Medicare is also funded by FICA taxes.
Unemployment Taxes– Unemployment taxes are collected by both federal and state
governments. Workers can collect “unemployment compensation” if they are laid off through no fault of their own and if they are actively looking for work.
Other Taxes – Federal Income Taxes– Excise Taxes– Estate Taxes– Gift Taxes– Import Taxes

Tax Structures
Proportional Taxes– A proportional tax is a tax for which the
percentage of income paid in taxes remains the same for all income levels.
Progressive Taxes– A progressive tax is a tax for which the percent
of income paid in taxes increases as income increases.
Regressive Taxes– A regressive tax is a tax for which the
percentage of income paid in taxes decreases as income increases.

What is a “good” tax?
– Simplicity Tax laws should be simple and easily understood.
– Economy Government administrators should be able to collect
taxes without spending too much time or money.– Certainty
It should be clear to the taxpayer when the tax is due, how much is due, and how it should be paid.
– Equity The tax system should be fair, so that no one bears
too much or too little of the tax burden.

How the Money Comes In: Revenue
Total Revenue: $2.57 Trillion
14%4% 3%
45%
34%
Individual Income Taxes Social Insurance Payroll Taxes
Corporate Income Taxes Excise Taxes
Other Taxes

Federal Spending: “Guns or Butter”
The Politics of Tax and Spend
Obama Defends Budget
FY 2010 Introduced
Hannity on the Budget
Zinn on US
Militarism
Ron Paul on Government Spending

Spending Categories
Mandatory Spending Money that lawmakers are
required by law to spend Interest payments on the
national debt “Entitlement” programs
(Social Security, Medicare and Medicaid)
Makes up almost 2/3 of federal budget
Problem because Congress and the President cannot control much of spending.
Discretionary SpendingMoney that government planners can choose how to spend.
Defense EducationTrainingEnvironmental cleanupNational parks and monumentsScientific research

Conference Committee Meets to Resolve
Differences
The Appropriations Process
House Senate
Sent to the Floor
Full Committee Approves
Sent to the Floor
Appropriation Subcommittee Reports a Bill
Full Committee Approves
Appropriation Subcommittee Reports a Bill
Sent to President

Where the Money Goes: Spending
Total Spending: $2.73 Trillion
7%
11%
9%
22%
16%
21%14%
Social Security MedicareMedicaid & SCHIP Other MandatoryNet Interest Security DiscretionaryNon-Security Discretionary
Total Spending: $2.73 Trillion
53%
9%
22%
16%
Mandatory Net Interest
Security Discretionary Non-Security Discretionary


Guns or Butter?
Analyze the federal spending pie chart on page 371. Consider the difference between mandatory and
discretionary spending as described on pages 371-374. Create your own federal spending pie chart based on
your priorities. You may not “leave it the same”…think critically about what you think is the best way to spend our tax dollars!
Explain the rationale for your spending choices. Present your poster and defend your choices.

Production Possibilities Graph: A graph that shows alternativeways to use an economy’s resources. The graph can only considertwo items at once and these items are each placed on an axis.
Chapter 1, Section 3: Production Possibility Graphs
Production Possibilities Frontier: The line on a productionpossibilities graph that shows an economy’s maximum possibleoutput of any two products.

What can we learn from looking at a Production
Possibilities Graph/Frontier?· Trade-Offs/Cost- Alternative
given up as a result of a decision. Every point on the PPF indicates a cost in on item or another.
· Efficiency- Making the best possible use of resources (any point on the PPF)
· Underutilization/Inefficiency- Misuse or waste of resources (any point inside the PPF)
· Growth- Expanding an economy’s ability to produce (shift of the entire curve to the right or any point to the right of the PPF)
~New Technology/ Innovation
~Increase in Resources