What is Economics Section 1 Scarcity and the Factors of Production.
36
What is Economics Section 1 Scarcity and the Factors of Production
-
Upload
cori-fletcher -
Category
Documents
-
view
222 -
download
0
Transcript of What is Economics Section 1 Scarcity and the Factors of Production.

What is Economics
Section 1Scarcity and the
Factors of Production

Section 1 Objectives
• Explain why scarcity is a problem that forces us to make choices.
• Identify land, labor, and capital as the three factors of production.
• Explain the role of entrepreneurs in our economic system.

Unlimited Wants and Needs• People cannot have everything
they need and want.• Needs are things like air, food, or
shelter that is necessary for survival.
• Wants are items that we desire but that is not essential to survival.

Unlimited Wants and Needs• https://www.youtube.com/watc
h?v=aq6xk9ahMnI
Choices
• Economics is a study of choices people make in satisfying their wants and needs.
• People have to make these choices because of scarcity.
• Scarcity is limited quantities of resources to meet unlimited wants and needs.
Scarcity is the
all societies face today.
fundamental economic problem

Scarcity Vs Shortages• Scarcity always exists because our
needs and wants are always greater than our resource supply.
• Shortages occur when producers will not or cannot supply enough goods or services at the current prices to meet consumer demand.

Categories of Scarce Resources
• Economists call these productive resources that are used to make all goods and services the factors of production.
• They are grouped into three categories: land, labor, and capital.
Land
• All natural resources used to produce goods and services.
• They include fertile land for farming and products that are in or on the land, such as coal, water, and forests.

Labor
• Is the effort that a person devotes to a task for which that person is paid.
• Can be physical (ditch digger) or mental (software designer)
Capital
• Any human made resource that is used to produce other goods and services.
• The two categories of capital are physical and human capital.
Physical Capital
• Includes tools, factories, and equipment.
• Saves businesses time and money.

Human Capital
• The knowledge and skills a worker gains through education and experience.
• Human capital can be increased by training and education.
Entrepreneurs
• Ambitious leaders who decide how to combine land, labor, and capital resources to bring goods and services to consumers
• They take risks to develop ideas, start businesses, create new industries, and fuel economic growth.
Chapter 1What is Economics?
Section 2Choices,Trade Offs and
Opportunity Cost

Section 2 Objectives
• Describe why every decision when making choices involves trade-offs
• Explain the concept of opportunity cost.
Trade-Offs
• Trade-offs are all the alternatives that we give up whenever we choose one course of action over another.
• What alternatives did you give up to be at school today??
Trade-Offs
• All individuals, businesses, and societies make decisions that involve trade-offs.

Individuals and Trade-Offs
• An individual who chooses to spend more time at work has less leisure time, study time, and sleep time.
Businesses and Trade-Offs
• A furniture manufacturer who decides to use more of it’s factors of production to build chairs has less to devote to building tables, couches, or desks.

Societies and Trade-Offs
• A country that decides to produce more capital goods (“guns”) has fewer factors of production to devote to consumer goods (“butter”)

Choices and Costs
• When choices are made, you incur a cost.
• It may be a cost in resources, time, or money.
Choices and Costs
• The most desirable trade off given up as the result of a decision is called the opportunity cost.
• There are many tradeoffs, but only 1 opportunity cost.

Choices and Costs
• Create a list of 5 alternatives you have available to you once you get out of high school.
• Rank them in order from the most important or attractive to you to the least important or attractive

Chapter 1What is Economics?
Section 3Productions Possibilities
Curves

Section 3 Objectives
• Understand what the Production Possibilities Curve (PPC) represents.
• Draw and interpret a PPC.• Demonstrate how PPCs show
efficiency, underutilization, growth, and opportunity cost.

What the PPC Shows
• The Production Possibilities Curve is an economic model that represents– Scarcity and Trade offs, alternative ways to use an
economy’s limited resources.– opportunity costs (increasing)– Efficiency– Underutilization – Economic growth
Step 1 in Drawing a PPC
• Decide what two products to produce: watermelons and shoes

Two products to produce
Watermelons (millions of tons)
Shoes(millions of pairs)
Sh
oe
s (
mil
lio
ns
of
pa
irs
)
25
20
15
10
5
0 252015105
Production Possibilities Graph
Watermelons (millions of tons)

Step 2 in Drawing a PPC
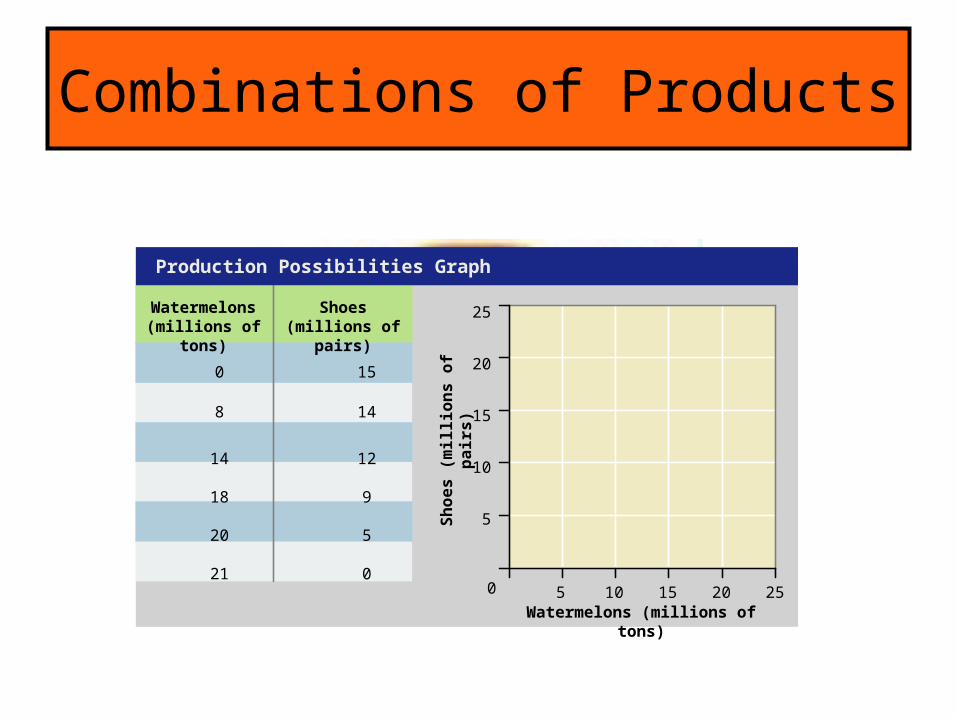
• Identify different combinations of the two products that can be produced with the available factors of production.
14
18
20
21
12
9
5
0
8 14
0 15
Combinations of Products
Watermelons (millions of tons)
Shoes(millions of pairs)
Sh
oe
s (
mil
lio
ns
of
pa
irs
)
25
20
15
10
5
0 252015105
Production Possibilities Graph
Watermelons (millions of tons)
14
18
20
21
12
9
5
0
8 14
0 15
Step 3 in Drawing a PPC
• Plot these combinations of the two products produced on the graph and connect them with a line.

Production Possibilities Frontier
14
18
20
21
12
9
5
0
8 14
0 15
Watermelons (millions of tons)
Shoes(millions of pairs)
Sh
oe
s (
mil
lio
ns
of
pa
irs
)
25
20
15
10
5
0 252015105
Production Possibilities Graph
Watermelons (millions of tons)
14
18
20
21
1
12
9
5
0
8 14
0 15
The production
possibilities frontier
c (14,12)
d (18,9)
e (20,5)
f (21,0)
8 14b (8,14)
c (14,12)
d (18,9)
e (20,5)
f (21,0)
b (8,14)a (0,15)

Sh
oe
s (
mil
lio
ns
of
pa
irs
)
25
20
15
10
5
0 252015105
Watermelons (millions of tons)
Production Possibilities Graph• Using resources in a way as to maximize the production of goods and services. (producing on the production possibilities frontier )
c (14,12)
d (18,9)
e (20,5)
f (21,0)
a (0,15)b (8,14)
Efficiency

• Economy is operating inefficiently and is underutilizing available resources (Producing underneath the production possibilities frontier)
Underutilization
Sh
oe
s (
mil
lio
ns
of
pa
irs
)
25
20
15
10
5
0 252015105
Watermelons (millions of tons)
Production Possibilities Graph
g (8,10)
A point of underutilization
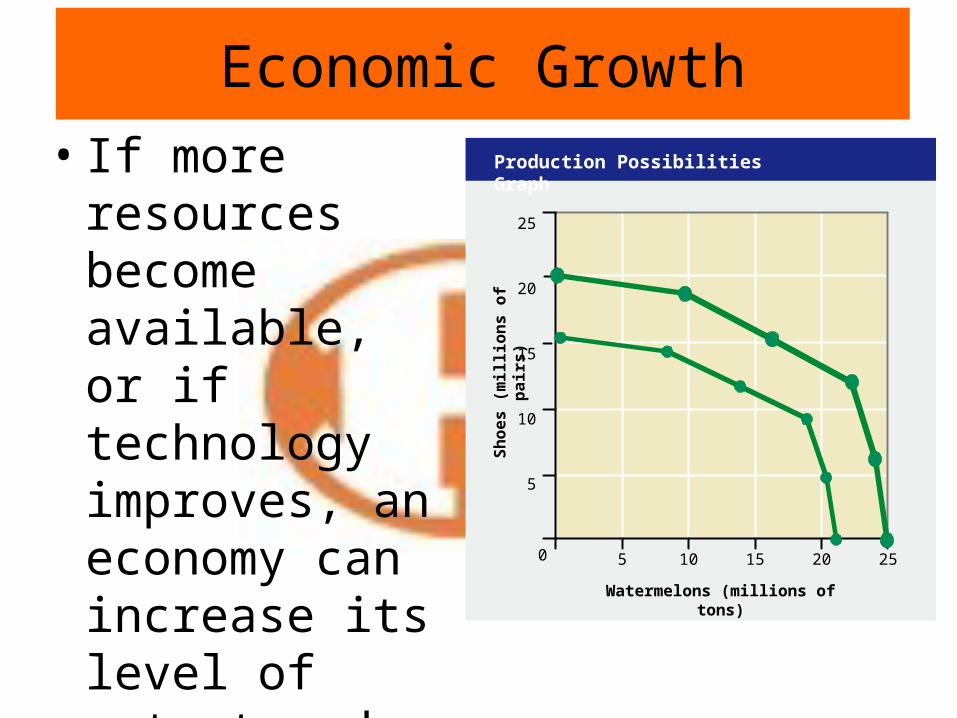
Economic Growth• If more resources
become available, or if technology improves, an economy can increase its level of output and grow (Producing beyond previous maximum)
Sh
oe
s (
mil
lio
ns
of
pa
irs
)
25
20
15
10
5
0 252015105
Watermelons (millions of tons)
Production Possibilities Graph