What is best? 20oz popcorn for $4.50 or 32 oz popcorn for $7.00 ? $ 4.50 / 20 = $0.225 per oz so...
20
What is best? 20oz popcorn for $4.50 or 32 oz popcorn for $7.00 ? $4.50 / 20 = $0.225 per oz so $0.23 Here is the Unit Cost: 0 / 32 = $0.21875 per oz so $0.22 So the lowest Unit Price (and the best bargain) is 32oz for $7.00 Bell Work
-
Upload
darcy-sims -
Category
Documents
-
view
218 -
download
0
Transcript of What is best? 20oz popcorn for $4.50 or 32 oz popcorn for $7.00 ? $ 4.50 / 20 = $0.225 per oz so...

What is best?
20oz popcorn for $4.50 or 32 oz popcorn for $7.00 ?
$4.50 / 20 = $0.225 per oz so $0.23
Here is the Unit Cost:
$7.00 / 32 = $0.21875 per oz so $0.22
So the lowest Unit Price (and the best bargain) is 32oz for $7.00
Bell Work
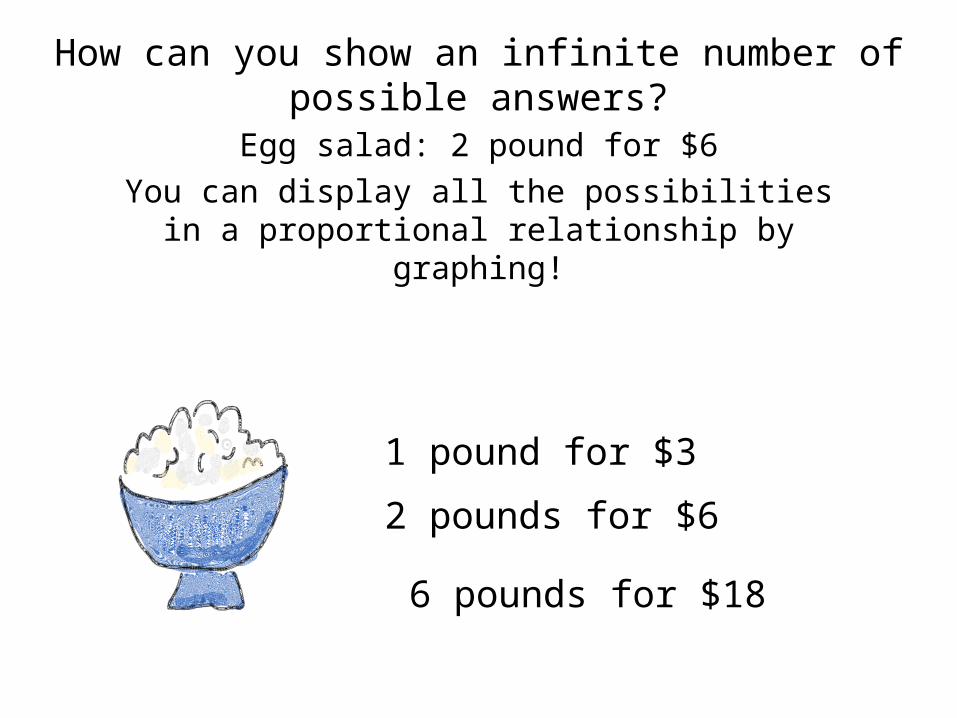
How can you show an infinite number of possible answers?
Egg salad: 2 pound for $6
You can display all the possibilities in a proportional relationship by graphing!
1 pound for $5
2 pounds for $6
20 pounds for $100
1 pound for $3
6 pounds for $18

Let’s Review
Core Lesson
2 pounds for $6Weight
(lb.)Cost ($)
2
4
6
6
12
18

Let’s Review
Core Lesson
Weight (lb.)(x)
Cost ($)(y)
2
4
6
6
12
18
Weight (lb.)
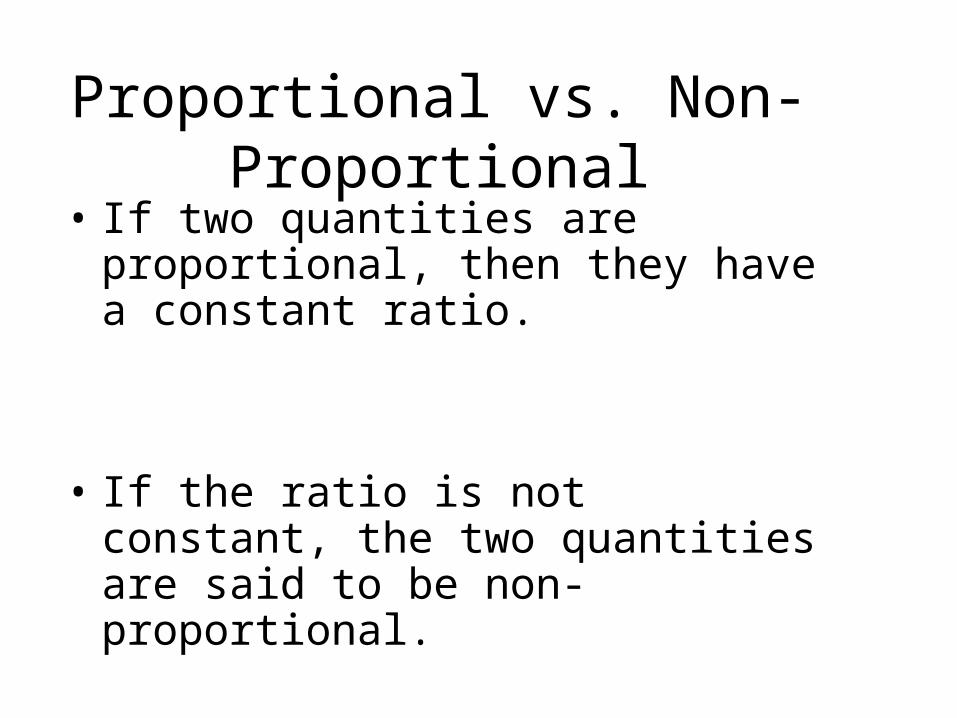
Proportional vs. Non-Proportional• If two quantities are proportional, then
they have a constant ratio.
• If the ratio is not constant, the two quantities are said to be non-proportional.

Proportional Relationships• Will always go through the origin on a graph.
(0,0)• Graph will always be a straight line.• Always write the constant ratio in the form of
• Reduce or divide to find the constant ratio.
y
x

In order to tell if a graph is proportional the line must go through the origin.
Tell if the following graphs represent a proportional relationships.
1 2 3 4 5
1
2
3
4
5
x
y
1 2 3 4 5
1
2
3
4
5
x
y
Proportional ? _________ Proportional ? _________
Why?Line goes thru the origin
Why? Line does notgo thru the origin
Yes No
Let’s Review
Core Lesson
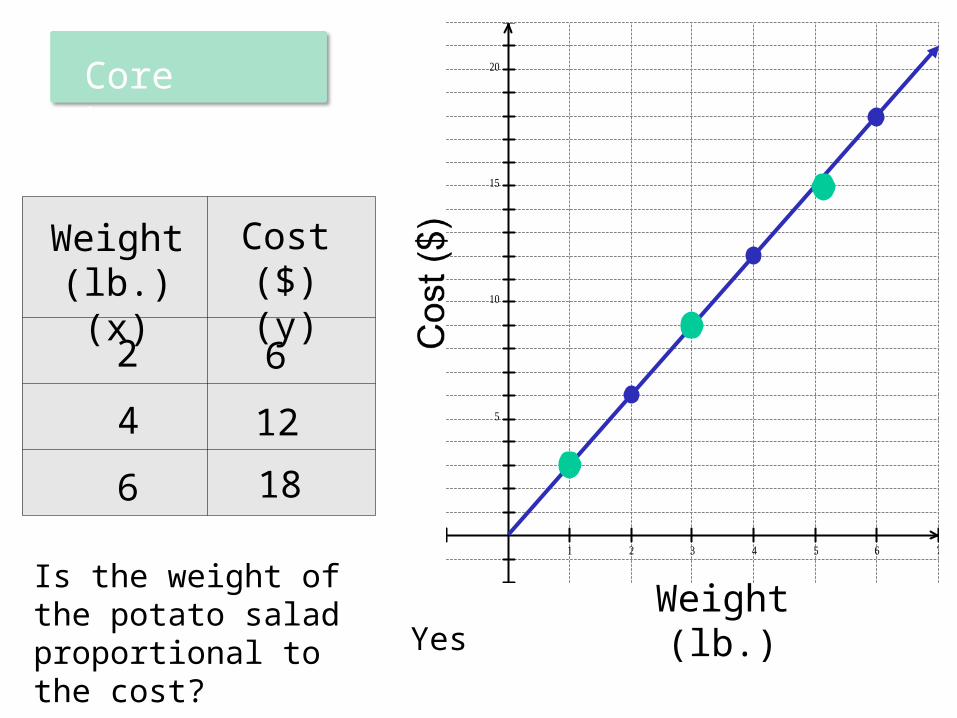
Weight (lb.)(x)
Cost ($)(y)
2
4
6
6
12
18
Weight (lb.)Is the weight of the potato salad proportional to the cost? Yes

Let’s Review
Core Lesson
Time (hr.)
Graph the proportional relationship “45 miles in 3 hours.”
Time (hr.)(x)
Distance (mi.)
(y)453
1 15
2 30
Is the time proportional to the distance driven? Yes
Let’s ReviewGuided Practice
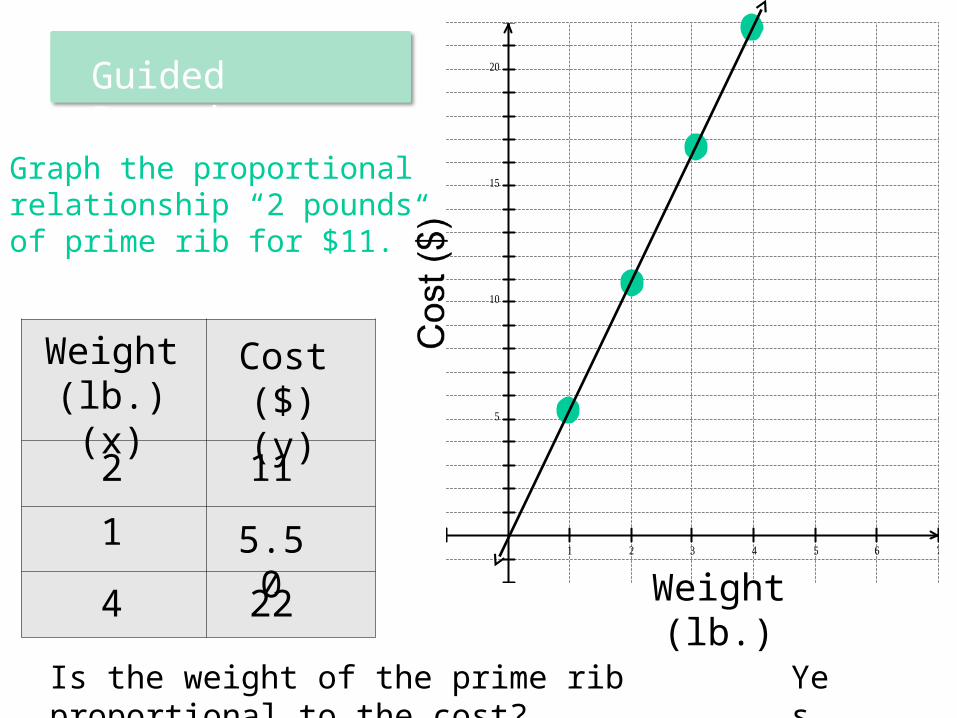
Graph the proportional relationship “2 pounds of prime rib for $11.”
Weight (lb.)
Weight (lb.)(x)
Cost ($)(y)
112
1 5.504 22
Is the weight of the prime rib proportional to the cost? Yes
Let’s ReviewGuided Practice
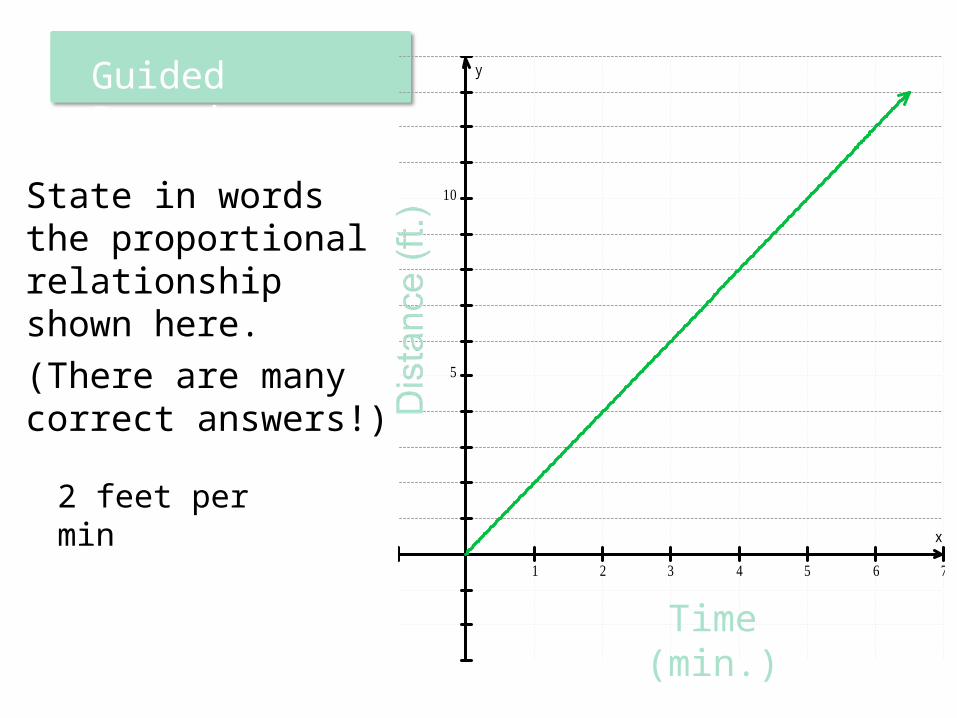
State in words the proportional relationship shown here.(There are many correct answers!)
x
y
Time (min.)
2 feet per min

Let’s ReviewExtension Activities
Graph “a loss of 2 dollars per day.” Discuss why the graph is in the fourth quadrant.
Day
Day $
1
3
5
-2
-6
-10

You try: The following chart shows how much money Alex earns for mowing lawns. Is the amount of money he earns proportional to the number of hours that he spends mowing?
Earnings ($)
Hours (h)
Unit Rate ( )
14 1
28 2
42 3
56 4
1
$14
2
$28
1
$14
3
$42
1
$14
4
$54
Since the simplified ratios were equal, this was a proportional relationship.
hr
$
1
$14

We typically put time (hours) on the x-axis, and the earnings ($) on the y-axis.
Set up the graph paper to fit the data in the chart.
You try: Let’s graph this proportional relationship from Ex. 1 on an xy-plane.
x
y
Hours worked
Earn
ings
($
)
1
14
28
42
56
2 3 4 5
Hours (h)
Earnings ($)
Point (x, y)
1 14 (1, 14)
2 28 (2, 28)
3 42 (3, 42)
4 56 (4, 56)
Plot points (x, y) from the table.
Connect the points.
Describe the graph of this proportional relationship.

The graph of a proportional relationship:•is a straight line, AND •it passes through the origin, or point (0,0).
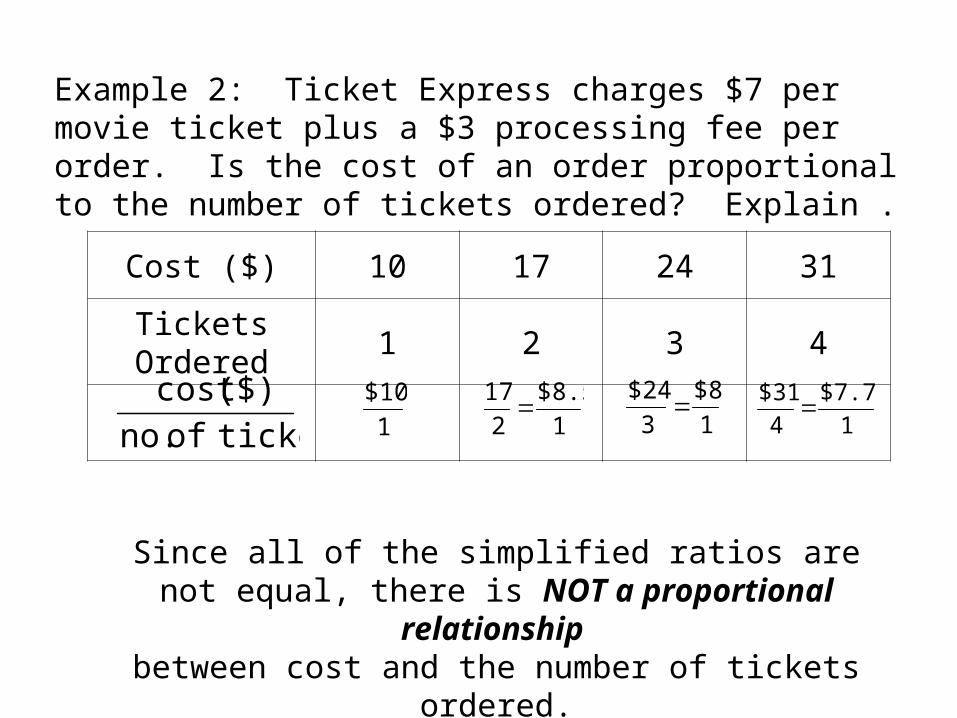
Example 2: Ticket Express charges $7 per movie ticket plus a $3 processing fee per order. Is the cost of an order proportional to the number of tickets ordered? Explain .
Cost ($) 10 17 24 31
Tickets Ordered 1 2 3 4
1
$10
ticketsof no.
($)cost 1
$8.5
2
17
1
$8
3
$24
1
$7.75
4
$31
Since all of the simplified ratios are not equal, there is NOT a proportional relationship
between cost and the number of tickets ordered.

Tickets ordered will be on the x-axis, and the cost ($) will be on the y-axis.
x
y
Tickets ordered
Cost
($)
1
4
24
32
2 3 4
Tickets
Earnings ($)
Point (x, y)
1 10 (1, 10)
2 17 (2, 17)
3 24 (3, 24)
4 31 (4, 31)
Plot points (x, y) from the table.
Connect the points.
Describe the graph of this nonproportional relationship.
Now, let’s graph this nonproportional relationship from Ex. 2.
8
12
16
20
28
This graph shows a nonproportional relationship.
It is a straight line, but it does not pass through the origin.

Let’s Review
Quick Quiz
State in words the proportional relationship shown here.(There are many correct answers!)
Weight (ounces)
You Try
5oz for $2