What is a Slope? Setsuko (Sue) Mori. Slope warning sign in Poland Slope warning sign in the...
24
What is a Slope? Setsuko (Sue) Mori
-
Upload
clyde-chambers -
Category
Documents
-
view
213 -
download
1
Transcript of What is a Slope? Setsuko (Sue) Mori. Slope warning sign in Poland Slope warning sign in the...

What is a Slope?
Setsuko (Sue) Mori

Slope warning sign in Poland
Slope warning sign in the Netherlands
A 1371-meter distance of a railroad with a 20% slope. Czech Republic
Steam-age railway gradient post indicating a slope in both directions at Meols railway station, United Kingdom
How to describe a slope?

START RAMP
Pyramids of Dashur: The Red Pyramid (Pyramid of Sneferu)

Standards CA State Standards 6.0 Students graph a linear equation
and compute the x- and y-intercepts (e.g., graph 2x + 6y = 4). They are also able to sketch the region defined by linear inequality (e.g., they sketch the region defined by 2x + 6y < 4).
7.0 Students verify that a point lies on a line, given an equation of the line. Students are able to derive linear equations by using the point-slope formula.
8.0 Students understand the concepts of parallel lines and perpendicular lines and how those slopes are related. Students are able to find the equation of a line perpendicular to a given line that passes through a given point.
NCTM Standards Grade 6-8• use graphs to analyze the
nature of changes in quantities in linear relationships.
• explore relationships between symbolic expressions and graphs of lines, paying particular attention to the meaning of intercept and slope;
• model and solve contextualized problems using various representations, such as graphs, tables, and equations
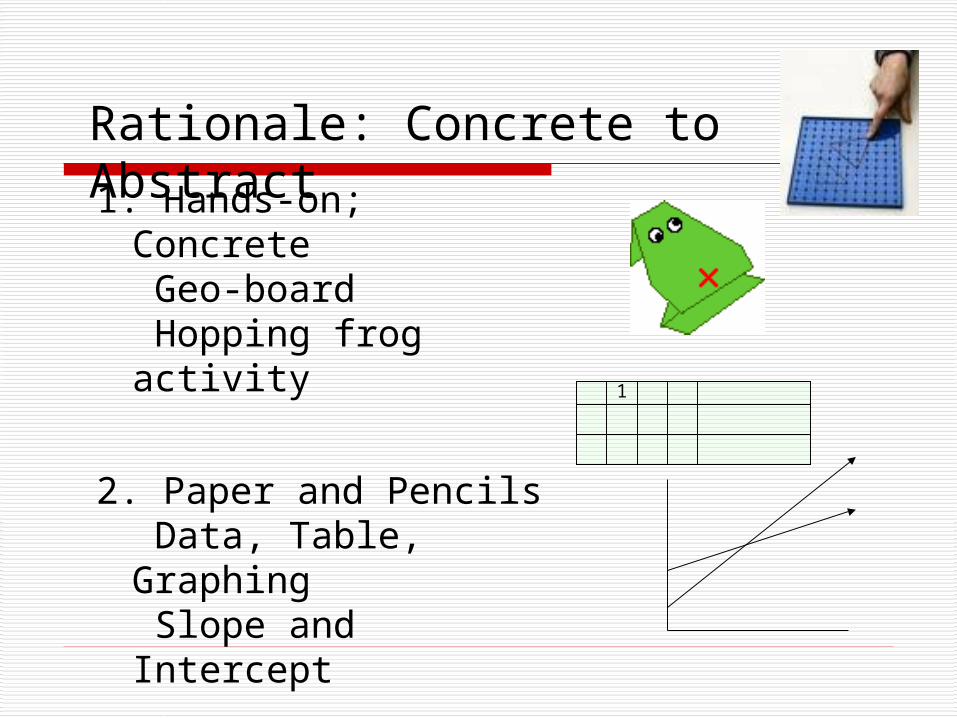
1. Hands-on; Concrete Geo-board Hopping frog activity
2. Paper and Pencils Data, Table, Graphing Slope and Intercept
3. Concepts; Abstract What is the slope Graphing Calculator
Rationale: Concrete to Abstract
1

Geoboard Objectives
Students will illustrate lines on a coordinate grid using the first quadrant.
Geoboards provide a “hands-on” approach to learning slope.
Students will form many different slopes and compare them in order to identify slope formula.

How to build a slope?
Rise 1 Run 1
Rise 2 Run 1
Rise 3 Run 1
Rise 4 Run 1
Use the Geoboard To Build These Steps
1. Use a rubber band to connect the top of each step on each stairway. Remove the stair construction and keep the straight lines.
2. Compare these steps.
3. Describe the differences in these lines.
Begin at the coordinate (0,0)

How to build a slope?
Rise -1 Run 1
Rise -2 Run 1
Rise -3 Run 1
Rise -4 Run 1
Begin at the coordinate (0,5)
1. Use a rubber band to connect the top of each step on each stairway. Remove the stair construction and keep the straight lines.
2. Describe the differences in these lines.
3. How do they compare to the previous lines?
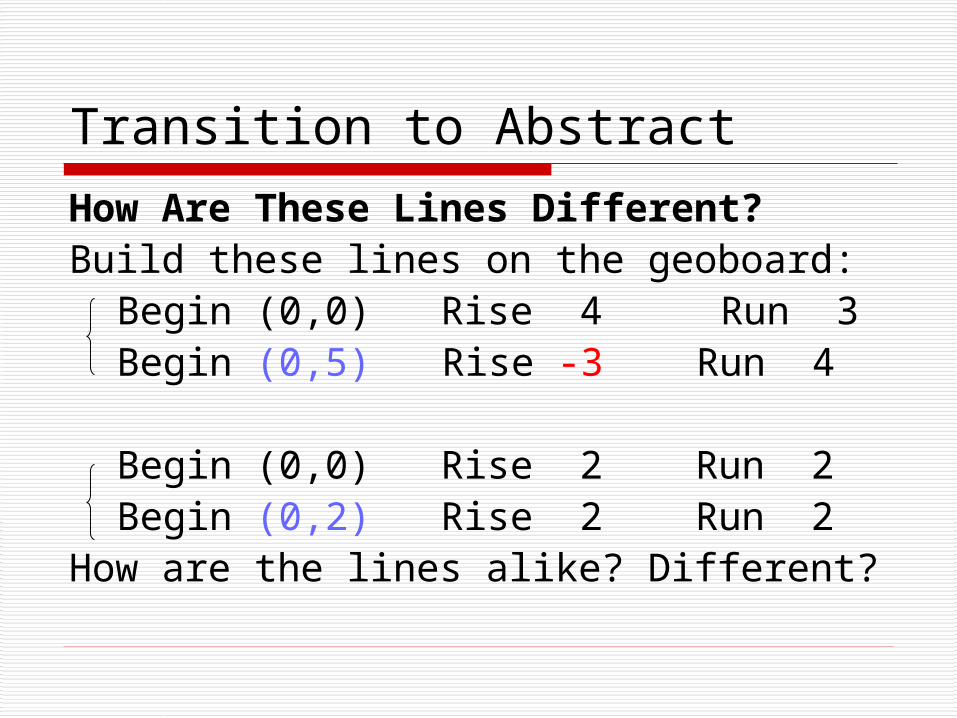
Transition to Abstract
How Are These Lines Different?Build these lines on the geoboard:
Begin (0,0) Rise 4 Run 3 Begin (0,5) Rise -3 Run 4
Begin (0,0) Rise 2 Run 2Begin (0,2) Rise 2 Run 2
How are the lines alike? Different?

National Library of Virtual Manipulatives
http://nlvm.usu.edu/en/nav/frames_asid_282_g_3_t_3.html

How can you describe Slope ?
Steepness
A higher slope value
Ratio of the "rise" divided by the "run”
The ratio of the vertical change to the horizontal change

Conventions to describe slopes
Slope is the relation of rise to run Slope can be illustrated by building stairs.
The y-axis is the rise. The x-axis is the run.
Slopes going “up” from left to right are positive (+).
Slopes going “down” from left to right are negative (-).
Rise
Run
(+)
(-)
(+)(-)

2. Slope as Rate of ChangeHopping Frog Rational
Students will:
Collect data and build a table; Observe how independent variables affect
dependent variables; Compare direct variations between data; Construct equations and a graph.
y = mx + b
y = ax

Hopping Frog Activity Direction
1. Measure the distance of three different frog hops with a ruler.
2. Record the three hop lengths in centimeters. What was your shortest hop length?What was your longest hop length?
3. Build a table that shows the distance jumped from 0 to 10 hops at each hop length.

Hopping Frog Table
Number of Hops: x
1 2 3 4 5 6 7 8 9 10
shortest hop
5cm
10 15 20 25 30 35 40 45 50cm
longesthop
10cm
20 30 40 50 60 70 80 90 100cm
Let x = number of jumps from 0 to 10Let y = distance jumped after x hops in cm
Direct variation representing shortest hop: y = 5 x Direct variation representing longest hop: y = 10 x
One quantity is directly proportional to another when the ratio of the two quantities is constant.

Hopping Frog Graph
0 1 2 3 4 5 6 7 8 9 10
100
50
Number of Jumps
X
y
510
y = 10x
y = 5x
Distance in cm

• Which line has a steeper slope? The one with the longest jump
• What are the coordinates where lines of two jumps intersect?
(0, 0)• What does this ordered pair mean?
All jumps started at zero cm.• How can you write an equation using the graphs or
tables using the y = mx + b format?(Hint: b can be 0.) Let the length of one jump equal m, and let x equal the number of jumps. Then y equals the total cm jumped.
How Are the Table and Graph Related?

Description of Slope in Linear Equations
y = mx + b is slope-intercept form m is the slope
b is the y-intercept, a point where the line crosses the y-axis when x = 0
10
1
=
b = 0y = 5x + 0
y = 10x + 0
5
m =
Change in yChange in x
=
5
1
=
y
=
RiseRunm =
10 10
1
m = 5
Rate of Change
x

Hopping Frog Graph
0 1 2 3 4 5 6 7 8 9 10
100
50
Number of Jumps
X
y
510
y = 10x
y = 5x
Distance in cm
Give a head start for the frog with the shortest hop; so, two frogs can meet after ten hops:
What would happen if a frog turns and hops back to the starting point? Negative CorrelationInverse Variation
y = 5x + 50
y = -10x + 100

Rates of Change can be seen
everywhere

Graphing Calculator
Graphing calculators enable students to perceive concrete to abstract and vise versa instantly: v(c)=c(20-2c)(20-2c)
y = x + 980
y = 20x
1 100
cc
20cm
http://gcalc.net/

What Is a Linear Equation/Slope?
1. It is a constant rate of change between two variables, x and y.
2. It can be represented by a straight line on a coordinate grid.
3. It follows the format of y=mx + b, which is the slope intercept form.

The Abstract
Using “hands-on activities” leads to the ability to develop abstract reasoning.
A graphing calculator is a tool to move from the concrete to the abstract.
Sufficient use and practice with tables, graphs and equations in the concrete form helps make the transition to a graphing calculator a natural progression

Works Cited Elizabeth S. Hoff (slides with this design template are mostly
her words)
Overland Trail Middle School, Overland Park, KS www.bluevalleyk12.org
Bellman, Allan E. California Algebra 1. Prentice Hall, Boston, MA, 2009, Ch-5
National Library of Virtual Manipulatives Online Free Graphing Calculator
http://gcalc.net/ Ministry of Education, Ontario, Canada http://www.edu.gov.on.ca/eng/studentsuccess/
lms/files/tips4rm/gr9Unit5.pdf http://www.edu.gov.on.ca/eng/studentsuccess/lms/