What have we learned from over 50 years of artificial rain ......What have we learned from over 50...
12
What have we learned from over 50 years of artificial rain enhancement experiments and operations in Israel? Zev Levin, Noam Halfon and Pinhas Alpert Tel Aviv University, Israel 1. Introduction Geoengineering for mitigation of the effects of greenhouse gases on climate change has been debated in the scientific literature. However, before any such actions take place it is worth taking a look at geoengineering projects that have been conducted on smaller scales such as weather modification for rain enchantment. Deliberate cloud seeding for rain enhancement by injecting efficient ice nuclei into clouds, has been practiced since the mid 20th century. Unfortunately, only a few large comprehensive projects have been conducted in which both physical and statistical evaluations were reported. In this extended abstract we summarize the findings and conclusions of Levin et al (2010) http://tau.ac.il/~zevlev/pub_files/Levin-Halfon-Alpert-cloud-seeding-in-Israel-2010-AtmRes.pdf who analyzed the rainfall data in Israel from the pre-seeding days of 1949/50 until 2006/7. Three cloud seeding experiments were conducted in Israel since the early 1960s followed by an extended program of operational seeding in the North since 1975. The Israeli experiments, called Israel 1 and Israel 2 (from 1961 to 1967 and 1969 to 1975, respectively) were randomized cross-over experiments between the north and south target areas. Israel 2 was a confirmatory experiment to Israel 1 although its seeding line in the north was shifted eastward, thus creating a control area on the coast to the west. In all these experiments, airborne seeding along a prescribed constant flight path has been used, supplemented by ground generators (see Fig 1). There was a third experiment Israel 3 that targeted the central and southern region of the country. Although it is outside the region of interest of this paper, its results support the conclusions presented here. For years, these experiments were considered examples of success (e.g. Gagin, 1975; Gagin and Neumann, 1981), until questions about the physical hypothesis and the statistical analysis began to appear in mid 1990s (e.g. Levin et al, 1996); Rangno and Hobbs,1995). The latter authors re- analyzed the data from Israel 1 and Israel 2 and concluded that the experiment could have suffered from type 1 statistical error in which the null hypothesis is wrongly rejected. They showed that during Israel 1 similar increases in precipitation occurred in Lebanon and Syria to the north in regions where no seeding took place. Furthermore, they showed that increases in rainfall occurred in an area much greater than is possible by seeding. Nirel and Rosenfeld (1995) analyzed the results of the operational cloud seeding that have been going on since 1975 and concluded that enhancement of only about 6% has been achieved in the Galilee Mountains during this period. Recently, Kessler et al. (2006 in Hebrew) and later on Sharon et al (2008) analyzed the results of the operational seeding until early 2000 and raised doubts about the success of operational seeding. By taking the orographic ratio of rainfall in the mountains/the rainfall upwind, Givati and Rosenfeld (2004, 2005) suggested that the reason for the decline of seeding effects is due to an increased
Transcript of What have we learned from over 50 years of artificial rain ......What have we learned from over 50...
What have we learned from over 50 years of artificial rain
enhancement experiments and operations in Israel?
Zev Levin, Noam Halfon and Pinhas Alpert
Tel Aviv University, Israel
1. Introduction
Geoengineering for mitigation of the effects of greenhouse gases on climate change has been
debated in the scientific literature. However, before any such actions take place it is worth taking a
look at geoengineering projects that have been conducted on smaller scales such as weather
modification for rain enchantment.
Deliberate cloud seeding for rain enhancement by injecting efficient ice nuclei into clouds, has been
practiced since the mid 20th century. Unfortunately, only a few large comprehensive projects have
been conducted in which both physical and statistical evaluations were reported.
In this extended abstract we summarize the findings and conclusions of Levin et al (2010)
http://tau.ac.il/~zevlev/pub_files/Levin-Halfon-Alpert-cloud-seeding-in-Israel-2010-AtmRes.pdf who
analyzed the rainfall data in Israel from the pre-seeding days of 1949/50 until 2006/7.
Three cloud seeding experiments were conducted in Israel since the early 1960s followed by an
extended program of operational seeding in the North since 1975. The Israeli experiments, called
Israel 1 and Israel 2 (from 1961 to 1967 and 1969 to 1975, respectively) were randomized cross-over
experiments between the north and south target areas. Israel 2 was a confirmatory experiment to
Israel 1 although its seeding line in the north was shifted eastward, thus creating a control area on
the coast to the west. In all these experiments, airborne seeding along a prescribed constant flight
path has been used, supplemented by ground generators (see Fig 1). There was a third experiment
Israel 3 that targeted the central and southern region of the country. Although it is outside the
region of interest of this paper, its results support the conclusions presented here.
For years, these experiments were considered examples of success (e.g. Gagin, 1975; Gagin and
Neumann, 1981), until questions about the physical hypothesis and the statistical analysis began to
appear in mid 1990s (e.g. Levin et al, 1996); Rangno and Hobbs,1995). The latter authors re-
analyzed the data from Israel 1 and Israel 2 and concluded that the experiment could have suffered
from type 1 statistical error in which the null hypothesis is wrongly rejected. They showed that
during Israel 1 similar increases in precipitation occurred in Lebanon and Syria to the north in regions
where no seeding took place. Furthermore, they showed that increases in rainfall occurred in an
area much greater than is possible by seeding. Nirel and Rosenfeld (1995) analyzed the results of
the operational cloud seeding that have been going on since 1975 and concluded that enhancement
of only about 6% has been achieved in the Galilee Mountains during this period. Recently, Kessler et
al. (2006 in Hebrew) and later on Sharon et al (2008) analyzed the results of the operational seeding
until early 2000 and raised doubts about the success of operational seeding.
By taking the orographic ratio of rainfall in the mountains/the rainfall upwind, Givati and Rosenfeld
(2004, 2005) suggested that the reason for the decline of seeding effects is due to an increased

suppression over the years of rain due to the effects of air pollution from the coastal region of Israel
that opposes the positive effect of seeding. Alpert et al (2008), Halfon et al (2009) and Alpert et al
(2009) have demonstrated that this conclusion is wrong, showing that the upwind slopes/ coastal
ratio (where sharpest decrease should occur according to this theory) didn’t change over the years,
neither in the seeded areas nor in the unseeded slopes. .
2. Data base
The paper by Levin et al (2010) analyzes the largest data base used so far for evaluating the seeding
projects both in terms of number of stations and in the extent of the analyzed period. This is done by
analyzing the precipitation data in Israel before and during the seeding period, by stratifying the data
based on synoptic conditions and comparing the results with an unseeded adjacent area to the
south. We refer to the period 1949 to 2007 as the “Full Period” and the period of Israel 2 (1969 to
1975) as “Israel 2”. The seeded rainy days during Israel 1 were removed from this analysis because
the northern seeding line used in this experiment was farther west from that used in Israel 2 (see
Fig. 1) and in the operational period, thus eliminating the control area near the coast that is
necessary for the analysis.
The data base consisted of the following items:
a) Official data from "Electrical and Mechanical Services" (EMS), the company responsible for the
seeding during Israel II and during the operational period.
b) Daily rainfall amounts from 1949/50 to 2006/07 – the Full Period in 140 long record rain gauges
of the Israeli meteorological service (IMS) in the north of Israel and additional data from106 rain
gauge stations in the middle of the country for the period of Israel 2 (1969–1975).
c) Daily Synoptic type conditions in the Eastern Mediterranean using the semi-objective
classification of Alpert et al. (2004).
d) Radio-sonde archive data from the IMS in Bet Dagan from the beginning of the measurements
there (1957–2007).
3. Methods
For the sake of brevity, the reader is referred to the paper by Levin et al (2010) for a comprehensive
discussion of the method used for this analysis. At present it is suffice to say that this investigation
was carried out by the method of Double Ratio, DR, in the same way as it had been done in the past
(e.g. Gagin and Neumann, 1981) . This ratio is defined as:
DR= (Ns/Cs)/(Nu/Cu)=(Ns/Nu)(Cu/Cs) (Eq. 1)
Where N and C are the daily rainfall in the target and the control stations, respectively and s and u
refer to seeded and unseeded days, respectively.
In the past the north area was used as a single unit or it was divided into a number of sub-units, in
contrast in this paper we map the spatial distribution of DR by taking the values of the individual

stations and interpolating them in order to create a continuous map.. This method, when applied to
clusters of stations, minimizes the noise due to (high frequency) spatial and temporal variations.
b) Since most of the rainfall in Israel occurs in the presence of cyclones in the Eastern
Mediterranean, and the precipitation ratio between inland (target) and coast (control) is affected by
the depth of the systems and low level (1000-850 mb) winds (Saaroni et al, 2009, Halfon 2008) , we
combined the 19 categories of synoptic types defined by Alpert et al. (2004) into 3 categories of
cyclone depth : Deep , Shallow and no cyclones (see details in Levin et al. 2010).
Each rainy day in the research area was classified based on the above synoptic criteria. Figs. 4a and
4b show the distribution of the synoptic conditions during Israel 2 and during the Full Period,
respectively. The examination of the frequency distribution of the different synoptic conditions was
based not only on the number of days but also on the total accumulated rain in the study area in
each cyclone depth category.
In addition to this method, which is based on grid reanalysis, we also examined the wind speed at
850 hPa during the rainy days based on the radio-sonde data from Bet Dagan in central Israel. The
average wind speed in all the seeded and unseeded days was calculated, regardless of the daily
rainfall amounts and compared it to another average of the wind speed weighted by the daily rainfall
amounts in the research area (Fig. 4-c).
c) In order to estimate the effect of the seeding during Israel 2 we compared the results on the same
exact days with the rainfall in central Israel, located about 100 km to the south of the target and
control experimental areas. The stations that were selected contain all the stations in the IMS archive
that were operated throughout most / all the experiment period. Stations that are between 0-8 km
from the seashore were used as equivalent to the control area and stations that are farther than 20
km from the seashore as equivalent to the target area in the north.
4. Results
a) The daily rainfall amounts during the seeded and unseeded days
Fig. 3 a-c presents the average rainfall amounts in the research area during Israel 2 on seeded and
unseeded days and the values of the DR between each target station and the control area, following
the method used in the original experiment. The ratio of the average rainfalls during seeded/
unseeded days for the control area alone was 125% (about 12.3 mm daily amount on seeded days to
9.9 mm for unseeded days). In the target area this ratio was around 140%, thus the DR in the target

area was greater than 1, with a spatial average of 1.12 and a range between 0.95 in the North West
corner to 1.25 in the east (Jordan valley).
Examining the differences in the daily amounts on seeded and unseeded days for the Full Period and
the values of the DRs (Fig. 3g-i) provides a completely different picture from that obtained for Israel
2. While in Israel 2 the average DR was about 1.12 , in the Full Period the ratio of rainfall on seeded/
unseeded days in the target area was very similar to that in the control area. Thus the DR was exactly
1.00. The extension of the research period from Israel 2 to the Full Period reduced the spatial mean
of the DR for the target area to 1.00 and reduced its range from 0.98-1.30 in Israel 2 to 0.95-1.05
over the Full Period.
b) The ratio of rainfall between cluster stations in the target and control areas during the
full research period.
Using the clusters method in which rain gauge stations are lumped together based on their record
and location (see Levin et al, 2010) we found again a dramatic drop of the DR values from 1.20
during Israel 2 to 1.00 in the Hula Cluster and even to smaller values in the Upper Galilee clusters
(see Fig 4a). Computing the ratios between the cluster stations in the target and control areas on
seeded and unseeded days for cumulative rainfall amounts that are equal to that accumulated
amounts during Israel 2 (1600 mm of rain) reveals that the ratios are variable and not robust (Fig 4 b-
d). . During the period of Israel 2 in which seeding was chosen randomly, the ratios target /control
reached higher values than at any other segment of time during the Full Period. These high values
resulted in high DR values in the three clusters. It is important to note that a small shift of the time
window from the experimental period (1969-1975) to the beginning of the operational seeding
period (1975 -1978) leads to a sharp decrease in the ratio between the three target clusters and the
control on seeded days (see Fig 3b-d), and a corresponding decrease of the DR to 1.00 and even
smaller values. The average ratio of target/control for all the clusters for the unseeded days shows
slightly higher values than those for the seeded ones
c) Differences in synoptic conditions between seeded and unseeded days during Israel 2
and the Full Period.
A close look at the synoptic conditions revealed that in Israel 2 41% of the seeded days were affected
by deep lows as compared to 28% on unseeded days, resulting in 50% of the total rainfall on the
seeded days and only 37% on the unseeded ones. Applying this analysis to the Full Period we see
that the difference in total rainfall associated with deep lows between seeded and unseeded days

was 3% (42% as compared to 45%) while during Israel 2 the difference was 13% (50% and 37%)(see
Fig. 4a-b).
The differences in the distribution of the synoptic and pressure systems that were linked to the
seeded and unseeded days are also visible in the average wind at 850 hPa level (see Fig. 4c).The wind
speed during seeded days in Israel 2 was stronger than during unseeded days (2.91 m/s as compared
to 9..1 m/s, 7.7 =σ m/s), as compared to the Full Period in which the difference was smaller. This last
result appears in spite of the fact that during the Full Period, days with light rain that are associated
with lighter winds were intentionally not seeded. It should also be mentioned that the differences in
the wind direction between seeded and unseeded days were small.
d) The DR of rainfall in central Israel
Since differences in synoptic conditions were found between seeded and unseeded days in the north
of Israel during Israel 2, we investigated whether such effects would be seen in central Israel, in
which some seeding off the coast was done during this experiment but in which no seeding was
carried out during most of the operational period.
In Fig. 5a we show the rainfall ratios between seeded and unseeded days of Israel 2 in northern Israel
and the equivalent ratios in the same days in the center of Israel.
From the figure it is clear that almost all the values of the ratios are larger than 1.00, both in the
north and in the center but that the values of the DR (obtained by dividing the ratios on the inland-
hills with the ratios on the coast), are slightly higher in the center than in the north, where
intentional intensive seeding has been carried out for the past 40 years, (Fig. 5b).
5. Summary
Re-analysis of the cloud seeding experiment and operations in Israel shows that seeding has not
produced the expected enhancement in rainfall. Comparison of the DR in the seeded area with that
in an unseeded adjacent area to the south, showed no difference with even slightly higher values in
the unseeded area. This suggests that seeding had little or no effect on total precipitation on the
ground.
Furthermore, it is shown that the high DR values obtained during Israel 2 experiment were mostly
due to a larger fraction of seeded days in which deep low pressure systems and stronger winds
occurred more frequently, leading to more efficient penetration of rain clouds inland and providing
better conditions to the evolution of orographic rain.
6. Lessons learned

The results of the analysis of the Israeli cloud seeding and operations show, in agreement with the
WMO and the AMS statements, that cloud seeding is still not a proven technology and certainly not
an off-the-shelf method that could be applied everywhere.
This should be a lesson to new proposed projects, indicating that the atmosphere is complex, in
which many mechanisms that are unaccounted for may affect the final outcome of the experiments,
even to the point at which detrimental results could occur.
Before any experiment or operational cloud seeding is contemplated, knowledge of some of the
microphysical properties and the large scale characteristics of the clouds in the region, are
absolutely necessary. Once this is achieved a hypothesis could be formulated about the potential
physical effects of seeding on the rainfall amounts and their distribution. Similarly, the best seeding
agent (glaciogenic/hygroscopic or both) should be identified and the most efficient seeding method
should be chosen. For example, based on numerical simulations it was shown that the method of
broad scale seeding, as it is done in Israel, is not really effective. This is because most particles are
washed by the falling raindrops, with very few reaching the proper cloud-heights for ice to form.
Similarly, it has been shown that ground generators may be effective in strong orographic conditions
but not in other situations.
The past analysis of the Israeli cloud seeding experiments also teaches us that new ideas that
emerge during such experiments (e.g. suppression of rainfall by pollution and the compensating
effects of cloud seeding; the enhancement of rainfall due to dust storms, thus making cloud seeding
ineffective etc) should only be viewed as exploratory. These ideas could then be formulated as new
hypotheses, based on which new experiments could be designed.
It is further important to emphasize that when new experiments are planned, a clear separation
between designers, operators, data collection and analysis should be strictly applied in order to
prevent any potential bias.
Once an experiment has started, its methods and procedures should remain unchanged for its full
duration.
Acknowledgments
Part of the work was carried out under the support of the EU project CIRCE. NH thanks the Porter
School for Environmental Studies of Tel Aviv University for granting him a Post doctoral fellowship.
References
Alpert, P., Halfon, N. and Levin, Z., Does air pollution really suppress precipitation in Israel? J. Appl. Meteor., 47, 933–43, 2008.
Alpert, P., Osetinsky, I., Ziv, B., Shafir, H., Semi-objective classification for daily synoptic systems: application to the eastern Mediterranean climate change. International J. of Climatology 24, 1001-1011, 2004.
Alpert, P. and Shafir, H., On the role of the wind vector interaction with high-resolution topography in orographic rainfall modelling, Quart. J.R. Meteor. Soc., 117, 421-426, 1991.
Alpert, P., N. Halfon and Z. Levin, Reply to comment by A. Givati and D. Rosenfeld; On the paper by Alpert, P., N. Halfon and Z. Levin: Does air pollution really suppress precipitation in Israel?, J. Appl. Meteor., 48, 1751-1754, 2009.
Gagin, A., The ice phase in winter continental cumulus clouds. J. Atmos. Sci. 32, 1604 – 1614, 1975. Gagin, A., and Neumann, J., The second Israeli randomized cloud seeding experiment: Evaluation of
the results. J. Appl. Meteor., 20, 1301–1321, 1981. Givati, A., and Rosenfeld, D., Quantifying precipitation suppression due to air pollution. J. Appl.
Meteor., 43, 1038–1056, 2004. Givati, A., and Rosenfeld, D., Separation between Cloud Seeding and Air Pollution Effects, J. Appl.
Meteorol., 44, 1298– 1314, 2005. Halfon, N., Spatial patterns of precipitation in Israel and their synoptic characteristics. PhD. Thesis,
dept. of Geography, University of Haifa, 185 pp, 2008. Halfon, N., Levin, Z. and Alpert, P., Temporal rainfall fluctuations in Israel and their possible link to
urban and air pollution effects. Environ. Res. Lett. 4, 10.1088/1748-9326/4/2/024012, 2009. Kessler, A., Cohen, A. and Sharon, D., 2006. Analysis of the Cloud Seeding Effectiveness in Northern
Israel, Report to the Israeli Water Authority, Environmental & Water Resources Eng. Haifa 117 pp. (in Hebrew - Abstract in English), 2006.
Levin, Z., N. Halfon, P. Alpert, Reassessment of rain enhancement experiments and operations in Israel including synoptic considerations, Atmos. Res. DOI: 10.1016/j.atmosres.2010.06.011, 2010a.
Levin, Z., N. Halfon and P. Alpert, Reply to comment by Ben-Zvi, A., D. Rosenfeld and A. Givati, on " Reassessment of rain enhancement experiments and operations in Israel including synoptic considerations". Submitted for publication, Atmos. Res. 2010b.
Levin, Z., E. Ganor and V. Gladstein, The effects of desert particles coated with sulfate on rain formation in the eastern Mediterranean. J. Appl. Meteor., 35, 1511-1523, 1996.
Nirel, R. and Rosenfeld, D., Estimation of the effect of operational seeding on rain amounts in Israel. J. Appl. Meteor., 34, 2220–2229, 1995.
Rangno, A. L. and Hobbs, P. V., A new look at the Israeli cloud seeding experiments. J. Appl. Meteor., 34, 1169–1193, 1995.
Saaroni, H., Halfon, H., Ziv, B., Alpert, P. and Kutiel, H., Links between the rainfall regime in Israel and location and intensity of Cyprus lows. Inter. J. Climatology 29, DOI: 10.1002/joc.1912, 2009.
Sharon, D., Kessler, A. and Cohen, A., The history and recent revision of Israel's cloud seeding program, Isr. J. Earth Sci., 57: 65–69, 2008.

Fig 1: A schematic map of the seeding lines used during Israel 1, 2 experiments and the operational
period. Also shown are the areas used as target and control during Israel 2 and the operational
periods and the buffer used during Israel 1 and 2. Note that the southern seeding line in Israel 2 was
extended southward as compared to Israel 1. The dashed and dotted line is the southern boundary
of the target area in the north for which mean daily rainfall for seeded and unseeded days was
calculated.

Fig 2: The average daily rainfall on seeded (A, D, G) and unseeded (B, E, H) days. The right
column (C, F, I) shows the mapping of DR. The differences between the results of Israel 2
(panels A, B, C for all allocated days and panels D, E and F for the sampled days, days in
which airborne seeding was actually done) and the Full Period (panels G, H, I).
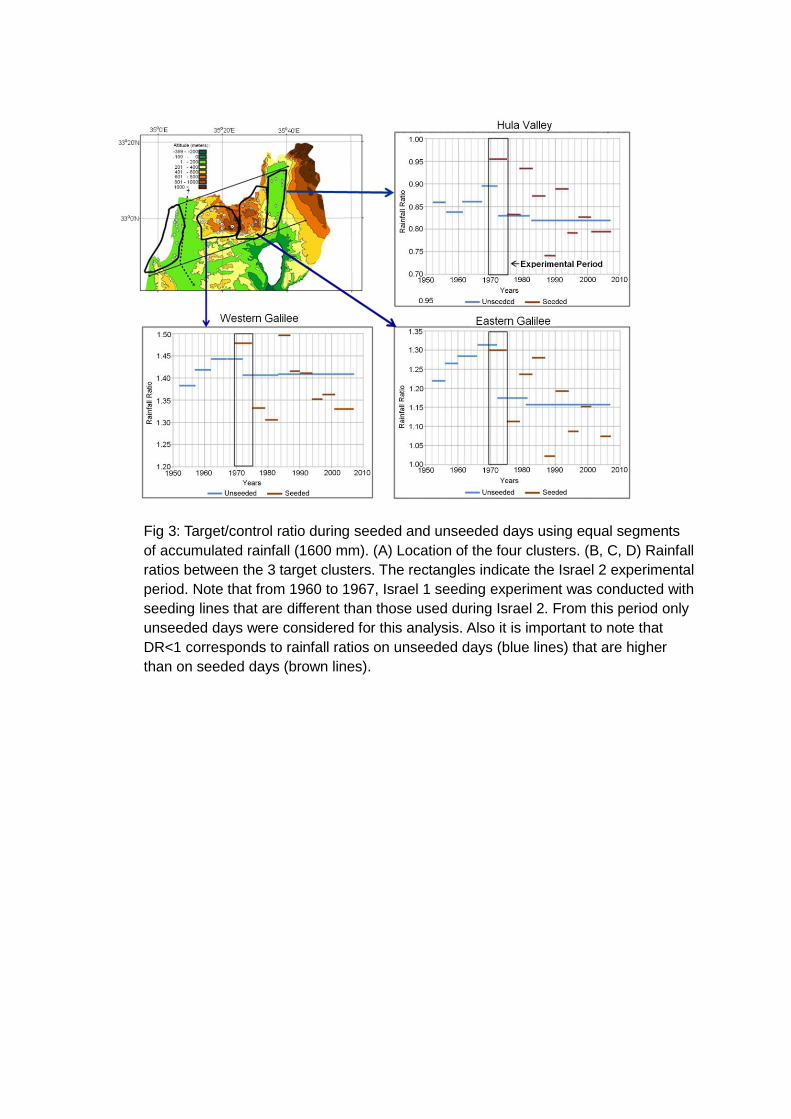
Fig 3: Target/control ratio during seeded and unseeded days using equal segments
of accumulated rainfall (1600 mm). (A) Location of the four clusters. (B, C, D) Rainfall
ratios between the 3 target clusters. The rectangles indicate the Israel 2 experimental
period. Note that from 1960 to 1967, Israel 1 seeding experiment was conducted with
seeding lines that are different than those used during Israel 2. From this period only
unseeded days were considered for this analysis. Also it is important to note that
DR<1 corresponds to rainfall ratios on unseeded days (blue lines) that are higher
than on seeded days (brown lines).
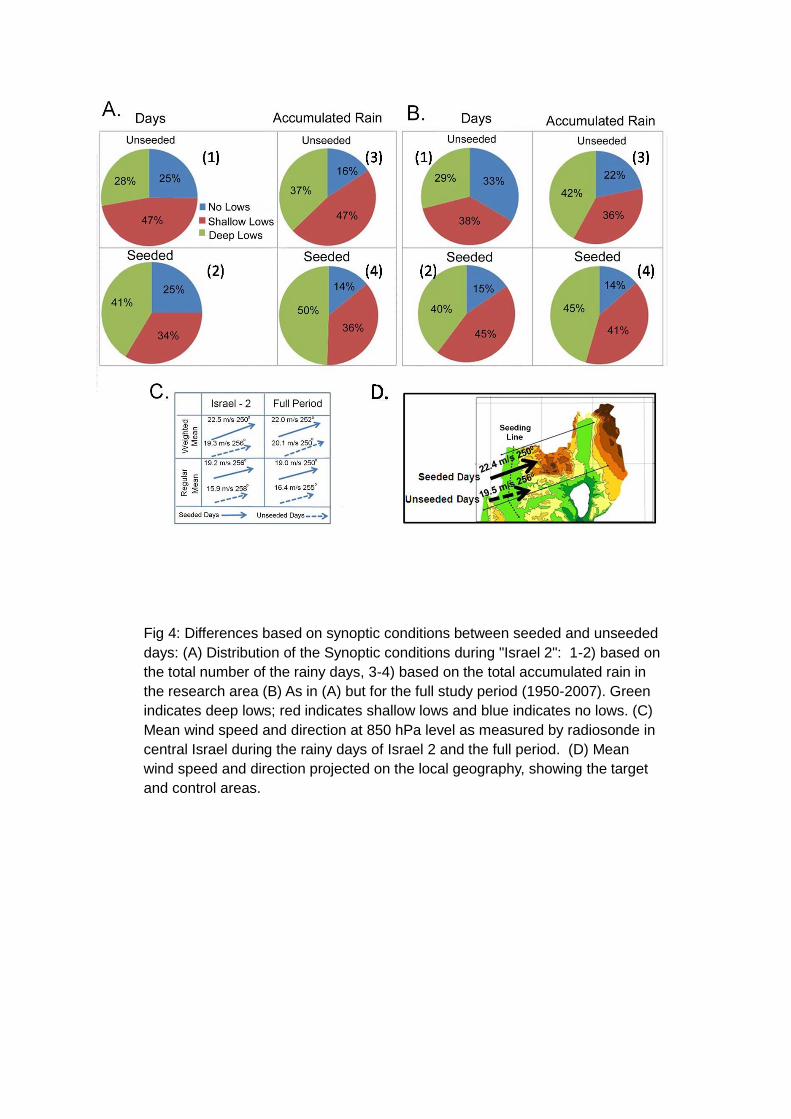
Fig 4: Differences based on synoptic conditions between seeded and unseeded
days: (A) Distribution of the Synoptic conditions during "Israel 2": 1-2) based on
the total number of the rainy days, 3-4) based on the total accumulated rain in
the research area (B) As in (A) but for the full study period (1950-2007). Green
indicates deep lows; red indicates shallow lows and blue indicates no lows. (C)
Mean wind speed and direction at 850 hPa level as measured by radiosonde in
central Israel during the rainy days of Israel 2 and the full period. (D) Mean
wind speed and direction projected on the local geography, showing the target
and control areas.

Fig 5: Seeded / unseeded daily rainfall ratio and DR during “Israel 2” in the northern
target area and in a reference area (central Israel) that was not seeded during the
northern seeded days.
(a) Rainfall ratios distribution and spatial means of this ratio in the control and target
areas in northern Israel and the equivalent strips in the reference area of central Israel.
(b) The DRs in the target area in the north and in the center are obtained by dividing
the mean of the seeded/unseeded values in the north target (1.41) by the value in the
north control (1.25) and the corresponding values in the center (1.30 divided by 1.13).
This shows that the DR in the center (area not affected by seeding) is similar or even
slightly larger than in the north seeded area.


![Rain-Flow Modeling Using a Multi-Layer Artificial Neural ... · flow of a river [6], for ameliorating the modeling rain-flow based on rainy events [7], the predictions of the chronological](https://static.fdocuments.us/doc/165x107/5e9ddf12d4837a1a245fb58f/rain-flow-modeling-using-a-multi-layer-artificial-neural-flow-of-a-river-6.jpg)