What happened to fuel taxation in europe - Transport & Environment
59
FUELLING OIL DEMAND What happened to fuel taxation in Europe
Transcript of What happened to fuel taxation in europe - Transport & Environment

Fuelling oil demandWhat happened to fuel taxation in europe

Fuelling oil demand What happened to fuel taxation in Europe? April 2011 © 2011 European Federation for Transport and Environment (T&E) Editeur responsable Jos Dings, Director T&E – European Federation for Transport and Environment AiSBL Rue d'Edimbourg, 26 | B-1050 Brussels | Belgium www.transportenvironment.org
T&E gratefully acknowledges funding support from the European Commission.

Page | 2
Contents
Contents .......................................................................................................................... 2 Summary ......................................................................................................................... 3 Introduction ..................................................................................................................... 5 Petrol and diesel tax – EU policy context ......................................................................... 6 The importance of fuel taxation ..................................................................................... 10 Impact of Europe’s fuel tax policy .................................................................................. 13 Trends in EU fuel prices and taxes ................................................................................ 17 Recommendations ........................................................................................................ 22 References .................................................................................................................... 23 Annex I: Member States close to minimum tax levels .................................................... 24 Annex II: Fuel price and tax graphs for the EU and per Member State .......................... 29

Page | 3
Summary This paper is written in the context of an expected proposal from the European Commission on a revision of the Energy Tax Directive. The new directive will likely propose new minimum tax levels for most forms of energy not covered by Europe’s Emissions Trading Scheme (ETS), including fuels used for surface transport. The objective of this paper is threefold:
to demonstrate the importance of EU action on fuel taxation in reducing CO2 emissions of, and oil imports for, transport and, indirectly through smart use of revenues, in fighting unemployment;
to investigate trends in fuel taxes and fuel prices in the EU and its member states since 1980, and the impacts of these developments;
to explain the root causes of these trends and offer recommendations for the forthcoming review of the energy tax directive.
Importance of fuel taxation Compared with other regions in the world like the US, China or Japan, the EU has relatively high fuel taxes. In many ways this is a major strength for the EU’s economic and environmental performance:
It lowers CO2 emissions and oil demand because, contrary to popular belief, taxing fuel brings down consumption. In the long run, 10% higher fuel prices reduce the overall fuel consumption of cars by 6 to 8%, and of lorries by 2 to 6%.
It lowers the EU’s oil import bill. At today’s prices this bill approaches €300bn a year, half of which is spent on road transport, but it would have been much higher without fuel taxes;
If revenues from fuel taxes are spent to lower taxes on labour, fuel taxes can create jobs. This report shows that as a rule of thumb, every cent increase in EU27 road fuel tax levels can cut unemployment by about 35,000;
It improves the competitive position of public transport (in passenger transport) and rail transport and shipping (in freight);
It facilitates breakthrough technologies such as electric cars;
It increases consumer demand for fuel efficient cars, stimulating development of cutting-edge technology in the home market and making it easier for carmakers to hit CO2 reduction targets.
EU policy: setting minimum tax levels is more important than it looks At first sight it might seem that fuel tax policy is a purely national affair, not least because the EU can only take tax decisions on the basis of unanimity. This impression might be reinforced by the fact that most EU countries have fuel tax levels quite far above the current EU minimum levels of €0.359 per litre for petrol, and €0.33 per litre for diesel. However, in reality the EU minimum tax rates matter a great deal. ‘Fuel tourism’, filling up where fuel is cheapest, is widespread. Lorries in particular strongly optimise their filling strategies as they criss-cross Europe and can drive thousands of kilometres on a single tank. This means that small countries such as Luxembourg can attract more revenue by lowering fuel taxes; a politically irresistible move. This behaviour, in turn, makes it more difficult for bigger countries to raise fuel taxes. The EU’s minimum rates put a floor on fuel taxes and are therefore crucial in avoiding a

Page | 4
race to the bottom. Annex I shows that nine EU countries quite closely track mandatory minimum levels for commercial diesel. Developments in fuel tax in Europe Given all the positive effects of fuel taxation, this report‘s key finding is as counterintuitive as it is worrying: the average fuel tax levied on road fuels in the ‘old’ EU15 is in real terms €0.10 per litre lower today than it was in 1999. Average fuel tax, in 2010 prices, went down from €0.59 a litre in 1999 to €0.49 a litre in 2010. As consumption remained stable, the result was a 16% plunge in (inflation-corrected) revenues in the EU15 from €180bn to €152bn. Of this 10-cent fall, three cents was caused by the shift to (lower-tax) diesel. In 1999 the share of diesel was a bit over 50%, today it’s two thirds. More than six cents can be explained by inflation: most member states do not automatically adapt their fuel taxes to inflation which causes them to fall in real terms unless they take specific action. The rest, less than half a cent, can be explained by the introduction of tax rebates on diesel used by lorries in France, Spain and Belgium, which did not exist in 1999. Had governments not let fuel taxes slip but kept them constant, CO2 emissions of EU27 road transport would have been some 6%, or 60 Mtonnes, lower, and today’s oil imports would have been €11bn lower. If the additional €32bn revenues had been spent on lowering labour taxes, roughly 350,000 jobs could have been created. Since oil prices have more than trebled between 1999 and 2010, on balance the EU27’s own tax revenues from road fuels have declined by €32bn, while its oil import bill has risen by approximately €100bn. Still it is important to see the longer-term trend: inflation-corrected fuel prices at the pump today are similar to 30 years ago in the nine EU member states for which records are available. 2010 prices were still slightly lower than in 1981 and 1982. On a per-country-basis, the following developments seem most interesting:
Spain is the only large country in Western Europe with diesel tax rates that touch the minimum level;
Luxembourg sells 5 to 8 times more fuel per head of population than its neighbours;
Italy has seen the largest decline in real fuel taxes not explained by exchange rate effects. From a peak in 1995 its weighted-average real fuel taxes dropped by almost a third (31%) mainly by not correcting rates for inflation;
Slovenia operates the most generous fuel tax rebate for lorries, guaranteeing them diesel taxed at the EU minimum level;
The UK has always stood out for having the highest diesel taxes in Europe, the same level as petrol. However, largely due to the fall of the pound against the euro, UK fuel taxes (in €) have dropped by a 32% since their high point in 2000.
Recommendations for the proposed revision of the Energy Tax Directive 1. Minimum fuel taxes, in particular for diesel, have to increase so that the
downward pressure on tax rates and the relentless shift towards cheaper fuel stops;
2. Minimum tax rates should, in future, be automatically adjusted for inflation; 3. Special ‘commercial’ diesel tax rebate schemes should be abolished.

Page | 5
Introduction Since 1993, when it had only 12 Member States, the EU has been setting minimum tax rates for petrol and diesel used in road transport. In 2003 the EU of 15 adopted a new law updating the minimum rates1, following six years of negotiations. That update was just in time for the ‘big bang’ enlargement of the EU to 25 members in 2004. Eight years on, the European Commission is close to proposing a new and more comprehensive update of the energy tax directive. An important change since 2003 is that large emitters have been included in the EU Emissions Trading Scheme (ETS). The idea behind the new energy tax directive is that it should, as far as possible, complement the ETS by covering as many sectors as possible with a CO2 price. With this in mind, it is time to take stock and analyse the importance and impact of the current legislation, and derive recommendations for the forthcoming modifications. This report focuses petrol and diesel use in road transport as this is the area where the directive has had most impact. By no means this is the only important area; for example, the ETD does not allow taxation of fuel used in international aviation or maritime transport, a situation that the upcoming proposal should address too. The objective of this paper is threefold:
to demonstrate the importance of EU action on fuel taxation in reducing CO2 emissions of, and oil imports for, transport and, indirectly through smart use of revenues, in fighting unemployment;
to investigate trends in fuel taxes and prices in the EU and its member states since 1980, and the impacts of these developments;
to explain the root causes of these trends and offer recommendations for the forthcoming review of the energy tax directive.
The next chapter puts road fuel taxation in the EU transport and environment policy context. Then we summarise evidence of the impact of fuel taxation on consumption and CO2 emissions, and we examine what happens if fuel tax revenues are ‘recycled’ to lower labour taxes. Subsequently we analyse the importance of European fuel tax policy – how and where it has made a difference. Then we analyse trends in fuel prices and fuel taxes in the EU and its member states, on the basis of a comprehensive database containing 30 years of data on fuel prices, taxes, consumption and price inflation. The last chapter arrives at recommendations for the forthcoming proposal of the European Commission for a revision of the energy tax directive. 1 COUNCIL DIRECTIVE 2003/96/EC of 27 October 2003 restructuring the Community
framework for the taxation of energy products and electricity, Brussels, October 2003

Page | 6
Petrol and diesel tax – EU policy context This section describes how fuel taxation in transport fits with the EU’s overall climate and tax policy. It first describes targets for climate policy in transport, and then the role the European Commission sees for economic instruments in achieving them. EU climate policy, and the role of transport The EU has long been committed to keeping climate change below 2ºC compared to pre-industrial levels. First, the EU signed, ratified and implemented the Kyoto protocol, which sets an 8% reduction target for the 2008-2012 period compared with 1990. The EU is on track for meeting this target. For the post-2012 period, the EU adopted in late 2008 a package of legislation designed to cut greenhouse gas emissions by 20% by 2020 compared to 1990 levels. In addition the EU has repeatedly declared itself ready to move to a -30% target if other countries made significant moves in the same direction. The European Council reconfirmed in February 2011 its pre-‘Copenhagen’ statement from October 2009 that the EU should reduce greenhouse gas emissions by 80-95% by 2050 compared to 1990. In order to prepare for a possible move to a 30% reduction target by 2020 and for necessary post-2020 action, in January 2011 the European Commission adopted a ‘Roadmap for moving to a competitive low carbon economy in 2050’2. This proposed indicative ‘effort sharing’ over different sectors in order to hit domestic reductions of 80% by 2050, under which transport was allotted a 60% reduction target. See next page. 2 http://ec.europa.eu/clima/policies/roadmap/index_en.htm

Page | 7
Graph 1: how emission reduction efforts towards are to be shared across different sectors. Source: Roadmap for moving to a competitive low carbon economy in 2050, European Commission, January 2011
This 60% transport target, which represents a roughly 70% cut compared with 2008 levels, was reconfirmed in the European Commission’s Transport White Paper ‘Roadmap to a Single European Transport Area - Towards a competitive and resource efficient transport system’3. This paper also added a 20% cut compared with 2008 levels for 2030. The graph below illustrates these efforts and compares them with trends in the past. 3 http://ec.europa.eu/transport/strategies/2011_white_paper_en.htm

Page | 8
Graph 2: EU27 transport emissions 1990-2008, and targets for 2030 and 2050 as set in the 2011 Transport White Paper.
Until now transport has been the worst performing sector under Kyoto and seriously jeopardises the achievement of the targets. Transport CO2 emissions in the EU grew by 34% between 1990 and 2008. Other sectors reduced their emissions by 14% on average over the same period. The share of transport in CO2 emissions was 21% in 1990, but by 2008 this had grown to 29%4. Transport is also critical in the debate on Europe’s energy dependence. At current (April 2011) oil prices Europe imports approximately €300 billion worth of oil every year (€800m every day). Transport consumes about 60% of oil in Europe; road transport about 50%. Greening tax systems in the context of economic recovery Ever since the economic crisis began in late 2008, the European Commission has made it clear that changes towards smarter forms of taxation have to be an integral part of economic recovery strategies. The commission has endorsed the view held by environmental economists that economically speaking it is better to tax ‘bads’ such as pollution than to tax ‘goods’ such as labour. In times of austerity such a shift has become even more necessary. The European Commission’s most recent annual growth survey says: 4 Source: www.transportenvironment.org/Publications/prep_hand_out/lid:545, based on EEA data
0
200
400
600
800
1,000
1,200
1,400
1990 2000 2010 2020 2030 2040 2050
CO
2 e
mis
sio
ns
fro
m t
ran
spo
rt in
th
e E
U2
7 (
Mto
nn
es)
emissions 1990-2008
White Paper objectives

Page | 9
‘Shifting taxes away from labour should be a priority for all Member States in order to stimulate demand for labour and create growth.’5 Similarly, the recently adopted flagship initiative in a resource efficient Europe‘6 which sets the frame for Commission environmental policy says ‘taxes and subsidies on the use of energy or other resources can be used both to steer behaviour leading to reduced and more efficient consumption and to help restructure public finances away from labour taxation, which benefits job creation and economic growth;’ In short, the European Commission has, at least in words, embraced the concept of the green tax shift. It’s time to match words with deeds. 5 The ‘annual growth survey’ kicks off the new EU ‘semester’. The semester is a cycle in
which EU member states and the European Commission scrutinise national budgets in order to ensure deficit and growth targets are met. 6 Communication from the Commission to the European Parliament, the Council, the
European Economic and Social Committee and the Committee of the Regions, A resource-efficient Europe – Flagship initiative under the Europe 2020 Strategy, COM(2011) 21, Brussels, 26 January 2011

Page | 10
The importance of fuel taxation This chapter provides an overview of reasons why fuel taxation is so important if we want to help stop climate change, leave oil in the ground and create jobs. Effects on fuel consumption and CO2 emissions The fact that transport emissions have continued to rise, has often been used to make the point that fuel taxation doesn’t work. This analysis is too simplistic. A quick comparison of European and American car markets, buyer preferences and resulting fuel efficiencies should convince doubters of the importance of fuel taxes in influencing consumer choice. Simply put, driving the sort of gas guzzling cars Americans are used to, is unaffordable with European levels of fuel tax. Americans burn more than twice the amount of transport fuel per head as Europeans. In the end, North Americans spend about the same amount of money on fuel, they just get it at half the price. The graph below serves as an illustration of the correlation between fuel prices and fuel intensity of different economies. Graph 3: light-vehicle fuel use per $ of GDP generated vs weighted average fuel prices over the 1970-1995 period7.
The graph shows that the lower road fuel prices, the more fuel is used and carbon is emitted per $ of GDP generated. The US and Canada use roughly three times European amounts of transport fuel per dollar of income. 7 Source: http://www.physics.ohio-state.edu/~barrett/energy/overall/indicators2.pdf, p38

Page | 11
Over the years quite a few scientific reviews have been carried out into the price sensitivity of fuel demand, in other words how demand for fuel is affected by changes in price. Economists call this the ‘price elasticity’ which is defined as the relative change in demand divided by the relative change in price. Reviews by (Dahl and Sterner 1991), (Espey 1998), (Graham and Glaister 2002) and (Brons et al. 2008) provide summaries of research into fuel demand elasticities. The studies shows large differences between the long and short run price elasticities, which is logical because only in the long run can people change their choice of car, or place to work and live. Long run price elasticities typically fall between -0.6 and -0.8 while short run elasticities range between -0.2 and -0.3. This means that a 10% rise in fuel prices typically reduces fuel demand and CO2 emissions by 6 to 8% in the long run. Most of these studies deal with passenger cars; less has been done on the freight side, which currently accounts for about a third of fuel use in road transport. A recent literature overview by CE Delft for T&E8 arrives at a long term elasticity of -0.2 to -0.6 for road freight. Putting these results together, we can assume an overall price elasticity of -0.6. So if fuel prices rise by 10%, emissions go down by 6%. Effects on employment An increase in fuel tax can increase employment if revenues are ‘recycled’ via lower taxation on labour. This can either happen through lower personal income taxes or lower employer payments such as social security contributions. Quite a few studies have been done into the environmental, GDP and employment effects of such a green tax shift, although none of these studies focused exclusively on increases in road fuel taxation; they were more wide-ranging. However, as most of the job creation happens through ploughing back revenues into lower taxation of labour, the studies can be used to gain a first insight into employment effects. It should be noted that ‘carbon leakage’ and resulting job losses is not a problem here because European road transport cannot be done elsewhere (unlike manufacturing for example). Therefore the employment effects as calculated below are more likely to be conservative than optimistic. A recent study9: concluded that a €59 per tonne of CO2 tax, which would yield roughly €220bn of revenues across the EU27 (before revenue-decreasing emissions cuts), would yield 1.1% employment growth in EU27 if revenues are recycled through reductions in personal income tax and social security contributions of employers. Total EU27 employment is 220 million jobs10 so 1.1% is 2.4 million people. The results imply that a billion euros of tax shifted from labour to energy would yield roughly 11,000 jobs. 8 www.transportenvironment.org/Publications/prep_hand_out/lid/595
9 Ekins, P., Resource Productivity, Environmental Tax Reform and Sustainable Growth in
Europe, Anglo-German Foundation for the Study of Industrial Society, 2009 (p31) 10
http://epp.eurostat.ec.europa.eu/cache/ITY_OFFPUB/KS-SF-10-046/EN/KS-SF-10-046-EN.PDF

Page | 12
Analysis of the German environmental tax reform11 yields broadly similar results. The reform shifted €18bn of tax revenues away from labour towards energy; the study estimates job creation of 176,000 to 250,000. This yields 10,000 to 13,000 jobs created per billion of euros of tax shifted. A one-cent per litre fuel tax rise in road transport in the EU27 yields about €3.2bn before emissions-reduction effects. Provided revenues are used to lower labour cost this would hence create roughly 35,000 jobs. Fuel taxation indispensable if oil is to stay in the ground One reason why fuel tax is so important is rarely, if ever, mentioned. For climate policy to succeed, oil must be cheap from the producer’s perspective, so they are encouraged to leave it (and its carbon) in the ground. But it must be expensive for consumers – so they use it more efficiently and look for lower-carbon and hence lower-tax alternatives. The only way to solve this paradox is bridging the gap between producer and consumer prices with a fuel tax. Despite how obvious it is that a low global oil price is an inevitable by-product of successful climate policy, this fact is almost never recognised. Perspectives for public transport and clean technologies Finally, fuel taxation gives public, rail and waterway transport, which is typically more fuel efficient, a better competitive position. Similarly it creates demand for vehicles equipped with modern fuel saving technologies, and improves the competitive position of breakthrough technologies such as electric cars. 11
Bach, Stefan et al., Die ökologische Steuerreform in Deutschland. Eine modellgestützte Analyse ihrer Wirkungen auf Wirtschaft und Umwelt. Heidelberg: Physica Verlag, 2001

Page | 13
Impact of Europe’s fuel tax policy This section focuses on the European angle of fuel taxation policy, in particular the impacts of the minimum fuel tax rates the EU has set since 1993. Fuel taxation is often seen as a purely national issue, an impression reinforced by the fact that the EU can only vote on tax matters in unanimity. But this section will show that European policy in this area is strategically very important, arguably indispensable if fuel taxes are to be prevented from plummeting. In order to understand why a European approach is necessary, we start with a description of the phenomenon of ‘fuel tourism’. Fuel tourism Everybody who travels abroad by car knows the temptation to fill up in countries where fuel is cheapest. People close to borders know it as well. But most people in Europe don’t go abroad by car very regularly and don’t live very close to borders. Lorries, however, criss-cross Europa all the time, they travel long distances and they can cover thousands of kilometres on a single tank of diesel. Optimising refuelling strategies is part of their core business and crucial for the bottom line. This strong incentive to plan routes to include cheap fill-ups in turn gives strong incentives to governments, in particular those of smaller countries, to keep diesel taxes low, so that lorries come and fill up. Smaller countries can even raise total tax revenues by keeping diesel taxes low – an irresistible political proposition. The graph below zooms in on Luxembourg and shows how much money per inhabitant Luxembourgers earn by keeping their fuel taxes typically 5 to 15 cents below those of its neighbours. The amount is calculated by multiplying excess Luxembourg fuel sales (compared with the average of its neighbours) by the fuel tax levied in Luxembourg.

Page | 14
Graph 4: earnings per Luxembourger from fuel tourism.
The graph allows three conclusions: 1. Luxembourgers earn surprisingly significant amounts of money from foreigners
filling up at its fuel stations; 2. the figures keep rising; 3. all the growth is from low diesel taxes, the contribution from petrol is stable The strong rise of Luxembourg’s revenues in 1998-2005 period is probably due to the German Ecotax which widened the tax gap significantly in the years 1999-2003. But the most important reason for the constant rise in diesel tourism is probably the very fast internationalisation of road freight transport, which drastically increases the number of internationally operating lorries that can make use of the situation. If we assume that the extra diesel would otherwise have been sold in the neighbouring countries France, Germany and Belgium, it can be calculated that they therefore lose about 2% of their diesel sales to Luxembourg. Although this figure may not seem to be disastrous in itself, the huge differences (and the obvious profiteering) provide a good political excuse for the neighbouring countries not to raise their taxes. Luxembourg is an extreme example but by no means the only country that has benefited from its size and location to keep diesel taxes low. Austria did this until quite recently. Slovenia is a current example, see next section. It is not a coincidence that the highest diesel taxes can be found in the UK, France, Germany and Italy, the countries, geographically speaking, with more limited evasion options. But even these countries lose part of the extra revenue from diesel tax increases to countries with lower taxes. For them the political proposition is difficult – full political pain of higher taxes, with part of the revenues leaking abroad. EU minimum rates Avoiding a counterproductive ‘race to the bottom’ on fuel taxation was the main reason the EU started in the 1980s to consider harmonising minimum tax rates. A
0
500
1,000
1,500
1990 1992 1994 1996 1998 2000 2002 2004 2006 2008
earn
ings
fro
m p
etro
l an
d d
iese
l sa
les
to f
ore
ign
ve
hic
les,
in E
UR
per
Lu
xem
bo
urg
inh
abit
ant from diesel
from petrol

Page | 15
first proposal came in 1987, was eventually adopted in 1992, and entered into force in 1993. In 1997 the Commission made a second proposal which was eventually adopted in 2003, just in time for entry into force in 2004 coinciding with the EU’s big bang enlargement from 15 to 25 member states. Graph 5: overview of nominal (i.e. not corrected for inflation) minimum tax rates for commercial diesel for different member states over time
The point of this graph is not to show the detailed minimum tax rates for each individual country, but primarily to show that the 2003 law introduced a huge amount of derogations for member states in terms of levels and timing of minimum tax rates for professional diesel. The negotiations were difficult (they lasted six years).
By 2013 all these derogations will expire meaning that every EU member state will have to levy a €0.33 minimum tax rate for diesel.
Although it looks like the minimum rate will therefore go up over time, the reality is that rates actually go down as a result of inflation. The EU27 inflation rate between 1993 and 2010 was 42%. The 1993 minimum tax level of €0.245 per litre is €0.35 in today’s money; so the €0.33 minimum rate is actually a decrease in real terms.
Which Member States set lower diesel taxes for lorries?
The energy tax directive allows member states to have lower tax rates for ‘commercial’ diesel which is diesel used by lorries over 7.5 tonnes. Currently five member states use this possibility: Spain, France, Belgium, Hungary and Slovenia. Rates differ – Spain offers 2.9 cents, France 3.6 and Hungary 2.5 cents. Belgium and Slovenia offer variable rates that in the Belgian case amounted to roughly 3.5 cents in 2010, and in the Slovenian case a staggering 10 cents a litre and guarantees commercial diesel at minimum E tax rates.
Spain is in a peculiar situation – for a number of years part of its fuel tax was levied in a way deemed illegal by the European Court of Justice in 2009. That means Spain has to reimburse the tax to those that request it, which in turn means Spain’s actual tax rate for professional diesel, in retrospect, has been below its legal minimum for
0
50
100
150
200
250
300
350
19
93
19
94
19
95
19
96
19
97
19
98
19
99
20
00
20
01
20
02
20
03
20
04
20
05
20
06
20
07
20
08
20
09
20
10
20
11
20
12
20
13
min
imu
m t
ax le
vels
in E
UR
pe
r 1
,00
0 li
tre
s
Austria
Belgium
Bulgaria
Cyprus
Czech Republic
Denmark
Estonia
Finland
France
Germany
Greece
Hungary
Ireland
Italy
Latvia
Lithuania
Luxembourg
Malta

Page | 16
some years! Meanwhile Spain has rectified this situation by increasing its regular diesel tax.
What it is the impact of diesel rebates ?
The overall impact of the tax rebates offered by the countries mentioned in 2010 was roughly 1.2 cents per litre of commercial diesel for the EU as a whole. While private diesel is taxed on average in the EU27 at a bit over €0.43 per litre, commercial diesel is taxed at €0.42 per litre on average.
The share of commercial diesel sales in overall diesel sales is not exactly known because there is no separate registration of commercial and non-commercial diesel sales. Model estimates suggest that some 40% of diesel sold in Europe is consumed by lorries. Therefore commercial diesel tax rebate schemes reduce average diesel tax by roughly 0.5 cents a litre. Which Member States are directly affected by the EU minimum levels ?
Annex I analyses in detail which countries have been directly affected by the EU minimum tax rates, in the sense that they have had to raise fuel taxes because of the EU minimum level requirements.
It shows that seven Member States (Spain, Luxembourg, Poland, Romania, Bulgaria, Slovenia, Lithuania) have been and are very close to the minima and have had to change their rates because of EU law. Cyprus and Malta are other examples, but they are hardly relevant for fuel tourism.
Arguably the EU’s policy of setting minimum fuel taxes has been important to prevent the worst forms of diesel tourism in fuel tax havens, but it has surely not eliminated it as the Luxembourg example shows.

Page | 17
Trends in EU fuel prices and taxes In the previous sections we demonstrated the importance of keeping fuel taxes up. This section investigates whether that has happened. In order to answer that question we used a database with fuel prices, fuel taxes, inflation and fuel consumption figures since 1980. The database was developed by consultancy CE Delft in the early 1990s and since then has been regularly updated for, amongst others, the European Environment Agency’s (EEA) Transport and Environment Reporting Mechanism (TERM) reports. The last update took place in March 2011 when average fuel prices and inflation figures for the year 2010 were added, along with data for Switzerland.
Note on data sources Fuel price and tax data in the database come from on the European Commission’s Oil Bulletin (http://ec.europa.eu/energy/observatory/oil/bulletin_en.htm). Data is available for leaded premium petrol, unleaded Euro 95 and automotive diesel, and separated into pre-tax prices, excise duty and VAT. Inflation and fuel consumption data come from Eurostat. Putting these data together allows calculation of inflation-corrected, sales-weighted average (petrol plus diesel) prices and taxes over time, for each EU Member State. Annual averages are calculated by taking five quarterly data points, January, April, July and October of the year in question, and January of the next year. Sales-weighted averages for petrol and diesel have been calculated on an energy basis and the resulting prices are presented for a litre of fuel with energy content between petrol and diesel. In countries with little difference between petrol and diesel prices and a high share of petrol this can lead to the ‘weighted average’ fuel price being above the individual ones for petrol and diesel (see for example the UK graphs at the end of this report). Complete records since 1980 are only available for the nine member states that made up the EU in 1980: Germany, France, Italy, UK, Netherlands, Belgium, Ireland, Denmark and Luxembourg. Together these nine countries (still) account for two thirds of EU27 fuel consumption. EU12 data (incl. Greece, Spain and Portugal) are available as of 1986, EU15 (incl. Sweden, Finland and Austria) as of 1995, EU25 as of 2004, and EU27 (incl. Romania, Bulgaria) data as of 2007. This report presents EU9, EU15 and EU27 figures. All country-specific graphs can be found in Annex II.

Page | 18
Trends since 1980 (EU9) Graph 6: inflation-corrected sales prices of petrol and diesel in the EU9, and the sales-weighted average.
Fuel prices include VAT. Note that commercial transport does not pay VAT on its fuel and typically gets rebates on its pre-tax fuel price, so that the actually-paid average prices are somewhat lower than depicted.
The graph shows that the weighted-average fuel price in the EU9 in 2010 was €1.27 per litre, that is slightly below the peak levels of 30 years ago, when corrected for inflation. Petrol and diesel individually were slightly above early-1980s levels, but the fuel mix has shifted strongly towards (cheaper) diesel. The red line (sales-weighted average) in the graph above was quite close to petrol in 1980, but close to diesel in 2010. The share in diesel in 1980 was about one third, in 2010 it was two thirds. Next, we analyse the role fuel taxes have played in these price developments. Graph 7: trends in inflation-corrected taxes on petrol and diesel in the EU9, and the sales-weighted average.
0.00
0.20
0.40
0.60
0.80
1.00
1.20
1.40
1.60
1980 1982 1984 1986 1988 1990 1992 1994 1996 1998 2000 2002 2004 2006 2008 2010
rea
l s
ale
s p
ric
e,€
of
20
10
pe
r li
tre
diesel
petrol
weighted average
0.00
0.20
0.40
0.60
0.80
1980 1982 1984 1986 1988 1990 1992 1994 1996 1998 2000 2002 2004 2006 2008 2010
rea
l fu
el ta
x,
€(2
01
0)
pe
r li
tre
diesel
petrol
weighted average

Page | 19
This figure shows that, surprisingly, inflation-corrected, sales-weighted fuel taxes in the EU9 have gone down significantly over the last decade. They peaked in 2000 at €0.635 per litre, in 2010 they were 11 cents lower at €0.526 per litre. Commercial diesel tax rebate systems established in the mid-2000s in France and Belgium are not taken into account in these figures. Accounting for the rebates, the fall is close to 11.5 cents per litre. The graphs in annex II give country-specific figures; they indicate that, for example, fuel taxes in Italy dropped by almost a third since 1995. Inflation is the most important reason for the decline. The 2000-2010 decade saw significant inflation rates, and fuel taxes were not corrected for this in many member states. But another reason is the relentless shift towards diesel which is taxed at a lower rate. This has the effect of eroding the average tax rate. This is illustrated by the fact that the €0.11 per litre drop in weighted average fuel tax is higher than the individual drops in petrol tax (minus €0.10 per litre) and diesel tax (minus €0.06 per litre, close to €0.07 including commercial diesel tax rebates). This shift explains three cents of the drop in fuel taxes in the last decade. EU15 trends in tax rates Complete figures for the EU1512 are available for the years from 1995. The EU15’s total fuel consumption is about 85% of that of the EU27, so EU15 figures are more representative for EU-wide trends than EU9 figures. Below we sketch developments in fuel taxes in the EU15 for the 1995-2010 period. Graph 8: trends in EU15 fuel taxes since 1995
12
EU9 plus Greece, Spain, Portugal, Sweden, Finland and Austria
0.00
0.20
0.40
0.60
0.80
1980 1982 1984 1986 1988 1990 1992 1994 1996 1998 2000 2002 2004 2006 2008 2010
real fu
el ta
x, €
(2010)
per
litr
e
diesel
petrol
weightedaverage

Page | 20
This graph shows that, inflation-corrected, sales-weighted fuel taxes have gone down by more than 9 cents in the EU15, from a peak of €0.591 per litre in 1999 to €0.498 in 2010. The figures do not take into account commercial diesel tax rebates that France, Belgium and Spain established in the mid-2000s. If they were, the 2010 average fuel tax rate is €0.494, taking the drop in tax over the 1999-2010 period to 10 cents a litre. Inflation is the most important reason for the decline. Inflation in the 1999-2010 period in the EU15 was 25%. Most member states do not automatically correct fuel taxes for it. The UK, Sweden and the Netherlands are countries where, most of the time, taxes are corrected for inflation. Other countries work with much more sudden jumps. Inflation explains more than six cents of the ten-cent fall. But another reason is the relentless shift to the lower-tax diesel fuel. This explains why the average fall in fuel taxes is higher than the individual drop of petrol tax (€0.08 per litre) and diesel tax by (€0.05 per litre). In 1980 almost two thirds of fuel used in Europe was petrol, nowadays two thirds is diesel. This shift explains three cents of the 10 cents drop in fuel taxes since 1999. A third reason is the mentioned commercial diesel tax rebate systems which lowered diesel taxes by 0.5 cents a litre. Data for member states Annex II contains graphs and data for all 27 Member states. What would have happened had Europe not let tax rates fall ? This section gives an indication of what would have likely happened had governments not let fuel taxes slip but kept them constant in real terms at 1999 levels. In the chapter ‘The importance of fuel taxation’ we drew the conclusion that the price elasticity or EU road fuel demand was -0.6 i.e. 10% higher fuel prices would imply 6% lower fuel demand. Note that this elasticity can only be an indication as it does not deal with the extent to which such higher taxes would be achieved via higher taxes on petrol or on diesel. 10 cents higher fuel taxes would, including VAT, have implied a roughly 12 cents higher fuel price in 2010. Given the €1.25 weighted average fuel price this represents a 10% increase, and hence roughly 6% lower emissions. 2010 EU road transport CO2 emissions have not yet been reported but are likely to be around 900 Mtonnes. Including upstream emissions (which reduce as well if fuel consumption is reduced) this is around 1,050MT. This means that in a conservative estimate CO2 emissions would have been roughly 60 MT lower had taxes stayed at 1999 levels. At today’s (early April 2011) oil prices of €80 a barrel, the EU would have saved €11bn of oil imports, while ten cents a litre fuel tax would have raised €32bn in revenue.

Page | 21
In the earlier chapter, ‘The importance of fuel taxation’ we derived that every cent increase in fuel taxes in the EU could save 35,000 jobs if revenues were spent on lowering labour taxes. Ten cents could then have saved roughly 350,000 jobs in the EU, which would have reduced unemployment by 1.5%. Not all the revenue would actually be paid, however, because of reductions in fuel consumption that would result from higher prices. Analysis reveals that roughly one third of additional revenue from higher fuel taxes would fall away over time because of associated reductions in consumption. Two thirds would stay. Fuel tax is therefore quite effective in reducing emissions and raising revenue at the same time. On balance, since oil prices more than trebled between 1999 and 2010, the EU27’s own tax revenues from road fuels have declined by €32bn, while its oil import bill has risen by approximately €100bn.

Page | 22
Recommendations Based on findings in the previous section, this section summarises the key requirements for a new proposal from the European Commission on EU fuel taxation. The previous section found that most of the decline in fuel tax rates was due to inflation, that a second reason was she shift to diesel fuel (which is taxed at a lower rate), and a third reason was the establishment of special tax rebate schemes for so-called ‘commercial’ diesel. Therefore the priorities for the Commission’s proposal are clear: 1. Minimum tax rates should be automatically adjusted for inflation; 2. Special ‘commercial’ diesel tax rebate schemes should be abolished 3. Minimum fuel taxes, in particular for diesel, have to increase so that the
downward pressure on tax rates and the relentless shift towards the cheaper fuel stops. As a litre of diesel contains roughly 8% more carbon and energy than a litre of petrol, a litre of diesel should be taxed 8% more heavily instead of more lightly as is currently the case, otherwise a market distortion remains;

Page | 23
References
Brons M., Nijkamp P., Pels E. and Rietveld P. 2008. A meta-analysis of the price elasticity of gasoline demand. A SUR approach. Energy Economics 30: 2105-2122. Dahl C. and Sterner T. 1991. A survey of econometric gasoline demand elasticities. International Journal of Energy Systems 11: 53-76. Espey M. 1998. Gasoline demand revisited: an international meta-analysis of elasticities. Energy Economics 20: 273-295. Graham D. and Glaister S. 2002. The demand for automobile fuel: a survey of elasticities. Journal of Transport Economics and Policy 36: 1-26.

Page | 24
Annex I: Member States close to minimum tax levels
This Annex is intended to demonstrate the importance of EU minimum tax levels in avoiding a ‘race to the bottom’ in fuel taxes.
In particular this annex looks into minimum and actual tax rates for ‘commercial diesel’. Many member states have secured special clauses (‘derogations’) for minimum tax rates for commercial diesel, and currently four of them (Spain, France, Belgium and Slovenia) operate rebate schemes under which hauliers can claim back some of the fuel tax paid. Both the derogations and the rebates have been taken into account in preparing the graphs.
Spain
Spain is a special case. It introduced a commercial diesel rebate scheme in 2005, which can clearly be seen in the graph. The country was in breach of EU legislation for three years because part of the diesel tax was levied as a special regional tax (centime sanitario) which was declared illegal and can now be claimed back by haulage firms. Hence the actual commercial diesel tax paid has been below EU minima for a while. Meanwhile the situation has been repaired.
Clearly Spain closely tracks EU minimum tax levels.
0.00
0.05
0.10
0.15
0.20
0.25
0.30
0.35
1993 1995 1997 1999 2001 2003 2005 2007 2009 2011 2013
com
me
rcia
l die
sel t
ax, i
n e
uro
pe
r lit
re
minimum tax
actual tax levied

Page | 25
Luxembourg
Luxembourg is another special case – its strategic location and its very small size have caused it to be a major ‘fuel tax haven’. For years Luxembourg has closely tracked EU minimum levels. But the country will be obliged to raise its diesel tax on 1 January 2012.
Poland
The zloty dropped sharply during the crisis which took its diesel tax to the minimum level. As that minimum level went up in 2010 the country had to increase tax which it duly did. A modest new rise will have to be made on 1 January 2012.
0.00
0.05
0.10
0.15
0.20
0.25
0.30
0.35
1993 1995 1997 1999 2001 2003 2005 2007 2009 2011 2013
com
me
rcia
l die
sel t
ax, i
n e
uro
pe
r lit
re
minimum tax
actual tax levied
0.00
0.05
0.10
0.15
0.20
0.25
0.30
0.35
1993 1995 1997 1999 2001 2003 2005 2007 2009 2011 2013
com
me
rcia
l die
sel t
ax, i
n e
uro
pe
r lit
re
minimum tax
actual tax levied

Page | 26
Finland
Finland’s 2010 diesel tax level was exactly at the EU minimum, €0.33 per litre. Meanwhile the country has raised its diesel tax to €0.363 per litre though. Slovenia
Slovenia strategically located, introduced a generous (in fact the most generous of all) rebate scheme for commercial diesel in July 2009 – as a result of which road freight companies pay the EU minimum tax. As oil prices in April 2011 are high, private drivers pay diesel tax at the EU minimum as well at the time of writing.
0.00
0.05
0.10
0.15
0.20
0.25
0.30
0.35
0.40
1993 1995 1997 1999 2001 2003 2005 2007 2009 2011 2013
com
me
rcia
l die
sel t
ax, i
n e
uro
pe
r lit
re
minimum tax
actual tax levied
0.00
0.05
0.10
0.15
0.20
0.25
0.30
0.35
0.40
1993 1995 1997 1999 2001 2003 2005 2007 2009 2011 2013
com
me
rcia
l die
sel t
ax, i
n e
uro
pe
r lit
re
minimum tax
actual tax levied

Page | 27
Romania
Romania, the poorest EU Member State (jointly with Bulgaria), has also been influenced by the legislation, particularly as the leu dropped sharply in the second half of 2007 which caused the actual tax rate to go below the minimum for a while. The country will have to raise its tax rate on 1 January 2013. Bulgaria
Bulgaria’s diesel tax of €0.314 is now 1 cent away from its EU minimum of €0.302. On 1 January 2013 the country will have to increase its tax rate.
0.00
0.05
0.10
0.15
0.20
0.25
0.30
0.35
1993 1995 1997 1999 2001 2003 2005 2007 2009 2011 2013
com
me
rcia
l die
sel t
ax, i
n e
uro
pe
r lit
re
minimum tax
actual tax levied
0.00
0.05
0.10
0.15
0.20
0.25
0.30
0.35
1993 1995 1997 1999 2001 2003 2005 2007 2009 2011 2013
com
me
rcia
l die
sel t
ax, i
n e
uro
pe
r lit
re
minimum tax
actual tax levied

Page | 28
Lithuania
Finally, Lithuania is an example of a Baltic country that has closely followed EU minimum levels; it increased its tax on 1 January 2011 to just comply with its EU minimum of €0.302 per litre. Malta and Cyprus are other examples but, being islands, they are less relevant from a fuel tourism point of view, therefore we do not show their graphs. Conclusion This annex demonstrates that for at least nine EU Member States the EU minimum levels have had an influence on the diesel tax they levy for lorries. Without the minimum levels quite a few would certainly have been below minimum levels, making it difficult for the other 18 countries to stay well above.
0.00
0.05
0.10
0.15
0.20
0.25
0.30
0.35
1993 1995 1997 1999 2001 2003 2005 2007 2009 2011 2013
com
me
rcia
l die
sel t
ax, i
n e
uro
pe
r lit
re
minimum tax
actual tax levied

Page | 29
Annex II: Fuel price and tax graphs for the EU and per Member State We first show figures of the EU9 and EU15. As the time series for the EU27 is too short (only 4 years) to draw relevant conclusions we leave the EU27 out. Then we present figures per member state. 1. EU9 1.1 Real fuel prices for the EU9, 1980 to 2010
The EU9 weighted-average fuel price in 2010, at €1.27 a litre, was still slightly below peak levels of 30 years ago, when corrected for inflation. 1.2 Real fuel taxes for the EU9, 1980 to 2010
This figure shows that, surprisingly, inflation-corrected, sales-weighted fuel taxes in the EU9 have gone down significantly over the last decade. They peaked in 2000 at €0.635 per litre, in 2010 they were 11 cents lower at €0.526 per litre.
0.00
0.20
0.40
0.60
0.80
1.00
1.20
1.40
1.60
1980 1982 1984 1986 1988 1990 1992 1994 1996 1998 2000 2002 2004 2006 2008 2010
rea
l s
ale
s p
ric
e,€
of
20
10
pe
r li
tre
diesel
petrol
weighted average
0.00
0.20
0.40
0.60
0.80
1980 1982 1984 1986 1988 1990 1992 1994 1996 1998 2000 2002 2004 2006 2008 2010
rea
l fu
el ta
x,
€(2
01
0)
pe
r li
tre
diesel
petrol
weighted average

Page | 30
2. EU 15 2.1 Real fuel prices for the EU15, 1995 to 2010
This graph shows broadly similar trends as that of the EU9 – an average fuel price of €1.25 per litre, and a rise in prices since the mid-1990s. No earlier data are available. 2.2 Real fuel taxes for the EU15, 1995 to 2010
The average fuel tax levied on road fuels in the ‘old’ EU15 is €0.10 per litre lower today than it was in 1999. Average fuel tax, in 2010 prices, went down from €0.59 a litre in 1999 to €0.49 a litre in 2010. As consumption remained stable, the result was a 16% plunge in (inflation-corrected) revenues from €180bn to €152bn.
0.00
0.20
0.40
0.60
0.80
1.00
1.20
1.40
1.60
1980 1982 1984 1986 1988 1990 1992 1994 1996 1998 2000 2002 2004 2006 2008 2010
rea
l sa
les
pri
ce
,€
of
20
10 p
er
litr
e
diesel
petrol
weighted average
0.00
0.20
0.40
0.60
0.80
1980 1982 1984 1986 1988 1990 1992 1994 1996 1998 2000 2002 2004 2006 2008 2010
real fu
el
tax, €
(2010
) p
er
litr
e
diesel
petrol
weightedaverage

Page | 31
Member States 1. Austria 1.1 Real fuel prices for Austria 1994 to 2010
1.2 Real fuel taxes for Austria 1994 to 2010
Until recently Austrian fuel taxes have been stable, at quite a low level. A low point was reached in 2005 with a weighted average of €0.37 per litre. At that point Austria was a fuel tax haven, even its neighbouring new EU member states Slovakia, Slovenia, Hungary and the Czech Republic had higher diesel taxes. Diesel sales were 150% higher than a decade earlier, a clear illustration of the tax haven effect. On 1 January 2011 Austria increased its petrol taxes with 4 cents a litre for petrol and 5 cents a litre for diesel. This increase is not included in the graph and the figures. At this moment Switzerland and Germany still have higher diesel tax rates than Austria.
0.00
0.20
0.40
0.60
0.80
1.00
1.20
1.40
1.60
1980 1982 1984 1986 1988 1990 1992 1994 1996 1998 2000 2002 2004 2006 2008 2010
rea
l fu
el p
ric
e,
€(2
01
0)
pe
r li
tre
petrol
diesel
weighted average
0.00
0.20
0.40
0.60
0.80
1.00
1980 1982 1984 1986 1988 1990 1992 1994 1996 1998 2000 2002 2004 2006 2008 2010
rea
l fu
el ta
x,
€(2
01
0)/
l
petrol
diesel
weighted average

Page | 32
2. Belgium 2.1 Real fuel prices for Belgium 1980 to 2010
2.2 Real fuel taxes for Belgium 1980 to 2010
Since their peak of €0.48 per litre in 1996, fuel taxes in Belgium have fallen by 7 cents/litre or 14% to €0.41 per litre. All of this fall is due to the strong shift to diesel; neither petrol nor diesel taxes fell since 1996. These figures do not include a tax rebate for commercial diesel which was about 3.5 cents a litre in 2010 and reduces effective tax rates by roughly 1.5 cents, meaning that the fall in taxes since 1996 is 17%. Belgium is currently slowly increasing diesel taxes, it’s diesel is still cheaper than in its neighbours France and the Netherlands, but not by a large margin anymore.
0.00
0.20
0.40
0.60
0.80
1.00
1.20
1.40
1.60
1980 1982 1984 1986 1988 1990 1992 1994 1996 1998 2000 2002 2004 2006 2008 2010
rea
l fu
el p
ric
e,
€(2
01
0)
per
litr
e
petrol
diesel
weighted average
0.00
0.20
0.40
0.60
0.80
1.00
1980 1982 1984 1986 1988 1990 1992 1994 1996 1998 2000 2002 2004 2006 2008 2010
rea
l fu
el ta
x,
€(2
01
0)/
l
petrol
diesel
weighted average

Page | 33
3. Bulgaria 3.1 Real fuel prices for Bulgaria 2008 to 2010
3.2 Real fuel taxes for Bulgaria 2008 to 2010
0.00
0.20
0.40
0.60
0.80
1.00
1.20
1.40
1.60
1980 1982 1984 1986 1988 1990 1992 1994 1996 1998 2000 2002 2004 2006 2008 2010
rea
l fu
el p
ric
e,
€(2
01
0)
per
litr
e
petrol
diesel
weighted average
0.00
0.20
0.40
0.60
0.80
1.00
1980 1982 1984 1986 1988 1990 1992 1994 1996 1998 2000 2002 2004 2006 2008 2010
rea
l fu
el ta
x,
€(2
01
0)/
l
petrol
diesel
weighted average
Page | 34
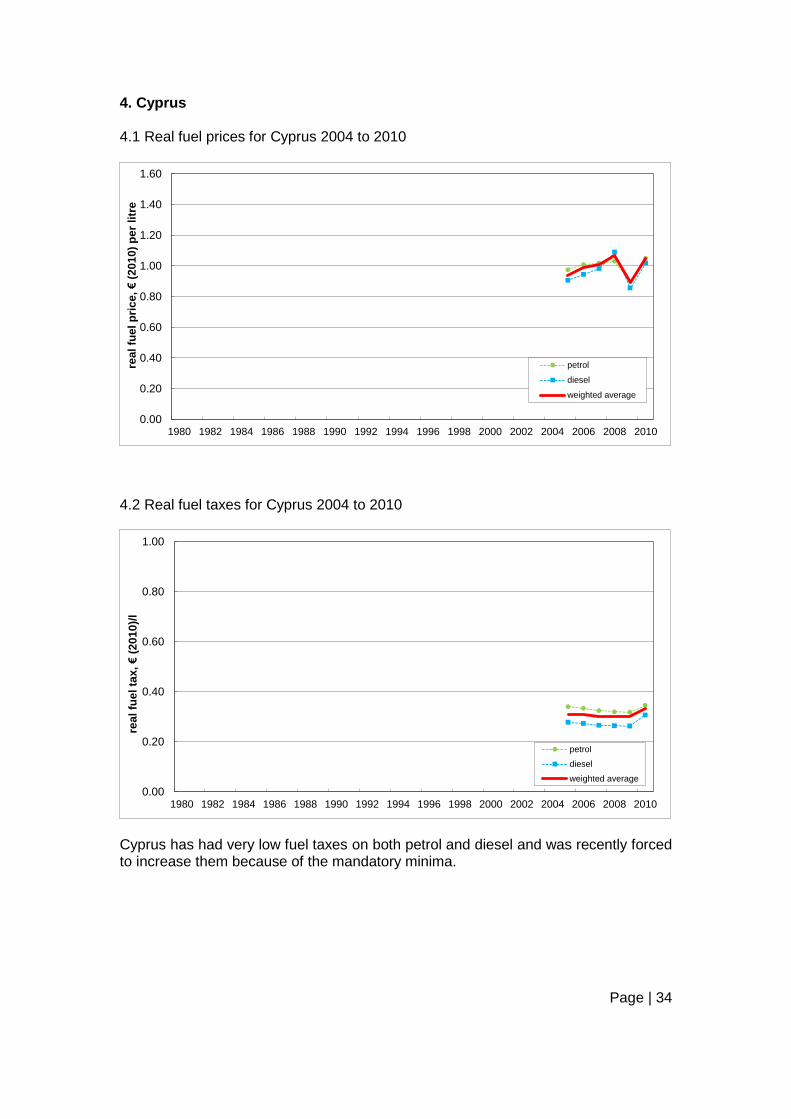
4. Cyprus 4.1 Real fuel prices for Cyprus 2004 to 2010
4.2 Real fuel taxes for Cyprus 2004 to 2010
Cyprus has had very low fuel taxes on both petrol and diesel and was recently forced to increase them because of the mandatory minima.
0.00
0.20
0.40
0.60
0.80
1.00
1.20
1.40
1.60
1980 1982 1984 1986 1988 1990 1992 1994 1996 1998 2000 2002 2004 2006 2008 2010
rea
l fu
el p
ric
e,
€(2
01
0)
per
litr
e
petrol
diesel
weighted average
0.00
0.20
0.40
0.60
0.80
1.00
1980 1982 1984 1986 1988 1990 1992 1994 1996 1998 2000 2002 2004 2006 2008 2010
rea
l fu
el ta
x,
€(2
01
0)/
l
petrol
diesel
weighted average

Page | 35
5. Czech Republic 5.1 Real fuel prices for Czech Republic 2004 to 2010
5.2 Real fuel taxes for Czech Republic 2004 to 2010
In the Czech Republic fuel taxes have increased by 5 cents a litre since 2004, not forced by EU minimum levels.
0.00
0.20
0.40
0.60
0.80
1.00
1.20
1.40
1.60
1980 1982 1984 1986 1988 1990 1992 1994 1996 1998 2000 2002 2004 2006 2008 2010
rea
l fu
el p
ric
e,
€(2
01
0)
per
litr
e
petrol
diesel
weighted average
0.00
0.20
0.40
0.60
0.80
1.00
1980 1982 1984 1986 1988 1990 1992 1994 1996 1998 2000 2002 2004 2006 2008 2010
rea
l fu
el ta
x,
€(2
01
0)/
l
petrol
diesel
weighted average

Page | 36
6. Denmark 6.1 Real fuel prices for Denmark 1980 to 2010
6.2 Real fuel taxes for Denmark 1980 to 2010
Denmark’s fuel tax policy was turbulent in the 1980s and 1990s. After a strong increase in fuel taxes in 1986, reacting to lower oil prices, Denmark drastically cut petrol taxes between 1988 and 1992, and increased them back again between 1994 and 1996. In real terms, fuel taxes peaked in 2001 at 55 cents a litre and have since dropped to 47 cents, an 8 cents or 15% decline. Denmark’s taxes are lower than those of its neighbours Germany and Sweden.
0.00
0.20
0.40
0.60
0.80
1.00
1.20
1.40
1.60
1980 1982 1984 1986 1988 1990 1992 1994 1996 1998 2000 2002 2004 2006 2008 2010
rea
l fu
el p
ric
e,
€(2
01
0)
per
litr
e
petrol
diesel
weighted average
0.00
0.20
0.40
0.60
0.80
1.00
1980 1982 1984 1986 1988 1990 1992 1994 1996 1998 2000 2002 2004 2006 2008 2010
rea
l fu
el ta
x,
€(2
01
0)/
l
petrol
diesel
weighted average

Page | 37
7. Estonia 7.1 Real fuel prices for Estonia 2004 to 2010
7.2 Real fuel taxes for Estonia 2004 to 2010
0.00
0.20
0.40
0.60
0.80
1.00
1.20
1.40
1.60
1980 1982 1984 1986 1988 1990 1992 1994 1996 1998 2000 2002 2004 2006 2008 2010
rea
l fu
el p
ric
e,
€(2
01
0)
per
litr
e
petrol
diesel
weighted average
0.00
0.20
0.40
0.60
0.80
1.00
1980 1982 1984 1986 1988 1990 1992 1994 1996 1998 2000 2002 2004 2006 2008 2010
rea
l fu
el ta
x,
€(2
01
0)/
l
petrol
diesel
weighted average

Page | 38
8. Finland 8.1 Real fuel prices for Finland 1996 to 2010
8.2 Real fuel taxes for Finland 1996 to 2010
Fuel taxes peaked in 1998 at 56 cents a litre. Since then they decreased by 11 cents to 45 cents a litre, or -20%. Together with the Netherlands Finland is the country with the largest gap in tax between petrol and diesel. Finland’s diesel tax is at the EU minimum rate of €0.33 per litre.
0.00
0.20
0.40
0.60
0.80
1.00
1.20
1.40
1.60
1980 1982 1984 1986 1988 1990 1992 1994 1996 1998 2000 2002 2004 2006 2008 2010
rea
l fu
el p
ric
e,
€(2
01
0)
per
litr
e
petrol
diesel
weighted average
0.00
0.20
0.40
0.60
0.80
1.00
1980 1982 1984 1986 1988 1990 1992 1994 1996 1998 2000 2002 2004 2006 2008 2010
rea
l fu
el ta
x,
€(2
01
0)/
l
petrol
diesel
weighted average

Page | 39
9. France 9.1 Real fuel prices for France 1980 to 2010
9.2 Real fuel taxes for France 1980 to 2010
Since their peak in 1999 of 57 cents per litre fuel taxes in France have fallen by 11 cents to 46 cents a litre, or -19%. The this figure and the graph does not include a 3.6 cents tax rebate for commercial diesel which takes the average tax in 2010 to 44 cents, a total tax reduction of 21%. Diesel tourism in Spain and Luxembourg is a concern in France.
0.00
0.20
0.40
0.60
0.80
1.00
1.20
1.40
1.60
1980 1982 1984 1986 1988 1990 1992 1994 1996 1998 2000 2002 2004 2006 2008 2010
rea
l fu
el p
ric
e,
€(2
01
0)
per
litr
e
petrol
diesel
weighted average
0.00
0.20
0.40
0.60
0.80
1.00
1980 1982 1984 1986 1988 1990 1992 1994 1996 1998 2000 2002 2004 2006 2008 2010
rea
l fu
el ta
x,
€(2
01
0)/
l
petrol
diesel
weighted average

Page | 40
10. Germany 10.1 Real fuel prices for Germany 1980 to 2010
10.2 Real fuel taxes for Germany 1980 to 2010
Germany had two episodes of increases in fuel taxes, one in the early 1990s (revenues were needed for reunification), and another one under the red-green government in 1999-2003 as part of a deliberate environmental tax reform, the biggest if its kind in Europe. Rates have since then remained unchanged, which means that since 2003, fuel taxes in Germany have fallen from 64 to 55 cents a litre, or -14%. The most important reason was inflation, and dieselisation also played a role.
0.00
0.20
0.40
0.60
0.80
1.00
1.20
1.40
1.60
1980 1982 1984 1986 1988 1990 1992 1994 1996 1998 2000 2002 2004 2006 2008 2010
rea
l fu
el p
ric
e,
€(2
01
0)
per
litr
e
petrol
diesel
weighted average
0.00
0.20
0.40
0.60
0.80
1.00
1980 1982 1984 1986 1988 1990 1992 1994 1996 1998 2000 2002 2004 2006 2008 2010
rea
l fu
el ta
x,
€(2
01
0)/
l
petrol
diesel
weighted average

Page | 41
11. Greece 11.1 Real fuel prices for Greece 1982 to 2010
11.2 Real fuel taxes for Greece 1982 to 2010
Greece was the country that raised fuel taxes most dramatically as part of an austerity package, by 27 cents a litre for petrol and 11 cents a litre for diesel. In real terms fuel taxes are more or less back to previous (1993) peak levels. Greece had to raise diesel taxes strongly from its almost-zero level in 1990, and had to change its VAT rates too; it levied 36% on petrol and 8% on diesel until 1992 when both rates became 18%. Other factors in the wild swings were inflation and depreciation of the drachme.
0.00
0.20
0.40
0.60
0.80
1.00
1.20
1.40
1.60
1980 1982 1984 1986 1988 1990 1992 1994 1996 1998 2000 2002 2004 2006 2008 2010
rea
l fu
el p
ric
e,
€(2
01
0)
per
litr
e
petrol
diesel
weighted average
0.00
0.20
0.40
0.60
0.80
1.00
1980 1982 1984 1986 1988 1990 1992 1994 1996 1998 2000 2002 2004 2006 2008 2010
rea
l fu
el ta
x,
€(2
01
0)/
l
petrol
diesel
weighted average

Page | 42
12. Hungary 12.1 Real fuel prices for Hungary 2004 to 2010
12.2 Real fuel taxes for Hungary 2004 to 2010
Hungary is one of the few CEE countries where fuel taxes have dropped, by roughly 20% since 2005, from 50 to 40 cents a litre. Nominal rates hardly changed except for an increase in 2010 which means the fall in tax rates is largely caused by inflation and the associated 10% depreciation of the forint compared to the euro. The figures do not take into account the 2.5 cents rebate for commercial diesel which was introduced on 1 January 2011. This takes the commercial diesel tax to only two cents above the EU minimum and cuts average fuel tax paid to about 39 cents.
0.00
0.20
0.40
0.60
0.80
1.00
1980 1982 1984 1986 1988 1990 1992 1994 1996 1998 2000 2002 2004 2006 2008 2010
rea
l fu
el ta
x,
€(2
01
0)/
l
petrol
diesel
weighted average

Page | 43
13. Ireland 13.1 Real fuel prices for Ireland 1980 to 2010
13.2 Real fuel taxes for Ireland 1980 to 2010
Just like Greece, Ireland also increased its fuel taxes in its austerity drive, but by more timid amounts. Taxes peaked as early as 1988 at 59 cents per litre, and are now still 14% below that peak at 51 cents. But they are significantly above the rates of a decade ago which were among the lowest in Western Europe. In 2000-2002, the difference in diesel tax rates in Ireland and its neighbour Northern Ireland, part of the UK, approached a whopping 60 cents a litre.
0.00
0.20
0.40
0.60
0.80
1.00
1.20
1.40
1.60
1980 1982 1984 1986 1988 1990 1992 1994 1996 1998 2000 2002 2004 2006 2008 2010
rea
l fu
el p
ric
e,
€(2
01
0)
per
litr
e
petrol
diesel
weighted average
0.00
0.20
0.40
0.60
0.80
1.00
1980 1982 1984 1986 1988 1990 1992 1994 1996 1998 2000 2002 2004 2006 2008 2010
rea
l fu
el ta
x,
€(2
01
0)/
l
petrol
diesel
weighted average

Page | 44
14. Italy 14.1 Real fuel prices for Italy 1980 to 2010
14.2 Real fuel taxes for Italy 1980 to 2010
Italy has a quite exceptional history in fuel taxation – for a long time it had one of the lowest diesel taxes and one of the highest petrol taxes in Europe and by far the widest gap between them. As a result of continued increases in diesel tax between 1982 and 1995, average taxes peaked in 1995 at 67 cents a litre. They have since fallen back by a massive 31% to 46 cents, largely due to inflation and non-adjustment of nominal rates, but also due to dieselisation.
0.00
0.20
0.40
0.60
0.80
1.00
1.20
1.40
1.60
1980 1982 1984 1986 1988 1990 1992 1994 1996 1998 2000 2002 2004 2006 2008 2010
rea
l fu
el p
ric
e,
€(2
01
0)
per
litr
e
petrol
diesel
weighted average
0.00
0.20
0.40
0.60
0.80
1.00
1980 1982 1984 1986 1988 1990 1992 1994 1996 1998 2000 2002 2004 2006 2008 2010
rea
l fu
el ta
x,
€(2
01
0)/
l
petrol
diesel
weighted average

Page | 45
15. Latvia 15.1 Real fuel prices for Latvia 2004 to 2010
15.2 Real fuel taxes for Latvia 2004 to 2010
0.00
0.20
0.40
0.60
0.80
1.00
1.20
1.40
1.60
1980 1982 1984 1986 1988 1990 1992 1994 1996 1998 2000 2002 2004 2006 2008 2010
rea
l fu
el p
ric
e,
€(2
01
0)
per
litr
e
petrol
diesel
weighted average
0.00
0.20
0.40
0.60
0.80
1.00
1980 1982 1984 1986 1988 1990 1992 1994 1996 1998 2000 2002 2004 2006 2008 2010
rea
l fu
el ta
x,
€(2
01
0)/
l
petrol
diesel
weighted average

Page | 46
16. Lithuania 16.1 Real fuel prices for Lithuania 2004 to 2010
16.2 Real fuel taxes for Lithuania 2004 to 2010
Of the Baltic states, Lithuania is the country most closely following minimum diesel tax rates.
0.00
0.20
0.40
0.60
0.80
1.00
1.20
1.40
1.60
1980 1982 1984 1986 1988 1990 1992 1994 1996 1998 2000 2002 2004 2006 2008 2010
rea
l fu
el p
ric
e,
€(2
01
0)
per
litr
e
petrol
diesel
weighted average
0.00
0.20
0.40
0.60
0.80
1.00
1980 1982 1984 1986 1988 1990 1992 1994 1996 1998 2000 2002 2004 2006 2008 2010
rea
l fu
el ta
x,
€(2
01
0)/
l
petrol
diesel
weighted average

Page | 47
17. Luxemburg 17.1 Real fuel prices for Luxemburg 1980 to 2010
17.2 Real fuel taxes for Luxemburg 1980 to 2010
Luxembourg is the richest EU Member State, is small, strategically located, and has one of the lowest fuel tax rates, leading to massive fuel tourism as the main text of this report shows. Luxembourg’s fuel taxes peaked in 1995 at 43 cents and have since decreased by 23% to 33 cents, largely as a result of strong dieselisation caused by the strong increase in foreign lorries visiting the country to fill up.
0.00
0.20
0.40
0.60
0.80
1.00
1.20
1.40
1.60
1980 1982 1984 1986 1988 1990 1992 1994 1996 1998 2000 2002 2004 2006 2008 2010
rea
l fu
el p
ric
e,
€(2
01
0)
per
litr
e
petrol
diesel
weighted average
0.00
0.20
0.40
0.60
0.80
1.00
1980 1982 1984 1986 1988 1990 1992 1994 1996 1998 2000 2002 2004 2006 2008 2010
rea
l fu
el ta
x,
€(2
01
0)/
l
petrol
diesel
weighted average

Page | 48
18. Malta 18.1 Real fuel prices for Malta 2004 to 2010
18.2 Real fuel taxes for Malta 2004 to 2010
Just like Cyprus, Malta has had low taxes on petrol and diesel and the island has had to raise its tax rates because of the EU minima.
0.00
0.20
0.40
0.60
0.80
1.00
1.20
1.40
1.60
1980 1982 1984 1986 1988 1990 1992 1994 1996 1998 2000 2002 2004 2006 2008 2010
rea
l fu
el p
ric
e,
€(2
01
0)
per
litr
e
petrol
diesel
weighted average
0.00
0.20
0.40
0.60
0.80
1.00
1980 1982 1984 1986 1988 1990 1992 1994 1996 1998 2000 2002 2004 2006 2008 2010
rea
l fu
el ta
x,
€(2
01
0)/
l
petrol
diesel
weighted average

Page | 49
19. The Netherlands 19.1 Real fuel prices for the Netherlands 1980 to 2010
19.2 Real fuel taxes for the Netherlands 1980 to 2010
The Netherlands often, but not always, adjust their fuel taxes for inflation, which has kept them relatively stable. Still, since 1998 average tax dropped by 8%, from 59 to 54 cents a litre, largely as a result of dieselisation. Together with Finland the Netherlands is one of the countries with the largest gap between petrol and diesel taxes.
0.00
0.20
0.40
0.60
0.80
1.00
1.20
1.40
1.60
1980 1982 1984 1986 1988 1990 1992 1994 1996 1998 2000 2002 2004 2006 2008 2010
rea
l fu
el p
ric
e,
€(2
01
0)
per
litr
e
petrol
diesel
weighted average
0.00
0.20
0.40
0.60
0.80
1.00
1980 1982 1984 1986 1988 1990 1992 1994 1996 1998 2000 2002 2004 2006 2008 2010
rea
l fu
el ta
x,
€(2
01
0)/
l
petrol
diesel
weighted average

Page | 50
20. Poland 20.1 Real fuel prices for Poland 2004 to 2010
20.2 Real fuel taxes for Poland 2004 to 2010
0.00
0.20
0.40
0.60
0.80
1.00
1.20
1.40
1.60
1980 1982 1984 1986 1988 1990 1992 1994 1996 1998 2000 2002 2004 2006 2008 2010
rea
l fu
el p
ric
e,
€(2
01
0)
per
litr
e
petrol
diesel
weighted average
0.00
0.20
0.40
0.60
0.80
1.00
1980 1982 1984 1986 1988 1990 1992 1994 1996 1998 2000 2002 2004 2006 2008 2010
rea
l fu
el ta
x,
€(2
01
0)/
l
petrol
diesel
weighted average

Page | 51
21. Portugal 21.1 Real fuel prices for Portugal 1986 to 2010
Portugal is the only country where pump prices did not rise sharply in 2000 because of a short-lived experiment with petrol-price stabilising taxation – see below. Prices increased a bit later anyway when the system had to be abandoned. 21.2 Real fuel taxes for Portugal 1986 to 2010
Portugal has seen quite wild swings in tax rates, partly due to exchange rate fluctuations and associated inflation, but also policy–induced. The country briefly experimented with a petrol price stabiliser in 1999-2001 that was abandoned when oil prices began to rise strongly. Despite strong austerity needs, the country feels limited in its ability to raise commercial diesel taxes because of its long border with low-tax Spain.
0.00
0.20
0.40
0.60
0.80
1.00
1.20
1.40
1.60
1980 1982 1984 1986 1988 1990 1992 1994 1996 1998 2000 2002 2004 2006 2008 2010
rea
l fu
el p
ric
e,
€(2
01
0)
per
litr
e
petrol
diesel
weighted average
0.00
0.20
0.40
0.60
0.80
1.00
1980 1982 1984 1986 1988 1990 1992 1994 1996 1998 2000 2002 2004 2006 2008 2010
rea
l fu
el ta
x,
€(2
01
0)/
l
petrol
diesel
weighted average

Page | 52
22. Romania 22.1 Real fuel prices for Romania 2008 to 2010
22.2 Real fuel taxes for Romania 2008 to 2010
0.00
0.20
0.40
0.60
0.80
1.00
1.20
1.40
1.60
1980 1982 1984 1986 1988 1990 1992 1994 1996 1998 2000 2002 2004 2006 2008 2010
rea
l fu
el p
ric
e,
€(2
01
0)
per
litr
e
petrol
diesel
weighted average
0.00
0.20
0.40
0.60
0.80
1.00
1980 1982 1984 1986 1988 1990 1992 1994 1996 1998 2000 2002 2004 2006 2008 2010
rea
l fu
el ta
x,
€(2
01
0)/
l
petrol
diesel
weighted average

Page | 53
23. Slovakia 23.1 Real fuel prices for Slovakia 2004 to 2010
23.2 Real fuel taxes for Slovakia 2004 to 2010
Slovakia was the only country so far that decided to quite drastically (11.3 cents) lower its diesel taxes (including those for cars), when it introduced its kilometre charging system for lorries in January 2010. It upped diesel tax again by 3.5 cents in January 2011, leaving the net drop to be eight cents.
0.00
0.20
0.40
0.60
0.80
1.00
1.20
1.40
1.60
1980 1982 1984 1986 1988 1990 1992 1994 1996 1998 2000 2002 2004 2006 2008 2010
rea
l fu
el p
ric
e,
€(2
01
0)
per
litr
e
petrol
diesel
weighted average
0.00
0.20
0.40
0.60
0.80
1.00
1980 1982 1984 1986 1988 1990 1992 1994 1996 1998 2000 2002 2004 2006 2008 2010
rea
l fu
el ta
x,
€(2
01
0)/
l
petrol
diesel
weighted average

Page | 54
24. Slovenia 24.1 Real fuel prices for Slovenia 2004 to 2010
24.2 Real fuel taxes for Slovenia 2004 to 2010
Slovenia can adapt fuel taxes every two weeks, in an attempt to stabilise pump prices. As a result the diesel tax for car drivers in went up in 2009 by 10 cents a litre. The graph does not show the fact that on 1 July 2009 the country introduced a tax rebate for commercial diesel which ensures that lorries over 7.5 tonnes always pay the EU minimum rate of €0.33 per litre. In 2010 this rebate amounted to 10 cents litre which is the highest commercial diesel tax rebate in the EU. This makes Slovenia at this moment the commercial diesel tax haven it its region; all its neighbours charge higher rates. Hungary is close, however. In March 2011 Slovenia drastically reduced private diesel tax as well, taking both private and commercial diesel tax back to the EU minimum.
0.00
0.20
0.40
0.60
0.80
1.00
1.20
1.40
1.60
1980 1982 1984 1986 1988 1990 1992 1994 1996 1998 2000 2002 2004 2006 2008 2010
rea
l fu
el p
ric
e,
€(2
01
0)
per
litr
e
petrol
diesel
weighted average
0.00
0.20
0.40
0.60
0.80
1.00
1980 1982 1984 1986 1988 1990 1992 1994 1996 1998 2000 2002 2004 2006 2008 2010
rea
l fu
el ta
x,
€(2
01
0)/
l
petrol
diesel
weighted average

Page | 55
25. Spain 25.1 Real fuel prices for Spain 1986 to 2010
25.2 Real fuel taxes for Spain 1986 to 2010
Spain is the only large ‘old’ member state that sets its commercial diesel tax rates close to the mandatory minimum. This raises diesel tourism concerns in its neighbours Portugal and France. The graph does not contain the impact of a national 2.9 cents rebate for commercial diesel. Since a peak in 1992 tax rates dropped by 25%, from 47 to 35 cents a litre, largely because of non-adjustment to inflation.
0.00
0.20
0.40
0.60
0.80
1.00
1.20
1.40
1.60
1980 1982 1984 1986 1988 1990 1992 1994 1996 1998 2000 2002 2004 2006 2008 2010
rea
l fu
el p
ric
e,
€(2
01
0)
per
litr
e
petrol
diesel
weighted average
0.00
0.20
0.40
0.60
0.80
1.00
1980 1982 1984 1986 1988 1990 1992 1994 1996 1998 2000 2002 2004 2006 2008 2010
rea
l fu
el ta
x,
€(2
01
0)/
l
petrol
diesel
weighted average

Page | 56
26. Sweden 26.1 Real fuel prices for Sweden 1995 to 2010
26.2 Real fuel taxes for Sweden 1995 to 2010
Swedish fuel taxes were 12% below 1998 levels in 2010, dropping from 59 to 52 cents a litre. Half of that, 6%, is explained by a drop in exchange rate. Sweden has tried to slowly close the tax gap between petrol and diesel. The strong changes in 2009 and 2010 were largely due to changes in exchange rate.
0.00
0.20
0.40
0.60
0.80
1.00
1.20
1.40
1.60
1980 1982 1984 1986 1988 1990 1992 1994 1996 1998 2000 2002 2004 2006 2008 2010
rea
l fu
el p
ric
e,
€(2
01
0)
per
litr
e
petrol
diesel
weighted average
0.00
0.20
0.40
0.60
0.80
1.00
1980 1982 1984 1986 1988 1990 1992 1994 1996 1998 2000 2002 2004 2006 2008 2010
rea
l fu
el ta
x,
€(2
01
0)/
l
petrol
diesel
weighted average

Page | 57
27. United Kingdom 27.1 Real fuel prices for the United Kingdom 1980 to 2010
27.2 Real fuel taxes for the United Kingdom 1980 to 2010
In 1993 the UK Conservative government introduced a fuel duty escalator that increased fuel tax rates by first 3% and later 5% a year in real terms. That policy ended in 2000; when tax had reached 98 cents a litre, more than twice the 1990 level of 45 cents (which at the time was one of the lowest in Europe). Primarily due to falling sterling (-29% between 2000 and 2010), UK tax rates in 2010 have dropped by 32% below their 2000 peak, to 66 cents. The UK is also the only EU member state which does not tax a litre of diesel at a lower rate than a litre of petrol. It has had that policy for 20 years now. It might seem a mistake that regularly the weighted average fuel prices and taxes are above the prices and taxes of both petrol and diesel separately. It is not, because the weighted average fuel price is given for a fuel with an energy density between petrol and diesel. Therefore, the average can be above individual prices when petrol represents a majority of sales and sales prices of petrol and diesel are roughly equal.
0.00
0.20
0.40
0.60
0.80
1.00
1.20
1.40
1.60
1980 1982 1984 1986 1988 1990 1992 1994 1996 1998 2000 2002 2004 2006 2008 2010
rea
l fu
el p
ric
e,
€(2
01
0)
per
litr
e
petrol
diesel
weighted average
0.00
0.20
0.40
0.60
0.80
1.00
1980 1982 1984 1986 1988 1990 1992 1994 1996 1998 2000 2002 2004 2006 2008 2010
rea
l fu
el ta
x,
€(2
01
0)/
l
petrol
diesel
weighted average

Page | 58
28. Switzerland 28.1 Real fuel prices for Switzerland 1996 to 2010
28.2 Real fuel taxes for Switzerland 1996 to 2010
Switzerland is the only country in Europe that taxes a litre of diesel more heavily than a litre of petrol, if only slightly. Nominal tax rates have hardly changed; the fluctuations are mostly due to changes in exchange rate. Data for 2010 are not yet available but the more than 10% appreciation of the Swiss franc will likely have pushed Swiss tax levels to around 55 cents a litre.
0.00
0.20
0.40
0.60
0.80
1.00
1.20
1.40
1996 1998 2000 2002 2004 2006 2008 2010
real fu
el p
rice, €
(2010)
pe
r li
tre
petrol diesel
0.00
0.10
0.20
0.30
0.40
0.50
0.60
1996 1998 2000 2002 2004 2006 2008 2010
rea
l fu
el ta
x, €
(20
10
)/l
petrol
diesel