Dr Deepak Sharma, MD, DNB (Neonatology) is fellow of neonatology and researcher

What explains DRG upcoding in neonatology? Theroles of financial incentives and infant health
Hendrik Jurgesa and Juliane Koberleinb
aCorresponding Author, Schumpeter School of Business and Economics, University of Wuppertal,Rainer-Gruenter-Str. 21 (FN), 42119 Wuppertal, Germany, [email protected]
bSchumpeter School of Business and Economics, University of Wuppertal, Rainer-Gruenter-Str. 21 (FN),42119 Wuppertal, Germany, [email protected]
April 21, 2015
Abstract
We use the introduction of diagnosis related groups (DRGs) in German neonatology tostudy the determinants of upcoding. Since 2003, reimbursement is based inter alia on birthweight, with substantial discontinuities at eight thresholds. These discontinuities create incen-tives to upcode preterm infants into classes of lower birth weight. Using data from the Germanbirth statistics 1996 to 2010 and German hospital data from 2006 to 2011, we show that (1)since the introduction of DRGs, hospitals have upcoded at least 12,000 preterm infants andgained additional reimbursement in excess of 100 million Euro; (2) upcoding rates are system-atically higher at thresholds with larger reimbursement hikes and in hospitals that subsequentlytreat preterm infants, i.e. where the gains accrue; (3) upcoding is systematically linked withnewborn health conditional on birth weight. Doctors and midwives respond to financial incen-tives by not upcoding newborns with low survival probabilities, and by upcoding infants withhigher expected treatment costs.
JEL classification: I11, I18, D20
Keywords: Neonatal care, DRG upcoding
Acknowledgements: An earlier version of this paper has been circulated under the title: “First do no harm,then do not cheat: DRG upcoding in German neonatology”. We are grateful to two anonymous reviewers,participants at the conference on “Empirical Health Economics” at Ifo/mea/University of Munich, the PhD-Seminar on Health Economics and Policy, Grindelwald, the meeting of the Health Economics Section of theGerman Economic Association, especially our discussant Hans-Helmut Konig, and seminar participants atMannheim and Kassel University for helpful comments and suggestions.
1

1 Introduction and Background
In the last two decades many industrialized countries have introduced prospective payment sys-
tems for the reimbursement of hospital inpatient care based on so-called diagnosis-related groups
(DRGs). By paying a flat amount conditional on patient characteristics to health care providers,
such payment systems generally aim at a more efficient allocation of resources in health care (Ellis
and McGuire, 1993). Payment according to DRGs limits hospitals’ incentives to provide unnec-
essary treatment and reduces average length of stay. Further, DRGs foster internal transparency,
allowing hospitals to specialize in areas where they are relatively efficient, i.e. where actual treat-
ment costs are below the flat reimbursement rates. They also foster external transparency, allowing
comparisons across hospitals in terms of quality and efficiency, conditional on morbidity (mea-
sured by the hospital’s “case-mix index”).
However, payment by DRGs may also have unintended consequences. For instance, providers
may have an incentive for an inappropriately early discharge of patients, thereby shifting costs to
other sectors (e.g. rehabilitation or long-term care) or private households. Further, medically nec-
essary diagnostics and therapies may be withheld to save costs. Conditional on DRGs, hospitals
may have an incentive to select patients with expected costs lower than the DRG payment and to
turn down patients with higher expected costs. Finally, payment by DRGs invites the coding of
patients into groups with a higher reimbursement, so-called upcoding.
DRG upcoding can take various forms. Patients are usually coded into their DRGs by
specialist coders based on medical charts and using special coding software. At the coder level,
there are legal, semi-legal and illegal types of upcoding. Legal types include just better coding (i.e.
less downcoding), such as adding existing co-morbidities that raise treatment costs. Semi-legal
types include changing the primary and secondary diagnosis in case of co-morbidities. Illegal
types include adding co-morbidities that are not documented in the medical charts. Semi-legal and
illegal types can in principle be detected in audits.
2

Yet another variant is false documentation, i.e. the manipulation of patient charts so that
patients appear to be sicker than they really are. This type of upcoding is particularly interesting.
First, it is not done by some revenue-maximizing manager in the hospital administration who
usually has no contact with patients but by doctors or nurses. Second, manipulation of patient
charts can hardly be detected by audits, especially the type of upcoding studied in this paper,
where we estimate the extent and the determinants of DRG upcoding in German neonatal care.
Birth weight is one of the primary classification criteria in the German DRG system, with lower
birth weights yielding substantially larger payments particularly for the care of infants with very
or extremely low birth weight. Differences in birth weight of a few grams can induce additional
payments of more than 15,000 Euro (20,000 USD). Thus the financial incentives to manipulate
documented birth weight by a few grams can be strong. At the same time, false documentation
of birth weights (within reasonable limits) is practically non-verifiable ex post because infants
generally lose some 10% of their initial weight in the first few days after birth. Thus the only
restraint to unfettered upcoding are the personal or professional ethics of the health care workers
in charge of measuring newborn weight.
In our paper, we document widespread upcoding in German neonatology in the form of
shifting birth weights from just above DRG-relevant thresholds to just below these thresholds. This
phenomenon was first documented in Abler et al. (2011), who compare birth weight distributions
in the German federal state of North Rhine-Westphalia before and after the introduction of DRGs
in 2003. We extend this analysis in numerous dimensions. First, we use data from all births
in Germany since 1996. We show that, in the first eight years after the inception of DRGs, an
estimated 12,000 newborns have been upcoded into lower birth weight categories. Second, we
estimate the excess reimbursement due to upcoding. We find that hospitals unfairly received nearly
115m Euro (150m USD) between 2003 and 2010. Third, we analyze economic determinants of
upcoding, such as the strength of financial incentives.1 In international comparison, Germany has
1In an earlier version of this paper, we also study (1) the role of hospital ownership and (2) the role of regionalmarket conditions (number of NICU beds versus potential demand). Casual reasoning predicts that for-profit hospitalsshould engage more in upcoding practices because managers have stronger incentives to maximize cash-flow (Sloanet al., 2001). Indeed, using Medicare claims data from the 1990s, Silverman and Skinner (2004) estimate that upcoding
3
a very high number of neonatal care units (so-called perinatal centers) and the average number of
patients per unit is comparatively small (Gerber et al., 2008). Thus competition among providers
may be strong. Considering the high fixed costs of setting up a neonatal care unit, average costs
can be high and some hospitals suffer from substantial underfunding in neonatal care (Hoehn et al.,
2008; Muller et al., 2007). This underfunding can be compensated by coding newborns into higher
paying categories. A detailed description of the DRGs that apply to German neonatology and their
incentives for upcoding is given in the next section.
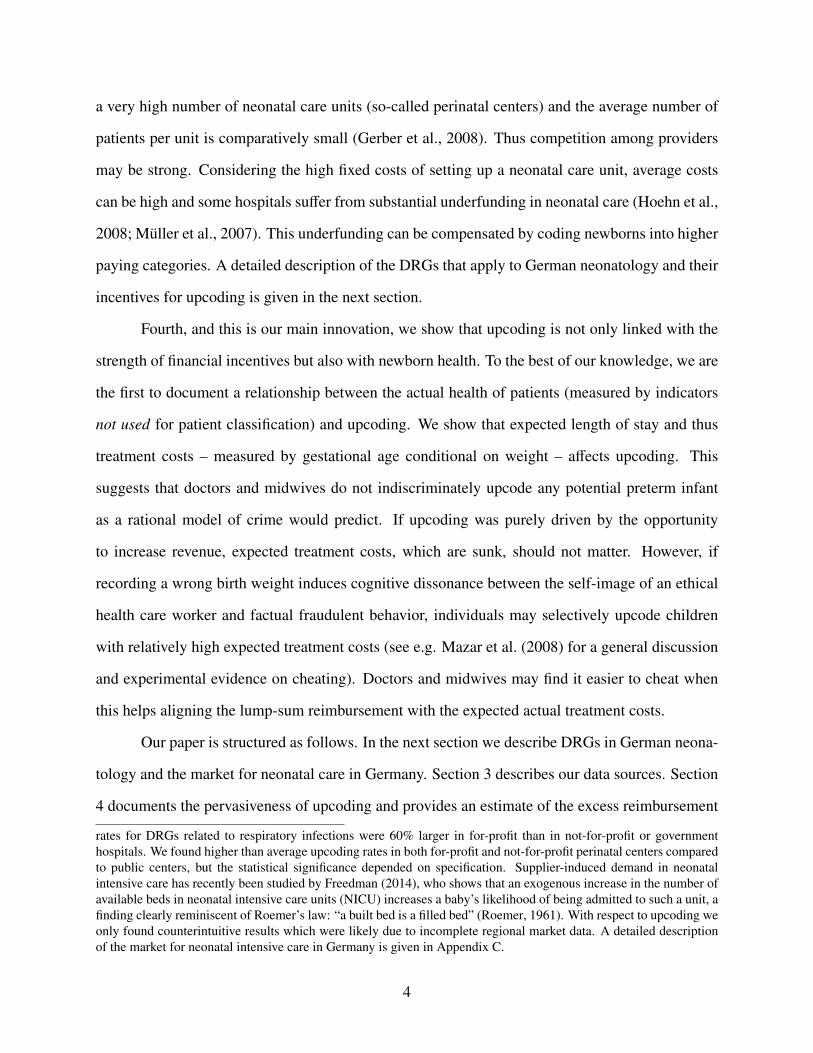
Fourth, and this is our main innovation, we show that upcoding is not only linked with the
strength of financial incentives but also with newborn health. To the best of our knowledge, we are
the first to document a relationship between the actual health of patients (measured by indicators
not used for patient classification) and upcoding. We show that expected length of stay and thus
treatment costs – measured by gestational age conditional on weight – affects upcoding. This
suggests that doctors and midwives do not indiscriminately upcode any potential preterm infant
as a rational model of crime would predict. If upcoding was purely driven by the opportunity
to increase revenue, expected treatment costs, which are sunk, should not matter. However, if
recording a wrong birth weight induces cognitive dissonance between the self-image of an ethical
health care worker and factual fraudulent behavior, individuals may selectively upcode children
with relatively high expected treatment costs (see e.g. Mazar et al. (2008) for a general discussion
and experimental evidence on cheating). Doctors and midwives may find it easier to cheat when
this helps aligning the lump-sum reimbursement with the expected actual treatment costs.
Our paper is structured as follows. In the next section we describe DRGs in German neona-
tology and the market for neonatal care in Germany. Section 3 describes our data sources. Section
4 documents the pervasiveness of upcoding and provides an estimate of the excess reimbursement
rates for DRGs related to respiratory infections were 60% larger in for-profit than in not-for-profit or governmenthospitals. We found higher than average upcoding rates in both for-profit and not-for-profit perinatal centers comparedto public centers, but the statistical significance depended on specification. Supplier-induced demand in neonatalintensive care has recently been studied by Freedman (2014), who shows that an exogenous increase in the number ofavailable beds in neonatal intensive care units (NICU) increases a baby’s likelihood of being admitted to such a unit, afinding clearly reminiscent of Roemer’s law: “a built bed is a filled bed” (Roemer, 1961). With respect to upcoding weonly found counterintuitive results which were likely due to incomplete regional market data. A detailed descriptionof the market for neonatal intensive care in Germany is given in Appendix C.
4

hospitals have received by upcoding preterm newborns. In Section 5 we explore how economic
incentives to upcode and upcoding rates are related, and in Section 6 we explore the relationship
between newborn health and upcoding. Finally, Section 7 summarizes the paper and draws both
methodological and policy conclusions.
2 DRGs in German neonatology
Before 2003, neonatal care in German hospitals was reimbursed on a per diem basis. Since the
introduction of the DRG system, reimbursement is based on the following case characteristics:
birth weight (or admission weight), surgical (OR-) procedures, long-term artificial respiration, (se-
vere) complications, 5-day and 28-day mortality. Birth weights are classified along eight threshold
values: 600g, 750g, 875g, 1,000g, 1,250g, 1,500g, 2,000g, and 2,500g. Reimbursement changes
substantially at these thresholds, so that very small differences in birth/admission weight of a few
grams can result in reimbursement differences of more than 15,000 Euro. The relationship between
birth weight and average reimbursement per birth weight category is shown in Table 1.2 It illus-
trates the large hikes in reimbursement at the threshold values. For instance, whether a newborn
weighs 1,510g or 1,490g makes a 13,500 Euro reimbursement difference to the neonatal care unit.
Actual cost of care differences should of course be a lot smaller. Table 1 also shows that reim-
bursement by birth weight category is almost proportional to average length of stay. Note also that
2In the German DRG system, the reimbursement per case is obtained by multiplying the relative DRG cost weightof that case by a base rate. The relative cost weights represent the ratio of resource intensity between different DRGgroups (InEK, 2007). They are determined annually by the Institute for the Hospital Reimbursement System (Institutfur das Entgeltsystem im Krankenhaus, InEK). Calculations are based on actual cost data of a (voluntary) sample ofabout 250 hospitals (about 13% of German hospitals) covering some 4m individual cases, and using an exact fullcost approach for the complete treatment process of a medical condition (InEK, 2011). According to §21 Hospi-tal Remuneration Act (KHEntG), all German hospitals are obliged to provide annual hospital-related structural (e.g.ownership, number of beds, labor cost) and case-related performance data (e.g. diagnosis, procedures). Hospitals vol-untarily participating as calculation institutions additionally provide patient-level cost data. Their effort is reimbursedby an additional fee consisting of a lump sum and a variable rate related to the number of transferred cases as well asdata quality (Geissler et al., 2011). The relative cost weight of a DRG is computed as the average within-DRG treat-ment costs (after the elimination of outliers) divided by the average treatment costs across all cases. Thus relative costweights larger than one represent higher than average costs and relative cost weights lower than one represent lowerthan average costs. By multiplying these calculated cost weight by the base rate, one obtains the actual reimbursementper DRG. The base rate is currently determined by negotiation, separately in each federal state, between hospitals andhealth insurers. Thus base rates slightly depend on regional factors such as regional price or wage differentials (Vogl,2012). A nationwide base rate is planned to become operational in 2015.
5

there are significant reductions in reimbursement when a newborn dies within 4 days. In this case
the hospital receives a flat reimbursement which does not depend on birth weight. This is because
most infants who die, do so very quickly. For very low birth weight infants, approximately 60%
of deaths occur within the first four days of delivery (Callaghan et al., 2006; Abdel-Latif et al.,
2013). If a newborn dies within 28 days, reimbursement in the four lowest weight categories is
also reduced substantially.
Table 1: Average reimbursement for neonatal care and average length of stay (without OR-procedures), by birth weight category (2010).
Average Reimbursement (Euro)
Deceased Deceased Avg. lengthBirth weight (g) Survivors < 5 days < 29 days of stay (days)
< 600 80,083 3,037 16,585 91.9600-749 79,620 3,037 16,585 87.3750-874 63,540 3,037 17,678 73.9875-999 45,985 3,037 17,678 63.41000-1249 34,075 3,037 — 45.21250-1499 27,205 3,037 — 36.61500-1999 13,848 3,037 — 12.32000-2499 4,080 3,037 — 5.1≥ 2500 1,108 3,037 — 3.5Source: Fee Schedule 2010 (InEK, 2009); Base rates published bythe Federal Association of the AOK (AOK-Bundesverband, 2012);Average length of stay for DRGs without significant OR-Proceduresor severe complications.
The incentives created by DRGs based on birth weight are illustrated in Figure 1. It shows
the true average treatment costs as a function of birth weight (solid line) and the reimbursement
received by the hospital, conditional on birth weight across two birth weight thresholds. The
reimbursement for the 1,500g to 2,000g group is determined so that it exactly covers the true
treatment costs in that group. All newborns with birth weight between 1,500g and x create financial
losses to the hospital, and all newborns with birth weight between x and 1,999g create financial
gains. If hospitals were able to select newborns on the basis of their birth weight, they would
select to treat those with a weight between x and 1,999g and not treat those with a weight between
6

1,500g and x. But of course, this is not possible.3 Instead, it is possible to re-classify newborns
by manipulating the recorded birth weight. While the true treatment costs of each newborn remain
the same, reimbursement will jump from less than expected treatment costs to more than expected
treatment costs.
1500 2000True birth weight
True averagetreatment costs
Reimbursement
x
Figure 1: Relationship between average treatment costs and reimbursement (stylized graph)
As noted above, birth weight manipulation within reasonable limits is easy and almost
impossible to detect ex post in an individual case.4 It is thus no surprise that such manipulation
can be found in other DRG systems as well. For instance, the Japanese partial DRG system does
reimburse care in neonatal intensive care per diem but the number of days that can be claimed
have caps depending on birth weight categories. Thus there is an indirect incentive to manipulate
birth weight because it allows hospitals to extend actual treatment. Shigeoka and Fushimi (2014)
provide evidence for such manipulation at the relevant thresholds of 1,000g and 1,500g.
Finally, another upcoding margin in German neonatology, which we cannot analyze with
our data, is the number of hours of artificial respiration, with 120 hours being one important thresh-
old at which remuneration increases substantially. For instance, crossing that threshold in case of
a newborn with birth weight 1,500 to 1,999 grams and significant complications, prolonging arti-
3Selection might be possible in case of transfers from lower level birth clinics – who have no incentive to upcode– to higher level perinatal centers. However, here the margin of manipulation is the admission weight, not the birthweight. The number of transfers in our data is too small to study this phenomenon.
4Since newborns are weighed regularly, sudden large increases in weight would indicate a potential upcoding case.
7

ficial respiration from 120 to 121 hours can results in fee increase of about 20,000 Euro. Whether
this additional hour was medically necessary cannot be verified ex post. In contrast to manipulat-
ing recorded birth weights, prolonging artificial respiration might even be harmful as the risk of
serious infections increases.
3 Data
We use two data sources in this study. The first are official German birth statistics 1996 to 2010,
covering both the pre-DRG- and the DRG-period in German hospitals. These data include about
10 million births, of which some 748,000 or 7.4% were of low birth weight (<2,500g). To illus-
trate, Figure 2 shows the number and percentage of births, by birth weight category and period
(before/after introduction of DRGs). Figure 2 indicates a general trend towards a larger proportion
of live births with low birth weight. While the absolute number of births with extremely low or
very low birth weight has been fairly constant or even decreasing, their proportion has continuously
increased. In 1996 for instance, 0.52% of all births were below 1,000g and another 0.68% were
between 1,000g and 1,499g. Until 2010, these proportions have increased to 0.64% and 0.78%,
respectively. Detailed numbers can be found in Table A.1 in Appendix A. There are several rea-
sons for this general trend, for instance the increase in the number of multiple births after in vitro
fertilization, or a shift in the composition of births with respect to potential determinants of birth
weight (e.g. older mothers, lower social status). There also seems to be a small break in the general
trend around the time of the DRG introduction, which could already provide first evidence in favor
of an upcoding hypothesis. Below we show much clearer evidence when we focus on the small
windows around DRG-relevant thresholds.
The second data source is German hospital data collected for the purpose of external quality
control. Data from 2006 onward are available from the Institute for Applied Quality Improvement
and Research in Health Care (AQUA). The data contain indicators of infant health taken from the
medical records, such as birth weight, gestational age, APGAR scores, or early neonatal mortality.
We use these data to study if upcoding is systematically related to infant health conditional on
8

4.1
4.2
4.3
4.4
4.5
55.
25.
45.
6
3840
4244
600
650
700
750
1996 2000 2004 2008 1996 2000 2004 2008
1996 2000 2004 2008 1996 2000 2004 2008
<1,000g 1,000g-1,499g
1,500g-2,499g 2,500+g
Birt
hs (
in 1
,000
)
Year
Panel A: Number of Births
.5.5
5.6
.65
.65
.7.7
5.8
5.2
5.4
5.6
5.8
92.8
9393
.293
.493
.6
1996 2000 2004 2008 1996 2000 2004 2008
1996 2000 2004 2008 1996 2000 2004 2008
<1,000g 1,000g-1,499g
1,500g-2,499g 2,500+g
Birt
hs (
Per
cent
)
Year
Panel B: Proportion of Births
Figure 2: Number and proportion of births, by birth weight category, including stillbirths. Thevertical line denotes the introduction of DRG reimbursement. Source: Own calculations based onGerman birth records.
recorded birth weight. The data contain only information on births in hospitals. This will not imply
any selectivity problem for the present paper because more than 98% of all births and practically
100% of all preterm births in Germany take place in a hospital.
Third, we use the fee schedules and base rates of the German DRG system to estimate re-
imbursement differentials per DRG between 2003 and 2010. The fee schedule applicable in the
following year is published annually by the Institute for the Hospital Remuneration System (InEK)
and contains relative cost weights for each DRG that are computed on the basis of a retrospective
full cost approach. Base rates are negotiated between health insurers and hospitals and are reg-
ularly published by the Federal Association of the AOK, the largest statutory health insurance in
Germany.
9

4 Upcoding and excess reimbursement over time
4.1 Changes in the birth weight distribution over time
We begin by describing trends in the distribution of recorded birth weights from 1996 to 2010,
and how changes in the distribution might be related to the introduction of DRGs. Basically, we
show that since the introduction of DRGs, recorded birth weights that have made their way into
official statistics have been systematically bent below birth weight thresholds that are relevant for
reimbursement. If thresholds are irrelevant for reimbursement, however, there is no such change
in the distribution of birth weights after the introduction of DRGs.
The German birth statistics contain the recorded birth weights to the exact gram. For our
analyses, we usually recode them into brackets of e.g. 10g, 25g or 50g (depending on the number
of subgroups for which we analyze the data). Figure 3 contains the distribution of birth weights
from 1996 to 2010. Each data point represents the (log) number of births in a 10g birth weight
bracket such as 550 to 559 grams, 560 to 569 grams, and so on. Vertical lines represent DRG-
relevant thresholds. Due to lack of precision of scales or midwives rounding birth weights, the
original distribution shows substantial heaping at multiples of 50 or 100. Since such heaping also
occurs at DRG thresholds and potentially masks substantive changes in the distribution at these
thresholds, we have corrected the empirical distribution for rounding.5.
Generally, the birth weight distributions shown in Figure 3 have the same shape every year.
At the beginning of the observation period, the distribution is rather smooth with very few outliers
which appear to be concentrated at 1,000g and 1,500g. There actually seems to be surplus of
births just below and a deficit of births just above these values. Assuming that the true birth
weight distribution is smooth, this pattern indicates that some infants were “shifted” below these
thresholds already before the DRG introduction.6 As time progresses, beginning in 2003, we
5The correction procedure is described in Appendix B. Uncorrected distributions are shown in Figure A.1 inAppendix A. A general downward trend in the number of multiples of 50 or 100 is documented in Table A.2
6Since before 2003, perinatal centers were reimbursed per diem, these shifts cannot be explained by case-basedpayment. However, neonatology was the first specialty in Germany to implement systematic quality control throughcollecting and analyzing standardized data across all hospitals (so-called perinatal and neonatal surveys). First imple-
10

24
68
24
68
24
68
24
68
24
68
600
750
875
1000
1250
1500
2000
2500 60
0
750
875
1000
1250
1500
2000
2500 60
0
750
875
1000
1250
1500
2000
2500
1996 1997 1998
1999 2000 2001
2002 2003 2004
2005 2006 2007
2008 2009 2010
Log
Cou
nt
Grams (log scale)
Figure 3: Distribution of birth weights between 550 and 2750 grams, 1996 to 2010. Dots show thenumber of births in 10g brackets in each year - corrected for rounding to multiples of 50 and 100.Data before 2000 do not included Bavaria. Vertical lines indicate DRG-relevant thresholds. Source:Own calculations based on German birth records.
11

observe systematic and large outliers also in the vicinity of other DRG-relevant thresholds, such as
750g, 1,250g, or 2,000g as well as increasing surpluses and deficits around 1,000g and 1,500g.
Overall, Figure 3 provides strong evidence for upcoding in German neonatology. It clearly
shows systematic changes in the birth weight distribution just around the DRG-relevant thresholds
that have emerged after the introduction of DRGs. To provide more insight, we now focus on birth
weight brackets just below and above the eight DRG-relevant thresholds (and a few non-relevant
birth weight thresholds). The threshold value itself is included in the bracket above the threshold.
Let x denote some threshold in grams and d the width of the bracket, then a rough indicator of
upcoding around x is the ratio of the number of observations in the bracket below the threshold
[x − d, x − 1] divided by the number of observations in the brackets above and below the threshold
[x − d, x + d − 1]. For future reference, we denote this measure as Rd:
Rd =
∑1[x−d,x−1]∑
1[x−d,x+d−1](1)
Below, we often use 2Rd−1 to approximate the proportion of cases that were upcoded from
[x, x+d−1] to [x−d, x−1]. Note that this measure is likely to be biased but it is a priori unclear in
which direction. First, 2Rd−1 does not account for the fact that all relevant thresholds are in the left
hand tail of the birth weight distribution. That means the true number of births should be slightly
larger right than left of the threshold, whereas 2Rd − 1 assumes the same true number left and right
of the threshold (and thus underestimates the extent of upcoding). Second, Figure 3 suggests that
the range from which newborns are upcoded is wider than the range to which they are upcoded.
Thus the bracket of width d just below the threshold contains more upcoded cases than originate
from the bracket of the same size just above the threshold, so that 2Rd − 1 will overestimate the
proportion of cases. However, both sources of bias will not matter much for the comparison across
years (shown below) as long as the shape of the true distribution and upcoding patterns do not
mented in the 1970s in a few model regions, such perinatal surveys were extended to all regions during the 1990s.Shifting births below the thresholds for very or extremely low weight may have had advantages such as increasing thereported volume in a hospital or increasing the reported survival rate.
12

change over time. But it will of course make a difference when we estimate the absolute number
of upcoded cases in each year. We thus compute an alternative estimate later on.
Figure 4 shows the development of R25 at the eight DRG-relevant birth weight thresholds
and – for comparison – at four non-relevant thresholds from 1996 to 2010. For instance, the top
left figure shows that before the introduction of DRGs, around 40 percent of the babies born with
a recorded birth weight between 575 and 624 grams were recorded with less than 600 grams.
The proportion lower than 50% must be largely attributed to the fact that birth weights are very
often rounded, for instance to multiples of 100. These rounded values are included in the bracket
above the threshold. After the introduction of DRGs, R25 has increased to about 50 percent. This
increase can partly be explained by more precise measurement (through the use of digital scales)
or better documentation of birth weights that would formerly have been rounded, which is clearly
legitimate.7
Increasing trends in R25 can be found for almost all DRG-relevant thresholds. The most
striking developments can be found at 1,000g, 1,250g and 1,500g, where since the introduction
of DRGs, 80% to 90% of recorded birth weights are below the threshold. This translates into
upcoding rates of 60% to 80%. To illustrate the pervasiveness of upcoding: in 2008, we find 742
children recorded with birth weight between 1,480g and 1,499g, but only 65 children with birth
weight recorded between 1,500g and 1,519g. A staggering 92% percent of all births were coded
below the 1,500g threshold. Possibly, 1,000g and 1,500g figure so prominently because they can
be easily remembered as relevant thresholds. Both are also used to categorize birth weight into the
familiar “extremely low” and “very low” categories. Another salient threshold is at 1,250g, because
in 2006 minimum volume requirements for Level 1 and 2 centers were defined with reference to
the number of infants born below that weight. In contrast to all other DRG-thresholds, we find
stable R25 at the 875g threshold. Possibly this is the least memorable of all relevant thresholds.
7Figure A.3 in the Appendix shows upcoding rates exclusive of the threshold values. As this figure clearly shows,there are distinct pre-post trends towards “below threshold” birth weights also when the thresholds themselves areexcluded. If trends in rounding or measurement accuracy were the only reason for the increase in the proportion ofvalues below thresholds, all lines should be flat at about 50%. Figure A.3 also provides results for DRG-irrelevantmultiples of 100 which show exactly this.
13

.2.4
.6.8
1
.2.4
.6.8
1
.2.4
.6.8
1
.2.4
.6.8
1
.2.4
.6.8
1
.2.4
.6.8
1
.2.4
.6.8
1
.2.4
.6.8
1
.2.4
.6.8
1
.2.4
.6.8
1
.2.4
.6.8
1
.2.4
.6.8
1
1996 2000 2004 2008 1996 2000 2004 2008 1996 2000 2004 2008 1996 2000 2004 2008
DRG, 600 DRG, 750 DRG, 875 DRG, 1000
DRG, 1250 DRG, 1500 DRG, 2000 DRG, 2500
Non-DRG, 700 Non-DRG, 1100 Non-DRG, 1300 Non-DRG, 1700
Pro
port
ion
of b
irths
bel
ow th
resh
old
Year
Figure 4: Proportion of live births with weight recorded below threshold (d = 25) at eight DRG-relevant thresholds and four non-relevant thresholds, 1996 to 2010. The vertical line indicates theintroduction of DRGs. The horizontal line indicates the “no upcoding” value of 50%. Source: Owncalculations based on German birth records.
14

Moreover, R25 is consistently at about 60%. This can be explained by the fact that the 25g bracket
below 875 includes a multiple of 50 (850) whereas the bracket above does not.
Now consider the third row in Figure 4. It shows the percentage of births below 700g,
1,100g, 1,300g, and 1,700g grams, respectively, around these thresholds. These are arbitrarily
chosen examples for DRG-irrelevant thresholds, hence no economic incentives apply. However,
the development of the percentage of births below thresholds would be affected by changes in the
precision of scales or other rounding. Quite consistently, one finds around 40% of recorded birth
weights below the threshold and there clearly is no visible change in this proportion over time or
when DRGs were introduced.
Comparing the difference in R25 for DRG-relevant thresholds with the same difference for
non-relevant thresholds mimics a difference-in-difference regression strategy to identify the causal
effect of DRGs on recorded birth weights. Here, our parallel trends assumption is that rounding
affects DRG-relevant and DRG-irrelevant multiples of 100 in the same way. Our comparison
thus provides quite convincing evidence that the introduction of DRGs has affected distribution of
documented birth weights only at those thresholds that matter financially.
Another interesting comparison is between birth weights recorded for live births and still
births. Since still births do not require neonatal care, hospital reimbursement is not affected by
the recorded birth weight of a stillborn child. We have thus reproduced Figure 4 using data on the
weight of stillborn infants (details can be found in Figure A.2 in Appendix A). Due to the small
number of cases (less than 0.4 percent), there is a lot more annual variation in the data, but the
general picture that emerges from our analysis is quite clear: the introduction of DRGs had no
effect on the distribution of birth weights among stillborn children. At most threshold values, there
is neither a sudden jump nor a positive secular trend in R25. A slight upward trend in R25 can be
seen at some thresholds, both at thresholds relevant and not relevant for neonatal care DRGs. This
secular trend can be explained by increasingly precise measurements, i.e. less values recorded
exactly at thresholds.
15

4.2 Excess reimbursement due to upcoding 2003-2010
We estimate the total amount A that has been received unfairly by German hospitals, and perinatal
centers in particular, by first estimating the absolute number of cases that have been upcoded at
each relevant threshold k in each year y, Uyk. Then we multiply these estimates by the average
additional reimbursement obtained by the hospital for that upcoded case, ∆yk, and sum up across
all years and thresholds:
A =
2010∑y=2003
8∑k=1
Uyk∆yk (2)
In the following, we describe our calculation of Uyk and ∆yk.
4.2.1 Estimating the number of upcoded cases
Our estimate of the number of upcoded cases in year y at threshold k is given by
Udyk = Nd
yk − Ndyk (3)
where d indicates a bracket of width d below each threshold, Ndyk is the observed number of births
within that bracket, and Ndyk is the counterfactual number of births in the same bracket that would
have been recorded if there was no DRG-based reimbursement. To compute this counterfactual,
we estimate the distribution around each threshold in a way that is reasonably independent of the
actual distortions introduced by upcoding. This can be done parametrically, for instance by speci-
fying a (global) higher order polynomial, or it can be done non-parametrically, for instance by local
polynomial regression with a bandwidth that is sufficient to even out the lack of births just above
and the surplus of births just below some threshold. We chose local polynomial regression(with
degree=2, bandwidth=200g, and Epanechnikov kernel using the Stata command lpoly) to esti-
mate the log number of births. Our results are robust to variations in the bandwidth between 100g
and 400g.
16

The next decision is to choose the width of the bracket left of the threshold into which
cases are upcoded. This is a priori unclear. By inspection of Figure 3, it seems that most upcoded
cases can be found either 10g or 20g below the threshold. For comparison, we have computed
Udyk for d = 10, 20, . . . , 50. The results are shown in Table 2. Some 7,000 cases are upcoded into
brackets 10 grams below the thresholds, and further 5,000 upcoded cases can be found in 20g
brackets. Using 30g brackets adds just 400 more upcoded cases. Then the total number decreases
slightly and substantially increases when moving down to 50g below the threshold. The two latter
findings are likely due to some rounding of birth weights to multiples of 50g. For our following
calculations, we use a bracket width of 30g. Thus overall, we estimate that between 2003 and
2010, 12,133 births have been upcoded to a lower birth weight DRG.
Table 2: Estimated total number of upcoded cases, 2003 to 2010, by bracket width
Bracket width in grams (d) 10 20 30 40 50
Estimated total number (Udyk) 6,970 11,758 12,133 11,971 15,086
Table 3 shows detailed results by year and threshold. First, it shows an increasing trend in
the number of upcoded cases. In 2003, just after the introduction of DRGs, only 562 newborns
were upcoded overall.8 The estimated number of annual upcodes has risen to more than 2,000
in 2010. Similar to the analysis above, the most important thresholds are at 1,000g, 1,500g, and
2,000g. These are salient numbers that can be easily memorized. Moreover, as noted before,
1,000g is the threshold for “extremely low birth weight” and 1,500g is the threshold for “very low
birth weight”.
8This relatively low number is due to the fact that participation in the DRG system was voluntary in 2003 andbecame mandatory only in 2004. In the course of 2003, some two thirds of all acute care hospitals began to participate.Further, we obtain a substantial negative estimate for the 2,500g threshold in 2003. This happens primarily when casesare rounded to the threshold value itself, which clearly counteracts the effect of upcoding on reimbursement. We thinkthat the amount “wasted” by hospitals because of downcoding should be subtracted from the amount received due toupcoding, although it is reasonable to assume that in 2003, mostly non-participating hospitals are among those whodowncode.
17

Table 3: Estimated number of upcoded cases, by year and threshold.
Year
Threshold 2003 2004 2005 2006 2007 2008 2009 2010 Total
600 17 29 44 17 37 17 39 47 250750 39 73 118 88 93 75 99 80 665875 6 9 -7 12 20 17 22 31 1141000 178 277 220 231 275 245 259 259 1,9411250 49 76 94 159 132 155 209 285 1,1601500 290 362 477 437 559 569 628 583 3,9082000 160 262 330 405 501 458 462 471 3,0512500 -179 55 182 35 245 211 238 254 1,044
Total 562 1,145 1,460 1,386 1,864 1,749 1,958 2,012 12,133Source: Own calculations based on German birth records.
4.2.2 Estimating the excess reimbursement due to upcoding
Based on the DRG fee schedules for each respective year, we first calculate the average revenue
per birth weight category as the weighted average of all DRG cost weights pertaining to a birth
weight, with weights being given by the relative annual frequency of each DRG. In order to calcu-
late reimbursement per birth weight category, we then multiply these average cost weights by the
national average base rate. The national average is computed as the average of state-specific base
rates weighted by the number of hospitals in each state. Reimbursement differentials and hence
the average additional reimbursement for a specific upcoded case, ∆yk, are obtained by subtracting
the reimbursement for cases below a threshold value from the reimbursement for cases above.
Table 4 shows the total excess reimbursement due to neonatal upcoding. According to
our estimates, more than 114m Euro have been unfairly received by perinatal centers and other
hospitals. The amount has continuously increased from 5.6m Euro in 2003 to 22.3m Euro in
2010. At the most salient threshold (1,500g) alone, some 45m Euro or 40% of the total additional
reimbursement were obtained by deducting a few grams from the weight of some 4,000 premature
newborns.
18

Table 4: Estimated excess reimbursement in 1,000 Euro, by year and threshold
Year
Threshold 2003 2004 2005 2006 2007 2008 2009 2010 Total
600 158 210 -227 -23 662 216 32 -155 872750 553 524 882 421 617 1,338 1,631 847 6,813875 55 162 -71 193 297 178 367 319 1,5001000 1,333 1,049 2,145 1,862 3,192 3,303 3,035 4,915 20,8361250 237 639 1,206 1,152 1,055 1,083 1,416 2,221 9,0091500 2,647 3,725 2,981 5,585 6,364 7,563 8,270 8,560 45,6942000 1,100 1,910 2,460 3,044 4,480 3,890 4,440 4,741 26,0652500 -486 155 615 129 694 632 670 818 3,226
Total 5,598 8,374 9,990 12,363 17,361 18,203 19,861 22,265 114,015Source: Own calculations based on German birth records and DRG fee schedules.
5 Economic incentives and upcoding
5.1 Reimbursement differentials and upcoding
We now examine the hypothesis that upcoding is particularly prevalent at financially salient thresh-
olds, i.e. where the financial benefits of upcoding are particularly large in absolute terms. To that
end, we have computed the expected reimbursement difference between adjacent DRGs in terms
of birth weight at each relevant threshold and for each year. This is the payment difference that
would be expected if one made a naive forecast of the relative weights in the current year based on
the relative weights of the past year multiplied by the survival probability in the vicinity of each
threshold.9
With seven years and eight thresholds, we have 56 data points overall.10 Figure 5 plots
the proportion of upcoded cases around each threshold against the expected payment difference
in 1,000 Euro. The size of the bubbles indicates the absolute number of observations around each
threshold. Overall, we find a positive relationship between financial incentives and upcoding in this
9Estimates, based on hospital data, of 7-day survival probabilities in 100g brackets around DRG-thresholds areshown in Table A.3 in the Appendix.
10Prospective data for 2003 are not available.
19

2500g
2000g
1500g
1000g
1250g
-.1
0.1
.2.3
.4.5
.6.7
Est
imat
ed p
ropo
rtio
n of
upc
oded
cas
es
-5 0 5 10 15 20Prospective payment difference (in 1,000 Euro)
Figure 5: Proportion of upcoded cases around each threshold plotted against the expected paymentdifference in 1,000 Euro. The bubble size indicates the number of observations around each threshold.
graph. This relationship is driven by the five largest and quantitatively most important thresholds
between 1,000g and 2,500g. At thresholds below 1,000g, the proportion of upcodes appears to be
unrelated to the expected financial gain.
To quantify the relationship shown in Figure 5, we estimated the linear relationship using
various specifications. The results are shown in Table 5. Column (1) shows the estimates for a
regression line drawn through all data points by OLS and indicates a non-significant 1 percentage
point increase in the proportion of upcoded cases when the payment difference rises by 1,000 Euro
when all thresholds are given the same weight. When weighted by the number of births around
thresholds, the estimated increase becomes 3.9 percentage points (and statistically significant). In
Figure 5, the link between upcoding and financial gain is essentially driven by the five thresholds
at 1,000g and over. Giving these observations a bigger weight naturally strengthens the estimated
relationship. This becomes even clearer when restricting the sample to thresholds ≥1,000g (col-
umn (2)). The estimated increase in the unweighted sample is 5.4 percentage points per 1,000 Euro
20

reimbursement differential and 5.9 percentage points in the weighted sample. However, this rela-
tionship seems to be driven primarily by between threshold variation. Complementary evidence of
financial gain driving upcoding rates comes from threshold-fixed effects regressions, see column
(3) for estimates using the full set of thresholds and column (4) for an estimate using the upper
five thresholds. The relationship is practically flat if all thresholds are included, independent of
whether weights are used or not. Among the five largest thresholds, we find marginally significant
increases in upcoding rates of 1.2 to 1.8 percentage points per 1,000 Euro additional gain.
Table 5: Relationship between the proportion of upcoded cases and expected payment difference in(1,000 Euro)
(1) (2) (3) (4)Pooled OLS Pooled OLS Fixed Effects Fixed Effectsall thresholds ≥1,000g all thresholds ≥ 1,000g
UnweightedPayment difference 0.010 0.054*** -0.001 0.012*
(0.012) (0.009) (0.002) (0.007)
Weighted by number of births around thresholdPayment difference 0.039** 0.059*** 0.004 0.018*
(0.012) (0.003) (0.004) (0.009)
Observations 56 35 56 35Note: Standard errors in parentheses. OLS standard errors clustered by threshold.*p<0.1, **p<0.05, ***p<0.01
5.2 Hospital specialization and upcoding
Next, we analyze the relationship between hospital specialization and upcoding. Pregnant women
at risk of delivering prematurely are routinely treated in perinatal centers with neonatal ICUs. If a
child is accidentally born in a “lower level” hospital without specialized ward, it will be transferred
as soon as possible to a neonatal care unit. In contrast to hospitals that actually care for preterm
infants, non-specialized hospitals have no financial incentive to manipulate birth weights. Hence
the proportion of upcoding should be higher in perinatal centers. Further, since low birth weights
21

are rare events, midwives in regular birth clinics might also have no experience with the relevant
DRGs and their substantial reimbursement differences. In other words, specialization might also
entail a learning effect on the part of the hospital employees.
The birth record data do not allow us to link births directly to hospitals. But since we know
the city or county of the hospital of birth, we use information on the location of hospitals with
neonatal intensive care units by county and year and link these with county-by-year estimates of
upcoding rates. The latter are estimated as 2R50−1 (see equation 1). This aggregate analysis allows
us to draw some indirect conclusions about the link between specialization and upcoding simply
because not all counties have perinatal centers with neonatal ICUs. In fact, there are about 220
Level 1 or Level 2 centers in Germany. In large cities such as Berlin or Munich, there are several
of them. This also means that the majority of the 402 counties have no neonatal intensive care
unit and mothers at risk of delivering prematurely who reside in one of those counties are usually
treated in another county.
We demonstrate the link between specialization and upcoding graphically. The left panel of
Figure 6 shows the proportion of upcoded newborns (aggregated across all eight DRG-thresholds)
against the decile of the number of infants born with low birth weight (<2,500g). Small counties
with very few such births are found on the left and counties with many such births are on the
right of the graph. We further distinguish counties by the presence of at least one perinatal center.
Vertical bars indicate 95% confidence intervals.
Figure 6 suggests a strong positive association between the size of a county in terms of the
number of underweight births and the proportion of upcoding. For the smallest counties we find on
average negative upcoding rates of around 10%. Such downcoding can be explained by rounding
to the nearest multiple of 50, which often is the DRG-threshold. In contrast, large counties have
overall upcoding rates of more than 10%. As expected, there is not much overlap between counties
with and without perinatal centers in terms of the total number of underweight infants. At two
of the three deciles where we have overlap (5 to 7), we find significantly larger upcoding rates in
counties with than in counties without perinatal centers. In sum, the findings shown in the left
22

-.2
-.1
0.1
.2U
pcod
ing
rate
1 2 3 4 5 6 7 8 9 10Decile of number of infants with low birth weight
Counties without perinatal center
Counties with perinatal center -.1
0.1
.2.3
.4
no yes no yes
At threshold <= 1,500g At threshold > 1,500g
Specialized neonatologist present
Figure 6: Proportion of upcoded newborns and 95% confidence intervals, by total number of babiesborn with low birth weight and county type, 2003-2010 (left panel) and by whether a neonatologistwas present before birth and DRG-threshold, 2006-2011 (right panel).
panel of Figure 6 indicate that county-level upcoding rates increase with the number of preterm
births, but more so with the presence of perinatal centers.
Direct evidence on higher upcoding rates in perinatal centers can be found in the right panel
of Figure 6. Here, we show the proportion of upcoded cases up to the 1,500g threshold (left bar)
and at the 2,000 and 2,500g thresholds (right bar) by whether a specialized neonatologist was
present before the birth of the child. Having specialized neonatologists is one of the requirements
to become a Level 1 or Level 2 perinatal center (see Appendix C). The numbers shown are derived
from individual-level records in the hospital quality data and are aggregated across all counties and
all years from 2006 to 2011.11 We find larger overall upcoding rates at lower DRG thresholds. We
also find consistent differences in upcoding rates related to the presence of a specialized neonatol-
ogist. Independent of the threshold, the estimated upcoding rates are 25 percentage points higher
when a neonatologist is present. This difference is substantial and clearly indicates that upcoding
is less prevalent in non-specialized hospitals.
11In these data we are also not able to link births to individual hospitals.
23

6 Newborn health status and upcoding
We now come to what we believe is the main innovation of our research. Even conditional on DRG
classification criteria, newborns are in different health states. In this section we examine whether
newborn health as measured by gestational age, APGAR scores, and early (≤7 days) neonatal death
are systematically related to upcoding. The birth register data include only birth length as measure
of infant health other than birth weight. Thus we now use complementary information collected
for the purpose of external quality control in hospitals for 2006 to 2011. The focus of our analysis
is the comparison of average newborn health levels left and right of the DRG-relevant birth weight
thresholds. There are three possible results. (1) no difference in average health left and right of a
threshold, (2) average health is better left than right of a threshold, (3) average health is worse left
than right of a threshold. In the first case health is unrelated to upcoding. The other two cases seem
more interesting, and we discuss these in turn. In each case there are generally two explanations:
one suggests a causal effect of upcoding, the other suggests systematic selection into upcoding.
6.1 Theoretical considerations
If observed health is better left than right of a DRG threshold, this could be attributable to a
causal effect. It arises when coding a newborn into a birth weight bracket below a DRG threshold
triggers better treatment and thus improves health (Almond et al., 2010). Here, the motivation to
upcode could be based on medical guidelines if recommended treatment intensity was conditional
on birth weight classifications. In that case, doctors could “upgrade” the treatment of newborns by
recording birth weights below thresholds. However, clinical guidelines in Germany neonatology
do not condition on birth weight.
Our data are not well suited to test this explanation because they lack long-term newborn
health measures (e.g. one-year survival). Rather, our measures are fixed at the time of birth (ges-
tational age), assessed shortly after birth (APGAR scores), or one week after birth (early neonatal
mortality). Arguably, of these measures, only early neonatal mortality could potentially be affected
24

by better treatment linked to manipulated birth weights. For instance, a negative relationship be-
tween upcoding and early neonatal mortality might be due to births in low volume, low quality
hospitals where preterm infant mortality is higher and upcoding far less common than in large
perinatal centers (see Section 5.2).
Second, better health to the left than to the right of a threshold can also be explained by
selection, i.e. newborns in good health are more likely to be upcoded (or infants in bad health are
less likely to be upcoded). At first it seems hard to understand why this should occur. However, the
incentives embedded in the German system explain such behavior. Sicker children have a smaller
survival probability and thus invoke both lower treatment costs and substantially lower reimburse-
ments. In Table 1, we have shown that if a newborn dies within 4 days, the hospital receives a
flat reimbursement which does not depend on birth weight. If a newborn with birth weight below
1,000g dies within 28 days, reimbursements are also practically flat. Thus the expected value of
the financial gain from upcoding converges to zero when the probability of dying within the first
four days approaches one. A further explanation for differential upcoding by health could be the
perinatal centers’ mandate to publish standardized quality reports. These quality reports contain
health outcomes by birth weight categories defined by thresholds similar to those used for reim-
bursement: 500g, 750g, 1,000g, 1,250g, and 1,500g. By not shifting comparatively sick newborns
below those threshold, average reported outcomes conditional on birth weight categories will im-
prove. However, the federal mandate to publish these reports in neonatology was introduced in
2010. Before, standardized quality reports were voluntary.
Worse average health to the left than to the right of a DRG threshold can again be explained
by a causal effect or by selection: the causal effect would occur if being in a birth weight bracket
below a DRG threshold triggered worse treatment and thus harmed health. This sounds fairly
implausible. The selection effect arises if newborns in worse health are more likely to be upcoded.
For example, this can happen if observed newborn health indicators reflect differences in expected
treatment costs that are not accounted for in DRGs. Hospitals cannot choose to admit newborns
based on their observed health status. Instead, hospital staff might selectively upcode newborns
25

whose treatment is likely to cost more, and this selection is based on observable characteristics that
are not part of the DRG classification such having low gestational age or having a low APGAR
score.
Arguably, gestational age is the best indicator for future treatment costs because it is closely
linked with expected length of stay.12 Based on all Californian births 1998-2000, Phibbs and
Schmitt (2006) estimate average length of stay and neonatal costs conditional on gestational age (in
completed weeks). For example, they find that between gestational ages of 24 and 34 weeks, a one
week decrease in gestational age increases average length of stay by about nine days. Estimated
costs of treatment rise by 20,000 to 30,000 dollars for each lost week of gestation.13 Above 34
weeks, a one week decrease in gestational age increases average length of stay by less than three
days. This marked difference is due to fact that minimum and average post-conceptional age at
discharge are 34 and 35 weeks, respectively.
Although it seems plausible that hospital staff are more likely to upcode newborns whose
treatment will cost more, it should be noted that such behavior is not economically rational. Once
a child is admitted, the hospital commits to spend the medically necessary amount on treatment.
Although treatment costs occur in the future, their are “sunk”, and it does not matter financially if
a healthy or unhealthy child is upcoded. In fact, in the absence of any moral or other non-monetary
considerations, the optimal strategy would be to upcode every child for which upcoding cannot be
detected, even those with a very low survival probability. Systematic deviation from this optimal
strategy can be expected for instance if doctors or midwives believe that upcoding is unethical but
that it is necessary to align reimbursement and expected treatment costs.
6.2 Econometric Specification and Results
To study whether infants just above DRG birth weight thresholds are healthier than those below, we
estimate regressions of gestational age, APGAR scores, and early neonatal mortality on recorded
12Of course, there may be further characteristics that are not reflected in the DRGs but that are predictive of futurecosts and that are observable to the hospital staff shortly after birth. One example is whether ventilator support isneeded, which type (CPAP vs. mechanical ventilation), the O2 level, or the ventilator pressure settings.
13These amounts would be much smaller in Germany.
26

birth weight and analyze the prediction error for each birth weight bracket using the following
regression model (running the regression separately for each bracket c):
yic = f (c) + βc × dc + εic (4)
where yic denotes the health outcome of newborn i in birth weight bracket c. f (c) is a global
non-linear birth weight trend (modeled as a fifth-order polynomial). dc is a dummy variable for
being in one particular birth weight bracket c (e.g., 1475g to 1499g, 1500g to 1524g, . . . ). βc
then gives the predicted health outcomes of newborns in birth weight bracket c relative to the
outcome predicted by a general trend. In the following, we show βc (or exp(βc) in case of logistic
regressions) and 95%-confidence intervals (based on heteroskedasticity-consistent standard errors
where appropriate) left and right of the DRG-relevant thresholds.
Figure 7 shows the results for gestational age. Positive values indicate “excess” age, mean-
ing that infants in this birth weight bracket are older than expected. Since gestational age is irrel-
evant for reimbursement, there is no incentive to manipulate these data. Further, gestational age is
already determined at the time of birth and cannot be manipulated conditional on observed birth
weight.14
Figure 7 suggests systematic upcoding of children with low gestational age. At each DRG-
threshold except 600g, we find that those in the two 25g-brackets above the threshold (i.e. with
a recorded birth weight up to 49g higher than threshold) have higher than expected gestational
age. At thresholds 750g as well as 1,500g and above the difference across thresholds is substantial
(about two to four days) and significantly different from zero. As suggested in the preceding
section, this finding is consistent with the idea that infants with higher expected treatments costs
are more often upcoded.
14Gestational age (GA) can also be determined after childbirth using a set of clinical criteria (Finnstrom, 1977).However, in our data, it is calculated as the difference between date of birth and the beginning of the last menstrualperiod, unless the latter was not known. GA is missing for less than one percent of all births recorded in the hospitaldata. In our working sample of around 550,000 births <2,800g, there were 273 cases with implausible values (GA<20weeks or GA>45 weeks, see David (1980)), which were excluded from the analyses. We have no evidence that missingor implausible observations are found more or less often than normal among upcoded cases.
27

-4-2
02
4
500 550 600 650 700Recorded birth weight
600g
-20
24
650 700 750 800 850Recorded birth weight
750g
-2-1
01
2
800 850 900 950Recorded birth weight
875g
-10
12
3
900 950 1000 1050 1100Recorded birth weight
1000g-2
-10
1
1100 1200 1300 1400Recorded birth weight
1250g-2
02
46
1300 1400 1500 1600 1700Recorded birth weight
1500g
-2-1
01
23
1800 1900 2000 2100 2200Recorded birth weight
2000g
-2-1
01
2
2300 2400 2500 2600 2700Recorded birth weight
2500g
Figure 7: Excess average gestational age (in days) and 95% confidence intervals, by birth weightbracket. German hospital data 2006-2011.
Next, we look at the APGAR scores. The APGAR score is the most common measure of
neonatal health (Casey et al., 2001). Newborns are scored 0 to 2 on five subscales (for appearance,
pulse, grimace, activity, and respiration) one, five and ten minutes after birth. The sum of the
subscores yields the total APGAR score with range from 0 to 10. Scores below 4 are considered
critically low. Scores 7 and higher are considered normal. Very low APGAR scores at 5 minutes
are indicative of infants not responding well to the resuscitation efforts who thus have a high proba-
bility of dying within the next couple of hours or days (Iliodromiti et al., 2014). We estimated logit
regressions of the probability of infants having a higher than critically low five minute APGAR
score on 25g birth weight categories (results for one or ten minute scores were similar). Stillborn
infants, who have an APGAR score of zero, were excluded. Figure 8 shows the prediction errors
pertaining to each birth weight category as odds ratios. Values larger than one mean better than
expected average health, values lower than one mean worse than expected health.
Again, our main focus is the comparison of health levels left and right of the threshold.
Results differ slightly by birth weight threshold. At birth weights up to the 1,500g threshold,
28
infants with recorded birth weights above the threshold have systematically lower chances of a
higher than critical 5 minute APGAR score (except at the 875g value). In other words, healthier
infants in terms of APGAR scores appear to be systematically upcoded, and infants with critically
low APGAR scores tend not to be upcoded. At higher birth weights, i.e. around the 2,000g and
2,500g thresholds, there is no significant difference between those left and right of the threshold.
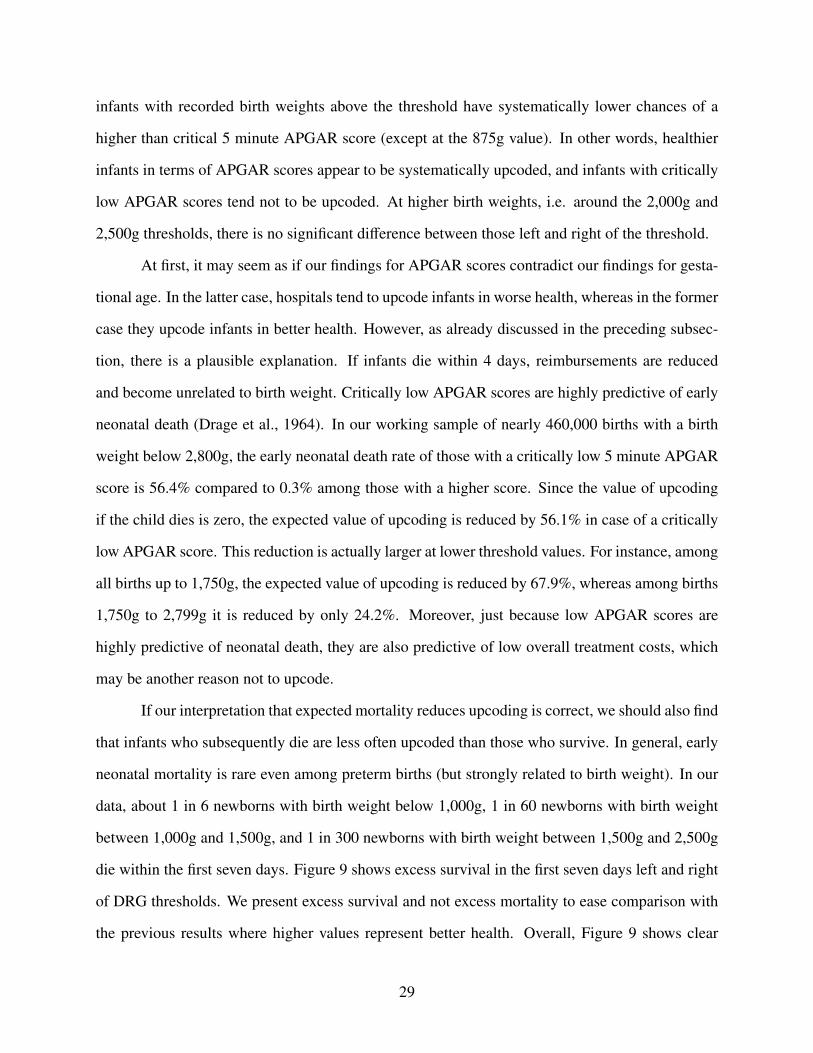
At first, it may seem as if our findings for APGAR scores contradict our findings for gesta-
tional age. In the latter case, hospitals tend to upcode infants in worse health, whereas in the former
case they upcode infants in better health. However, as already discussed in the preceding subsec-
tion, there is a plausible explanation. If infants die within 4 days, reimbursements are reduced
and become unrelated to birth weight. Critically low APGAR scores are highly predictive of early
neonatal death (Drage et al., 1964). In our working sample of nearly 460,000 births with a birth
weight below 2,800g, the early neonatal death rate of those with a critically low 5 minute APGAR
score is 56.4% compared to 0.3% among those with a higher score. Since the value of upcoding
if the child dies is zero, the expected value of upcoding is reduced by 56.1% in case of a critically
low APGAR score. This reduction is actually larger at lower threshold values. For instance, among
all births up to 1,750g, the expected value of upcoding is reduced by 67.9%, whereas among births
1,750g to 2,799g it is reduced by only 24.2%. Moreover, just because low APGAR scores are
highly predictive of neonatal death, they are also predictive of low overall treatment costs, which
may be another reason not to upcode.
If our interpretation that expected mortality reduces upcoding is correct, we should also find
that infants who subsequently die are less often upcoded than those who survive. In general, early
neonatal mortality is rare even among preterm births (but strongly related to birth weight). In our
data, about 1 in 6 newborns with birth weight below 1,000g, 1 in 60 newborns with birth weight
between 1,000g and 1,500g, and 1 in 300 newborns with birth weight between 1,500g and 2,500g
die within the first seven days. Figure 9 shows excess survival in the first seven days left and right
of DRG thresholds. We present excess survival and not excess mortality to ease comparison with
the previous results where higher values represent better health. Overall, Figure 9 shows clear
29

.51
1.5
2
500 550 600 650 700Recorded birth weight
600g
.51
1.5
2
650 700 750 800 850Recorded birth weight
750g
.6.8
11.
21.
41.
6
800 850 900 950Recorded birth weight
875g
0.5
11.
52
900 950 1000 1050 1100Recorded birth weight
1000g.5
11.
52
2.5
1100 1200 1300 1400Recorded birth weight
1250g0
.51
1.5
22.
5
1300 1400 1500 1600 1700Recorded birth weight
1500g
.51
1.5
22.
5
1800 1900 2000 2100 2200Recorded birth weight
2000g
.51
1.5
22.
5
2300 2400 2500 2600 2700Recorded birth weight
2500g
Figure 8: Excess risk (odds ratios) of having a higher than critical five minute APGAR-Score (> 3)and 95% confidence intervals, by birth weight bracket. German hospital data 2006-2011.
evidence that early neonatal survival is positively related to upcoding. Infants with recorded birth
weights left of a DRG-relevant threshold have larger survival probabilities, that is, healthier infants
are more often upcoded. We interpret this finding as evidence that upcoding decisions are driven by
expected reimbursements gains. The caveat here is that eventual mortality may be hard to predict
except in cases of extremely preterm infants who do not respond to the initial resuscitation efforts
(this is reflected in our results regarding the APGAR scores) and infants with some congenital
anomalies.
An alternative explanation is that preterm babies who are (accidentally) born in low-quality
low-volume hospitals have higher mortality rates while at the same time those hospitals have no
incentive to manipulate birth weights. To rule out this explanation as the main force behind the
results shown in Figure 9, we have repeated the same type of estimation on a sample restricted
to births with a specialized pediatrician present before birth (which indicates births in perinatal
centers). The left-right differences in survival (see Figure A.4 in Appendix A) become indeed
somewhat smaller but substantive differences remain.
30

.81
1.2
1.4
1.6
500 550 600 650 700Recorded birth weight
600g
.51
1.5
2
650 700 750 800 850Recorded birth weight
750g
.51
1.5
2
800 850 900 950Recorded birth weight
875g
.51
1.5
22.
5
900 950 1000 1050 1100Recorded birth weight
1000g.5
11.
52
2.5
1100 1200 1300 1400Recorded birth weight
1250g0
12
34
1300 1400 1500 1600 1700Recorded birth weight
1500g
01
23
45
1800 1900 2000 2100 2200Recorded birth weight
2000g
.51
1.5
22.
53
2300 2400 2500 2600 2700Recorded birth weight
2500g
Figure 9: Excess risk (odds ratios) of surviving the first seven days and 95% confidence intervals, bybirth weight bracket. German hospital data 2006-2011.
We conclude from our analysis that upcoding is systematically related to health indicators
that are indicative of a hospital’s financial gain or loss from treating a given infant. These indica-
tors are either predictive of treatment costs but unrelated to reimbursement (low gestational age)
or related to expected treatment costs and the expected value of the reimbursement due to early
neonatal death (APGAR scores or early neonatal mortality). Overall, the results in this section are
in line with the idea that doctors’ and midwives’ individual upcoding choices are clearly influenced
by the financial incentives in the German DRG system, but that these choices are not fully rational
as expected treatment costs appear to matter.
7 Summary and conclusion
In this paper we show that since the introduction of DRGs in German neonatal care, birth weights
around thresholds relevant for reimbursement are increasingly manipulated, i.e. systematically
shifted below the thresholds. We estimate that, between 2003 and 2010, about 12,000 newborns
with birth weights just above DRG thresholds have been recorded as having a birth weight below
31

the threshold. At some particularly salient thresholds the number of infants with birth weights
coded just below the threshold exceeds the number of infants just above the threshold by a factor
of ten. As a result, hospitals have received excess reimbursement of 114m Euro in our study period.
Currently, around 2,000 upcodes yield an additional 20m Euro annually.
We demonstrate that birth weight manipulation is systematically related to economic in-
centives. First, the proportion of upcoded cases is related to the reimbursement differential at the
respective threshold. Second, systematic upcoding can mostly be found in counties that have spe-
cialized perinatal care centers. In counties without such centers and where adequate care is not
available so that very low birth weight infants have to be transferred to perinatal care centers, we
find no evidence for systematic upcoding. This is because hospitals that are not perinatal centers
have no financial incentive to manipulate birth weights.
As our main innovation to the literature on upcoding, we have studied whether hospitals are
more likely to upcode newborns that appear to be less healthy and are thus more costly to care for,
conditional on recorded weight. We find that low gestational age (as a marker of expected length
of stay) systematically increases the chances of being upcoded. However, for alternative health
measures such as APGAR scores and early neonatal mortality, we find the opposite relationship.
Newborns with critically low APGAR scores are significantly less often upcoded. Our explanation
for this finding is that at lower birth weights, low APGAR scores are a significant predictor of
neonatal death. Since reimbursement is substantially reduced and independent of recorded birth
weight if a child dies within 4 days, incentives to upcode children with low survival chances are
comparatively small. Findings related to early neonatal mortality confirm this explanation: neona-
tal death within 7 days is related to significantly lower upcoding rates.
The results in our paper have several implications. The first is methodological. In a recent
paper, Almond et al. (2010) examine the effect of medical care on the health of low birth weight
infants in the U.S. exploiting a discontinuity in treatment provision around the 1,500g threshold.
They also find a corresponding discontinuity in outcomes (28-day mortality), with babies below
the threshold (and thus more intense treatment) having higher survival changes than babies above
32

the threshold. Although the results of this specific application of a regression discontinuity design
around birth weight threshold has been shown to critically depend on the inclusion of rounded
values at exactly 1,500g (Barreca et al., 2011), the general approach to study causal effects of
medical care on infant health seems useful. However, the relevance of our findings for any study in
Germany that aims at exploiting regression discontinuity designs along the lines of Almond et al.
is obvious. Since the “treatment determining variable” is clearly manipulated systematically along
infant health such a design is unfeasible.
A second implication relates to the nature of cheating in an environment where people
hold specific ethical standards but cheating is virtually undetectable. A purely rational model of
crime would predict that it does not matter which infant is upcoded. From the perspective of the
hospital the treatment costs of an admitted newborn are sunk and the best strategy is to upcode
newborns indiscriminately. Our data are clearly at odds with this simple model. Indicators of
neonatal health that are related to expected treatment costs, such as gestational age, are significant
predictors of upcoding. We interpret this finding as evidence that doctors and nurses find it easier
to manipulate birth weight if they can justify their actions by aligning expected treatment costs and
reimbursement.
Finally, our paper holds a message concerning optimal reimbursement in neonatal care.
Obviously, there are large differences between actual treatment costs and reimbursement for birth
weights close to the thresholds simply by construction of the DRGs. Immediately above each
threshold, actual average treatment costs are much larger than reimbursements, and immediately
below each threshold, they are much smaller. It is thus no surprise that hospitals try to align ex-
pected costs and reimbursements. The conclusion from our findings is that the current German
DRG-classification relying to a large extent on birth weight is inappropriate because it is too easy
to manipulate. But what are the alternatives? First, one could revert to the former per diem re-
imbursement for each day a newborn receives intensive care, although this creates well-known
incentives to increase length of stay in case of a uniform per diem rate. Second, one could reim-
burse hospitals on the basis of gestational age. Clearly, the day of conception can be calculated
33

and documented long before childbirth and the related records cannot be manipulated easily. But
this criterion is also problematic. If substantial decreases in reimbursement are related to merely
one additional day of pregnancy, this creates incentives to hospitals and doctors not to arrest labor,
which—in contrast to recording the wrong birth weight—may be harmful to the newborn’s health.
As a third alternative, one could reimburse hospitals based on a smooth function of birth weight
estimated from the data routinely collected to compute relative DRG weights. Unfortunately, this
scheme would not be perfect either. There would be small marginal gains in manipulating birth
weights along the entire birth weight distribution, and it is a priori unclear if in the end the sum
of many small unfair gains will or will not outweigh the sum of few large gains generated in the
present system. Ultimately one has to conclude that it is hard to design the perfect reimbursement
system. But of course, this is old news to health economists.
34

References
Abdel-Latif, M. E., Kecskes, Z., and Bajuk, B. (2013). Actuarial day-by-day survival rates ofpreterm infants admitted to neonatal intensive care in New South Wales and the Australian Cap-ital Territory. Archives of Disease in Childhood - Fetal and Neonatal Edition, 98(3):F212–F217.
Abler, S., Verde, P., Stannigel, H., Mayatepek, E., and Hoehn, T. (2011). Effect of the introduc-tion of diagnosis related group systems on the distribution of admission weights in very lowbirthweight infants. Arch Dis Child Fetal Neonatal Ed, 96:F186–F189.
Almond, D., Doyle, J. J., Kowalski, A. E., and Williams, H. (2010). Estimating marginal re-turns to medical care: Evidence from at-risk newborns. The Quarterly Journal of Economics,125(2):591–634.
AOK-Bundesverband (2012). Basisfallwerte (Zahlbetrag) aller DRG-Krankenhauser 2003-2012.Federal Association of the AOK.
Barreca, A. I., Guldi, M., Lindo, J. M., and Waddell, G. R. (2011). Saving babies? Revisiting theeffect of very low birth weight classification. The Quarterly Journal of Economics, 126(4):2117–2123.
Callaghan, W. M., MacDorman, M. F., Rasmussen, S. A., Qin, C., and Lackritz, E. M. (2006).The contribution of preterm birth to infant mortality rates in the United States. Pediatrics,118(4):1566–1573.
Casey, B. M., McIntire, D. D., and Leveno, K. J. (2001). The continuing value of the APGAR scorefor the assessment of newborn infants. The New England Journal of Medicine, 344(7):467–471.
Committee on Fetus and Newborn (2012). Levels of neonatal care. Pedriatrics, 120(3):587–597.
David, R. J. (1980). The quality and completeness of birthweight and gestational age data incomputerized birth files. American Journal of Public Health, 70(9):964–973.
Drage, J., Kennedy, C., and Schwarz, B. (1964). The Apgar score as an index of neonatal mortality:a report from the collaborative study of cerebral palsy. Obstetrics&Gynecology, 24(2):222–230.
Ellis, R. P. and McGuire, T. G. (1993). Supply-side and demand-side cost sharing in health care.Journal of Economic Perspectives, 7(4):135–151.
Finnstrom, O. (1977). Studies on maturity in newborn infants. IX. Further observations on the useof external characteristics in estimating gestational age. Acta Paediatr Scand, 66(5):601–604.
Freedman, S. (2014). Capacity and utilization in health care: The effect of empty beds on neonatalintensive care admission. Technical report, Indiana University. Bloomington School of Publicand Environmental Affairs Research Paper No. 2456305.
Geissler, A., Scheller-Kreinsen, D., Quentin, W., and Busse, R. (2011). Germany: UnderstandingG-DRGs. In Busse, R., Geissler, A., Quentin, W., and Wiley, M., editors, Diagnosis-RelatedGroups in Europe, pages 243–271. World Health Organization.
35

Gerber, A., Lauterbach, K., and Lungen, M. (2008). Manchmal ist weniger mehr – Wie vielePerinatalzentren der Level 1 und 2 sind in Deutschland gesundheitspolitisch notwendig undfinanzierbar? Deutsches Arzteblatt, 105(26):A1439–A1441.
Hoehn, T., Drabik, A., Lehmann, C., Stannigel, H., and Mayatepek, E. (2008). Correlation betweenseverity of disease and reimbursement of costs in neonatal and pediatric intensive care patients.Acta Paediatrica, 97:1438–1442.
Iliodromiti, S., Mackay, D. F., Smith, G. C. S., Pell, J. P., and Nelson, S. M. (2014). Apgar scoreand the risk of cause-specific infant mortality: a population-based cohort study. The Lancet,384:1749–1755.
InEK (2007). Kalkulation von Fallkosten. Handbuch zur Anwendung in Krankenhausern. Version3.0. Institut fur das Entgeltsystem im Krankenhaus gGmbH.
InEK (2009). G-DRG Fallpauschalen Katalog 2010. Institut fur das Entgeltsystem im Kranken-haus gGmbH.
InEK (2011). Abschlussbericht zur Weiterentwicklung des DRG-Systems fur das Jahr 2012. Institutfur das Entgeltsystem im Krankenhaus gGmbH.
Mazar, N., Amir, O., and Ariely, D. (2008). The dishonesty of honest people: A theory of self-concept maintenance. Journal of Marketing Research, 45(6):633–644.
Muller, C., Weiß, U., von Schnakenburg, C., and Hentschel, R. (2007). The significance of DRGrefunds in neonatology. Examples of calculations for a perinatal centre based on case numbersfor 2009. Monatsschr Kinderheilkd, 10:947–953.
Phibbs, C. S. and Schmitt, S. K. (2006). Estimates of the cost and length of stay changes thatcan be attributed to one-week increases in gestational age for premature infants. Early HumanDevelopment, 82(2):85–95.
Roemer, M. I. (1961). Bed supply and hospital utilization: a natural experiment. Hospitals, 35:36–42.
Shigeoka, H. and Fushimi, K. (2014). Supply induced demand for newborn treatment: Evidencefrom Japan. Journal of Health Economics, 35:162 – 178.
Silverman, E. and Skinner, J. (2004). Medicare upcoding and hospital ownership. Journal ofHealth Economics, 23:369–389.
Sloan, F. A., Picone, G. A., Jr., D. H. T., and Chou, S.-Y. (2001). Hospital ownership and cost andquality of care: is there a dime’s worth of difference? Journal of Health Economics, 20(1):1 –21.
Vogl, M. (2012). Assessing DRG cost accounting with respect to resource allocation and tariffcalculation: the case of Germany. Health Economics Review, 2:15.
36

A Supplementary Tables and Figures
Table A.1: Number of births 1996-2010, by year and birth weight category, including stillbirths.Source: Own calculations based on German birth records.
Year <1,000g 1,000g-1,499g 1,500g-2,499g >2,500+ Total
1996 4,181 5,413 41,658 748,399 799,6511997 4,112 5,548 42,706 763,223 815,5891998 4,211 5,408 42,309 736,265 788,1931999 4,213 5,549 42,593 721,289 773,6442000 4,164 5,444 41,665 718,942 770,2152001 4,165 5,199 40,629 687,231 737,2242002 4,126 5,232 40,722 671,870 721,9502003 4,112 5,042 40,503 659,763 709,4202004 4,426 5,207 41,271 657,446 708,3502005 4,200 5,005 39,030 640,049 688,2842006 4,247 4,924 38,335 627,636 675,1422007 4,455 5,198 39,025 638,563 687,2412008 4,205 5,105 38,556 637,052 684,9182009 4,244 5,138 38,244 619,836 667,4622010 4,351 5,290 38,838 631,934 680,413
37

Table A.2: Proportion of birth weights reported as multiples of 100, 50, and 10, 1996 to 2010 (ex-cludes Bavaria). Source: Own calculations based on German birth records.
Year 100s 50s 10s
1996 0.172 0.311 0.9741997 0.168 0.303 0.9701998 0.163 0.296 0.9641999 0.159 0.288 0.9552000 0.156 0.283 0.9462001 0.154 0.278 0.9382002 0.148 0.269 0.9292003 0.145 0.264 0.9222004 0.142 0.258 0.9152005 0.139 0.253 0.9092006 0.137 0.249 0.9042007 0.134 0.245 0.9002008 0.132 0.242 0.8982009 0.131 0.240 0.8912010 0.128 0.235 0.888
Table A.3: Estimated 7-day survival probabilities in 100g brackets around DRG-thresholds. Source:own computations from hospital quality data 2006-2011.
Threshold N births N died N died / 1000 births
600 2,602 592 227750 3,087 245 79875 3,240 116 36
1,000 3,953 121 311,250 4,897 81 171,500 7,413 78 112,000 16,880 86 52,500 50,033 50 1
38

24
68
24
68
24
68
24
68
24
68
600
750
875
1000
1250
1500
2000
2500 60
0
750
875
1000
1250
1500
2000
2500 60
0
750
875
1000
1250
1500
2000
2500
1996 1997 1998
1999 2000 2001
2002 2003 2004
2005 2006 2007
2008 2009 2010
Log
Cou
nt
Grams (log scale)
Figure A.1: Distribution of birth weights between 550 and 2750 grams, 1996 to 2010 without cor-rections for rounding. Dots show the number of births in 10g brackets in each year. Data before 2000do not included Bavaria. Vertical lines indicate DRG-relevant thresholds. Source: Own calculationsbased on German birth records.
39

.2.4
.6.8
.2.4
.6.8
.2.4
.6.8
.2.4
.6.8
.2.4
.6.8
.2.4
.6.8
.2.4
.6.8
.2.4
.6.8
.2.4
.6.8
.2.4
.6.8
.2.4
.6.8
.2.4
.6.8
1996 2000 2004 2008 1996 2000 2004 2008 1996 2000 2004 2008 1996 2000 2004 2008
DRG, 600 DRG, 750 DRG, 875 DRG, 1000
DRG, 1250 DRG, 1500 DRG, 2000 DRG, 2500
Non-DRG, 700 Non-DRG, 1100 Non-DRG, 1300 Non-DRG, 1700
Pro
port
ion
of b
irths
bel
ow th
resh
old
Year
Figure A.2: Proportion of still births with weight recorded below threshold (d = 25) at eight DRG-relevant thresholds and four non-relevant thresholds, 1996 to 2010. The vertical line indicates theintroduction of DRGs. The horizontal line indicates the “no upcoding” value of 50%. Source: Owncalculations based on German birth records.
40

.4.6
.81
.4.6
.81
.4.6
.81
.4.6
.81
.4.6
.81
.4.6
.81
.4.6
.81
.4.6
.81
.4.6
.81
.4.6
.81
.4.6
.81
.4.6
.81
2000 2004 2008 2000 2004 2008 2000 2004 2008 2000 2004 2008
DRG, 600 DRG, 750 DRG, 875 DRG, 1000
DRG, 1250 DRG, 1500 DRG, 2000 DRG, 2500
Non-DRG, 700 Non-DRG, 1100 Non-DRG, 1300 Non-DRG, 1700
Pro
port
ion
of b
irths
bel
ow th
resh
old
Year
Figure A.3: Proportion of live births with weight recorded below threshold (d = 25) at eight DRG-relevant thresholds and four non-relevant thresholds, 2000 to 2010. Birth weights exactly equal tothreshold values are excluded. Source: Own calculations based on German birth records.
41

.6.8
11.
21.
41.
6
500 550 600 650 700Recorded birth weight
600g
.51
1.5
2
650 700 750 800 850Recorded birth weight
750g
.51
1.5
2
800 850 900 950Recorded birth weight
875g
0.5
11.
52
900 950 1000 1050 1100Recorded birth weight
1000g
.51
1.5
22.
53
1100 1200 1300 1400Recorded birth weight
1250g
01
23
1300 1400 1500 1600 1700Recorded birth weight
1500g
.51
1.5
22.
53
1800 1900 2000 2100 2200Recorded birth weight
2000g
01
23
4
2300 2400 2500 2600 2700Recorded birth weight
2500g
Figure A.4: Excess risk (odds ratios) of surviving the first seven days and 95% confidence intervals,by birth weight bracket. Only perinatal centers included. German hospital data 2006-2011.
42

B Correcting birth weight distributions for rounding
In Section 4.1 we show changes in the distribution of birth weights from 1996 to 2010. Due to lackof precision of scales used in hospitals or due to midwives rounding birth weights, the originaldistribution shows substantial heaping at multiples of 50 or 100 (see Figure A.1). Such heapingalso occurs at DRG thresholds and potentially masks substantive changes in the distribution atthese thresholds.
In order to correct the empirical distribution of birth weights for rounding while preservingthe effects of upcoding, we have employed a simple regression based adjustment procedure. Thisprocedure is based on the assumption that – in the absence of financial incentives for upcoding – thesame proportion of birth weights would be rounded at DRG-relevant and non-relevant thresholds.To be specific, we estimate the following equation separately for three birth weight intervals (up to1,125g; between 1,125g and 1,750g; above 1,750g)
ln y = f (bw) + β1m50 + β2tm50 + β3m100 + β4tm100 + β5a50 + β6ta50 + β7a100 + β8ta100 + γt + ε
where y denotes the number of births in a 10g interval; f (bw) represents a fourth-order polynomialof birth weight (class midpoints); m50 and m100 are dummy variables for intervals that containmultiples of 50 (but not 100) or 100, respectively; a50 and a100 are dummy variables for intervalsjust left and right of multiples of 50 and 100, respectively; t denotes the observation year (witht = 0 in 2003). Further, t is interacted with all dummy variables to account for general time trendsin heaping and rounding.
Regression results are shown in Table B.1. For instance, the parameter for m100 shows theexcess percentage of cases in birth weight brackets that include multiples of 100, such as 600,700, and so on. The coefficients on m50 and m100 are increasing when going from left to right,which means that the percentage of multiples of 50 or 100 (and hence the percentage of roundedcases) is generally larger for higher birth weights. This is likely due to the fact that, from a clinicalperspective, rounding is less relevant larger infants. For very small infants, however, weight iswatched very carefully, and small changes can induce changes in clinical management.
The parameter for a100 shows the deficit in the number of cases left and right of brackets thatinclude multiples of 100, i.e. in the brackets where most of the rounded cases originally belong.Our approach is symmetric in the sense that we estimate the same percentage left and right of thebracket. However, estimates without this constraint are very similar.
The estimated parameters β1 to β8 are then used to correct the distribution of birth weightsfor rounding.
ln yc = ln y − (β1m50 + β2tm50 + β3m100 + β4tm100 + β5a50 + β6ta50 + β7a100 + β8ta100)
where yc is the corrected number of births in each 10g interval.
43

Table B.1: Regression of numbers of births on indicator variables for 10g birth weight bracketsincluding multiples of 50 and 100 as well as neighboring brackets
(1) (2) (3)bw ∈ [550, 1125] bw ∈ (1125, 1750] bw ∈ (1750, 2800]
m50 0.0578* 0.127*** 0.216***(0.0305) (0.0245) (0.00644)
tm50 -0.00781 -0.00953 -0.0119***(0.00706) (0.00643) (0.00152)
m100 0.187*** 0.281*** 0.391***(0.0478) (0.0423) (0.00857)
tm100 -0.0356*** -0.0244** -0.0221***(0.0110) (0.0107) (0.00222)
a100 -0.0497 -0.0630* -0.116***(0.0372) (0.0347) (0.00902)
ta100 0.00320 0.00105 0.00424*(0.00806) (0.00845) (0.00221)
a50 0.00347 -0.00535 -0.0302***(0.0268) (0.0220) (0.00501)
ta50 0.00111 0.000141 -0.000834(0.00670) (0.00607) (0.00126)
t -0.00420 -0.0147*** -0.00487***(0.00429) (0.00463) (0.00117)
f (bw) yes yes yes
Constant 82.66 16.76*** 3.089***(59.97) (3.823) (0.636)
Observations 855 945 1,500R-squared 0.181 0.448 0.983Robust standard errors in parentheses*** p<0.01, ** p<0.05, * p<0.1
44

C The market for neonatal intensive care in Germany
Since 2006, neonatal care hospitals in Germany are assigned to four different levels of treatmentcapacity. The assignment of a hospital to a certain level is based on the following structural char-acteristics: professional standards for medical and nursing care, hours of shift work and standbyduty, number of normal, respiration and intensive care beds, and cooperation with pediatric hospi-tals and specialists (e.g. children’s cardiology). Further, a minimum number of treated cases peryear is required. These assignments are periodically reviewed. In contrast to international con-ventions (see e.g. Committee on Fetus and Newborn (2012)), levels of increasing capabilities aregiven lower numbers. Thus Level 4 denotes regular maternity clinics. Mothers at risk of givingbirth prematurely are admitted to Level 3, 2 or 1 “perinatal centers”, depending on predicted ges-tational age or birth weight. Table C.1 summarizes the characteristics of newborns and the levelof perinatal care centers capable of treating those children. In total, there are about 270 Level 1, 2and 3 centers in Germany.
Table C.1: Characteristics of newborns and their assignment to perinatal care center level
Category Level 1 Level 2 Level 3
Birth weight in gram <1,250 1,250-1,499 ≥1,500Week+days of gestation <29+0 29+0 to 32+0 32+1 to 36Note: Classification criteria according to the agreement of the Joint Federal Commit-tee, 2005
Level 1 perinatal centers provide the most advanced intensive care. They must have at leastsix intensive care beds, the neonatal intensive care unit has to be located close to the deliveryroom, and a specialized newborn emergency physician is required. About 60% of all perinatalcare centers in Germany are Level 1, mostly in bigger cities.15 Typically, mothers at risk of giv-ing birth prematurely choose Level 1 perinatal centers for childbirth, so that infants need not betransferred after birth. Analyses of German birth records 2003 to 2010 reveal that of about 72,000births with very low birth weight, 48% percent took place outside the county of residence of themother. Neonatal care for low weight infants is concentrated in a few counties: 50% of live births<1,500g were registered in less than 10 percent of all German counties. The five counties withthe largest number of very low weight births are Berlin, Munich, Hamburg, Cologne, and Bonn,covering 17.6% of all such births (but only 10.8% of mothers). An ongoing discussion relates tothe minimum number of cases per annum a perinatal care center should care for to be assigned toLevel 1. The idea is that a certain minimum number of cases is necessary for a hospital to have therelevant experience and provide sufficient quality of care. The current threshold is 14 cases withbirth weight <1,250g per year.
Level 2 centers account for roughly 25% of all perinatal centers. They need to have at leastfour intensive care beds. Until 2010, they also had to care for at least 14 cases per year, but this
15Usually, hospital supply is determined in hospital plans that are drawn up at the federal state level. However, asinformation about the presence of perinatal care centers were not available for the majority of federal states’ hospitalplans, the proportion of care levels was estimated based on results of a review of hospitals’ individual websites, supple-mented by information from the German hospital search website www.deutsches-krankenhaus-verzeichnis.de.
45

requirement was recently abolished by the Federal Joint Committee (G-BA), the highest decision-making body in the German health system. Thus in contrast to Level 1 perinatal care centers, nominimum number of cases is necessary for a hospital to obtain Level 2 status.
Hospitals with an insufficient number of intensive care beds but with mechanical ventilationfacilities are assigned to Level 3. They represent about 15% of all perinatal hospitals. Level3 hospitals cooperate with neighboring children’s hospitals but do not have not have a specialnewborn emergency physician or children’s specialists.
Germany has a comparatively high density of neonatal care facilities (Gerber et al., 2008).There are roughly two Level 1 neonatal care centers per 10,000 births. In contrast, in Nordiccountries, France and the Netherlands, the number of centers per 10,000 births is less than one.Between 2003 and 2011, the number of beds in neonatal care has increased by more than 10%,while the total number of beds in German hospitals and the number of beds in general pediatricshas decreased by about 10%. The strong increase in the number of neonatal care beds seems tohave been supply rather than demand driven. Between 2000 and 2010, the annual number of birthsbelow 1,500g has increased by just about 1.4% (from 9,508 to 9,604).
46