What drives sovereign debt portfolios of banks in a crisis ... · The Working Paper Series seeks to...
54
WHAT DRIVES SOVEREIGN DEBT PORTFOLIOS OF BANKS IN A CRISIS CONTEXT? Matías Lamas and Javier Mencía Documentos de Trabajo N.º 1843 2018
Transcript of What drives sovereign debt portfolios of banks in a crisis ... · The Working Paper Series seeks to...

WHAT DRIVES SOVEREIGN DEBT PORTFOLIOS OF BANKS IN A CRISIS CONTEXT?
Matías Lamas and Javier Mencía
Documentos de Trabajo N.º 1843
2018

WHAT DRIVES SOVEREIGN DEBT PORTFOLIOS OF BANKS IN A CRISIS CONTEXT?

WHAT DRIVES SOVEREIGN DEBT PORTFOLIOS OF BANKS
IN A CRISIS CONTEXT?
Matías Lamas and Javier Mencía (*)
BANCO DE ESPAÑA
(*) Contact authors: [email protected], [email protected]. We thank Ángel Estrada and David Martínez-Miera for his very helpful comments. We also thank seminar participants at Banco de España for their useful comments andsuggestions. We are very grateful to Fabián J. Arrizabalaga, Clara I. González, Ana Molina and Pedro Carpintero forexcellent data assistance. We also thank Peter Hoffmann, Manfred Kremer, Sonia Zaharia and Francesca Barbierofor their kind willingness to explain to us some of their work, which we have used in this paper. The opinions expressed in this document are solely responsibility of the authors and do not represent the views of the Banco de España.
Documentos de Trabajo. N.º 1843
2018

The Working Paper Series seeks to disseminate original research in economics and fi nance. All papers have been anonymously refereed. By publishing these papers, the Banco de España aims to contribute to economic analysis and, in particular, to knowledge of the Spanish economy and its international environment.
The opinions and analyses in the Working Paper Series are the responsibility of the authors and, therefore, do not necessarily coincide with those of the Banco de España or the Eurosystem.
The Banco de España disseminates its main reports and most of its publications via the Internet at the following website: http://www.bde.es.
Reproduction for educational and non-commercial purposes is permitted provided that the source is acknowledged.
© BANCO DE ESPAÑA, Madrid, 2018
ISSN: 1579-8666 (on line)
Abstract
We study determinants of sovereign portfolios of Spanish banks over a long time-span, starting
in 2008. Our findings challenge the view that banks engaged in moral hazard strategies to
exploit the regulatory treatment of sovereign exposures. In particular, we show that being a
weakly capitalized bank is not related to higher holdings of domestic sovereign debt. While
a strong link is present between central bank liquidity support and sovereign holdings,
opportunistic strategies or reach-for-yield behavior appear to be limited to the non-domestic
sovereign portfolio of well-capitalized banks, which might have taken advantage of their higher
risk-bearing capacity to gain exposure (via central bank liquidity) to the set of riskier sovereign
bonds. Furthermore, we document that financial fragmentation in EMU markets has played a
key role in reshaping sovereign portfolios of banks. Overall, our results have important
implications for the ongoing discussion on the optimal design of the risk-weighted capital
framework of banks.
Keywords: banks’ sovereign holdings, sovereign crisis, moral hazard, central bank liquidity,
EMU financial fragmentation.
JEL Classification: G01, G21, H63.

Resumen
Estudiamos los determinantes de las tenencias de bonos soberanos de los bancos españoles
sobre un período prolongado, que comienza en 2008. Nuestros resultados cuestionan la
hipótesis de que los bancos decidieron sus estrategias de inversión en función de factores de
riesgo moral, explotando el tratamiento regulatorio de las exposiciones soberanas. En
concreto, mostramos que no hay relación entre un nivel bajo de capitalización bancaria y
unas tenencias más elevadas de deuda soberana nacional. Aunque existe un fuerte vínculo
entre el apoyo del banco central, a través de sus programas de liquidez, y las tenencias de
deuda soberana, los comportamientos de tipo oportunista, o de búsqueda de rentabilidad,
parecen limitarse a la cartera de deuda soberana extranjera de los bancos mejor
capitalizados. Estos podrían haberse beneficiado de su mayor capacidad de absorción de
riesgos para aumentar su exposición (vía liquidez del banco central) a los bonos soberanos
más arriesgados. Por otro lado, también documentamos que la fragmentación financiera
en los mercados de la zona del euro ha desempeñado un papel clave en la composición de
las carteras soberanas. Nuestros resultados tienen implicaciones importantes para la
discusión en curso sobre el diseño óptimo del tratamiento regulatorio de las exposiciones
soberanas.
Palabras clave: tenencias bancarias de deuda soberana, crisis soberana, riesgo moral,
liquidez del banco central, fragmentación financiera en la zona del euro.
Códigos JEL: G01, G21, H63.

BANCO DE ESPAÑA 7 DOCUMENTO DE TRABAJO N.º 1843
1 Introduction
The 2010-2012 European sovereign crisis coincided with a strong upsurge of domestic
sovereign exposures of banks based in distressed countries. What drives sovereign debt
portfolios in a crisis context? Some authors claim that undercapitalized banks took advantage
of the particular design of prudential regulation, which assigns a zero risk-weight to domestic
sovereign exposures (see, for instance, Acharya and Steffen, 2015). According to their view,
those weak banks would have made risky bets on distressed sovereign debt, sometimes
with the purpose of generating sufficient profits to avoid a default (gambling for resurrection),
other times simply to boost profitability through carry trade. Whatever the ultimate reason,
these authors argue that the banks that followed this strategy did not internalize bad outcomes,
in which the credit quality of distressed sovereigns would further deteriorate. If and when the
risk had materialized, resulting losses in sovereign portfolios might have ended up being shared
with banks´ creditors, or even taxpayers. Thus, this strand of the literature links the increase in
holdings of distressed sovereign debt during the crisis to the execution of moral hazard or risk-
shifting strategies.
In our paper, we empirically study to what extent the above-mentioned statements are
supported by the data using a very granular dataset with information from Spanish banks,
starting in 2008. We go beyond the period of sovereign turmoil, which ensures that our
conclusions are not delimited to this crisis-event (although we also test the validity of
our findings in that period). Contrary to other papers, we also consider holdings of non-
domestic debt to enrich the analysis. Spain is a perfect “laboratory” for this exercise: tensions
in the sovereign market followed the real estate crisis, which put the banking industry under
strong profitability pressures against a backdrop of reduced lending opportunities in the
economy. In this context, banks´ holdings of Spanish sovereign debt augmented sharply.
However, not all banks were symmetrically affected by the economic crisis. Stronger
international players and some more prudent domestic players were able to weather the crisis
in better conditions. This cross-sectional heterogeneity is essential to assess how weaker and
stronger banks reacted to the same shocks. In addition, the fact that the Eurosystem was an
active lender of last resort in this period adds an interesting dimension to the study.
We start by discussing some relevant graphical evidence on the evolution of sovereign
debt holdings of larger EMU banking systems, including a breakdown of non-domestic
sovereign debt holdings between debt issued by distressed and non-distressed governments
in the EMU, or by countries more and less affected by the crisis (MAC and LAC, respectively).
The latter set of data is obtained from the Securities Holdings Statistics by Sector (SHSS) of the
ECB, which collects (at the ISIN level) holdings of debt of different institutional sectors in each
jurisdiction, including banks. The data shows the well-known fact that banks in MAC countries
augmented domestic bond holdings during the sovereign crisis period. We also observe that,
at the height of the sovereign crisis, banks from MAC countries got rid of a substantial part of
their non-domestic MAC debt portfolios. This result is striking. If, according to some authors,
there was a bet on domestic sovereign bonds, why did banks not extend the bet to non-
domestic MAC debt? Thus, considering both domestic and non-domestic sovereign debt
holdings is key to answer this question.
Our empirical exercise exploits a rich dataset obtained from confidential supervisory
reporting data, which offers an extensive coverage of sovereign portfolios and other relevant

BANCO DE ESPAÑA 8 DOCUMENTO DE TRABAJO N.º 1843
balance sheet items of Spanish banks. With this dataset, we control for several time-varying
bank-level variables, including size, international activity, solvency and banks´ complexity,
ensuring that we are able to disentangle moral hazard motivations from alternative drivers of
purchases of sovereign bonds. In addition, we consider several relevant macro-financial
variables to control for overall business conditions, drawing information from private and public
data sources. Within the former group of variables, we introduce a novel indicator developed
by the ECB (ECB, 2018), which measures financial fragmentation in EMU markets, or price
dispersion across countries of in theory very similar assets. We argue that this variable captures
inter alia EMU break-up concerns. An increase in financial fragmentation could result in a “re-
nationalization” of sovereign portfolios (Angelini et al., 2014), or a substitution of non-domestic
debt for domestic debt.
In our initial set of regressions, the dependent variable is the quarterly change in
domestic sovereign debt banks’ holdings. We first assess whether moral hazard (risk-shifting)
mechanisms alla Altavilla et al (2017) played a role in redrawing banks´ sovereign portfolios. In
this respect, we do not find evidence in favor of moral hazard. First, we find that being a poorly
capitalized bank is not associated with higher holdings of domestic sovereign bonds. In
addition, we show that weak banks did not take advantage of depressed market
conditions/sentiment to expand their portfolios of sovereign bonds. Finally, we document a
positive link between bank-level central bank funding and (the growth of) sovereign debt
holdings. This might give the impression that banks engaged in carry trade/opportunistic
strategies alla Acharya and Steffen (2015), using proceeds from Eurosystem lending operations
to invest in high-yield sovereign debt. The relationship central bank liquidity-sovereign bonds is,
however, unrelated to the capital level of banks, which suggests that the moral hazard
hypothesis does not hold.
Our analysis concludes that macroeconomic factors, rather than opportunistic
strategies, play an important role in sovereign holdings. In particular, banks tend to increment
(domestic) sovereign holdings during downturns (when GDP drops), and decrease these holdings
in upturns. Interestingly, financial fragmentation in the EMU also explains higher holdings of
domestic sovereign debt. We associate this behavior with a search for “hedge”: elevated
fragmentation in financial markets reflect the risk of an EMU break-up, or the risk of a
redenomination of banks´ balance sheet items from euros to new national currencies. In this
context and to prevent currency mismatches, banks have an incentive to re-nationalize their
(sovereign) portfolios. In addition, self-preservation motives (ESRB, 2015) may also push banks
to increase their domestic sovereign debt holdings to reduce the likelihood of an event that
would have devastating consequences for them, regardless of their domestic sovereign
exposures (see also Andreeva and Vlassopoulos, 2016).
Lastly, we look further into the moral hazard hypothesis by exploring the behavior of
distressed banks. In our framework, an institution in distress is characterized by a weak level of
capital, and a high level of non-performing loans (NPLs), both expressed in relative terms with
respect to its peers. Of course, high NPL levels reflect bad past decisions (granting low-quality
loans), but might also indicate that the set of investment/lending opportunities of a bank has
narrowed down: a bank may not be able to find solvent borrowers in its traditional market
niche, and it may even be harder to reach other markets under a general economic recession.
In our empirical exercise, we find that distressed institutions have a stronger propensity to pile
up domestic sovereign bonds. We link this relationship to the particular portfolio constrains that
this set of banks confronts rather than to moral hazard behavior.

BANCO DE ESPAÑA 9 DOCUMENTO DE TRABAJO N.º 1843
We perform several robustness checks to confirm the validity of our results. First of all,
we formally study the preference of banks for 1) holding domestic versus non-domestic EMU
sovereign debt (propensity to domestic concentration1), and 2) holding non-domestic MAC
debt in detriment of LAC debt (preference for higher-yielding sovereign securities). This analysis
serves us to double check the validity of our main findings, but it also offers some interesting
new insights. In particular, we study the preference for holding domestic sovereign debt instead
of debt with similar risk-return characteristics (non-domestic MAC debt), thus controlling for
moral suasion mechanisms alla Altavilla et al (2017), according to which some public authority
would be pushing banks towards holding more domestic sovereign debt. Our results do not
offer support for the presence of moral suasion or moral hazard mechanisms. Financial
fragmentation, on the contrary, emerges as a major driver of domestic concentration. Finally,
our results are consistent with the execution of opportunistic strategies in the non-domestic
debt portfolio. These strategies would be led by well-capitalized banks, or banks with higher
risk-bearing capacity.
Our results are further robust to alternative specifications. In particular, we examine
their validity at the height of the sovereign crisis, and we find that they firmly hold. Interestingly,
in this period there is modest evidence that banks followed contrarian strategies in the
sovereign market, buying sovereign debt when prices were more depressed. This could be
consistent with the view that banks are willing to support sectors in distress for which they hold
large exposures, a channel recently documented by Giannetti and Saidi (2017) for industries in
distress. As before, the relationship prices-sovereign holdings is unrelated to banks’ capital
levels. On another level, our results are robust to different strategies for identifying the set of
weakly capitalized banks. Lastly, our findings hold when controlling for the behavior of banks
that during the crisis were acquired by other institutions (in the main body of the paper, we
consider them as part of their current banking group).
To the best of our knowledge, our paper is the first to confront at the same time bank-
level factors (similarly to Altavilla et al., 2017) together with the impact of financial fragmentation
in EMU to explain changes in sovereign bond holdings. It is also the first that empirically shows
that the latter element, rather than opportunistic strategies, was determinant in explaining home
bias behavior (propensity to hold domestic bonds instead of foreign securities) during the crisis,
confirming the hypothesis enunciated by Angelini et al. (2014). In line with Peydró et al. (2017),
we also find evidence that banks dealt with domestic and non-domestic sovereign debt in a
different fashion, and that well-capitalized banks could bet on high-yield, non-domestic MAC
bonds using proceeds from Eurosystem lending operations. Finally, the finding that distressed
banks with high levels of non-performing assets buy more (domestic) sovereign bonds is an
important one. It suggests that portfolio constraints, i.e. the lack of investment opportunities in
the economy, could drive sovereign bonds holdings. This, in turn, could challenge moral
hazard/gambling for resurrection theories (see, for instance, Acharya and Steffen, 2015).
On the policy front, we think that our research might contribute to the ongoing
discussion on the optimal risk-weighted capital framework of banks (see BCBS, 2018). In
particular, the finding that banks increased their sovereign debt holdings when market
sentiment was depressed and no other investors were willing to step in adds an interesting
dimension to the discussion about the so-called “diabolic loop” or the nexus between
sovereign risk and bank credit risk. This term is used to refer to the fact that strains in one of
the two sectors, the sovereign or the banking sector, feed tensions in the other (see, for
1 Other authors have also studied home bias of banks´ sovereign portfolios in the Eurozone crisis context. See, for
instance, Battistini et al. (2014) or Horváth et al. (2015).

BANCO DE ESPAÑA 10 DOCUMENTO DE TRABAJO N.º 1843
instance, Acharya et al., 2014). Since the nexus might be more intense when banks hold large
sovereign exposures, the idea of imposing penalties on the latter has gained ground in the
policy discussion. However, our research reveals a novel feature of the nexus: in a crisis
context, domestic banks could help stabilize the sovereign market (see Angelini et al., 2014, for
similar findings in the case of Italy). This, in turn, translates into financial stability dividends.
Our paper is structured as follows. Section 2 provides a rationale of why banks decide
to hold sovereign bonds in a crisis context. Section 3 describes the evolution of sovereign
portfolios of larger EMU banking systems, including the Spanish banking system. Section 4
describes the data and presents the empirical study. Section 5 incorporates some extensions
and robustness tests. Finally, section 6 concludes.

BANCO DE ESPAÑA 11 DOCUMENTO DE TRABAJO N.º 1843
2 Why do banks hold sovereign debt in a crisis context?
In a crisis context, banks gain exposure to distressed sovereign debt for different reasons. After
a thorough review of the literature, we can summarize the channels that could be present in the
following list:
I. Moral hazard or risk-shifting channel. The asymmetric nature of the pay-offs of
distressed sovereign bonds would give undercapitalized banks a strong incentive to
invest in this market segment (Drechsler et al., 2016). In the good states of nature,
strained sovereigns honor their debt and banks´ shareholders cash in the (sometimes
substantial) credit risk premium embedded in these securities. In the bad states,
though, distressed sovereigns default and subsequent losses in poorly capitalized
institutions end up being shared between shareholders and creditors. Thus,
according to this channel, a transfer of risks (from shareholders to debt holders, and
ultimately to taxpayers) seems to operate when weak institutions invest in distressed
sovereign bonds. Acharya and Steffen (2015) further suggest that the appeal of
holding these bonds would be amplified by the design of the credit risk framework of
Basilea, which assigns a zero risk-weight to sovereign exposures irrespective of the
associated credit risk.2
II. Non-moral hazard hypotheses, comprising two modalities:
a. Execution of opportunistic strategies. As other investors, banks would be
screening opportunities in the marketplace in view of their risk-return preferences.
If yields rise sufficiently for sovereign debt, banks would gain exposure to this
segment to seize what they perceive as a valuable market opportunity. Thus, at
times of stress, reach-for-yield behavior could play a role in the set-up of
sovereign portfolios.3
b. Role of central bank liquidity. The build-up of sovereign debt holdings might be
facilitated by the availability of central bank liquidity, particularly if provided at
favorable terms (Brutti and Sauré, 2016). When this happens, opportunistic
strategies could still be present but interact with exogenous interventions by the
central bank, which targets price stability. In parallel, banks might tap Eurosystem
loans and buy sovereign debt to increase their collateral cushion (liquidity
hoarding), deteriorated in a crisis context (Peydró et al., 2017). This is clearly
dissociated from opportunistic behavior.
Before introducing the empirical section, we address two potential concerns related to the
identification of the aforementioned channels.
a. Do moral hazard and opportunistic behavior overlap? Our answer is no.
Opportunistic behavior is in some aspects observationally equivalent to moral
2 Risk-weight of sovereign bonds issued by non-domestic issuers can also be set at 0%. For instance, for any banking
system based in the Economic and Monetary Union (EMU), bonds denominated in euros and issued by the central
government of other EMU jurisdictions receive the same regulatory treatment as domestic government debt.
3 Alternatively and in light of risk-return considerations, banks might increase sovereign debt holdings in detriment of
other exposures, including credit to the private sector. Our paper, however, does not address real effects. Thus, we do
not study this channel.

BANCO DE ESPAÑA 12 DOCUMENTO DE TRABAJO N.º 1843
hazard: banks buy distressed sovereign debt and capture the extra yield of this
asset class. But it differs from the moral hazard hypothesis in the central aspect that
undercapitalized institutions do not lead distressed bonds purchases, i.e. either
strong banks do it (taking advantage of their higher risk-bearing capacity) or simply
all institutions embrace opportunistic strategies, irrespective of their capital level.
b. Omitted variable bias: presence of macro shocks. We note that, beyond the
previous channels, sovereign holdings might be sensitive to macro-financial or
overall conditions. Channels of transmission of macro shocks are multifaceted. For
instance, the lack of solvent credit demand during downturns would narrow down
the set of banks’ investment opportunities, which would react by increasing their
sovereign exposures (Castro and Mencía, 2014). Furthermore, in connection with
the particular set-up of the EMU, tensions in the sovereign market might
introduce the perception that the monetary union is not irreversible (fears of an
EMU break-up). The resulting financial fragmentation could lead banks to increase
their domestic sovereign debt holdings, a “natural” hedge against the risk of
redenomination in banks´ balance sheets (Angelini et al., 2014). In our empirical
exercise, we treat macro factors as common shocks to banks, and deal with them
either by introducing different time-varying macro variables or with time fixed
effects. Together with bank-level controls, this approach should allow us to
disentangle moral hazard behavior from the alternative channels.

BANCO DE ESPAÑA 13 DOCUMENTO DE TRABAJO N.º 1843
3 Graphical evidence: sovereign portfolios in Spain and other EMU countries
This section describes some stylized facts relating to banks’ sovereign debt holdings. While our
empirical exercise focuses on Spanish banks, here we present a concise description of the
evolution of sovereign debt holdings for the whole EMU. This will show that some
developments in Spanish banks´ sovereign portfolios, like the increase in home bias over the
sample period, largely mirror dynamics in other jurisdictions, especially in more-affected-
by-the-crisis (MAC) countries. Based on these similarities, we argue that the more formal
results that we obtain in the subsequent sections of the paper using Spanish data provide
conclusions that are also valid in a broader context.
We use the following data sources: balance sheet items are obtained from the Statistical
Data Warehouse (SDW) of the ECB and the Bruegel database of Eurosystem lending operations
developed by Pisani-Ferry and Wolff (2012), while macroeconomic and financial variables are
obtained from Eurostat and Reuters. We also add a breakdown of non-domestic EMU sovereign
debt holdings for each banking system. This granularity is provided by the SHSS of the ECB, an
innovative and proprietary database which collects, among other, holdings of debt of different
institutional sectors in each jurisdiction, including banks, at the ISIN level.
As is widely known, EMU banks augmented their holdings of domestic sovereign
bonds following the financial crisis (figure 1). The increase was more pronounced in MAC
banking systems, including the Spanish one, than in less-affected-by-the-crisis (LAC) systems:
holdings in the former more than tripled since the aftermath of the financial crisis, while the
upsurge of domestic debt holdings in LAC systems was more modest.4 In both cases,
however, the tendency to accumulate domestic bonds halted at the end of 2013.
Which are the driving forces behind this re-composition of banks´ portfolios? The
following figures offer initial insights founded on the theoretical discussion from the previous
sections. Figure 2 displays the Return on Equity of the largest EMU banking systems as well as
sovereign yields in 2012Q2, when they hit record levels in the MAC markets. The figure illustrates
that profitability pressures were stronger in the MAC area at the peak of sovereign strains (higher
sovereign yields, lower profitability in the banking sector), when sovereign spreads escalated
sharply. On the other hand, figure 3 shows the use by banks of Eurosystem lending operations
as well as their holdings of domestic sovereign debt. These two variables grew at a similar
pace until the end of 2012, when compression in MAC yields sped up. Finally, figure 4 shows
the evolution of GDP in MAC and LAC countries, together with holdings of domestic sovereign
bonds. With activity falling across the board at critical moments, like after the advent of the
financial crisis or during the period of more acute sovereign strains, banks might have needed
to resort to sovereign securities to maintain the value of their asset portfolio. This link seems to
be stronger in the MAC area, where activity was hit more severely.
Finally, we also analyse holdings of non-domestic bonds issued by EMU governments,
differentiating between holdings of debt issued by LAC (figure 5) and MAC countries (figure 6).
While holdings of LAC country bonds remained relatively stable over the sample period (apart
from an uptick in the after-crisis period), holdings of MAC debt appear to be negatively
4 Countries are classified as MAC or LAC according to Altavilla et al. (2017). LAC countries are Austria, Belgium, Estonia,
Finland, France, Germany, Luxembourg, Malta, The Netherlands and Slovakia. MAC countries are Cyprus, Greece,
Ireland, Italy, Portugal, Slovenia and Spain.

BANCO DE ESPAÑA 14 DOCUMENTO DE TRABAJO N.º 1843
correlated with domestic bond holdings: coinciding with the outbreak of the sovereign crisis,
banks reduced their exposure to this type of debt (as domestic debt holdings augmented),
while this dynamic somewhat reversed in the final years of the sample (in these years, domestic
debt holdings stopped growing). This result is interesting since it shows that home bias
prevailed over the incentive to gain the credit risk premium of non-domestic distressed
sovereign debt, especially in MAC countries. It further suggests that confronting domestic and
non-domestic debt holdings could clarify the determinants behind changes in sovereign
exposures.

BANCO DE ESPAÑA 15 DOCUMENTO DE TRABAJO N.º 1843
4 Empirical exercise
4.1 The data
Our empirical exercise aims to examine the hypotheses outlined in section 2. For this purpose,
we consider quarterly observations from 2008Q1 to 2016Q4 on domestic sovereign debt
holdings as well as other relevant balance sheet items of Spanish banks, together with macro-
financial variables for Spain and the EMU. In this way, we formally study the determinants of
debt holdings beyond the period of more acute sovereign strains, which is usually the target of
the most recent literature. We also provide some rationale about why banks decide to hold
domestic instead of non-domestic sovereign bonds, which will help enrich our analysis.
Our data refer to the fourteen significant institutions identified in Spain as of the end of
2016.5 Each banking group is treated as a single unit according to its composition as of 2016Q4
to control for the intense activity of banking mergers and acquisitions in recent years.6 This
ensures that the sample covers the vast majority of banks´ assets in Spain (on average, we cover
96% of total banking assets over the sample period). For this set of banks, we obtain sovereign
holdings and balance sheet items on a consolidated basis from their confidential reporting
statements to Banco de España (Table 1, panel A).7 The previous set of data is complemented
with market and macro indicators obtained from Reuters and Eurostat (Table 1, panel B).
With regard to bank-level variables, we go beyond the standard controls related to
size and solvency and try to capture in addition key elements of banks´ business models. This
is important, since some Spanish banks are global institutions with a large set of subsidiaries
and branches operating abroad, while other institutions function almost exclusively in the
domestic market. International banks might be more prone to diversify their sovereign
portfolios; consequently, we introduce a control related to the cross-border activity of banks. In
addition, some institutions focus on the more traditional business model of taking deposits
from the public and granting loans, while others are more active conducting market making
services, providing credit to other banks in interbank markets or trading in the derivatives
markets. The latter might be less prone to concentrating bond holdings in the domestic
sovereign segment, since their greater resources might allow them to identify other profitable
opportunities. Complexity, thus, should be taken on board. We do so by considering aspects
like the weight of derivatives in banks’ balance sheets or the prevalence of market-based
versus retail sources of funding.
4.2 Moral hazard versus alternative channels
We begin with a specification that partially follows the strategy of Altavilla et al. (2017), who test
the validity of the moral hazard hypothesis for a sample of European banks. Our proposed
equation is as follows:
5 List of significant Spanish institutions, in alphabetical order, according to the Single Supervisory Mechanism: ABANCA
Holding Financiero S.A., Banco Bilbao Vizcaya Argentaria, S.A., Banco de Sabadell, S.A., BFA Tenedora De Acciones
S.A.U., Banco Mare Nostrum, S.A, Banco Santander, S.A., Banco Popular Español, S.A., Bankinter, S.A., Ibercaja
Banco, S.A., Criteria Caixa S.A.U., Banco de Crédito Social Cooperativo, S.A., Kutxabank, S.A., Liberbank, S.A. and
Unicaja Banco, S.A.
6 Nevertheless, we also re-estimate the main regressions without merging banks backwards in the robustness checks
section. 7 The panel is unbalanced due to some data gaps on balance sheet items at the beginning of the sample.
BANCO DE ESPAÑA 16 DOCUMENTO DE TRABAJO N.º 1843
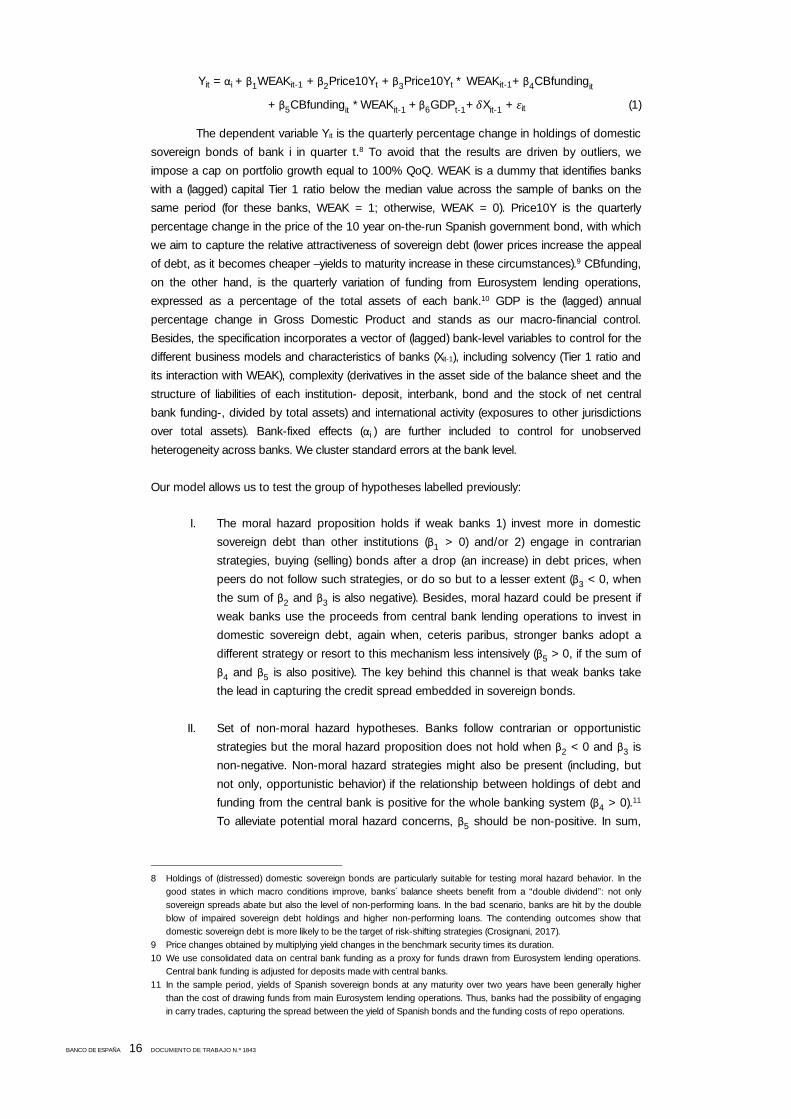
Yit = αi + β1WEAKit-1 + β2Price10Yt + β3Price10Yt* WEAKit-1+ β4CBfundingit
+ β5CBfundingit * WEAKit-1+β6GDPt-1+ Xit-1 + it (1)
The dependent variable Yit is the quarterly percentage change in holdings of domestic
sovereign bonds of bank i in quarter t.8 To avoid that the results are driven by outliers, we
impose a cap on portfolio growth equal to 100% QoQ. WEAK is a dummy that identifies banks
with a (lagged) capital Tier 1 ratio below the median value across the sample of banks on the
same period (for these banks, WEAK = 1; otherwise, WEAK = 0). Price10Y is the quarterly
percentage change in the price of the 10 year on-the-run Spanish government bond, with which
we aim to capture the relative attractiveness of sovereign debt (lower prices increase the appeal
of debt, as it becomes cheaper –yields to maturity increase in these circumstances).9 CBfunding,
on the other hand, is the quarterly variation of funding from Eurosystem lending operations,
expressed as a percentage of the total assets of each bank.10 GDP is the (lagged) annual
percentage change in Gross Domestic Product and stands as our macro-financial control.
Besides, the specification incorporates a vector of (lagged) bank-level variables to control for the
different business models and characteristics of banks (Xit-1), including solvency (Tier 1 ratio and
its interaction with WEAK), complexity (derivatives in the asset side of the balance sheet and the
structure of liabilities of each institution- deposit, interbank, bond and the stock of net central
bank funding-, divided by total assets) and international activity (exposures to other jurisdictions
over total assets). Bank-fixed effects (αi) are further included to control for unobserved
heterogeneity across banks. We cluster standard errors at the bank level.
Our model allows us to test the group of hypotheses labelled previously:
I. The moral hazard proposition holds if weak banks 1) invest more in domestic
sovereign debt than other institutions (β1 > 0) and/or 2) engage in contrarian
strategies, buying (selling) bonds after a drop (an increase) in debt prices, when
peers do not follow such strategies, or do so but to a lesser extent (β3 < 0, when
the sum of β2 and β3 is also negative). Besides, moral hazard could be present if
weak banks use the proceeds from central bank lending operations to invest in
domestic sovereign debt, again when, ceteris paribus, stronger banks adopt a
different strategy or resort to this mechanism less intensively (β5 > 0, if the sum of
β4 and β5 is also positive). The key behind this channel is that weak banks take
the lead in capturing the credit spread embedded in sovereign bonds.
II. Set of non-moral hazard hypotheses. Banks follow contrarian or opportunistic
strategies but the moral hazard proposition does not hold when β2 < 0 and β3 is
non-negative. Non-moral hazard strategies might also be present (including, but
not only, opportunistic behavior) if the relationship between holdings of debt and
funding from the central bank is positive for the whole banking system (β4 > 0).11
To alleviate potential moral hazard concerns, β5 should be non-positive. In sum,
8 Holdings of (distressed) domestic sovereign bonds are particularly suitable for testing moral hazard behavior. In the
good states in which macro conditions improve, banks´ balance sheets benefit from a “double dividend”: not only
sovereign spreads abate but also the level of non-performing loans. In the bad scenario, banks are hit by the double
blow of impaired sovereign debt holdings and higher non-performing loans. The contending outcomes show that
domestic sovereign debt is more likely to be the target of risk-shifting strategies (Crosignani, 2017). 9 Price changes obtained by multiplying yield changes in the benchmark security times its duration.
10 We use consolidated data on central bank funding as a proxy for funds drawn from Eurosystem lending operations.
Central bank funding is adjusted for deposits made with central banks.
11 In the sample period, yields of Spanish sovereign bonds at any maturity over two years have been generally higher
than the cost of drawing funds from main Eurosystem lending operations. Thus, banks had the possibility of engaging
in carry trades, capturing the spread between the yield of Spanish bonds and the funding costs of repo operations.

BANCO DE ESPAÑA 17 DOCUMENTO DE TRABAJO N.º 1843
for this hypothesis to hold undercapitalized banks should be at most replicating
the strategies of stronger/well-capitalized institutions.
Finally, banks are expected to increase sovereign exposures during downturns in the
business cycle. The condition is satisfied when the coefficient associated with our macro
control (changes in GDP) is negative: β6 < 0.
4.2.1 RESULTS
Table 2 tests the previous hypotheses. Column 1 displays the estimated coefficient associated
with WEAK (β1). The estimate is not significantly different from zero, which suggests that
purchases of sovereign debt do not depend on banks´ capital.12
Column 2 adds the estimates of the coefficients for Price10Y (β2) and for the
interaction between WEAK and Price10Y (β3), as well as the estimates of the coefficients linked
to CBfunding (β4) and to the interaction between the latter variable and WEAK (β5). The first
two estimates (β2 and β3) are far from significant at the standard confidence levels, which
implies that banks, including those defined as WEAK, did not leverage on falling prices in
government debt to expand their sovereign portfolios.13 In contrast, funding from central banks
retains a significant role in explaining changes in debt holdings: the estimate of β4 is positive
and highly significant. Of course, the immediate question is whether the moral hazard
hypothesis could hold, namely if poorly capitalized banks made a more intense use of the
former mechanism. The answer from the regression to this question is no: we find that the
estimate of β5 is not significant at the relevant confidence levels.
Column 3 includes the full set of variables as well as the estimate of β6, the coefficient
associated with our macro control (GDP). The estimate is negative and largely significant.
Taken together, macro-financial conditions and central bank liquidity have played a
role in redrawing sovereign portfolios of Spanish banks. For now, we remain silent on whether
the latter relationship (central bank funding-sovereign exposures) is driven by opportunistic
strategies or whether other motivations apply (we will revisit this issue later on).14 Finally,
evidence on moral hazard is absent.
4.2.2 IS FINANCIAL FRAGMENTATION A DRIVER OF DOMESTIC BOND PURCHASES?
Financial fragmentation in a monetary union ultimately relates to the risk of redenomination, or
the risk of a change in the currency in which assets (including holdings of sovereign debt) and
liabilities of banks are denominated. If the risk materializes, assets issued under national law
would presumably be converted to the new national currency, which in turn might create
currency mismatches between the two sides of banks´ balance sheets. Thus, when the risk of
redenomination is substantial, banks have a strong incentive to tilt the sovereign portfolio
towards domestic bonds (Angelini et al., 2014). Importantly, this motivation might also exist
even when the risk of a currency conversion is not imminent, but financial fragmentation
remains a concern. For instance, in a scenario of low conversion risk, the presence of non-
negligible interest rate differentials across EMU markets, a symptom of financial fragmentation,
12 Besides, neither the estimate of the coefficient of T1 nor the estimate of the coefficient of the interaction between
WEAK and T1 are statistically significant.
13 This result is robust to different metrics, including price changes in the 5 year benchmark or the level of sovereign
spreads at different maturities (not reported).
14 We also find that the estimate of bond funding (bank-level control) is positive and significant in columns 1 and 2. This could
be related to the mechanics of repo operations with the Eurosystem, which allowed banks to post retained bonds as
collateral to obtain liquidity. The significance of the coefficient, however, vanishes when we control for macro factors.

BANCO DE ESPAÑA 18 DOCUMENTO DE TRABAJO N.º 1843
translates into a myriad of banks´ funding costs at the country level. This might condition the
allocation of sovereign portfolios between domestic and non-domestic debt. In particular,
banks based in higher-yielding markets might be more prone to bias their sovereign portfolios
towards domestic bonds because, given their funding costs, this set of bonds offers better ex
ante returns than the alternative of investing in lower-yielding, non-domestic sovereign debt.
We introduce a new variable, Fragmentation, to assess the impact of financial
fragmentation in EMU markets on holdings of domestic sovereign debt. Fragmentation is
derived from a synthetic measure developed by the ECB (see ECB, 2018; and Hoffmann et al.,
2016), which collects data on prices of instruments issued in different market segments
(money, bond, equity and banking markets) of each EMU country. Following a predefined
methodology, the ECB computes measures of prices dispersion across jurisdictions. On the
assumption that higher (lower) values of prices dispersion of (in theory) very similar financial
assets signal less (more) financial integration, the ECB develops an index bounded between
cero and one. Our derived variable is designed to be close to one when financial fragmentation
is high, and near zero when financial fragmentation recedes.15 Figure 7 shows the historical
evolution of this fragmentation proxy over the sample period. As expected, this measure
deteriorated in the aftermath of the financial crisis and particularly at the height of the sovereign
crisis. Later, it recovered in parallel to the stabilization of EMU sovereign markets.
In column 4 of Table 2, we replace GDP with the new variable, Fragmentation. To deal
with endogeneity concerns, the estimation is conducted using the first lag of this variable. The
estimate of the coefficient associated with Fragmentation is statistically significant and positive,
which implies that when financial fragmentation augments, banks buy domestic sovereign
bonds. This supports the intuitive idea that financial fragmentation in EMU, including fears of a
break-up of the euro, increases the propensity to hold domestic bonds in banks´ portfolios.
Apart from this outcome, regression results are fairly aligned with those of previous
specifications.16
4.2.3 UPSURGE OF SOVEREIGN EXPOSURES DURING THE V-LTRO PERIOD AND DRIVERS
The two very long-term refinancing operations (V-LTRO) conducted by the Eurosystem in
2011Q4 and 2012Q1 respectively, in which banks had access to ample central bank liquidity at
very favorable conditions,17 provide a very interesting natural experiment to test our set of
hypotheses (in our sample of banks, domestic debt holdings increased 22%QoQ in this
period). Coinciding with these operations, sovereign spreads in EMU MAC markets hit record
levels. How did these elements condition banks´ portfolio choices? Did any moral hazard
mechanism pop up in the V-LTRO period?
The regression results shown in Table 3 address these questions. The new group of
regressions are an extended version of equation (1), in which we complement the variable
CBfunding with different sets of dummies. In particular, in column 1 we introduce a dummy
equal to 1 in 2011Q4 and 2012Q1 (LTRO), when the two V-LTRO were held, and zero
otherwise; in column 2, we introduce a dummy equal to 1 only in 2011Q4 (LTRO-1); in column
3, the dummy is equal to 1 only in 2012Q1 (LTRO-2). All specifications include the interaction
15 The ECB´s index is also bounded between 0 and 1, but close to one values signal high financial integration in EMU
markets (and close to zero values poor integration). To interpret the index as a measure of financial fragmentation, we
use the following expression: Fragmentation = 1 – x, where x is the value of the ECB´s index.
16 When we jointly estimate the coefficients of GDP and Fragmentation (not reported), we find that the latter is not statistically
significant. This could be due to the correlation between the two variables. The Spanish crisis evolved in parallel to the rise
in fragmentation risks. This makes it very difficult to disentangle the two effects using Spanish data only.
17 The maturity of the two operations was three years (with an option of early repayment after one year). The interest rate
was set at the average rate of the main refinancing operations over the life of each liquidity injection.

BANCO DE ESPAÑA 19 DOCUMENTO DE TRABAJO N.º 1843
of the corresponding “LTRO” dummy with WEAK. Column 4 further adds the interactions
between LTRO-2, CBfunding and WEAK.
The former statistical relationships found in Table 2 still hold: in all regressions, the
relationship between new central bank funding (CBfunding) and changes in debt holdings
continues to be significant and positive, and the point estimate is similar to the obtained in
preceding specifications. On the other hand, the effect of macro conditions (GDP) on debt
holdings remains large and negative, as expected.
With regard to the new coefficients, we find that the estimates of the slopes of the
“LTRO” dummies are always significant and positive except for the specification of column 2
(LTRO-1). This result is consistent with the idea that banks dealt with each liquidity injection
differently, and that the “upload” of sovereign portfolios was more substantial during the
second operation.18 Hence, LTRO-2 is more interesting for our exercise. In this respect, in
column 3 we find that the estimate of the interaction between LTRO-2 and WEAK is negative
and significant, which implies that weak banks took less advantage (and, consequently, strong
banks took more advantage) of the second operation to increase their domestic sovereign
exposures. This estimate, however, is no longer significant in the extended specification of
column 4. Besides, in the latter regression we find that the estimates of the coefficients linked
to the set of interactions between CBfunding, LTRO-2 and WEAK are not statistically different
from zero.
We think that these results do not support the moral hazard hypothesis for different
reasons. To begin with, they show once again that weak institutions did not take the lead in
exploiting cheap official funding to enlarge sovereign holdings, even when the V-LTRO operations
were conducted. In a similar vein, it is also noteworthy that the propensity to buy sovereign bonds
funded through central bank money did not change during the V-LTRO period: according to our
estimations, the coefficient on CBfunding, which captures this propensity, remained invariant in
this period (no explanatory power of the interaction between CBfunding and LTRO-2). Besides,
the estimated coefficient is not statistically different for weak and strong banks (the interaction
between LTRO-2, CBfunding and WEAK does not explain changes in debt holdings). This latter
result is important: if moral hazard mechanisms were at play during the V-LTRO period, one
would expect undercapitalized banks to have increased the proportion of central bank liquidity
dedicated to buy sovereign debt. This did not happen, though.
Another interesting conclusion from our results is that the link central bank
liquidity/LTRO-sovereign holdings cannot be mechanically associated with the emergence of
carry trade strategies : given that the two V-LTRO were aimed at supporting the adequate
transmission of monetary policy, i.e. “to maintain the appropriate credit supply to households
and firms, to ultimately guarantee price stability” (Praet, 2012), the expansion of sovereign
portfolios against a backdrop of ample official liquidity can be seen as an expected effect of
monetary policy to alleviate tensions in EMU financial markets, including the sovereign
segment, and cope with deflationary pressures. This does not rule out the presence of
opportunistic motivations in the composition of sovereign portfolios, but demonstrates, as
stated in section 2, that this channel is closely intertwined with monetary policy interventions,
which should further alleviate moral hazard concerns.
18 This is aligned with evidence found by Fonseca et al., (2015) for Portuguese banks. The authors argue that banks had
only two weeks to “prepare” the first V-LTRO in 2011Q4 and, as a result, during this operation many institutions merely
roll over short-term central bank funding into V-LTRO “funding”. The second operation was conducted at the end of
2012Q1. At that moment, banks could gather more collateral. As a result, the uptake of the second V-LTRO was
higher and its allocation to sovereign bonds purchases was also more pronounced.
BANCO DE ESPAÑA 20 DOCUMENTO DE TRABAJO N.º 1843
4.3 Distressed institutions and sovereign holdings
We look further into the moral hazard hypothesis by exploring the behavior of distressed
banks. We define an institution in distress as a weakly capitalized bank whose productive
resources (portfolio of loans) have a poor quality. In practical terms, this definition is
operationalized by defining banks in distress as those with a high level of non-performing
exposures. Of course, this reflects bad past decisions (i.e.: banks in distress may have granted
low-quality loans in the past), but might also indicate that the set of investment/lending
opportunities of the bank has narrowed down (i.e.: their traditional clients have been severely
impacted by the economic crisis). In this context, these banks may not be able to find new
solvent borrowers in their market niche. With this in mind, rising sovereign exposures in
distressed institutions can be seen as the result of two contending forces:
I. Gambling for resurrection. Distressed banks invest in zero-risk weight, higher-
yielding sovereign debt in a “desperate” attempt to make sufficient profits to avoid
a default (Acharya and Steffen, 2015). We note that gambling for resurrection is
similar to moral hazard: when distressed banks buy strained sovereign debt, risk-
shifting from shareholders to creditors could occur. However, it differs from pure
moral hazard motivations since distressed institutions would view buying
sovereign debt as (almost) the only highly profitable, non-capital consuming
investment alternative to bet on their resurrection.
II. Demand-side view. Poor overall (macro) and business (micro) conditions
completely dominate portfolio strategies of distressed institutions. They gain
exposure to the sovereign market because few profitable alternatives, if any,
remain at their disposal (in risk-adjusted terms). There is no bet on sovereign debt,
but simply a profit maximizing strategy in an environment in which the traditional
business of distressed banks is no longer profitable.
The next equation aims to identify the behavior of distressed institutions. For this
purpose, we add time fixed effects to equation (1), which make macro factors and conditions in
the sovereign market (Price10Y) redundant, and incorporate the new variables related to banks´
assets quality.
Yit = αi + γ + β1WEAKit-1 + β2NPLbankit-1+ β3NPLbankit-1* WEAKit-1
+β4CBfundingit + β5CBfunding
it * WEAKit-1 Xit-1 + it (2)
The dependent variable is again the quarterly percentage change in holdings of
domestic sovereign debt (Yit), trimmed at 100% QoQ. In the right-hand side of the equation,
WEAK and CBfunding are the same variables as in equation (1), while NPLbank is the
difference between the non-performing loans ratio (NPL) of each bank at time t-1 minus the
average NPL ratio of our sample of banks, also at t-1.19 The specification includes the same
vector of bank-level controls of the previous equation (Xit-1), as well as bank-fixed effects (αi )
and time-fixed effects (γ ). Standard errors are clustered at the bank level.
The coefficient of interest now is β3. Distressed banks are institutions identified by the
interaction of the WEAK dummy with high NPLbank values.20 If these institutions increase
19 We cover doubtful loans in Spain on a consolidated basis.
20 The simpler NPL ratio is also a valid proxy for the quality of the credit portfolio of each bank, but is sensitive to
downturns in the business cycle: NPL ratios tend to be high when economic conditions deteriorate, even for profitable
or “good” banks. An additional criterion is thus needed to distinguish between “good” and “bad”, less profitable
institutions. NPLbank does so by comparing NPL ratios across banks.

BANCO DE ESPAÑA 21 DOCUMENTO DE TRABAJO N.º 1843
ceteris paribus their sovereign exposures more than other (non-distressed) institutions, then the
estimate of β3 should be positive and significant.
We show the results for this specification in columns 1 to 3 of Table 4. The estimates
of β1 and β2 are not statistically significant, which suggests that sovereign portfolios are neither
affected by the level of capital of banks (no moral hazard) nor by NPLbank when considered in
isolation. However, the interaction between the two variables has explanatory power: the
estimation of β3 is statistically significant and positive in column 2, and also in column 3 in
which we introduce CBfunding and its interaction with WEAK (baseline specification). This
result confirms the positive statistical link between banks in distress and domestic sovereign
bond holdings.
Is this evidence consistent with gambling for resurrection? We cannot assess whether
distressed banks actively bet on distressed sovereign debt or whether they buy it as a result of
portfolio constraints, since both alternatives are observationally equivalent in equation (2). This
is true despite the fact that our regression controls for macro effects that are common to all
banks in each quarter (through time fixed effects). It could be the case that macro shocks have
impacted banks differently (at the micro level). For instance, some distressed institutions might
be operating in geographical areas in which the economic crisis has been more severe. Since
we do not capture this element in our specification, the door remains open for the demand-
side view narrative. To shed further light, we revisit this discussion using non-domestic
sovereign exposures in subsection 4.D.
In addition, we also find that the estimate of β4 is significant and positive (column 3),
which confirms the explanatory power of the channel linked to the availability of central bank
funding. Besides, and contrary to specifications in previous sections, the estimate of the
coefficient associated with the interaction between CBfunding and WEAK (β5) is now significant
and negative, which would imply that strong (weak) banks benefited more (less) from new
central bank funding to expand their sovereign portfolios. The last result is, nevertheless, not
robust to alternative specifications, as we will show immediately.
4.3.1 DO THESE RESULTS HOLD FOR DIFFERENT CALIBRATIONS OF “WEAK”?
Hitherto, we have considered a weak bank (WEAK=1) as a bank with capital below the median
value of the Tier 1 ratio of our set of banks in t-1. However, banks within this group could
behave in a different manner, i.e. sovereign portfolios of slightly undercapitalized banks do not
necessarily move in tandem with portfolios of heavily undercapitalized banks as moral
hazard/gambling for resurrection motivations might be stronger in the second group. To check
this possibility, we re-estimate equation (2) considering different variations of the variable
WEAK. In particular, we replace WEAK in each equation with dummies that take the value of 1
for banks with capital levels in the preceding period below the 40th, 35th, 30th and 25th
percentile values of the T1 of the system.
Columns 4 to 7 of Table 4 show the new results for each calibration of WEAK. We find
further evidence in favor of the relationship distressed institutions-sovereign holdings: the
estimates of the coefficient associated with the interaction between WEAK and NPLbank are
highly significant and positive. Once again, regardless of the WEAK measure employed, we do
not find evidence of moral hazard motivations, as estimations of the WEAK coefficients are all
far from significant.

BANCO DE ESPAÑA 22 DOCUMENTO DE TRABAJO N.º 1843
Lastly, the link between central bank funding and sovereign debt holdings remains
present. Moreover, we find that this relationship is identical for all institutions, i.e. both for
undercapitalized and well-capitalized banks (the estimates of the coefficients linked to the
interaction between CBfunding and the different calibrations of WEAK are not significant),
which is consistent with the outcome of section 4.B.1. An open question is whether the link
between central bank liquidity and bond purchases can be entirely attributed to opportunistic
strategies or if different motivations apply. The next section offers evidence in this respect.
4.4 Breakdown of sovereign portfolios: holdings of domestic and non-domestic
sovereign debt
So far, we have focused on which drivers explain changes in banks´ portfolios exclusively
formed by domestic sovereign bonds. However, we can extend our analysis by considering
holdings of debt issued by other governments in EMU to address the issue of home bias. In
particular, banks´ propensity to hold domestic versus non-domestic sovereign debt could shed
light on whether moral suasion mechanisms have played a relevant role. Under moral suasion,
the government would have been able to push banks towards holding more domestic
sovereign debt (De Marco and Macchiavelli, 2016). At the same time, the analysis of the
composition of sovereign portfolios should serve us to double check the validity of some of the
channels we have already examined, and to offer new insights into some of them. Specifically,
we propose the next equation:
Yit = αi + β1Fragmentationt-1
+ β WEAKit-1 β3Sizeit-1 β4CROSSit-1 + (3)
The dependent variable (Yit) is one of the following ratios of bank i in quarter t:
— Ratio 1 is the ratio of holdings of Spanish government bonds to the entire portfolio
of sovereign debt;
— Ratio 2 is the ratio of holdings of Spanish government bonds to holdings of all
MAC government debt, including Spanish bonds in the denominator.
— Ratio 3 is the ratio of holdings of Spanish government bonds to a portfolio formed
by these bonds and LAC government debt.
— Ratio 4, finally, is the ratio of holdings of MAC government debt, excluding
Spanish government debt, to holdings of bonds issued by all non-domestic EMU
governments.
The first three ratios are different home concentration measures.21 Ratio 4 refers to the
concentration of debt holdings in non-domestic, high-yield (EMU) sovereign securities.22 In the
right-hand side of the equation, Fragmentation and WEAK are the same variables as before. In
addition, we have split the vector of (lagged) bank-level controls of equations (1) and (2) into
three components: Size, which is the natural logarithm of banks´ total assets, CROSS, which is
banks´ cross-border and domestic exposures to other jurisdictions divided by total assets,23
and Zit-1, containing the rest of bank-level variables. We do this because we think that Size and
CROSS might be determinant to explain the composition of cross-border sovereign portfolios.
The specification further includes bank-fixed effects (αi ), while standard errors are clustered at
the bank level.
21 We prefer the term home concentration instead of the term home bias because the latter implies that there is a natural
or equilibrium level for home sovereign holdings, which we do not estimate.
22 MAC government debt represents any exposure of banks to liabilities of governments in Italy, Portugal, Greece and
Ireland. LAC country government debt is any exposure to liabilities of governments in Germany, France, The
Netherlands, Belgium, Austria and Finland.
23 We have dropped exposures to the public sector from CROSS to deal with potential endogeneity concerns.
BANCO DE ESPAÑA 23 DOCUMENTO DE TRABAJO N.º 1843
The model is suitable for testing different hypothesis, in which we include a novel
channel, moral suasion:
I. Impact of financial fragmentation. Financial fragmentation shocks were already
tested in section 4.B.2 using a different approach, so results reported here can be
deemed as complementary to the preceding analysis. When financial fragmentation
in EMU markets augments, banks might prefer domestic sovereign bonds (instead
of bonds issued by other sovereigns) either because they want to hedge
redenomination risk or because non-domestic debt does not offer an adequate
“compensation” given the level of interest rates in domestic versus non-domestic
jurisdictions. If this hypothesis holds, β1 should be significant and positive whatever
the home concentration measure considered (Ratio 1, Ratio 2 or Ratio 3).
II. Novel channel: moral suasion. If banks are exhorted by the government to hold
more domestic debt, home concentration should increase. Moral suasion is likely
to be more effective for weak institutions since, at the extreme, they might depend
on government decisions to remain as “going concerns” (Horváth et al., 2015). If
moral suasion has operated through weak banks, then these institutions should
tend more to tilt their sovereign portfolios towards domestic bonds (β2 > 0) in
relation to sovereign debt with similar risk-return characteristics, i.e. debt issued
by other MAC governments. Hence, the relevant dependent variable to test moral
suasion is Ratio 2.
III. Moral hazard (risk-shifting) and opportunistic behavior/reach-for-yield. Moral
hazard exists when weak banks prefer, to a greater extent than other banks, high-
yield sovereign debt over low-yield sovereign debt. In our context, this happens
when β2 > 0 and the dependent variable is Ratio 3 or Ratio 4. We note that Ratio
3 is suitable for testing moral hazard provided that the moral suasion hypothesis
does not hold (otherwise the empirical analysis would be confounded). Both ratios
will also serve as to explore opportunistic/reach-for-yield behavior, as we will
clarify now.
4.4.1 RESULTS
Table 5 summarizes our results for this section. Columns 1 to 3 of Panel A contain the set of
specifications in which the dependent variable is Ratio 1. Also in Panel A, columns 4 to 6
present Ratio 2 as the dependent variable. In columns 1 to 3 of Panel B, the dependent
variable is Ratio 3, while in columns 4 to 6 of this panel the dependent variable is Ratio 4. The
first column in each set refers to the baseline specification. The second column adds
CBfunding and time fixed-effects to enhance controls in our regressions, although this comes
at the cost of making the Fragmentation variable redundant24 (this variable does not vary in the
cross-section). Finally, the third column incorporates the variable NPLbank and its interaction
with WEAK to further control for the behavior of “distressed” banks.25
Financial fragmentation. We find that banks react to fragmentation in EMU markets by
increasing the share of domestic bonds in their sovereign portfolios: the estimate of β1 is
24 This variable does not vary in the cross-section.
25 We drop one bank from the sample because it exclusively invested in home sovereign bonds. A few observations are
missed for Ratio 3 and 4. In these observations, no debt holdings are reported in the denominator. As a result, it was
not possible to compute these ratios.

BANCO DE ESPAÑA 24 DOCUMENTO DE TRABAJO N.º 1843
positive and largely significant for the three measures of home concentration, Ratio 1, Ratio 2
and Ratio 3 (columns 1 and 4 of Panel A, and column 1 of Panel B, respectively).
Moral suasion. No moral suasion mechanisms arise in the regressions: none of the
estimates of β2 in columns 4 to 6 of Panel A, in which the dependent variable is Ratio 2 (the
best measure to test moral suasion), is significantly different from zero. This also applies to
distressed banks, since the interaction between NPLbank and WEAK does not explain home
concentration either (column 6 of Panel A).26
Moral hazard and opportunistic motivations/reach-for-yield. We find no signs of risk-
shifting or moral hazard strategies by poorly capitalized banks, and from different angles. In
columns 1 to 3 of Panel B (in which Ratio 3 is the dependent variable) and in columns 4 to 6 of
the same panel (Ratio 4), the estimate of β2 (WEAK) is not statistically significant. In columns 3
and 6 we further study whether the set of distressed banks shows a preference for higher-
yielding sovereign debt, whether domestic or non-domestic. In this respect, estimates of the
coefficient associated with the interaction between NPLbank and WEAK are not significant at
the usual confidence bands. This result seems to reject the idea that this set of banks engaged
in gambling for resurrection strategies (see last section). In any case, these results should be
taken with caution given that non-domestic debt holdings constitute a minor part of total debt
holdings of banks.
Our results also shed light on whether non-moral hazard strategies, particularly reach-
for-yield behavior, have been at play. Reach-for-yield is understood here as in Becker and
Ivashina (2015), who study preferences of U.S. insurance companies (which, like banks, are
heavily regulated entities) for holding higher-yielding bonds within the same regulatory risk
category. Since both MAC and LAC debt form part of the same (regulatory risk) category,
opportunistic behavior is present if an inclination exists for the former debt type. We study this
preference in connection with the use of central bank liquidity: if reach-for-yield holds, a
positive statistical relationship would surge between CB funding (cheap official liquidity) and
either Ratio 3, which measures home concentration over LAC debt holdings, or Ratio 4, which
identifies biases towards non-domestic, higher-yielding debt. Ratio 3 is suitable for this test
because we have ruled out moral suasion.
According to the outcome of our regressions, the link between central bank liquidity
and MAC debt holds for Ratio 4 (estimates of the coefficient associated with CBfunding in
columns 5 and 6 of Panel B are positive and significant) but is absent for Ratio 3 (see same
estimates for columns 2 and 3 in the same panel). Therefore, reach-for-yield holds but seems
to be constrained to the non-domestic MAC debt portfolio. This finding is interesting: banks
cope with domestic and non-domestic debt of similar risk-return characteristics differently.
Banks´ bets appear to be restricted to non-domestic MAC debt markets. In addition, our
estimations show that opportunistic strategies are led by well-capitalized institutions: the
estimate of the coefficient of the intersection between CBfunding and WEAK is significant and
strongly negative (columns 5 and 6). Therefore, banks with higher risk-bearing capacity are
those that take on more risk, contrary to what the moral hazard channel predicts. 27
26 The latter result is interesting when compared to the outcome of the preceding section. Then, we demonstrated that
distressed banks increase more than other banks holdings of domestic sovereign bonds. Is this a reflection of
government pressure? Since these banks do not have a preference between buying home over non-home sovereign
bonds with similar risk-return characteristics, moral suasion does not apply.
27 This set of results is consistent with evidence for Italian banks in Peydró et al. (2017).
BANCO DE ESPAÑA 25 DOCUMENTO DE TRABAJO N.º 1843
Bank-level controls. With regard to bank-level controls, we find that for the first two
measures of home concentration in Panel A, Ratio 1 (columns 1 to 3) and Ratio 2 (columns 4
to 6), the estimate of β3 (coefficient of Size) is, apart from the specification in column 1,
negative and significant. This means that when total assets increase banks tend to hold more
diversified sovereign portfolios, i.e. less home concentration. In this respect, the estimate of β4
(coefficient of CROSS) is not statistically significant, which suggests that the size of banks,
rather than their international exposures, better captures the tendency to home concentration.
In contrast, CROSS turns out to explain better the changes in the propensity to pile up non-
domestic MAC versus LAC country government debt (in columns 4 to 6 of Panel B, in which Yit
is Ratio 4, the estimate of β4 or the coefficient of CROSS is always positive, and significant in
the first two columns), possibly due to the greater presence of some banks in MAC
jurisdictions. Fragmentation, which is a control in the specification of column 4 of Panel B (Ratio 4),
plays no role in this relationship (the estimate of β1 is far from significant).
Overall, these results confirm the findings of previous sections. Importantly, they do
not support the hypothesis that moral suasion mechanisms have conditioned the composition
of sovereign portfolios, and further show that the link central bank liquidity-sovereign holdings
cannot be mechanically associated with opportunistic or reach-for-yield behavior.28
28 As an additional robustness check, we have re-estimate the set of regressions in this section for different calibrations
of WEAK. Our results broadly hold in the alternative specifications.

BANCO DE ESPAÑA 26 DOCUMENTO DE TRABAJO N.º 1843
5 Extensions and further robustness checks
5.1 Did determinants of sovereign holdings change at the height of the sovereign crisis?
We assess whether the hypotheses we have identified so far changed at the height of the
sovereign crisis. We check this because our sample covers a large time-span (36 quarters), which
might mask temporary statistical relationships in the data, potentially more evident when sovereign
strains were more pronounced. To explore this possibility, we propose the next equation:
Yit = αi + β1WEAKit-1+ β2PRICE + β3PRICE * WEAKit-1
+ β4CBfundingit + β5CBfundingit * WEAKit-1 + β6GDPt-1+ ω1crisis +ω2crisis * WEAKit-1
+ω3crisis * PRICE +ω4crisis * PRICE * WEAKit-1
+ω5crisis * CBfundingit +ω6crisis * CBfundingit* WEAKit-1 + Xit-1 + it (4)
The specification is basically an extension of equation (1). The variable PRICE is
exactly the same as before, namely the contemporaneous quarterly price change in
government debt, but now we will show results for the 10 year and the 5 year on the run
benchmarks, represented by the superscript y. We cover the same time period/set of banks
while adding a variable, crisis, which is a dummy equal to 1 from 2010Q2 to 2012Q3 and zero
otherwise, and some interactions between the new dummy and other variables.29 The starting
point of the crisis dummy, 2010Q2, coincides with the first bail out of Greece, which put the
MAC sovereign segment in the spotlight. The final point (2012Q3) refers to the announcement
of the Outright Monetary Transactions programme, which marked a turning point in the EMU
sovereign crisis. This period is definitively special: not only due to the existing tensions in the
sovereign market, but also because of the appeal of risk-shifting strategies over these two
years. At the height of the sovereign crisis, 1) sovereign spreads on Spanish government debt
rocketed; 2) banks could readily access central bank funding, including funding from the two
ad hoc V-LTRO (see also section 4.B.3); (3) in parallel, as a result of the severe economic crisis,
the solvency of some institutions was eroded, making the transfer of risks from banks´
shareholders to creditors more likely.
Table 6 shows the results for the estimations of equation (4).
As expected, banks´ capital does not condition bond purchases, neither in “normal”
times (estimates of β1 are not statistically significant) nor during the crisis period (estimates of
ω2 are not significantly different from zero). Central bank funding and macro conditions are
once more major drivers of sovereign holdings: the estimates of β4 (CBfunding) and β6 (GDP)
are significant in all specifications, and their signs are the expected ones. Interestingly, the
amount of central bank liquidity dedicated to buy sovereign bonds did not change during the
crisis (estimates of ω5 and ω6 are not significant).
Furthermore, the advent of the crisis did not per se move banks to increase their
holdings of sovereign bonds (estimates of ω1 are not statistically significant), but their
investment behavior somewhat shifted. In particular, we find that banks adopted contrarian
strategies in the domestic sovereign market during the crisis period, buying debt when bond
prices were falling, and selling it when prices were increasing/recovering (the estimate of ω3 is
29 These specifications include the same vector of bank-level controls and bank-fixed effects of equation (1). Errors are
again clustered at the bank level.

BANCO DE ESPAÑA 27 DOCUMENTO DE TRABAJO N.º 1843
negative and significant in column 4, in which PRICE reflects price changes in the 5 year
benchmark bond).30 This was not the only driver of sovereign bond purchases: central bank
liquidity and macro effects still retained a major role in this period. However, the countercyclical
role played by banks over a sovereign stress episode offers interesting insights. Specifically, it
shows that the interconnectedness between banks and the sovereign might provide financial
stability dividends in a crisis context.31
Is the preceding evidence consistent with the execution of moral hazard strategies?
We have argued that for the risk-shifting hypothesis to hold poorly capitalized banks should
take more advantage of opportunistic strategies than their peers (see section 4.B). In this
respect, the estimate of the coefficient associated with the interaction between PRICE, T1 and
crisis (ω4) is not significant at the relevant confidence levels. This supports the idea that weak
banks did not embrace risk-shifting strategies, even during the sovereign stress episode.
5.2 Alternative proxies for solvency and results
As an additional robustness check, we re-estimate results of equations (1) and (2) considering
different proxies for measuring the solvency position of banks. In particular, we replace the Tier
1 ratio of banks with three alternative measures:
— Own funds ratio, which covers all instruments included in the numerator of the Tier
1 and further adds Tier 2 items, divided by risk-weighted assets (RWA).
— Leverage_1, defined as the ratio of total assets to all Tier 1 instruments.
— Leverage_2, or the ratio of total assets to own funds.
For each measure, we recalibrate the WEAK dummy accordingly.32
Table 7 shows the results. Columns 1 to 3 show specifications of equation (1) with the
new solvency measures. Columns 4 to 6 do the same for equation (2). These new results
confirm once more the importance of macro-financial conditions and central bank liquidity as
drivers of sovereign portfolios: gloomy economic conditions (drop in GDP) translate into an
increase in sovereign holdings, while an upsurge in central bank funding (CBfunding) leads to
higher debt holdings, too. On the contrary, evidence in favor of the moral hazard hypothesis is
absent: the estimates of the coefficient linked to WEAK are far from significant in all
regressions. Moreover, this set of specifications reveals that less capitalized institutions took
little advantage of central bank funding to expand their sovereign portfolios (this relationship
was less clear using the T1 as a proxy for solvency), which further rules out the moral hazard
proposition. In addition, the specification of column 4 confirms that banks in distress invested
more in the sovereign market: the estimate of the coefficient of the interaction between
NPLbank and WEAK is positive and significant. This result, however, does not hold for
Leverage_1 and Leverage_2, which might simply capture that risk-weighted capital measures
do a better job at identifying distressed institutions when interacted with NPL ratios.
30 In column 3 (price changes in the 10 year benchmark security), the sign of this coefficient is also negative, but the estimate
is not significant at the 10% confidence level. The negative relationship between prices and sovereign holdings goes
against the hypothesis that banks generally respond in a pro-cyclical manner to price changes (Timmer, 2018).
31 Support of banks to distressed sectors seems to be not limited to the public sector. Giannetti and Saidi (2017), for
instance, show that banks have a higher propensity to lend to industries in distress to which they hold large exposures.
32 For instance, for the own funds ratio, WEAK is equal to 1 if, instead of the Tier 1, the (lagged) own funds ratio of bank i
falls below the median of the system in t-1; we follow a similar calibration for the rest of solvency measures.

BANCO DE ESPAÑA 28 DOCUMENTO DE TRABAJO N.º 1843
5.3 What if being a weak bank was the norm?
All through the empirical analysis we have worked on the assumption that weak banks are
banks with low capital levels when compared to the median values of the system. However, if
the sample of banks is dominated by weak banks, our identification strategy would be flawed.
While we do not believe that this is the case, we propose hereafter an alternative specification
to deal with this issue.
In the next equation, we omit the step relative to the identification of weak banks (i.e.
we drop WEAK) and directly test the moral hazard channel by linking changes in sovereign
holdings with the Tier 1 ratio of banks, which was previously a bank-level control. An important
drawback of this approach is that we treat any change in the Tier 1 ratio in the same way, no
matter whether the absolute solvency position of the bank is strong (high level of Tier 1 capital)
or weak (low level):
Yit = αi + β1Fragmentationit-1 β T1it-1 β3Sizeit-1 β4CROSSit-1
+ β5CBfundingit + β6CBfundingit * T1it-1 Vit-1 + it (5)
The dependent variable (Yit) is one of the following: (i) quarterly changes in holdings of
domestic sovereign debt (in percentage), trimmed at 100% QoQ; (ii) Ratio 1; (iii) Ratio 2; (iv)
Ratio 3; and (v) Ratio 4 as defined in section 4.D. Fragmentation (the common macro control
for all specifications), CBfunding, Size and CROSS are known variables. The Tier 1 capital ratio
(T1 for short) is included as an explanatory variable separated from the vector of bank-level
controls (Vit-1). The equation incorporates bank-fixed effects (αi ) and standard errors are again
clustered at the bank level. Table 8 shows the results for this specification, which is aligned
with earlier evidence.
As expected, an increase in Fragmentation is associated with higher domestic bond
holdings and stronger home concentration: the estimate of β is positive and largely significant
in specifications of columns 1 to 4. In contrast, the level of banks´ capital, T1, plays no role in
explaining changes in sovereign debt holdings, nor leads banks to hold more domestic bonds
or higher-yielding sovereign debt in detriment of other sovereign securities (the estimate of β is
not statistically significant across all specifications).
According to estimates in column 1, banks tend to increase their domestic sovereign
debt holdings when they draw funds from the central bank (the estimate of β5 is positive and
statistically significant), in line with previous findings. This tendency seems to increase when
banks´ capital augment (the estimate of β6 is also positive and significant in this column), which
suggests that when banks count on a more ample capital cushion, they are more willing to gain
exposure to the domestic sovereign market. It is not clear that this is driven by reach-for-yield
strategies: central bank funding does not lead to higher holdings of higher-yielding sovereign
debt, either domestic or foreign (see estimates of the same coefficients in columns 3 and 4).
Contrary to the outcome of section 4.D.1, this finding also applies to well-capitalized
institutions.
5.4 New aggregation strategy: composition of banking groups for each date
In our regressions, we aggregate information from individual banks according to the set-up of
banking groups existing as of the end of 2016. The main advantage of this approach is that it is
insensitive to mergers and acquisitions activity, which has been intense in recent years. This, in
turn, allows us to construct smoother long time series for each bank. A drawback of this
strategy is that it results in lower bank heterogeneity, which might bias our results. In particular,

BANCO DE ESPAÑA 29 DOCUMENTO DE TRABAJO N.º 1843
weak banks could have been those absorbed by solvent institutions. If this is the case, we
would be erroneously treating these banks as well-capitalized.
To control for biases derived from the consolidation of banks as of 2016Q4, we now
employ a new dataset in which we consider the original composition of banks at each date.
This increases significantly the number of banks in the sample (37 institutions). Of course, this
comes at the cost of several discontinuities in our time series, and a panel that becomes more
unbalanced, as many institutions ceased to exist during the crisis.33
Table 9 shows regressions results using the new dataset. In columns 1 to 4, the
dependent variable is again the quarterly growth of domestic sovereign debt (trimmed at 100%
QoQ). In columns 5 to 8, we analyze home bias and the propensity to hold non-domestic MAC
debt over LAC debt (in this set of regressions, the sample of banks collapses to only 23
institutions as many of them invest exclusively in domestic debt markets). Compared to the
previous regressions, the connection between central bank liquidity and sovereign holdings is
weaker for the set of poorly capitalized banks. The estimate of the coefficient associated with
the interaction between NPLbank and WEAK is less significant, too. But apart from these
results, the outcome of this set of regressions is broadly consistent with prior findings. In
particular, the effect of financial fragmentation is strong across all specifications. On the other
hand, no results in the new regressions validate the moral hazard behavior.
33 The dataset includes all significant institutions as well as banks that ended up being part of them. We have also
included other small banks to improve the coverage of our dataset.

BANCO DE ESPAÑA 30 DOCUMENTO DE TRABAJO N.º 1843
6 Conclusions
In this paper, we study the determinants of sovereign debt holdings of Spanish banks over a
long time-span, covering the worst part of the sovereign crisis. Spain is a perfect “laboratory”
for this exercise: banks had to manage their sovereign portfolios under strong profitability
pressures, resulting from a deteriorated macro scenario that followed the real estate crisis and
turmoil in the domestic sovereign market. On top of that, non-conventional support from the
Eurosystem (e.g. low repo rates, full allotment, large-scale liquidity injections) incorporates an
interesting dimension to our setting.
Our analysis yields several interesting results. First, we do not find evidence of moral
hazard, since weakly capitalized banks were not associated with higher (distressed) sovereign
holdings. Undercapitalized banks did not take advantage of depressed market conditions (low
prices in sovereign debt) to gain exposure to this market segment, either. Besides, we do not find
evidence supporting the view that weaker banks were persuaded to hold domestic sovereign debt
in detriment of other sovereign securities or even credit to the private sector (no moral suasion).
Second, the link between central bank liquidity and holdings of sovereign debt is
positive and strong. This might give the impression that banks engaged in carry trade/reach-
for-yield strategies. We see this narrative as incomplete. Without neglecting the possibility that
opportunistic motivations played a role, we show that the upload of sovereign holdings is
associated with exogenous monetary policy interventions like V-LTRO liquidity injections.
Moreover, when we compare the propensity to hold higher-yielding versus lower-yielding
sovereign debt, we fail to find a clear preference for the former debt type. While reach-for-yield
could have operated in non-domestic MAC debt portfolios, evidence is far from conclusive and,
importantly, limited to the group of more strongly capitalized and larger institutions. These
institutions should have a higher risk-bearing capacity. In addition, some of them have a
stronger presence in foreign markets, which may explain this strategy in the context of their
operations in host countries.
Finally, we show that macro conditions play an important role in sovereign holdings. In
this same vein, we find that financial fragmentation in EMU markets (a measure of price dispersion
across countries of in theory very similar assets) was a strong driver of home concentration
(i.e. propensity to hold domestic bonds instead of non-domestic debt in sovereign portfolios). We
think that this supports the hypothesis that banks re-nationalized sovereign portfolios at the height
of the sovereign crisis as a means of hedging against an EMU-break up. Furthermore, since
financial fragmentation still remains a concern in EMU (although less acute than during the
sovereign crisis), its effects are likely to reach sovereign portfolios today.
Our research has important policy implications. The Basel Committee on Banking
supervision has recently published a discussion paper for a potential revision of the current
treatment of sovereign exposures, which currently assigns a zero risk weight to domestic
exposures (BCBS, 2018). In this sense, the counter-cyclical role that banks appeared to play at
the height of the crisis (buying debt at times of stress) adds an interesting perspective to the
discussion on the so-called nexus between sovereign risk and bank credit risk. Some
commentators believe that large sovereign exposures strengthen the loop. However, the
evidence from this paper shows that support from banks could stabilize sovereign markets at
critical moments.

BANCO DE ESPAÑA 31 DOCUMENTO DE TRABAJO N.º 1843
REFERENCES
ALTAVILLA, C., M. PAGANO and S. SIMONELLI (2017). “Bank Exposures and Sovereign Stress Transmission”, Review of
Finance, Vol. 21, No. 6, 2103-2139.
ACHARYA, V. V., I. DRECHSLER and P. SCHNABL (2014). “A Pyrrhic Victory? Bank Bailouts and Sovereign Credit Risk”,
The Journal of Finance, Vol. LXIX, No. 6.
ACHARYA, V. V., S. and STEFFEN (2015). “The 'greatest' carry trade ever? Understanding Eurozone bank risks”, Journal
of Financial Economics 115, 215–236.
ANDREEVA, D. C., and T. VLASSOPOULOS (2016). “Home bias in bank sovereign bond purchases and the bank-
sovereign nexus”, ECB Working Paper, 1977.
ANGELINI, P., G. GRANDE and F. PANETTA (2014). “The negative feedback loop between banks and sovereigns”, Banca
d´Italia, Questioni di Economia e Finanza, No. 213.
BASEL COMMITTEE ON BANKING SUPERVISION (2018). “The regulatory treatment of sovereign exposures”,
discussion paper.
BATTISTINI, N., M. PAGANO and S. SIMONELLI (2014. “Systemic risk, sovereign yields and bank exposures in the euro
crisis”, Economic Policy, Vol 29, No. 7, 203-251.
BECKER, B., and V. IVASHINA (2015). “Reaching for Yield in the Bond Market”, The Journal of Finance, Vol. LXX, No. 5.
BRUTTI, F., and P. SAURÉ (2016). “Repatriation of Debt in the Euro Crisis”, Journal of the European Economic
Association, Volume 14, Issue 1.
CASTRO, C., and J. MENCÍA (2014). “Sovereign risk and financial stability”, Financial Stability Review (Banco de España),
No. 26.
CROSIGNANI, M. (2017). “Why Are Banks Not Recapitalized During Crises?”, ESRB Working Paper Series, No. 57.
DE MARCO, F., and M. MACCHIAVELLI (2016). “The Political Origin of Home Bias: the case of Europe”, Finance and
Economics Discussion Series 2016-060. Washington: Board of Governors of the Federal Reserve System.
DRECHSLER, I., T. DRECHSEL, D. MARQUES-IBANEZ and P. SCHNABL (2016). “Who Borrows From the Lender of Last
Resort?”, The Journal of Finance, Vol. LXXI, No. 5.
EUROPEAN CENTRAL BANK (2018). “Financial integration in Europe”, May 2018.
EUROPEAN SYSTEMIC RISK BOARD (2015). “ESRB report on the regulatory treatment of sovereign exposures”, final
report of the ESRB’s expert group on the regulatory treatment of sovereign exposures.
FONSECA, L., M. CROSIGNANI, M. FARIA-E-CASTRO (2015). “Central bank interventions, demand for collateral, and
sovereign borrowing costs”, Banco de Portugal, Working Papers.
GIANNETTI, M., and F. SAIDI (2017). “Shock Propagation and Banking Structure”, mimeo.
HOFFMANN, P., M. KREMER, S. ZAHARIA (2016). “Financial integration in Europe Through the Lens of Composite
Indicators”, mimeo ECB.
HORVÁTH, B., H. HUIZINGA and V. IOANNIDOU (2015). “Determinants and valuation effects of the home bias in
European banks´ sovereign debt portfolios”, Centre for Economic Policy Research, Discussion Paper No. 10661.
PEYDRÓ, J., A. POLO and E. SETTE (2017). “Monetary Policy at Work: Security and Credit Application Registers
Evidence”, mimeo.
PISANI-FERRY, J., and G. WOLFF (2012). "Propping up Europe?", Bruegel Policy Contribution 2012|07.
PRAET, P. (2012). “Managing financial crises: the role of the ECB”, Speech at the 40th Economics Conference of the
Oesterreichische Nationalbank, Vienna.
TIMMER, Y. (2018. “Cyclical investment behavior across financial institutions”, Journal of Financial Economics, Volume
129, Issue 2.

BANCO DE ESPAÑA 32 DOCUMENTO DE TRABAJO N.º 1843
Table 1. Descriptive statistics
Panel A shows characteristics of our set of banks, i.e. the fourteen significant
institutions identified in Spain as of the end of 2016Q4, including their sovereign portfolios. All
data in Panel A are obtained on a consolidated basis. Home bonds refer to holdings of
domestic sovereign debt. Non-domestic MAC bonds refer to exposures to liabilities of a set of
EMU more affected by the crisis governments, excluding the Spanish public sector (domestic
market): Italy, Portugal, Greece and Ireland. LAC country bonds represent exposures to
liabilities of a set of EMU less affected by the crisis governments: Germany, France, The
Netherlands, Belgium, Austria and Finland. Cross_claims are international exposures divided by
total assets and include not only international claims (cross-border claims or domestic claims in
foreign currency), but also domestic claims in domestic currency. Use of derivatives refers to
the weight of trading derivatives registered in the assets side of banks´ balance sheets. Central
bank funding is adjusted for assets (deposits) against the central bank. The NPL ratio is the
ratio of non-performing loans to total loans.
In Panel B, Domestic sovereign debt, price changes (QoQ, %) refer to the quarterly
price changes in the 10 year on the run Spanish government bond. GDP growth, YoY (%) is
the yearly percentage change in GDP. Finally, Fragmentation index is derived from an index
developed by ECB staff (2018) and bounded between 0 and 1. It measures financial
fragmentation in EMU markets.
Panel A. Bank-level variables
mean sd p25 p75
Holdings of domestic sovereign debt (% of total assets) 9.6 8.0 5.4 10.9
growth rate, QoQ (%) 6.2 36.2 -5.9 10.9
Home bonds / Total sovereign bonds, % 89.6 11.8 83.4 98.3
Home bonds / (Home bonds and non-local MAC bonds), % 92.6 9.9 89.9 99.5
Home bonds / (Home bonds and LAC bonds), % 96.2 6.9 94.4 100.0
Non-local MAC bonds / (Non-local MAC and LAC bonds), % 71.3 33.7 48.0 100.0
Assets (EUR billion) 237.0 319.0 57.2 310.0
Cross_claims (% of total assets) 13.5 19.1 2.5 11.3
Interbank funding (% of total assets) 6.6 3.2 3.9 9.1
Deposit funding (% of total assets) 58.8 11.4 48.6 69.1
Use of derivatives (% of total assets) 0.018 0.026 0.001 0.020
Bond funding (% of total assets) 12.1 7.4 6.5 17.0
Central bank funding (% of total assets) 5.1 5.3 1.6 8.1
quarterly var iation (% of total assets) 0.1 2.0 -0.7 0.9
Tier 1 capital ratio (% of r isk-weighted assets) 10.3 2.1 8.9 11.7
NPL ratio (% of total loans; only loans in Spain) 8.9 5.2 4.9 12.0
Panel B. Macro-financial variables
mean sd p25 p75
Domestic sovereign debt, price changes (QoQ, %) 0.6 4.3 -1.3 3.5
GDP growth (YoY, %) 0.0 2.5 -2.2 2.5
Fragmentation index 0.6 0.1 0.5 0.7

BANCO DE ESPAÑA 33 DOCUMENTO DE TRABAJO N.º 1843
Table 2. Moral hazard versus alternative channels
The table studies the determinants of holdings of domestic sovereign bonds. Our
sample consists of the fourteen significant banks identified in Spain as of the end of 2016Q4.
We cover the period from 2008Q1 to 2016Q4 on a quarterly basis. The dependent variable is
the quarterly percentage change in holdings of domestic sovereign bonds of each bank
(holdings trimmed at 100% QoQ to avoid outliers). WEAK is a dummy equal to one when a
bank has, in the preceding quarter, a Tier 1 capital ratio (T1) below the median value of the T1
of our sample of banks, and it is zero otherwise. PRICE10Y is the quarterly percentage change
in the price of the 10 year on the run Spanish government bond. CBfunding is the quarterly
variation of funding from the central bank (adjusted for assets against this institution) divided by
total assets. GDP is the lagged yearly percentage change in GDP. Fragmentation is the first lag
of a financial fragmentation measure derived from an index for EMU markets developed by the
ECB (the index is bounded between zero and one; when close to one, financial fragmentation
rises). The specification incorporates a vector of (lagged) bank-level variables to control for
characteristics of banks, including size (natural logarithm of total assets), international activity
(exposures to other jurisdictions over total assets) and complexity (use of derivatives and the
structure of liabilities of each institution- deposit, interbank, bond and the stock of central bank
funding-, divided by total assets). Estimates of coefficients of bank-level controls are omitted in
the table. At this respect, the estimate of the coefficient of Bond funding is statistically
significant and positive in columns 1 (**) and 2 (*). No other estimates are statistically different
from zero. The specification includes bank-fixed effects.
(1) (2) (3) (4)
WEAK -15.68 -19.29 -15.02 -18.88
(22.65) (21.28) (20.08) (20.39)
PRICE10Y -0.200 -0.227 -0.191
(0.575) (0.557) (0.561)
PRICE10Y x WEAK 0.257 0.260 0.246
(0.526) (0.522) (0.524)
CBfunding 3.387*** 3.299*** 3.277***
(0.593) (0.609) (0.603)
CBfunding x WEAK -1.692 -1.682 -1.701
(1.199) (1.233) (1.213)
GDP -1.228***
(0.398)
Fragmentation 14.12**
(5.323)
Observations 500 500 500 500
Bank controls Y Y Y Y
Bank fixed effects Y Y Y Y
Time fixed effects N N N N
Number of banks 14 14 14 14
Overall R^2 0.028 0.041 0.035 0.035
Robust standard errors are shown in parentheses and are clustered at the
bank level: * p<0.10, ** p<0.05, *** p<0.01

BANCO DE ESPAÑA 34 DOCUMENTO DE TRABAJO N.º 1843
Table 3. Upsurge of sovereign exposures during the V-LTRO period and drivers
The table studies the determinants of holdings of domestic sovereign bonds during
the period in which the Eurosystem conducted the first two very long-term refinancing
operations (V-LTRO), in 2011Q4 and 2012Q1. Our sample consists of the fourteen significant
banks identified in Spain as of the end of 2016Q4. We cover the period from 2008Q1 to
2016Q4 on a quarterly basis. The dependent variable is the quarterly percentage change in
holdings of domestic sovereign bonds of each bank (holdings trimmed at 100% QoQ to avoid
outliers). WEAK is a dummy equal to one when a bank has, in the preceding quarter, a Tier 1
capital ratio (T1) below the median value of the T1 of our sample of banks, and it is zero
otherwise. PRICE10Y is the quarterly percentage change in the price of the 10 year on the run
Spanish government bond. CBfunding is the quarterly variation of funding from the central bank
(adjusted for assets against this institution) divided by total assets. GDP is the lagged yearly
percentage change in GDP. LTRO is a dummy equal to 1 in 2011Q4 and 2012Q1 (LTRO);
(1) (2) (3) (4)
WEAK -14.60 -15.39 -14.97 -15.41
(20.11) (20.47) (19.88) (20.07)
PRICE10Y -0.243 -0.219 -0.213 -0.210
(0.563) (0.562) (0.550) (0.550)
PRICE10Y x WEAK 0.270 0.246 0.262 0.261
(0.525) (0.529) (0.512) (0.516)
CBfunding 2.536** 3.399*** 2.310** 2.372***
(0.927) (0.738) (0.781) (0.772)
CBfunding x WEAK -1.101 -1.871 -0.803 -0.823
(1.638) (1.319) (1.507) (1.582)
GDP -1.119** -1.227*** -1.128** -1.118**
(0.407) (0.393) (0.423) (0.422)
LTRO 13.55*
(6.889)
LTRO x WEAK -8.978
(8.905)
LTRO-1 -4.341
(8.751)
LTRO-1 x WEAK 8.340
(11.09)
LTRO-2 28.15*** 36.87**
(5.772) (14.77)
LTRO-2 x WEAK -24.30* -29.88
(11.46) (23.10)
LTRO-2 x CBfunding -1.880
(3.205)
LTRO-2 x CBfunding x WEAK 0.901
(5.731)
Observations 500 500 500 500
Bank controls Y Y Y Y
Bank fixed effects Y Y Y Y
Time fixed effects N N N N
Number of banks 14 14 14 14
Overall R^2 0.036 0.036 0.041 0.040
Robust standard errors are shown in parentheses and are clustered at the
bank level: * p<0.10, ** p<0.05, *** p<0.01

BANCO DE ESPAÑA 35 DOCUMENTO DE TRABAJO N.º 1843
LTRO-1 is a dummy equal to 1 only in 2011Q4; LTRO-2 is a dummy equal to 1 only in 2012Q1
(LTRO-2). The specification incorporates a vector of (lagged) bank-level variables to control for
characteristics of banks, including size (natural logarithm of total assets), international activity
(exposures to other jurisdictions over total assets) and complexity (use of derivatives and the
structure of liabilities of each institution- deposit, interbank, bond and the stock of central bank
funding-, divided by total assets). Estimates of coefficients of bank-level controls are omitted in
the table. At this respect, the estimate of the coefficient of Bond funding is statistically
significant and positive in column 2 (*). No other estimates are statistically different from zero.
The specification includes bank-fixed effects.

BANCO DE ESPAÑA 36 DOCUMENTO DE TRABAJO N.º 1843
Table 4. Distressed institutions and sovereign holdings
The table explores drivers behind the composition of sovereign portfolios of distressed
banks. Our sample consists of the fourteen significant banks identified in Spain as of the end of
2016Q4. We cover the period from 2008Q1 to 2016Q4 on a quarterly basis. The dependent
variable is the quarterly percentage change in holdings of domestic sovereign bonds of each
bank (holdings trimmed at 100% QoQ to avoid outliers). WEAK is a dummy equal to one when
a bank has, in the preceding quarter, a Tier 1 capital ratio (T1) below the median value of the
T1 of our sample of banks, and it is zero otherwise. WEAK40, WEAK35, WEAK30 and
WEAK25, in turn, identify banks with T1 below 40th, 35th, 30th and 25th percentile values in
(1) (2) (3) (4) (5) (6) (7)
WEAK -11.93 -11.06 -10.29
(24.99) (24.68) (23.43)
NPLbank -0.102 -0.313 -0.441 -0.389 -0.501 -0.500 -0.320
(0.480) (0.405) (0.384) (0.364) (0.420) (0.420) (0.383)
NPLbank x WEAK 0.466* 0.538**
(0.244) (0.215)
CBfunding 2.334*** 1.535** 1.599** 1.597** 1.546
(0.692) (0.617) (0.669) (0.674) (0.910)
CBfunding x WEAK -1.900*
(1.013)
WEAK40 -12.50
(13.08)
NPLbank x WEAK40 0.728*
(0.338)
CBfunding x WEAK40 -0.587
(1.276)
WEAK35 -5.628
(12.04)
NPLbank x WEAK35 1.352***
(0.374)
CBfunding x WEAK35 -0.930
(1.011)
WEAK30 -6.255
(12.19)
NPLbank x WEAK30 1.353***
(0.374)
CBfunding x WEAK30 -0.920
(1.017)
WEAK25 -7.216
(9.431)
NPLbank x WEAK25 0.989**
(0.386)
CBfunding x WEAK25 -1.188
(1.191)
Observations 500 500 500 500 500 500 500
Bank controls Y Y Y Y Y Y Y
Bank fixed effects Y Y Y Y Y Y Y
Time fixed effects Y Y Y Y Y Y Y
Number of banks 14 14 14 14 14 14 14
Overall R^2 0.167 0.170 0.148 0.176 0.189 0.189 0.185
Robust standard errors are shown in parentheses and are clustered at the bank level: * p<0.10, ** p<0.05, *** p<0.01

BANCO DE ESPAÑA 37 DOCUMENTO DE TRABAJO N.º 1843
the preceding quarter. NPLbank is the lagged difference between the non-performing loans
ratio (NPL) of each bank (considering only its business activities in Spain) minus the average
NPL of the whole banking system at time t-1. CBfunding is the quarterly variation of funding
from the central bank (adjusted for assets against this institution) divided by total assets. The
specification incorporates a vector of (lagged) bank-level variables to control for characteristics
of banks, including size (natural logarithm of total assets), international activity (exposures to
other jurisdictions over total assets) and complexity (use of derivatives and the structure of
liabilities of each institution- deposit, interbank, bond and the stock of central bank funding-,
divided by total assets). Estimates of coefficients of bank-level controls are omitted in the table
and they are not statistically different from zero. The specification includes bank-fixed effects
and time-fixed effects.

BANCO DE ESPAÑA 38 DOCUMENTO DE TRABAJO N.º 1843
Table 5. Breakdown of sovereign portfolios: domestic and non-domestic sovereign debt
Panel A. Tests for financial fragmentation and moral suasion channels
Dependent variable
(1) (2) (3) (4) (5) (6)
Fragmentation 29.65*** 23.29**
(8.994) (8.673)
WEAK -12.42 -7.916 -8.089 -13.62 -9.770 -10.02
(10.82) (10.92) (10.39) (9.903) (10.34) (9.751)
Size -13.07 -15.13* -15.02* -14.59** -15.66** -15.55**
(7.960) (7.431) (7.091) (6.271) (6.665) (6.312)
CROSS -0.425 -0.289 -0.330 -0.440 -0.365 -0.404
(0.451) (0.472) (0.507) (0.418) (0.435) (0.462)
CBfunding -0.182 -0.155 -0.337 -0.314
(0.218) (0.223) (0.237) (0.234)
CBfunding x WEAK -0.271 -0.301 -0.199 -0.227
(0.277) (0.269) (0.298) (0.285)
NPLbank -0.272 -0.230
(0.408) (0.372)
NPLbank x WEAK -0.0532 -0.105
(0.392) (0.422)
Observations 464 464 464 464 464 464
Bank controls Y Y Y Y Y Y
Bank fixed effects Y Y Y Y Y Y
Time fixed effects N Y Y N Y Y
Number of banks 13 13 13 13 13 13
Overall R^2 0.314 0.323 0.327 0.248 0.270 0.272
Panel B. Tests for financial fragmentation, moral hazard and reach-for-yield channels
Dependent variable
(1) (2) (3) (4) (5) (6)
Fragmentation 10.27** 7.210
(3.722) (22.84)
WEAK 1.768 2.399 2.511 -14.10 -15.13 -13.61
(4.357) (4.723) (4.725) (32.98) (31.10) (30.18)
Size 2.824 1.049 1.060 -13.87 -18.79 -18.38
(5.307) (4.171) (4.192) (27.21) (29.38) (29.10)
CROSS 0.006 0.085 0.0909 1.103* 1.184* 1.108
(0.162) (0.140) (0.152) (0.605) (0.652) (0.673)
CBfunding 0.179 0.178 1.547* 1.654**
(0.108) (0.108) (0.732) (0.702)
CBfunding x WEAK -0.132 -0.128 -1.777* -1.848*
(0.080) (0.0877) (0.926) (0.962)
NPLbank 0.015 -1.040
(0.115) (1.635)
NPLbank x WEAK 0.062 1.067
(0.133) (1.449)
Observations 461 461 461 459 459 459
Bank controls Y Y Y Y Y Y
Bank fixed effects Y Y Y Y Y Y
Time fixed effects N Y Y N Y Y
Number of banks 13 13 13 13 13 13
Overall R^2 0.267 0.300 0.295 0.360 0.360 0.358
Robust standard errors are shown in parentheses and are clustered at the bank level:
* p<0.10, ** p<0.05, *** p<0.01
Ratio 4: Non-local MAC bonds
to all non-local bonds
Ratio 3: Home bonds to
(home bonds + LAC bonds)
Ratio1: Home bonds to total bonds Ratio 2: Home bonds to
(home bonds + non-local MAC bonds)

BANCO DE ESPAÑA 39 DOCUMENTO DE TRABAJO N.º 1843
This table studies the preference of banks for domestic sovereign bonds and higher-
yielding EMU sovereign debt. The dependent variables are: in panel A, “Ratio 1” or the ratio of
holdings of Spanish government bonds to the entire portfolio of sovereign debt, and “Ratio 2”
or the ratio of holdings of Spanish government bonds to holdings of MAC government debt,
including Spanish bonds in the denominator; in panel B, “Ratio 3” or the ratio of holdings of
Spanish government bonds to a portfolio formed by these bonds and LAC government debt,
and “Ratio 4” or the ratio of holdings of MAC government debt, excluding Spanish government
debt, to holdings of bonds issued by all non-domestic EMU governments. Fragmentation is the
first lag of a financial fragmentation measure derived from an index for EMU markets developed
by the ECB (the index is bounded between zero and one; when close to one, financial
fragmentation rises). Size is total assets of each bank (we take the natural logarithm) and
Cross_claims are banks´ exposures to other jurisdictions divided by total assets. WEAK is a
dummy equal to one when a bank has, in the preceding quarter, a Tier 1 capital ratio (T1)
below the median value of the T1 of our sample of banks, and it is zero otherwise. NPLbank is
the lagged difference between the non-performing loans ratio (NPL) of each bank (considering
only its business activities in Spain) minus the average NPL of the whole banking system at time t-
1. The specification incorporates a vector of (lagged) bank-level variables to control for complexity
(use of derivatives and the structure of liabilities of each institution- deposit, interbank, bond and
the stock of central bank funding-, divided by total assets). At this respect, the estimate of the
coefficient of Bond funding is statistically significant and negative in columns 1 to 3 of Panel B (**).
No other estimates are statistically different from zero. The specifications include bank-fixed
effects in all columns and time-fixed effects in columns 2, 3, 5 and 6 of each panel.

BANCO DE ESPAÑA 40 DOCUMENTO DE TRABAJO N.º 1843
Table 6. Determinants of sovereign holdings at the height of the sovereign crisis
This table tests whether determinants of holdings of domestic sovereign bonds
changed at the height of the sovereign crisis. Our sample consists of the fourteen significant
banks identified in Spain as of the end of 2016Q4. We cover the period from 2008Q1 to
2016Q4 on a quarterly basis. The dependent variable is the quarterly percentage change in
holdings of domestic sovereign bonds of each bank (holdings trimmed at 100% QoQ to avoid
outliers). WEAK is a dummy equal to one when a bank has, in the preceding quarter, a Tier 1
capital ratio (T1) below the median value of the T1 of our sample of banks, and it is zero
otherwise. PRICE10Y and PRICE5Y are, respectively, the quarterly percentage change in the
(1) (2) (3) (4)
WEAK -15.09 -13.72 -13.04 -13.85
(20.01) (20.81) (20.34) (20.73)
PRICE10Y -0.187 -0.136 0.445
(0.534) (0.481) (0.434)
PRICE10Y x WEAK 0.252 0.149 -0.127
(0.519) (0.465) (0.659)
CBfunding 3.265*** 3.205*** 2.717* 2.651*
(0.644) (0.642) (1.383) (1.321)
CBfunding x WEAK -1.694 -1.566 0.130 0.144
(1.225) (1.313) (2.485) (2.431)
GDP -1.218** -1.222** -1.229** -1.192**
(0.405) (0.407) (0.421) (0.426)
crisis 1.308 3.155 2.080 2.509
(1.995) (3.907) (3.516) (3.575)
crisis x WEAK -3.688 -1.894 -1.242
(5.875) (5.397) (5.516)
crisis x PRICE10Y -1.487
(0.901)
crisis x WEAK x PRICE10Y 0.401
(1.523)
crisis x CBfunding 1.287 1.415
(2.099) (2.030)
crisis x CBfunding x WEAK -4.085 -4.189
(3.178) (3.113)
PRICE5Y 0.618
(0.567)
PRICE5Y x WEAK 0.559
(0.765)
crisis x PRICE5Y -2.010*
(1.025)
crisis x WEAK x PRICE5Y -0.289
(1.793)
Observations 500 500 500 500
Bank controls Y Y Y Y
Bank fixed effects Y Y Y Y
Time fixed effects N N N N
Number of banks 14 14 14 14
Overall R^2 0.033 0.031 0.040 0.042
Robust standard errors are shown in parentheses and are clustered at the bank
level: * p<0.10, ** p<0.05, *** p<0.01

BANCO DE ESPAÑA 41 DOCUMENTO DE TRABAJO N.º 1843
price of the 10 year and the price of the 5 year Spanish government benchmarks. CBfunding is
the quarterly variation of funding from the central bank (adjusted for assets against this
institution) divided by total assets. GDP is the lagged yearly percentage change in GDP. crisis is
a dummy equal to 1 from 2010Q2 to 2012Q3 and zero otherwise. The specification
incorporates a vector of (lagged) bank-level variables to control for characteristics of banks,
including size (natural logarithm of total assets), international activity (exposures to other
jurisdictions over total assets) and complexity (use of derivatives and the structure of liabilities of
each institution- deposit, interbank, bond and the stock of central bank funding-, divided by
total assets). Estimates of coefficients of bank-level controls are omitted in the table and they
are not statistically significant. The specification includes bank-fixed effects.

BANCO DE ESPAÑA 42 DOCUMENTO DE TRABAJO N.º 1843
Proxy for solvency Own funds Leverage_1 Leverage_2 Own funds Leverage_1 Leverage_2
(1) (2) (3) (4) (5) (6)
WEAK 4.332 8.361 7.561 8.264 6.036 7.970
(8.329) (14.65) (10.81) (9.404) (16.88) (12.53)
PRICE10Y -0.517 -0.686 -0.536
(0.528) (0.681) (0.577)
PRICE10Y x WEAK 0.828 1.103 0.797
(0.475) (0.716) (0.487)
CBfunding 3.393*** 3.621*** 4.115*** 2.242*** 2.927** 3.260**
(0.539) (0.956) (1.053) (0.718) (1.114) (1.138)
CBfunding x WEAK -1.923* -2.505* -3.201** -1.884* -3.223** -3.557**
(0.916) (1.210) (1.381) (0.970) (1.383) (1.419)
GDP -1.401*** -1.366** -1.547***
(0.416) (0.457) (0.494)
NPLbank -0.493 -0.0816 -0.416
(0.526) (0.594) (0.506)
NPLbank x WEAK 0.544* -0.445 0.150
(0.261) (0.421) (0.363)
Observations 500 500 500 500 500 500
Bank controls Y Y Y Y Y Y
Bank fixed effects Y Y Y Y Y Y
Time fixed effects N N N Y Y Y
Number of banks 14 14 14 14 14 14
Overall R^2 0.039 0.039 0.052 0.140 0.132 0.172
Robust standard errors are shown in parentheses and are clustered at the bank level: * p<0.10, ** p<0.05, *** p<0.01
Equation (1) Equation (2)
Table 7. Alternatives proxies for solvency and results
This table tests whether our results hold for alternative measures to the Tier 1 capital
ratio (T1). Our sample consists of the fourteen significant banks identified in Spain as of the end of
2016Q4. We cover the period from 2008Q1 to 2016Q4 on a quarterly basis. The dependent
variable is the quarterly percentage change in holdings of domestic sovereign bonds of each bank
(holdings trimmed at 100% QoQ to avoid outliers). WEAK is a dummy equal to one when a bank
has, in the preceding quarter, a level of solvency below the system-wide median value of the
following list of solvency measures: (i) the own funds ratio, which adds Tier 2 items to the
numerator of the T1; (i) Leverage_1, or the ratio of total assets to all T1 instruments; and (3)
Leverage_2, or the ratio of total assets to own funds. PRICE10Y is the quarterly percentage
change in the price of the 10 year on the run Spanish government bond. CBfunding is the
quarterly variation of funding from the central bank (adjusted for assets against this institution)
divided by total assets. GDP is the lagged yearly percentage change in GDP. NPLbank is the
lagged difference between the non-performing loans ratio (NPL) of each bank (considering only its
business activities in Spain) minus the average NPL of the whole banking system at time t-1. The
specification incorporates a vector of (lagged) bank-level variables to control for characteristics of
banks, including size (natural logarithm of total assets), international activity (exposures to other
jurisdictions over total assets) and complexity (use of derivatives and the structure of liabilities of
each institution- deposit, interbank, bond and the stock of central bank funding-, divided by total
assets). Estimates of coefficients of bank-level controls are omitted in the table. At this respect,
the estimate of the coefficient of Bond funding is statistically significant and positive in columns 2
(*) and 3 (**), and the estimate of the coefficient of Size is significant and negative in column 5 (*).
No other estimates are significantly different from zero. The specification includes bank-fixed
effects in all columns and time-fixed effects in columns 4 to 6.

BANCO DE ESPAÑA 43 DOCUMENTO DE TRABAJO N.º 1843
Table 8. What if being a weak bank has been the norm?
This table explores drivers of changes in domestic sovereign bond holdings as well as
the preference of banks for home sovereign bonds and higher-yielding EMU sovereign debt. The
dependent variables are: the quarterly percentage change in holdings of domestic sovereign
bonds of each bank (holdings trimmed at 100% QoQ to avoid outliers); “Ratio 1”or s the ratio of
holdings of Spanish government bonds to the entire portfolio of sovereign debt; “Ratio 2” or the
ratio of holdings of Spanish government bonds to holdings of MAC government debt, including
Spanish bonds in the denominator; “Ratio 3” or the ratio of holdings of Spanish government
bonds to a portfolio formed by these bonds and LAC government debt; and “Ratio 4” or the ratio
of holdings of MAC government debt, excluding Spanish government debt, to holdings of bonds
issued by all non-domestic EMU governments. T1 is the Tier 1 capital ratio. Fragmentation is the
first lag of a financial fragmentation measure derived from an index for EMU markets developed
by the ECB (the index is bounded between zero and one; when close to one, financial
fragmentation rises). Size is total assets of each bank (we take the natural logarithm) and
Cross_claims are banks´ exposures to other jurisdictions divided by total assets. The specification
incorporates a vector of (lagged) bank-level variables to control for characteristics of banks (use of
derivatives and the structure of liabilities of each institution- deposit, interbank, bond and the
stock of central bank funding-, divided by total assets). Estimates of coefficients of bank-level
controls are omitted in the table. At this respect, the estimate of the coefficient of Bond funding is
statistically significant and positive in column 1 (*). No other estimates are significantly different
from zero. The specification includes bank-fixed effects.
Dependent var iable
Quarterly changes in
home sovereign debt
(in percent)
Ratio1: Home bonds
to total bonds
Ratio 2: Home bonds to
(home bonds + non-
local MAC bonds)
Ratio 3: Home bonds
to (home bonds +
LAC bonds)
Ratio 4: Non-local
MAC bonds
to all non-local bonds
(1) (2) (3) (4) (5)
Fragmentation 13.32** 30.24*** 24.25** 9.750** 4.437
(5.930) (9.544) (9.238) (3.625) (21.43)
T1 -0.721 -0.818 -0.665 -0.055 -0.245
(0.567) (0.631) (0.538) (0.234) (1.218)
Size -13.81 -12.46 -13.93* 2.657 -13.77
(11.89) (7.962) (6.595) (5.397) (28.66)
CROSS 0.0225 -0.372 -0.385 0.009 1.199*
(0.329) (0.433) (0.409) (0.160) (0.617)
CBfunding 2.498*** -0.178 -0.271 0.083 0.549
(0.615) (0.198) (0.194) (0.064) (0.562)
CBfunding x T1 0.487* -0.0826 -0.0864 0.002 -0.0562
(0.237) (0.0980) (0.0929) (0.028) (0.167)
Observations 500 464 464 461 459
Bank controls Y Y Y Y Y
Bank fixed effects Y Y Y Y Y
Time fixed effects N N N N N
Number of banks 14 13 13 13 13
Overall R^2 0.039 0.316 0.249 0.266 0.362
Robust standard errors are shown in parentheses and are clustered at the bank level: * p<0.10, ** p<0.05, *** p<0.01
* p<0.10, ** p<0.05, *** p<0.01

BANCO DE ESPAÑA 44 DOCUMENTO DE TRABAJO N.º 1843
Dependent variable
Ratio1:
Home
bonds to
total bonds
Ratio 2:
Home
bonds to
(home
bonds +
non-local
MAC
bonds)
Ratio 3:
Home
bonds to
(home
bonds +
LAC
bonds)
Ratio 4:
Non-local
MAC
bonds
to all non-
local
bonds
(1) (2) (3) (4) (5) (6) (7) (8)
WEAK -23.90 -23.78 -23.45 -15.69 -15.55 -4.523 -32.69
(17.24) (17.27) (16.75) (11.36) (9.899) (7.130) (28.77)
PRICE10Y -0.183 -0.170
(0.372) (0.371)
PRICE10Y x WEAK 0.184 0.181
(0.483) (0.482)
CBfunding 3.056*** 2.818*** 2.627*** 1.972*** -0.111 -0.0508 -0.0674 -0.0419
(0.650) (0.618) (0.721) (0.586) (0.156) (0.112) (0.163) (0.559)
CBfunding x WEAK -2.823*** -2.660*** -3.105*** 0.114 -0.110 0.147 0.381
(0.797) (0.817) (0.819) (0.175) (0.173) (0.126) (0.824)
Fragmentation 21.60*** 19.27*** 23.36*** 11.89** 16.04** 19.94
(6.941) (6.425) (6.863) (4.871) (6.222) (16.54)
LTRO-2 14.90*
(8.760)
LTRO-2 x WEAK -10.75
(11.65)
NPLbank -0.933* -0.821*
(0.499) (0.435)
NPLbank x WEAK 0.671
(0.436)
WEAK35 -7.378
(14.00)
NPLbank x WEAK35 0.760*
(0.414)
CBfunding x WEAK35 -2.516***
(0.803)
Observations 660 660 660 660 473 473 473 463
Bank controls Y Y Y Y Y Y Y Y
Bank fixed effects Y Y Y Y Y Y Y Y
Time fixed effects N N Y Y N N N N
Number of banks 37 37 37 37 23 23 23 23
Overall R^2 0.032 0.034 0.152 0.147 0.132 0.192 0.096 0.264
Robust standard errors are shown in parentheses and are clustered at the bank level: * p<0.10, ** p<0.05, *** p<0.01
Quarterly changes in home sovereign debt
(in percent)
Table 9. New aggregation strategy: composition of banking groups at each date
The table uses a different approach to aggregate bank-level information, in which we
take the composition of banking groups at each date. Dependent variables are: the quarterly
percentage change in holdings of domestic sovereign bonds of each bank (holdings trimmed at
100% QoQ to avoid outliers); “Ratio 1”or s the ratio of holdings of Spanish government bonds
to the entire portfolio of sovereign debt; “Ratio 2” or the ratio of holdings of Spanish
government bonds to holdings of MAC government debt, including Spanish bonds in the
denominator; “Ratio 3” or the ratio of holdings of Spanish government bonds to a portfolio
formed by these bonds and LAC government debt; and “Ratio 4” or the ratio of holdings of
MAC government debt, excluding Spanish government debt, to holdings of bonds issued by all
non-domestic EMU governments. WEAK (WEAK 35) is a dummy equal to one when a bank

BANCO DE ESPAÑA 45 DOCUMENTO DE TRABAJO N.º 1843
has, in the preceding quarter, a Tier 1 capital ratio (T1) below the median (35th percentile) value
of the T1 of our sample of banks, and it is zero otherwise. PRICE10Y is the quarterly
percentage change in the price of the 10 year on the run Spanish government bond.
CBfunding is the quarterly variation of funding from the central bank (adjusted for assets
against this institution) divided by total assets. Fragmentation is the first lag of a financial
fragmentation measure derived from an index for EMU markets developed by the ECB (the
index is bounded between zero and one; when close to one, financial fragmentation rises).
LTRO-2 is a dummy equal to 1 in 2012Q1. NPLbank is the lagged difference between the non-
performing loans ratio (NPL) of each bank (considering only its business activities in Spain)
minus the average NPL of the whole banking system at time t-1. Estimates of coefficients of
bank-level controls are omitted in the table. At this respect, the estimate of the coefficient of
trading derivatives is statistically significant and positive in columns 1 (*), 2 (*), 5(**), 6(***), and
significant and negative in 8(**). The estimate of cross exposures to total assets (adjusted for
sovereign holdings) is negative and significant in column 6. Finally, Bond funding is significant
and positive in column 3 (*).No other estimates are significantly different from zero. All
specifications include bank-fixed effects, while some incorporate time-fixed effects, too.

BANCO DE ESPAÑA 46 DOCUMENTO DE TRABAJO N.º 1843
Figure 1. Holdings of domestic sovereign bonds
SOURCE: Statistical Data Warehouse.
As reported by Monetary Financial Institutions (MFI) in each country excluding the
European System of Central Banks. Debt holdings of more affected and less affected by the
crisis banking systems (from now on, MAC and LAC systems) weighted by MFI assets of each
country. LAC banks are MFI based in Austria, Belgium, Estonia, Finland, France, Germany,
Luxembourg, Malta, The Netherlands and Slovakia. MAC banks are MFI based in Cyprus,
Greece, Ireland, Italy, Portugal, Slovenia and Spain. The shaded area represents the sovereign
crisis period (2010Q2-2012Q3).
0
2
4
6
8
10
12
2008 2010 2012 2014 2016
MAC banks Spanish banks LAC banks
% of total assets

BANCO DE ESPAÑA 47 DOCUMENTO DE TRABAJO N.º 1843
Figure 2. Sovereign yields and Return on Equity (RoE) of banks as of 2012Q2
SOURCE: Statistical Data Warehouse and Reuters.
LAC banking systems in the figure: AT (Austria), Belgium (BE), Finland (FI), France (FR),
Germany (DE) and The Netherlands (NL). MAC banking systems in the figure: Ireland (IE), Italy
(IT), Portugal (PT), Slovenia (SI) and Spain (ES). Greece not included in the figure (no data for
ROE). Yields are computed over the 10 year on-the-run Treasury note.
0
2
4
6
8
10
12
14
-20 -15 -10 -5 0 5 10 15
Yie
ld t
o m
atu
rity
(1
0y,
%)
ROE (%)
MAC banks LAC banks
DE
ES
ITIE
PT
SI
AT
NL
FR
FI
BE

BANCO DE ESPAÑA 48 DOCUMENTO DE TRABAJO N.º 1843
Figure 3. EMU more affected by the crisis banks: funding from Eurosystem lending
operations and holdings of domestic sovereign bonds
SOURCE: Statistical Data Warehouse and Bruegel database of Eurosystem lending operations
developed in Pisani-Ferry and Wolff (2012).
MAC banks are banks based in Cyprus, Greece, Ireland, Italy, Portugal, Slovenia and
Spain. The shaded area represents the sovereign crisis period (2010Q2-2012Q3).
0
2
4
6
8
10
12
0
100
200
300
400
500
600
700
800
900
1,000
2008 2010 2012 2014 2016
Funding from Eurosystem lending operations
Holdings of domestic sovereign bonds (RHS)
EUR bn % of total assets

BANCO DE ESPAÑA 49 DOCUMENTO DE TRABAJO N.º 1843
Figure 4. GDP and holdings of domestic sovereign bonds in more and less affected by
the crisis banking systems
SOURCE: Statistical Data Warehouse and Eurostat.
Debt holdings as reported by Monetary Financial Institutions (MFI) in each country
excluding the European System of Central Banks, and weighted by MFI assets of each
country. GDP changes weighted according to nominal GDP in each group. MAC countries are
Cyprus, Greece, Ireland, Italy, Portugal, Slovenia and Spain. LAC countries are Austria,
Belgium, Estonia, Finland, France, Germany, Luxembourg, Malta and the Netherlands. The
shaded area represents the sovereign crisis period (2010Q2-2012Q3).
80
85
90
95
100
105
1100
2
4
6
8
10
12
2008 2010 2012 2014 2016
Home bonds of MAC banks Home bonds of LAC banks
GDP in MAC countries GDP in LAC countries
Home bonds, % of total assets
Real GDP (inverted scale, Q108 = 100)

BANCO DE ESPAÑA 50 DOCUMENTO DE TRABAJO N.º 1843
Figure 5. Holdings of government debt issued by countries less affected by the crisis
SOURCE: ECB (Securities Holdings Statistics by Sector) and Statistical Data Warehouse.
As reported by deposit-taking corporations in each country, excluding home bonds.
Debt holdings of MAC and LAC banks weighted by MFI assets of each country. LAC banks are
banks based in Austria, Belgium, Estonia, Finland, France, Germany, Luxembourg, Malta, the
Netherlands and Slovakia. MAC banks are banks based in Cyprus, Greece, Ireland, Italy,
Portugal, Slovenia and Spain. Shaded area: sovereign crisis period (2010Q2-2012Q3).
0.0
0.2
0.4
0.6
0.8
1.0
1.2
2009 2011 2013 2015
MAC banks Spanish banks LAC banks
% of total assets

BANCO DE ESPAÑA 51 DOCUMENTO DE TRABAJO N.º 1843
Figure 6. Holdings of government debt issued by countries more affected by the crisis
SOURCE: ECB (Securities Holdings Statistics by Sector) and Statistical Data Warehouse.
As reported by deposit-taking corporations in each country, excluding home bonds. Debt
holdings of MAC and LAC banks weighted by MFI assets of each country. LAC banks are banks
based in Austria, Belgium, Estonia, Finland, France, Germany, Luxembourg, Malta, the
Netherlands and Slovakia. MAC banks are banks based in Cyprus, Greece, Ireland, Italy, Portugal,
Slovenia and Spain. The shaded area represents the sovereign crisis period (2010Q2-2012Q3).
0.0
0.2
0.4
0.6
0.8
1.0
1.2
1.4
2009 2011 2013 2015
MAC banks Spanish banks LAC banks
% of total assets

BANCO DE ESPAÑA 52 DOCUMENTO DE TRABAJO N.º 1843
Figure 7. Financial fragmentation in EMU markets
SOURCE: ECB.
The shaded area represents the sovereign crisis period (2010Q2-2012Q3).
0.0
0.1
0.2
0.3
0.4
0.5
0.6
0.7
0.8
0.9
1.0
2008 2010 2012 2014 2016
Fragmentation
Increase in financial fragmentation

BANCO DE ESPAÑA PUBLICATIONS
WORKING PAPERS
1801 OLYMPIA BOVER, LAURA HOSPIDO and ERNESTO VILLANUEVA: The impact of high school financial education on
financial knowledge and choices: evidence from a randomized trial in Spain.
1802 IGNACIO HERNANDO, IRENE PABLOS, DANIEL SANTABÁRBARA and JAVIER VALLÉS: Private Saving. New Cross-
Country Evidence Based on Bayesian Techniques.
1803 PABLO AGUILAR and JESÚS VÁZQUEZ: Term structure and real-time learning.
1804 MORITZ A. ROTH: International co-movements in recessions.
1805 ANGELA ABBATE and DOMINIK THALER: Monetary policy and the asset risk-taking channel.
1806 PABLO MARTÍN-ACEÑA: Money in Spain. New historical statistics. 1830-1998.
1807 GUILHERME BANDEIRA: Fiscal transfers in a monetary union with sovereign risk.
1808 MIGUEL GARCÍA-POSADA GÓMEZ: Credit constraints, fi rm investment and growth: evidence from survey data.
1809 LAURA ALFARO, MANUEL GARCÍA-SANTANA and ENRIQUE MORAL-BENITO: On the direct and indirect real
effects of credit supply shocks.
1810 ROBERTO RAMOS and CARLOS SANZ: Backing the incumbent in diffi cult times: the electoral impact of wildfi res.
1811 GABRIEL JIMÉNEZ, ENRIQUE MORAL-BENITO and RAQUEL VEGAS: Bank lending standards over the cycle:
the role of fi rms’ productivity and credit risk.
1812 JUAN S. MORA-SANGUINETTI and ROK SPRUK: Industry vs services: do enforcement institutions matter for
specialization patterns? Disaggregated evidence from Spain.
1813 JAMES CLOYNE, CLODOMIRO FERREIRA and PAOLO SURICO: Monetary policy when households have debt: new
evidence on the transmission mechanism.
1814 DMITRI KIRPICHEV and ENRIQUE MORAL-BENITO: The costs of trade protectionism: evidence from Spanish fi rms
and non-tariff measures.
1815 ISABEL ARGIMÓN, CLEMENS BONNER, RICARDO CORREA, PATTY DUIJM, JON FROST, JAKOB DE HAAN,
LEO DE HAAN and VIKTORS STEBUNOVS: Financial institutions’ business models and the global transmission of
monetary policy.
1816 JOSE ASTURIAS, MANUEL GARCÍA-SANTANA and ROBERTO RAMOS: Competition and the welfare gains from
transportation infrastructure: evidence from the Golden Quadrilateral of India.
1817 SANDRA GARCÍA-URIBE: Multidimensional media slant: complementarities in news reporting by US newspapers .
1818 PILAR CUADRADO, AITOR LACUESTA, MARÍA DE LOS LLANOS MATEA and F. JAVIER PALENCIA-GONZÁLEZ:
Price strategies of independent and branded dealers in retail gas market. The case of a contract reform in Spain.
1819 ALBERTO FUERTES, RICARDO GIMENO and JOSÉ MANUEL MARQUÉS: Extraction of infl ation expectations from
fi nancial instruments in Latin America.
1820 MARIO ALLOZA, PABLO BURRIEL and JAVIER J. PÉREZ: Fiscal policies in the euro area: revisiting the size of spillovers.
1821 MARTA MARTÍNEZ-MATUTE and ALBERTO URTASUN: Uncertainty, fi rm heterogeneity and labour adjustments.
Evidence from European countries.
1822 GABRIELE FIORENTINI, ALESSANDRO GALESI, GABRIEL PÉREZ-QUIRÓS and ENRIQUE SENTANA: The rise and fall
of the natural interest rate.
1823 ALBERTO MARTÍN, ENRIQUE MORAL-BENITO and TOM SCHMITZ: The fi nancial transmission of housing bubbles:
evidence from Spain.
1824 DOMINIK THALER: Sovereign default, domestic banks and exclusion from international capital markets.
1825 JORGE E. GALÁN and JAVIER MENCÍA: Empirical assessment of alternative structural methods for identifying cyclical
systemic risk in Europe.
1826 ROBERTO BLANCO and NOELIA JIMÉNEZ: Credit allocation along the business cycle: evidence from the latest boom
bust credit cycle in Spain.
1827 ISABEL ARGIMÓN: The relevance of currency-denomination for the cross-border effects of monetary policy.
1828 SANDRA GARCÍA-URIBE: The effects of tax changes on economic activity: a narrative approach to frequent anticipations.
1829 MATÍAS CABRERA, GERALD P. DWYER and MARÍA J. NIETO: The G-20 regulatory agenda and bank risk.
1830 JACOPO TIMINI and MARINA CONESA: Chinese exports and non-tariff measures: testing for heterogeneous effects at the
product level.
1831 JAVIER ANDRÉS, JOSÉ E. BOSCÁ, JAVIER FERRI and CRISTINA FUENTES-ALBERO: Households’ balance sheets and
the effect of fi scal policy.

1832 ÓSCAR ARCE, MIGUEL GARCÍA-POSADA, SERGIO MAYORDOMO and STEVEN ONGENA: Adapting lending policies
when negative interest rates hit banks’ profi ts.
1833 VICENTE SALAS, LUCIO SAN JUAN and JAVIER VALLÉS: Corporate cost and profi t shares in the euro area and the US:
the same story?
1834 MARTÍN GONZÁLEZ-EIRAS and CARLOS SANZ: Women’s representation in politics: voter bias, party bias, and electoral
systems.
1835 MÓNICA CORREA-LÓPEZ and BEATRIZ DE BLAS: Faraway, so close! Technology diffusion and fi rm heterogeneity in the
medium term cycle of advanced economies.
1836 JACOPO TIMINI: The margins of trade: market entry and sector spillovers, the case of Italy (1862-1913).
1837 HENRIQUE S. BASSO and OMAR RACHEDI: The young, the old, and the government: demographics and fi scal
multipliers.
1838 PAU ROLDÁN and SONIA GILBUKH: Firm dynamics and pricing under customer capital accumulation.
1839 GUILHERME BANDEIRA, JORDI CABALLÉ and EUGENIA VELLA: Should I stay or should I go? Austerity,
unemployment and migration.
1840 ALESSIO MORO and OMAR RACHEDI: The changing structure of government consumption spending.
1841 GERGELY GANICS, ATSUSHI INOUE and BARBARA ROSSI: Confi dence intervals for bias and size distortion in IV
and local projections – IV models.
1842 MARÍA GIL, JAVIER J. PÉREZ, A. JESÚS SÁNCHEZ and ALBERTO URTASUN: Nowcasting private consumption:
traditional indicators, uncertainty measures, credit cards and some internet data.
1843 MATÍAS LAMAS and JAVIER MENCÍA: What drives sovereign debt portfolios of banks in a crisis context?
Unidad de Servicios AuxiliaresAlcalá, 48 - 28014 Madrid
E-mail: [email protected]