What drives bilateral remittances to Pakistan? A gravity...
28
What drives bilateral remittances to Pakistan? A gravity model approach Junaid Ahmed * and Inmaculada Martinez-Zarzoso ** * Department of Economics, University of Göttingen, Germany E-mail: [email protected] ** Department of Economics, University of Göttingen, Germany and University Jaume I in Castellón, Spain Abstract Formal remittance flows to Pakistan have shown noticeable growth over the past decade. Using bilateral remittance data for 23 major source countries, this study examines the external and internal factors driving these remittance flows during the period 2001-2011. We estimate a gravity model for bilateral remittance flows using a variety of panel data techniques suitable to control for unobserved heterogeneity as well as simultaneous bias existing between remittances and migrant’s stock. The main novelty with respect to the existing literature is the use of transaction costs of remittances as a superior alternative to geographical distance to proxy for remittance costs. We find that several factors have a significant effect on remittances, such as improved economic conditions in the receiving country, Pakistani migrant’s stock in the source country, and financial development and political stability in the recipient country. Geographical distance, economic conditions and the unemployment rate in the source countries, however, do not appear to play a substantial role. We also find that geographical distance seems to be a poor proxy for the cost of remitting. This can be better understood in terms of migrant networks and improvements in receiving and source country financial services. While the effect of transaction costs of remittances’ on remittance flows is found to be negative, its significance is not robust to changes in the specification of the estimated models. Key words: Remittances, gravity model, stock of migrant, geographical distance, and transaction cost, financial development, political stability, Pakistan. JEL-Codes: F22, F30, J61, O11, O24
Transcript of What drives bilateral remittances to Pakistan? A gravity...

What drives bilateral remittances to Pakistan? A gravity model approach
Junaid Ahmed* and Inmaculada Martinez-Zarzoso
**
* Department of Economics, University of Göttingen, Germany
E-mail: [email protected]
**
Department of Economics, University of Göttingen, Germany
and University Jaume I in Castellón, Spain
Abstract
Formal remittance flows to Pakistan have shown noticeable growth over the past decade.
Using bilateral remittance data for 23 major source countries, this study examines the
external and internal factors driving these remittance flows during the period 2001-2011. We
estimate a gravity model for bilateral remittance flows using a variety of panel data
techniques suitable to control for unobserved heterogeneity as well as simultaneous bias
existing between remittances and migrant’s stock. The main novelty with respect to the
existing literature is the use of transaction costs of remittances as a superior alternative to
geographical distance to proxy for remittance costs. We find that several factors have a
significant effect on remittances, such as improved economic conditions in the receiving
country, Pakistani migrant’s stock in the source country, and financial development and
political stability in the recipient country. Geographical distance, economic conditions and
the unemployment rate in the source countries, however, do not appear to play a substantial
role. We also find that geographical distance seems to be a poor proxy for the cost of
remitting. This can be better understood in terms of migrant networks and improvements in
receiving and source country financial services. While the effect of transaction costs of
remittances’ on remittance flows is found to be negative, its significance is not robust to
changes in the specification of the estimated models.
Key words: Remittances, gravity model, stock of migrant, geographical distance, and
transaction cost, financial development, political stability, Pakistan.
JEL-Codes: F22, F30, J61, O11, O24
1- Introduction
One of the principal factors that encourage migration across national boundaries is the
difference in expected real earnings adjusted for migration cost (Borjas, G. 1991; Stark and
Taylor, 1991). The costs incurred during the migration process increases with distance from
the migrant’s sending to the migrant’s receiving countries, and decreases as social networks
in the migrant’s receiving countries increases (Ozden and Schiff, 2006). In 2013, the United
Nations reported that there are about 232 million migrants around the world ( approximately
3.2 percent of the world population) compared with 175 million in 2000, and 154 million in
1990 (UN-DESA, 2013). The foremost impact of migration is the increase in income of
recipient country residents, mainly through remittances (McKenzie and Sasin, 2007).
Recorded remittances to developing countries are the largest source of foreign financing after
foreign direct investment (FDI), exceeding both official development assistance (ODA) and
portfolio investment (World Bank, 2013b). The inflows to developing countries have
increased more than tenfold over the last decade. The amount reached 414 billion in 2012,
growing by 6.3 percent over the previous year (World Bank, 2013b). The overwhelming
growth in remittances may be attributed to the better recording of data as well as a shift from
informal to formal channels induced by lower transaction costs of remitting money home.
However, the prevalence of informal transactions is still likely to be substantial. Freud and
Spatafora (2008) argue that informal remittances amount to about 35-75 percent of recorded
remittances to developing countries.
For many developing countries facing a weak balance of payments situation like Pakistan,
remittances emerged as a large source of foreign exchange earnings. Pakistan is one of the
top destinations of official remittance-receiving countries together with India, China, the
Philippines, Mexico, Nigeria, Egypt, and Bangladesh (World Bank, 2013b). The flow
reached $14 billion in 2012, compared with $2 billion in 2002. This increase in remittances
has outpaced that of net ODA and FDI, which accounted for only $2.02 billion and $0.85
billion in 2012 (WDI, 2013). Likewise, compared to FDI and foreign aid, remittances tend to
be resilient and increase during periods of economic turmoil (Ahmed and Martinez, 2013).
It is important to understand the determinants of remittances so that suitable policies can be
devised in order to enhance access to remittances. However, with the exception of a few
studies that emphasized remittances from the Persian Gulf, existing empirical literature on the
determinants of migrant’s remittances to Pakistan has mainly focused either on the
microeconomic determinants by employing household survey data, or aggregate remittance
flows. At the microeconomic level, Pasha and Altaf (1987) find that the investment motive
influences the migrant’s decision to remit, while Nishat and Bilgrami (1993) find support for
motives that are both altruistic and based on self-interest. Anwar and Mughal (2012) find that
altruistic motives are likely the main drivers of remittance incidence at the household level.
Illahi and Jaffery (1999) conclude that informal loan repayment is an important reason for
remitting for Pakistani migrant’s. The only study that identifies the macroeconomic response
of remittance flows in Pakistan is Kock and Sun (2011), which find that the skill level of
migrant’s, agricultural output, and the relative yield on investments in recipient and source
countries are important determinants of remittances to Pakistan. We distinguish our study
from Kock and Sun’s analysis by using bilateral remittance flows.
Despite the ever-increasing size of these flows, to date, very little attention has been paid to
the macroeconomic foundation of remittance flows from Pakistan’s main remittance source
countries and regions. Given Pakistan’s current economic challenges in the face of the
ongoing terrorism campaign, migrant’s remittances are serving as the country’s economic
lifeline (Mughal, 2013), and their development potential is therefore of great importance.
This study examines key aspects influencing remittances, employing a gravity model
approach. In particular, the economic, geographical, institutional, and financial determinants
of bilateral remittance flows are considered. The main novelty with respect to the existing
literature that examines bilateral remittances is the use of transaction costs of remittances as a
superior alternative to geographical distance to proxy for remittance costs.
More specifically, we aim to answer the following questions:
Is distance a good proxy for the transaction cost of remittances?
What is the relationship between the migrant’s stock and remittances?
Are there altruistic or self-interest motives that drive remittance flows?
How do institutional quality and financial development affect the size of remittances
to the country?
This study attempts to answer these questions using a dataset for the period 2001-2011
comprising 23 major remittances’ source countries. To answer the first question, we estimate
the cost of sending remittances and use this variable in the model instead of distance. In order
to answer the second question, we construct a time series of Pakistani migration stock. The
third and fourth questions are answered by using several explanatory variables related to
income, institutional quality, and financial development.
The rest of the paper proceeds as follows. Section 2 briefly presents Pakistan’s migration and
remittance history. Section 3 reviews the literature, particularly focusing on bilateral
remittance determinants. Section 4 employs a gravity model framework in order to examine
the main determinants of remittance flows using bilateral data. Results are presented in
section 5. Section 6 concludes and outlines a number of policy implications.
2- Overview of Bilateral Migration and Remittances to Pakistan: A
Closer Look
The first major wave of migration from Pakistan began in the 1970s when thousands of
Pakistani workers left for the states of the Persian Gulf. In 2013, about 5.7 million Pakistani
immigrant’s resided abroad, compared with 3.7 million in 2000, and 3.6 million in 19901
(UN-DESA, 2013). This shows that 54 percent of this growth in migrant’s stock took place
during the period 2000-2013. Some of the factors pushing this move overseas included
unfavorable socio-economic conditions, political turmoil, growing population, and substantial
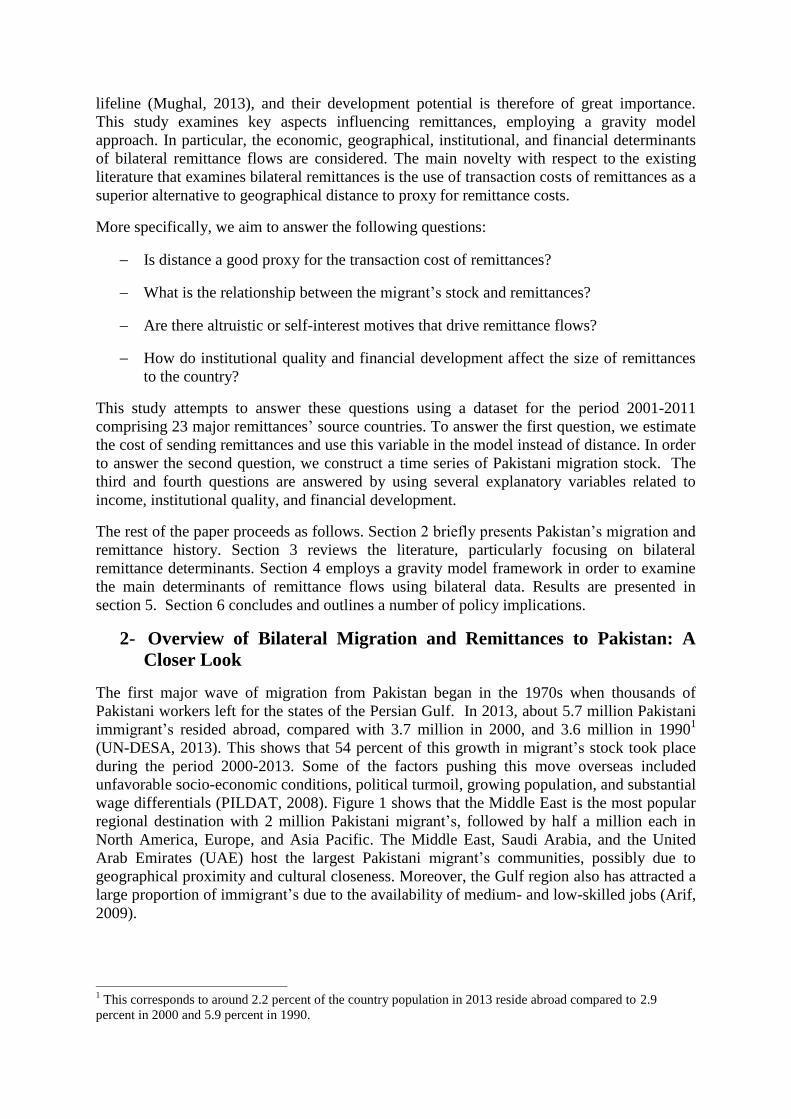
wage differentials (PILDAT, 2008). Figure 1 shows that the Middle East is the most popular
regional destination with 2 million Pakistani migrant’s, followed by half a million each in
North America, Europe, and Asia Pacific. The Middle East, Saudi Arabia, and the United
Arab Emirates (UAE) host the largest Pakistani migrant’s communities, possibly due to
geographical proximity and cultural closeness. Moreover, the Gulf region also has attracted a
large proportion of immigrant’s due to the availability of medium- and low-skilled jobs (Arif,
2009).
1 This corresponds to around 2.2 percent of the country population in 2013 reside abroad compared to 2.9
percent in 2000 and 5.9 percent in 1990.
Figure 1: Relationship between Pakistani migrant’s stock, remittances, and remittances per
capita in major destination countries in 2013.
Source: Author's calculations using data from the UN-DESA (2013) and the State Bank of Pakistan (2013).
Similarly, the United States (US), Canada, the United Kingdom (UK), Italy, and Spain are
countries with sizeable Pakistani overseas communities. At present, rapidly growing
Southeast Asian economies such as Malaysia and Singapore, and Australia are attracting an
increasing number of Pakistani workers (UN-DESA, 2013). Overall, migrant tend to choose
destinations with the same religion and official language as in their origin country and that
are geographically close.
Migration to the Persian Gulf is mostly temporary in nature and workers are usually young
and low-skilled males (Gazder, 2003; Arif, 2009) coming from a rural, low-income family
background (Azam, 1991; Addleton, 1992). These migrant’s lack not only the financial
resources required for distant migration, but also the education and skills required in the labor
markets in high-income countries. In contrast, migrant’s to Western countries are often highly
educated and come from well-off households (Gazder, 2003). These migrants have the
possibility to bring their families with them, ultimately leading to permanent settlement in
those countries. For this type of migration, the emigrant’s predominantly migrate to the US
and the UK (Figure 1). The presence of such a significant number of immigrant’s has not
only accelerated the integration of Pakistan into the world economy, but has also translated
into a large flow of remittances back home. This flow plays an increasingly important role in
easing difficulties facing the country’s economy in terms of foreign exchange, balance of
payments, and economic growth (State Bank of Pakistan, 2012). The amount of remittances
increased from a modest US$ 1 billion in 2000 to US$5 billion in 2006 crossing to $14
billion in 2012 (WDI, 2013). This spectacular growth means that the country is now ranked
as the sixth highest receiver of remittances in the world (World Bank, 2012b). Remittances to
the country comprised about 6.2 percent of GDP in 2012, and equaled 45 and 29 percent of
the country’s exports and imports of goods and services in 2012 respectively.
0 0.2 0.4 0.6 0.8 1 1.2 1.4
0 1000 2000 3000 4000 5000 6000 7000
Remittances Remittances per Capita Migrant Stocks

Table 1: Remittance flow to Pakistan as a share of total remittances, GDP and export
Remittances by
source countries
Share in total
remittances
Share in GDP Share in
Export
2001 2012 2001 2012 2001 2012 2001 2012
GCC 693.22 8030.86 63.80 60.90 0.96 3.47 7.76 32.46
Bahrain 23.87 210.95 2.20 1.60 0.03 0.09 0.27 0.85
Kuwait 123.39 582.57 11.36 4.46 0.17 0.25 1.38 2.37
Qatar 13.38 318.82 1.23 2.42 0.02 0.14 0.15 1.29
Saudi Arabia 304.43 3687 28.02 27.96 0.42 1.59 3.41 14.90
UAE 190.04 2848.86 17.49 21.60 0.26 1.23 2.13 11.51
Oman 38.11 382.66 3.51 2.90 0.05 0.17 0.43 1.55
North America 230.52 1676.17 21.22 12.71 0.32 0.73 2.58 6.77
Canada 4.9 177.71 0.45 1.35 0.01 0.08 0.05 0.72
US 225.62 1498.46 20.76 11.36 0.31 0.65 2.53 6.06
Euro Area 112.87 1957.92 10.39 14.85 0.16 0.85 1.26 7.91
Belgium 1.1 3.14 0.10 0.02 0.00 0.00 0.01 0.01
Denmark 3.83 26.46 0.35 0.20 0.01 0.01 0.04 0.11
France 2.22 45.11 0.20 0.34 0.00 0.02 0.02 0.18
Germany 9.2 88.74 0.85 0.67 0.01 0.04 0.10 0.36
Greece 0 9.92 0.00 0.08 0.00 0.00 0.00 0.04
Ireland 0.2 79.55 0.02 0.60 0.00 0.03 0.00 0.32
Italy 0.55 41.09 0.05 0.31 0.00 0.02 0.01 0.17
Netherlands 3.6 6.63 0.33 0.05 0.00 0.00 0.04 0.03
Norway 5.74 38.49 0.53 0.29 0.01 0.02 0.06 0.16
Spain 0.06 52.77 0.01 0.40 0.00 0.02 0.00 0.21
Switzerland 4.24 33.54 0.39 0.25 0.01 0.01 0.05 0.14
Sweden 0.74 11.38 0.07 0.09 0.00 0.00 0.01 0.05
UK 81.39 1521.1 7.49 11.54 0.11 0.66 0.91 6.15
Asia Pacific 8.08 123.48 0.74 0.94 0.01 0.05 0.09 0.50
Japan 3.93 9.03 0.36 0.07 0.01 0.00 0.04 0.04
Australia 4.15 114.45 0.38 0.87 0.01 0.05 0.05 0.46
Source: The State Bank of Pakistan and author’s own calculations. All figures are percentages.
Table 1 presents detailed information on the remittance shares of selected source countries in
2001 and 2012. Saudi Arabia, the US, the UAE, and the UK represent Pakistan’s main
remittance sending countries. Over the past ten years, Saudi Arabia and the UAE have
accounted for the largest share of remittances to Pakistan. The share of the US has somewhat
decreased during the period, from 21 percent of the total to 11 percent. In contrast, the share
of Canada has tripled during the same period. The share of the UK has also risen. The overall
rise in remittances reflects both the increase in migrant’s stock and the reduction in
transaction cost. Remittances per capita, however, portray a somewhat different picture, with
more flows coming from developed nations such as the US, Australia, and the UK (Figure 2).
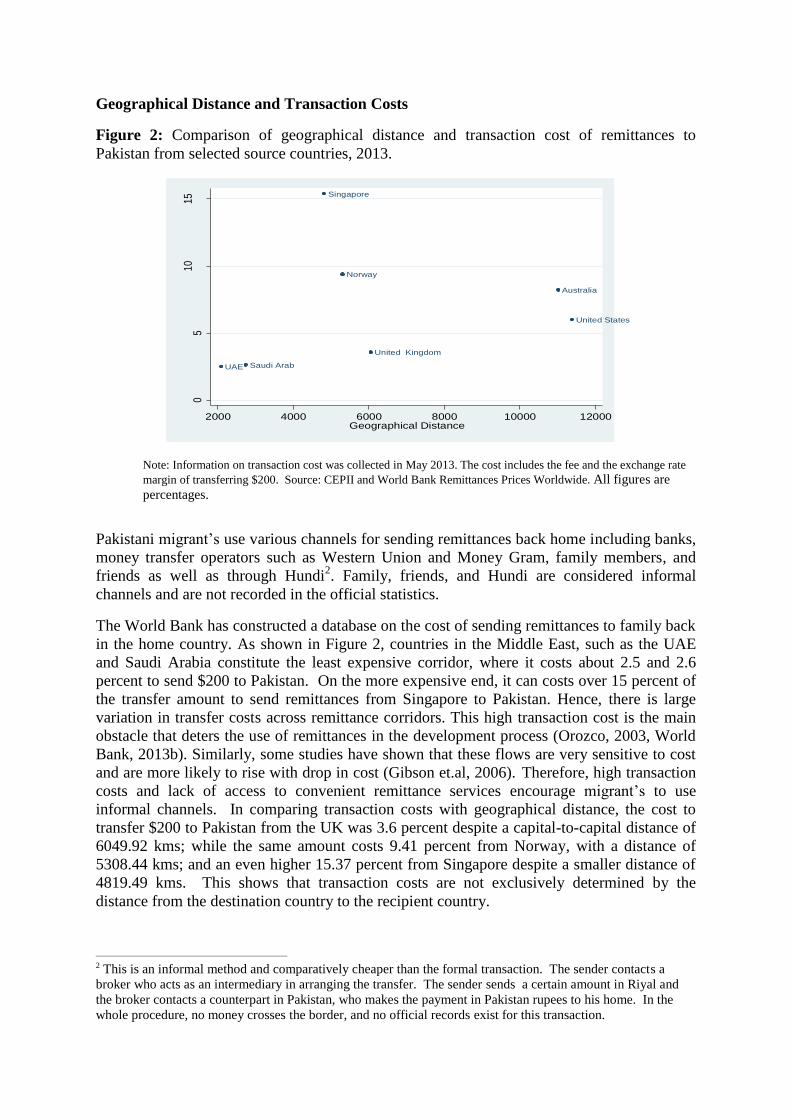
Geographical Distance and Transaction Costs
Figure 2: Comparison of geographical distance and transaction cost of remittances to
Pakistan from selected source countries, 2013.
Note: Information on transaction cost was collected in May 2013. The cost includes the fee and the exchange rate
margin of transferring $200. Source: CEPII and World Bank Remittances Prices Worldwide. All figures are
percentages.
Pakistani migrant’s use various channels for sending remittances back home including banks,
money transfer operators such as Western Union and Money Gram, family members, and
friends as well as through Hundi2. Family, friends, and Hundi are considered informal
channels and are not recorded in the official statistics.
The World Bank has constructed a database on the cost of sending remittances to family back
in the home country. As shown in Figure 2, countries in the Middle East, such as the UAE
and Saudi Arabia constitute the least expensive corridor, where it costs about 2.5 and 2.6
percent to send $200 to Pakistan. On the more expensive end, it can costs over 15 percent of
the transfer amount to send remittances from Singapore to Pakistan. Hence, there is large
variation in transfer costs across remittance corridors. This high transaction cost is the main
obstacle that deters the use of remittances in the development process (Orozco, 2003, World
Bank, 2013b). Similarly, some studies have shown that these flows are very sensitive to cost
and are more likely to rise with drop in cost (Gibson et.al, 2006). Therefore, high transaction
costs and lack of access to convenient remittance services encourage migrant’s to use
informal channels. In comparing transaction costs with geographical distance, the cost to
transfer $200 to Pakistan from the UK was 3.6 percent despite a capital-to-capital distance of
6049.92 kms; while the same amount costs 9.41 percent from Norway, with a distance of
5308.44 kms; and an even higher 15.37 percent from Singapore despite a smaller distance of
4819.49 kms. This shows that transaction costs are not exclusively determined by the
distance from the destination country to the recipient country.
2 This is an informal method and comparatively cheaper than the formal transaction. The sender contacts a
broker who acts as an intermediary in arranging the transfer. The sender sends a certain amount in Riyal and
the broker contacts a counterpart in Pakistan, who makes the payment in Pakistan rupees to his home. In the
whole procedure, no money crosses the border, and no official records exist for this transaction.
Australia
Saudi Arab
Norway
Singapore
UAE
United Kingdom
United States
05
1015
Tot
al C
ost (
Per
cent
)
2000 4000 6000 8000 10000 12000Geographical Distance
3- Why Do Migrant’s Remit? A Review of the Literature
There is considerable literature on the determinants of remittances using micro- and
aggregate-level data. However, very little work has been done on understanding the principal
determinants of these flows in a bilateral setting. Before discussing the bilateral remittance
studies that affect the behavior of migrant’s, we first provide an overview of the micro-
economic and macro-economic motives at the aggregate level that determine remittance
flows. In microeconomic studies, various motives of remittances have been discussed. The
main motives behind sending remittances as proposed in the related theoretical literature
include altruism, risk insurance, loan repayment, exchange and inheritance (Hagen and
Siegel, 2007). These motives range from pure altruism to pure self-interest (Rapoport and
Docquier, 2006). Those in between the two extremes can be termed “impure altruism”
(Andreoni, 1989), “tempered altruism” or “enlightened self-interest” (Lucas and Stark,
1985)3. In pure altruism, migrant’s send money home to financially support their dependents
in the country of origin (Johnson and Whitelaw, 1974; Lucas and Stark, 1985; Rapoport and
Docquier, 2006). When remittances are motivated by altruism, the share of remittances tend
to increase with the migrant’s income, and decrease with the recipient’s non-remittance
income (Funkhouser, 1995). According to the tempered altruism paradigm, remittances are
considered to be the result of an implicit contract between the members of a household and
migrant’s (Hagen and Siegel, 2007).
First, migration can be used as a means of reducing risk by diversifying households’ income
sources in sending family members abroad (Stark, 1991). The resulting remittances being
considered as an insurance premium (Amuedo-Dorantes and Pozo, 2006). This serves to
compensate the family for the risk from sending a migrant’s abroad, in the absence of an
efficient insurance market in the recipient country (Stark, 1991; Lambert, 1994; Gubert,
2002). Second, the family invests in the migrant education and cost of the migration process
(Rapoport and Docquier, 2006). In this scenario, the migrant sends remittances to the family
to repay this implicit and informal loan (Lucas and Stark, 1985; Ilahi and Jafarey, 1999).
Remittances can therefore be higher more with higher education and distance from the
migration destination (Rapoport and Docquier, 2006). Third, remittances can be seen as an
exchange framework. In this case, the family back home receives remittances as payment for
the services it provides in caring for the migrant childrens, physical assets, and other financial
and social interests (Cox, 1987; Cox, Eser and Jimenez, 1998). Another self-interested
motive can be the desire to inherit. A migrant aspiring for a share in inheritance sends
remittances in order to maintain a good relationship with the family (Hoddinott, 1994).
Another strand of the literature approaches remittances from a macroeconomic perspective.
Straubhaar (1986) evaluates the macroeconomic determinants of remittances from Germany
to Turkey and finds that the economic situation in the source country is the main determinant
of remittances, but finds no correlation between exchange rates and interest rates with
remittances. Similarly, Vargas-Silva and Huang (2006) in their study of a number of Latin
American economies conclude that remittances are more responsive to the source country’s
economic conditions than to the economic conditions in the recipient country. Similarly, Al-
Mashat and Billmeier (2012) find that remittances to Egypt react positively to economic
conditions in the source country. Singh et.al, (2011) also finds that source country output and
migrant’s stock are important determinants of remittances to 36 Sub-Saharan African
3 The emigrant’s and the family have contractual agreement to support each other in bad times (Vargas-Silva and
Huang, 2006).
countries for the time period 1990-2005. However, both studies find that remittances are
negatively associated with the recipient’s per capita GDP, consistent with the hypothesis that
remittances play a role as negative shock absorbers. Katseli and Glytsos (1986) argued
instead that remittances are negatively associated with the source country's income, source
country's real interest rate, and the receiving country's inflation rate. El-Sakka and Mcnabb
(1999) focus on the macro-level determinants of remittances in Egypt for the period 1967-
1991 and find that exchange rate and interest rate differentials are important factors in
attracting remittances. Elbadawi and Rocha (1992) argue that the stock of migrant’s in
remittance-source countries have a significant impact on real remittances. Wahba (1991)
points out that the black market premium, relative interest rate between the source and
recipient countries, political stability, stability in government policies, and financial
institutions influence the flow of remittances. Sultonov (2013) used quarterly data over the
period 2003:1-2011:4 for Tajikistan, and emphasized that overall economic conditions in
both source and recipient country are important in influencing remittances.
Recent literature has also highlighted the importance of geographical distance and other
bilateral variables in driving remittances. Empirical evidence in this regard is limited because
of limited data availability concerning bilateral remittances over time. Together with
economic size of the recipient and the source country (measured in GDP), the transaction cost
between the source and the receiving country (sometimes measured in terms of bilateral
geographical distance) is considered a determinant of remittances. For example, Lueth and
Arranz (2008) model remittances for eleven countries in Asia and Europe for the period
1980-2004. They construct a dataset of bilateral remittance flows for a set of 33 developing
countries with remittances to 11 recipient countries: Bangladesh, Croatia, Indonesia,
Kazakhstan, Macedonia, Moldova, Philippines, Serbia and Montenegro, Slovenia, Tajikistan
and Thailand. Many of the explanatory variables that appear frequently in the trade literature
are also used as determinants of remittances, namely the GDP of receiving and source
countries, geographical distance, common language, colonial ties, stock of immigrant’s,
political risk, etc. The estimated results from a gravity model indicate that economic activity
in the source and receiving country and other gravity variables account for more than 50
percent of the variation in remittances. Similarly, Frankel (2011) using the dataset from Lueth
and Arranz (2008) finds that distance is negatively associated with remittances while income
per capita of the source country is positive and highly significant across all specifications.
However, other gravity variables such as common border and common language variables are
not statistically significant.
The opposing nature of the results regarding the significance of geographical distance is
reflected in the study of Schiopu and Siegfried (2006) that employs a panel dataset of
bilateral remittances from 21 European sending countries to 9 European receiving countries
over the period 2000-2005. They find evidence indicating that the decision to remit is driven
more by altruistic reasons rather than for investment motives. Contrary to the evidence in the
abovementioned studies, they find that geographical distance plays no role in driving
remittances. However, the effect is positive if the countries have no common border. In
another empirical study, De Sousa and Duval (2010) examine remittance flows to Romania
originating from various sending countries during the period 2005-2009. The study finds that
both recipient and source countries’ economic size and geographical distance appear to
positively impact bilateral flows. The positive relationship between remittances and distance
was supported by the loan repayment hypothesis: an increase in physical distance between
migrant sending and receiving countries results in an increase in remittances in return for the
high migration cost paid by the family.
A few studies have tried to analyze the remittance motives in the Pakistani context. For
example, Bouhga-Hagbe (2006) argues that altruistic motives proxied by “agriculture GDP”
as a major driver of remittance flows to Egypt, Jordan, Morocco, Pakistan, and Tunisia.
Kock and Sun (2011) suggest that skill level, investment return in both source and recipient
countries, nominal and real exchange rates, and domestic economic conditions are the main
factors explaining remittances to Pakistan.
A discussion of the existing literature shows that though the role of recipient and source
country economic conditions has often been explored and found to be an important
determinant of migrant’s remittances, the role of geographical distance used as a proxy for
transferred cost needs further analysis. To date, few studies have examined the bilateral
macroeconomic determinants of remittances4 and hence this study aims at closing this gap in
the literature.
Data and Methodology
4.1- Data and Variable Description
We collected data on remittances from 23 source countries5 to Pakistan. These countries
account for about 90 percent of remittance flows to Pakistan during the examined period (see
Table 1). The selection of countries depends on the availability of bilateral remittances data.
For factors explaining bilateral flows, we use both country-specific and bilateral variables
taken from different sources. In particular, bilateral remittances in US $ million come from
the State Bank of Pakistan (SBP). The limitation of the reported data is that they most likely
underestimate the volume of remittances sent through informal channels (Hawala or Hundi).
In what follows, we describe the variables that are considered important factors in influencing
remittance flows. The GDP for source country in millions of US dollars comes from
UNCTAD and is the most obvious factor that influences higher remittances to recipient
countries (Vargas and Huang, 2006). In general, improved economic conditions in the source
country allow migrant’s to enhance both their employment and earnings prospects and hence,
send more remittances. The expected sign of the economic activity in the source countries is
expected to be positive, regardless of the motivation of the migrant to remit.
The second explaining factor is the income level (measured in term of GDP) in the recipient
country, which has an ambiguous effect on remittances depending on the prevailing motive to
remit. On the one hand, when the altruistic motivation dominates the remitting behavior,
migrant’s will tend to send more remittances if the earning prospect of the migrant’s recipient
country income decreases, in order to assure the same level of satisfaction. On the other hand,
remittances could decrease with recipient income if the motivation to remit is driven by
portfolio investment.
4 Previous studies have merged different data to obtain bilateral remittances, which allows for more
comprehensive conclusions. However, in the absence of international harmonization, remittances are
documented in a different way in each recipient country (De Sousa and Duval, 2010). In this study, the datasets
used are constructed in a more homogenous way for a single recipient country (i.e. Pakistan), which implies
using a smaller sample, but avoids the drawbacks of previous datasets concerning measurement differences. 5 These source countries include: Australia, Bahrain, Belgium, Canada, Denmark, France, Germany, Greece,
Ireland, Italy, Japan, Kuwait, the Netherlands, Norway, Oman, Qatar, Saudi Arabia, Spain, Sweden,
Switzerland, UAE, the UK, and the US.

The migrant’s stock in the source country is also considered a crucial factor in determining
remittance volume (Freund and Spatafora, 2005). The data of Pakistani migrant’s stock in the
source countries are taken from the Bureau of Immigration and Overseas Employment
(BIOE, 2013) and from the Organisation for Economic Co-operation and Development
(OECD, 2013). For North America, Europe, and the Asia-Pacific region, where labor
receiving countries are located, we use the OECD database for two main reasons. First, the
BIOE dataset only contains legal outflow per year of workers looking for employment, thus
excluding migratory movements for education, family union as well as illegal migrant’s
(Amjad, 2012). Second, it does not track returning workers, which makes it impossible to
accurately estimate the country’s migrant stock. We estimate the stock of migrant’s for
Middle Eastern countries using the BIOE dataset assuming that the returning workers
represent around 4 percent of the total migrant stock. This figure is based on Iqbal and Khan
(1981), who computed the share of returning migrant’s to be 3.4 percent of the Pakistani
migrant’s stock in the Middle East. It is important to note that migration can be both
temporary and permanent and that migrant can be classified according to their skill level into
skilled, semi-skilled or unskilled groups. These distinctions are crucial to understand the
relative importance of the determinants of remittances. It is broadly accepted that temporary
migrant’s send most of their earnings in the form of remittances (Dustmann and Mestres,
2010) because their family cannot join them in the destination country. The impact of
remittances in terms of skills is still inconclusive. On the one hand, Schioupu and Siegfried
(2006) claim that high-skilled migrant’s send more remittances. On the other hand, Faini
(2007) suggest that high-skilled migrant’s send fewer remittances. Docquier et al. (2012)
argue that skilled migrant’s send more remittances in the presence of more restrictive
immigration policies. Unfortunately, in this study, we are unable to use data at a
disaggregated level, both on type and skill level of migration, because the data are not
available for bilateral flows.
Next, we describe physical distance and transaction cost. Geographical distance is measured
as the distance from Islamabad, Pakistan’s capital, to the corresponding capital of the
remittances-sending country. The variable comes from the CEPII database. The geographical
distance variable has been commonly used to proxy the transaction costs of remitting. The
existing evidence concerning the sign and significance of the relationship between
remittances and geographical distance is mixed. Some studies argued that remittances are
negatively related to physical distance, as reported in the trade literature (Lueth and Arranz
2008; Frankel, 2011; Docquier and Rapoport, and Salomone, 2011), while other studies find
a non-significant correlation (Schiopu and Siegfried, 2006). However, taking common
borders into account in the regression leads to a significant and positive relationship as
reported in José de Sousa & Laetitia Duval (2010). We also use estimated transaction costs,
which is expected to have a negative effect on remittance flows from the source country. For
example, when the cost of remitting money via formal channels increases, this should
eventually decrease the level of remittances (Freund and Spatafora, 2005).
The transaction cost variable is estimated by using data from the World Bank Remittances
Prices Worldwide for major sending corridors to Pakistan (See Figure 2). To obtain data for
each destination and time period, we formulate two assumptions. First, we pretend that
transaction cost of sending remittances from the UAE to Pakistan is similar to that of the
neighboring countries Oman, Kuwait and Qatar. Similarly, the remittances cost from the US
is also used for Canada. Moreover, the cost of remittances from Norway to Pakistan has been
used to proxy for the cost from Germany, France, Italy, Sweden, Denmark, Greece and
Switzerland. Secondly, we assume that the cost of remittances is determined by migrant’s
stock in the remittance-source country and financial development in both source and recipient
countries. We use three-year data for the cost of remittances from 2010-2012 to estimate
transaction costs for each source country. The resulting predicted values are used to estimate
the value of remittances for the remaining years from 2001-2009.
The bilateral exchange rate of Pakistani rupees (PKR) in term of foreign currency is also an
important determinant of remittances (Dakila & Claveria, 2007). The bilateral exchange rate
of PKR is obtained from DataStream. The relation between remittances and exchange rate is
a priori ambiguous. Remittances could decrease or increase with recipient country currency
depreciation depending on the motive to remit. If the migrant are driven by altruistic motives,
recipient country currency depreciation will reduce remittances as less source-country
currency is needed to purchase the same basket of goods before depreciation (Leuth and
Ruiz-Arranz, 2008). In the case of appreciation, migrant tend to send more money in foreign
currency to insure the same amount of income in the domestic currency. A counterintuitive
possibility would be that migrant send more remittances in order to keep the same utility
level of their family compared with their own personal utility level.
On the other hand, if migrant choose to invest (partly in the real estate) in the recipient
country, then migrant might send more remittances in order to take advantage of depreciation
(Faini, 1994; Dakila & Claveria, 2007). The increase in remittances through depreciation may
increase remittances in the short run but in the long run, it might undermine the sender’s
confidence in the recipient economy (Bouhga and Hagbe, 2004). Some studies also found no
relation between exchange rate dynamics and remittances (Straubhaar 1986; Higgins, 2004;
Faini, 2006).
With respect to financial sector development for source and recipient countries, we use
domestic credit to the private sector as a percent of GDP for both receiving and sending
countries. The data comes from WDI. Financial development is another important factor that
makes remittances easier and cheaper and hence, stimulates the flows via official channels
(Freund and Spatafora, 2005; Singh et al., 2011).
As a proxy for the rate of return on financial assets, we use interest rate differentials. These
are computed by subtracting the recipient country interest rate from the corresponding
measure of the source country interest rate. In most cases, interest rate refers to a country’s
money market rate. However, for Belgium, France, and Greece, government treasury bills are
used, and in case of the Netherlands, the deposit rate is taken as the country’s interest rate6.
The effect of the interest rate differential (interest rate of recipient country relative to interest
rate of source country) is also ambiguous for two possible reasons. First, a positive interest
rate differential means that migrant’s take advantage of attractive returns on savings in their
country of origin, and at the same time, reduce savings in the source country (Kemegue et.al,
2011). It may also reflect instability in the source economy resulting in higher remittances
sent back home if altruism is the prevailing motive (Elbadawi and Rocha 1992) or lower
remittances if investment motives prevail (Singh, et al., 2011). In both cases, remittances
would increase, but it is difficult to ascertain whether the increase is driven by altruism or
self-interest.
The unemployment rate is taken from DataStream. The lower the unemployment, the higher
the remittances from sending to recipient country will be (Sultonov, 2011).
As a proxy for institutional quality in the recipient country, we use a political stability
indicator from the World Governance Indicators from the World Bank. Political stability may
6 The choice of the interest rate variable is driven by data availability.
encourage remittances, since such an environment favors investment (Singh, et.al 2011). On
the other hand, political instability may also encourage remittances to compensate for the loss
of purchasing power of the family back home. High political instability in the country is one
of the main reasons for the decision to emigrate (Collier et.al, 2011).
It has also been argued that common language and religious ties tend to affect the choice of
destination countries. For instance, larger shares of Pakistani migrant’s reside in the Middle
East and in the countries with similar official language. We expect a positive sign for these
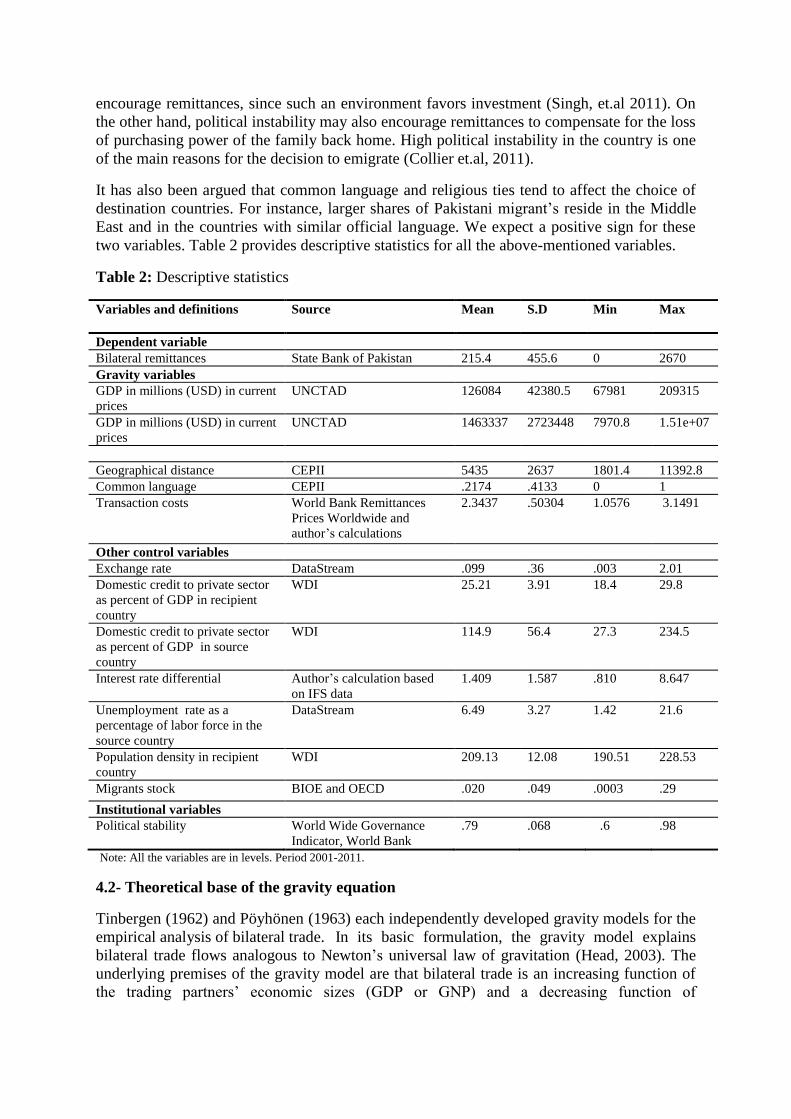
two variables. Table 2 provides descriptive statistics for all the above-mentioned variables.
Table 2: Descriptive statistics
Variables and definitions Source Mean S.D Min Max
Dependent variable
Bilateral remittances State Bank of Pakistan 215.4 455.6 0 2670
Gravity variables
GDP in millions (USD) in current
prices
UNCTAD 126084 42380.5 67981 209315
GDP in millions (USD) in current
prices
UNCTAD 1463337 2723448 7970.8 1.51e+07
Geographical distance CEPII 5435 2637 1801.4 11392.8
Common language CEPII .2174 .4133 0 1
Transaction costs World Bank Remittances
Prices Worldwide and
author’s calculations
2.3437 .50304 1.0576 3.1491
Other control variables
Exchange rate DataStream .099 .36 .003 2.01
Domestic credit to private sector
as percent of GDP in recipient
country
WDI 25.21 3.91 18.4 29.8
Domestic credit to private sector
as percent of GDP in source
country
WDI 114.9 56.4 27.3 234.5
Interest rate differential Author’s calculation based
on IFS data
1.409 1.587 .810 8.647
Unemployment rate as a
percentage of labor force in the
source country
DataStream 6.49 3.27 1.42 21.6
Population density in recipient
country
WDI 209.13 12.08 190.51 228.53
Migrants stock BIOE and OECD .020 .049 .0003 .29
Institutional variables
Political stability
World Wide Governance
Indicator, World Bank
.79 .068 .6 .98
Note: All the variables are in levels. Period 2001-2011.
4.2- Theoretical base of the gravity equation
Tinbergen (1962) and Pöyhönen (1963) each independently developed gravity models for the
empirical analysis of bilateral trade. In its basic formulation, the gravity model explains
bilateral trade flows analogous to Newton’s universal law of gravitation (Head, 2003). The
underlying premises of the gravity model are that bilateral trade is an increasing function of
the trading partners’ economic sizes (GDP or GNP) and a decreasing function of

transportation cost reflecting the distance between the capitals of the trading partner (Frankel
and Rose, 2002).
where is the volume of bilateral trade between the trading partners, represent
the economic size of the trading partners, and is the geographical distance between the
corresponding countries.
The linear form of the equation (1) is as follows,
For evaluation of bilateral international trade, Anderson (1979), Bergstrand (1985, 1989, and
1990), Helpman (1987), Feenstra et al. (2001) and Anderson van Wincoop (2003) have
provided the theoretical justification for the gravity model. The model has been further
extended for the analysis of international capital flows as well as for international migration
(Mayda, 2010; Karemera et al. 2000; Lewer and Berg, 2008) then apply it to explain
remittances (De Sousa, J., Duval, L., 2010; Lueth and Ruiz-Arranz, 2008) and more
extensively, for FDI flows (Hattari and Rajan, 2008; Demekas et al., 2005).
In this study, we employ a parsimonious model which includes commonly-used determinants
while focusing on specific bilateral variables. Similar to the gravity model used in the trade
literature, the starting point of the gravity model of migration is the hypothesis that
immigration is driven by the differences in economic size and impeded by migration costs
(Borjas, 1989, 1991). Lueth and Ruiz-Arranz (2008) argue that bilateral remittances can be
explained to a large extent by the gravity model. Here, we follow the basic gravity type
framework which argues that bilateral remittances are directly proportional to the economic
size of the source and recipient country measure by GDP, and inversely proportional to the
distance between the two countries (Lueth and Ruiz-Arranz, 2008). The greater the distance
between two countries, the higher the cost of remitting, thereby reducing the amount of
remittances to the country.
The gravity model of remittances is given by,
where GDP denotes income in source (s) and recipient (r) country. Pakistan is considered the
“recipient country” and the rest of the 23 source countries are used as “source countries”. Dist
denotes geographical distance between capitals of countries s and r, and Z represents a
number of control variables.
By taking natural logs of equation (3), we adopt a similar empirical specification as in Lueth
and Arranz (2008) and De Sousa and Duval (2011). The linearized gravity model of
remittance flows from source (s) to recipient country (r) is expressed as,
In our baseline specification, bilateral remittances (in natural logarithms) between the source
country s and the recipient country r at time t (REMsrt) are related to GDPs in the source and
recipient countries, geographical distance, migrant’s stock, and bilateral exchange rate.
comprises funds classified as workers’ remittances, compensation of employees, and
migrant transfers.
The explanatory variables and stand for the nominal gross domestic products
for the source country (s) and recipient country (r) in period t, and is the physical
distance between the capitals of the recipient and the source country. is the
bilateral exchange rate denominated in home country currency. denotes the
stock of migrant’s from r that live in country s at time t.
denotes the country specific effect in order to control for unobservable heterogeneity. The
last term denotes the error term that is assumed to be well-behaved.
The baseline model is augmented with additional source and recipient-country characteristics
that influence remittances.
In the first extension of the model, the other controls are introduced as additional regressors
Zsrt referring to the vector of all control variables that relate to both countries, and either the
source or recipient country. This includes unemployment rate in s; domestic credit to private
sector (as a percent of GDP) in country s and r, and interest rate differential between s and r.
Similarly, the political stability in country r is included to measure political uncertainty
prevailing in the recipient country. Moreover, proxies for common official language and
common religion are also included in the model in order to measure the cultural similarity
between s and r.
In the next specification, the log of transaction costs is introduced instead of physical
distance, in order to estimate the impact of the cost on remittances to the recipient country.
is the transaction cost of sending remittances from the source country to the
recipient country. Since most variables are in natural logs (except dummy variables), the
estimated coefficients can be interpret as elasticities.
4- Estimation methods
A variety of empirical techniques are employed in the study. The model is first estimated
using a pooled OLS as a benchmark with standard errors corrected for heteroskedasticity.
However, the pooled OLS is only consistent when unobserved fixed effect and explanatory
variables are uncorrelated (Wooldridge, 2002). In the presence of correlation between the
individual effects and the error term, a pooled OLS suffers from unobserved heterogeneity
bias (Hsiao, 2003). In order to take into account the presence of unobserved heterogeneity,
we use a panel data approach i.e. fixed and random effects rather than pooled OLS. A fixed-

effects model can be estimated by including dummy variables for each cross-sectional unit
(minus one) to deal with unobserved heterogeneity (Wooldridge, 2002; Baltagi 2005). One
drawback of using this estimator is that it eliminates all time-invariant variables present in the
model. On the other hand, the random-effects model includes the individual effect in the
error term (Wooldridge, 2002; Baltagi 2005). Restricted F-statistics, Breuch and Pagan
(1980) LM and Hausman (1978) specification tests are used in order to choose between
pooled OLS vs fixed effects, pooled OLS vs random effects, and fixed vs random effects
models.
First, to test whether pooled OLS or fixed effect is the appropriate model, we use the
restricted F test. If the null hypothesis of common intercept is rejected, we can proceed with
fixed effects. Second, the Breuch Pagan (1980) LM test checks whether pooled OLS or
random effects is the appropriate model (Christopher, 2006 p229). The null hypothesis under
this test is that the variance of the time invariant part of the error term is zero. Hence, if we
reject null hypothesis, then we can proceed with the random effects model. Finally, the null
hypothesis under the Hausman test checks whether the random effects model is consistent
using the null hypothesis that the unobserved heterogeneity is uncorrelated with the
regressors (Greene, 2012, p. 421). If the null hypothesis is rejected (with a probability lower
than 10%) then only the fixed-effect model is considered unbiased and consistent. When the
Hausman test indicates that the individual fixed effects are correlated with the regressors,
then both OLS and random effects yield biased results.
The fixed effect estimator, however, does not provide the coefficient of time invariant
variables. One solution for this is to use the Mundlak approach (Mundlak, 1978) who
proposed approximating the country specific effects as a function of the mean of time-variant
variables. This is an alternative procedure to the fixed effects model, which include averages
of time-varying explanatory variables (Wooldridge, 2002), instead of using dummy variables
or the within transformation. Baltagi et al. (2003) suggests using another alternative
procedure, based on Hausman and Taylor (1981) when some of the regressors are
endogenous. This Hausman-Taylor approach uses the means of the exogenous time-variant
variables as instruments for the endogenous variables (Christopher, 2006, p.229). Also, to
overcome the reverse causality or endogeneity issue, we used a classical instrumental
variable method (IV) that uses external and internal instruments.
Finally, in order to check for the quality of our estimations, we carry out several post
estimation tests. For collinearity between the explanatory variables, we look for simple
bivariate correlation between the explanatory variables. The variables which are highly
interdependent are dropped from the regression. For autocorrelation, the Wooldridge test has
been conducted under the null hypothesis that there is no first order autocorrelation against
the alternative hypothesis of the presence of autocorrelation. The Breusch-Pagan test has
been used to test for heteroskedasticity. The null hypothesis states that the residual variance is
constant over time against the alternative hypothesis of the presence of heteroskedasticity. All
standard errors are robust in the estimated specifications of the gravity model.
5.1- Empirical Findings
In this section, we discuss our main empirical results. The benchmark estimates presented in
Table 3 provide results for the baseline model using several estimation methods. The first
column provides OLS results, the second column provides fixed effects estimates, the third
column presents random effects estimates, the fourth column presents Mundlak estimates, the
fifth column presents Hausman and Taylor estimates, and finally, the instrumental variables

fixed-effect estimates are presented in the last column. The panel data estimations take into
account unobservable heterogeneity with the country’s specific fixed effects7. To choose
between fixed and random effects, the Hausman test has been used, which indicates that the
country fixed effects are correlated with the regressors, and therefore, both OLS and random
effects yield biased results. The results are presented in the bottom of estimation tables.
However, one problem in the fixed effects estimator is that it does not provide the coefficient
of time invariant variables used in this study. As a result, we use Mundlak (1978) and
Hausman-Taylor (1981) techniques in order to take care of the time invariant aspects of the
selected model. Similarly, the model may suffer from endogeneity due to possible reverse
causality between remittances and migrant’s stock8, which may render the estimates
inconsistent. Therefore, to deal with the problem, we use a fixed effects two-stage least
squares estimator (FE 2SLS). This approach requires selecting instruments that are correlated
to migrant’s stock but uncorrelated with the error term. We use three instruments: The first
and second lags of migrant stock (as a proxy for past migration or migrant network) in the
destination country (Woodruff and Zenteno, 2001; Mckenzie, 2005) and population density
in the recipient country (Javorcik, et.al, 2011)9. It is expected that all three variables
positively influence the stock of migrant in the labor-receiving countries by keeping all other
variables unchanged. We check for the validity of these instruments by using a Hansen-J
statistics presented in the bottom of the estimation tables.
In the first specification, the log of remittances is regressed on GDPs of source and recipient
countries, geographical distance, bilateral exchange rate, and migrant’s stock. Concerning the
effect of remittances on economic activity in the recipient country, we find that the GDP of
the receiving country has a positive and statistically significant effect on remittances to the
country regardless of the choice of methods (Columns 1-6 in Table 3). This reflects that
Pakistani migrant’s send more remittances when the economic conditions back home
improve, which in principle contradict the altruistic motive. This result is consistent with
earlier studies Kock and Sun (2011), Lueth and Arranz (2008), and Docquier (2011).
However, remittance flows to Pakistan do not seem to respond to the source country’s
economic conditions. This is in contrast to the findings of Straubhaar (1986), Schiopu and
Siegfried, (2006), Vargas-Silva and Huang (2006) and Kemegue et al, (2011) who argue that
remittances are more responsive to the host country’s economic conditions than to the
economic conditions of the recipient country. The results can be explained by considering the
extent of the migrant integration into the formal sector of the source economy. Similarly, this
could also be explained by the loan repayment hypothesis stating that remittances are fixed
loan payments made by the emigrant’s to the households (Vargas-Silva and Huang, 2006). It
may be for these reasons that the recent economic crunch has not adversely affect remittance
flows to the country.
The geographical distance that is used as a proxy for transaction cost is not statistically
significant in any of the estimated models in Table 3. The mixed results in the previous
findings for geographical distance indicate that distance is not an important driver of
remittance flows to Pakistan. The estimated results corroborate the graphical illustration in
Figure 2 indicating that the cost of transferring money to Pakistan is unrelated with
geographical distance. Another possible interpretation of why distance is a poor proxy for
remittance costs is that the cost of sending money from a developed to a developing country
7 However, the time effects for common shocks have not been used in order to identify the effect of variables specific to
Pakistan 8 The number of migrant’s in the destination countries affects the size of remittances. The desire to remit also influences the
migration level (Niimi and Ozden , 2006). For instance, migrant’s stock in the remittance-sending countries are likely to be
associated with the error term. 9 Population density has been the important push factor that stimulates emigration (Javorcik., et.al , 2011).

is significantly larger than the cost of remitting in the opposite direction, whereas distance is
the same. Evidence shows that remittance cost is high in the same bilateral corridor
depending on the direction of the flow (Ratha and Shaw, 2007). As a result, the cost of
remitting money is more related to financial sector development rather than geographical
distance.
In regards to the effects of migrant’s stock on remittances, our results suggest that
remittances depend positively and significantly on migrant’s stock (even after controlling for
endogeneity) in the destination countries. This means that countries with an increasing size of
migrant’s stock attract higher volume of remittances (Freund and Spatafora, 2005). The
results are robust and consistent with our expectations based on the literature. In Table 3
(Col. 5), the over identification test p-values (for the Hansen J-statistic) exceed 5 percent,
therefore, we cannot reject the null hypothesis that our instruments are valid. Concerning the
exchange rate variable, our findings are in line with those of Singh et Al. (2011), which also
find that remittances are not responsive to bilateral exchange rates.
Table 3: Baseline panel gravity model estimates
Pooled
OLS
Fixed
Effects
Random
Effects
Mundlak
Approach
Hausman
and Taylor
Approach
Fixed Effect
(IV)
GDP (source) 0.00014
(0.080)
0.264
(0.308)
0.027
(0.233)
0.255
(0.314)
0.262
(0.220)
0.219
(0.252)
GDP (recipient) 1.847***
(0.230)
1.149***
(0.341)
1.589***
(0.303)
1.204***
(0.349)
1.145***
(0.264)
1.267***
(0.412)
Migrant’s stock 0.919***
(0.084)
1.658***
(0.420)
1.263***
(0.220)
1.660***
(0.428)
1.656***
(0.190)
1.627*
(0.915)
Bilateral
exchange rate
0.075*
(0.045)
-0.049
(0.255)
-0.030
(0.109)
0.044
(0.258)
-0.062
(0.188)
0.010
(0.265)
Geographical
distance
-0.516
(0.481)
0.455
(1.007)
-0.547
(1.383)
0.830
(1.153)
Common official
language
1.311***
(0.411)
0.422
(0.678)
1.294
(1.104)
-0.265
(1.088)
Number of
observation
249 249 249 249 249 241
R-squared 0.775 0.719 0.7538 0.7775 0.706
Hausman test
Fixed Vs
Random effects
Prob>chi2
0.0281
Hansen J stat. P-val.
0.0742
Note: *** p<0.01, ** p<0.05, * p<0.1. Robust standard errors in parenthesis. All the variables except dummies are in natural logs. The
endogenous variables in the Hausman and Taylor approach are GDP (source country), GDP (recipient country) and migrant’s stock.
Now, we turn to the extended estimated model that includes other important control variables
that are likely to have an impact on remittance flows, namely, unemployment rate for the
source country, domestic credit to private sector as percent of GDP for source and receiving
countries, political stability for the receiving country, and relative interest rate between
receiving and source countries. The results for the augmented model are presented in Table
410
. The inclusion of all the other control variables does not alter the magnitude and
significance of most of the baseline covariates.
10
The correlation matrix (see Table 1 in the Appendix) of the variables indicate that there is a high positive correlation
between the unemployment rate of the recipient country and its GDP. Also, common religion and geographical distance are
highly correlated. We dropped unemployment rate and common religion as this might affect the direction and significance of
the effect of other variables on the dependent variable.
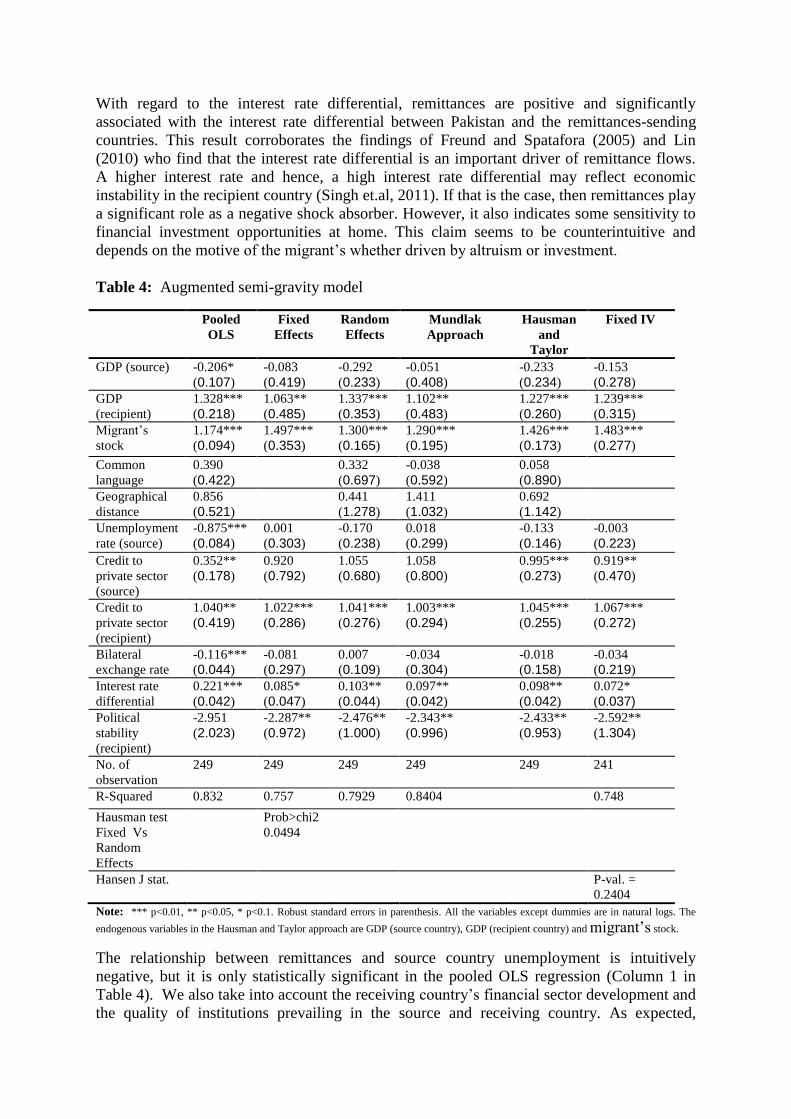
With regard to the interest rate differential, remittances are positive and significantly
associated with the interest rate differential between Pakistan and the remittances-sending
countries. This result corroborates the findings of Freund and Spatafora (2005) and Lin
(2010) who find that the interest rate differential is an important driver of remittance flows.
A higher interest rate and hence, a high interest rate differential may reflect economic
instability in the recipient country (Singh et.al, 2011). If that is the case, then remittances play
a significant role as a negative shock absorber. However, it also indicates some sensitivity to
financial investment opportunities at home. This claim seems to be counterintuitive and
depends on the motive of the migrant’s whether driven by altruism or investment.
Table 4: Augmented semi-gravity model
Pooled
OLS
Fixed
Effects
Random
Effects
Mundlak
Approach
Hausman
and
Taylor
Fixed IV
GDP (source) -0.206*
(0.107)
-0.083
(0.419)
-0.292
(0.233)
-0.051
(0.408)
-0.233
(0.234)
-0.153
(0.278)
GDP
(recipient)
1.328***
(0.218)
1.063**
(0.485)
1.337***
(0.353)
1.102**
(0.483)
1.227***
(0.260)
1.239***
(0.315)
Migrant’s
stock
1.174***
(0.094)
1.497***
(0.353)
1.300***
(0.165)
1.290***
(0.195)
1.426***
(0.173)
1.483***
(0.277)
Common
language
0.390
(0.422)
0.332
(0.697)
-0.038
(0.592)
0.058
(0.890)
Geographical
distance
0.856
(0.521)
0.441
(1.278)
1.411
(1.032)
0.692
(1.142)
Unemployment
rate (source)
-0.875***
(0.084)
0.001
(0.303)
-0.170
(0.238)
0.018
(0.299)
-0.133
(0.146)
-0.003
(0.223)
Credit to
private sector
(source)
0.352**
(0.178)
0.920
(0.792)
1.055
(0.680)
1.058
(0.800)
0.995***
(0.273)
0.919**
(0.470)
Credit to
private sector
(recipient)
1.040**
(0.419)
1.022***
(0.286)
1.041***
(0.276)
1.003***
(0.294)
1.045***
(0.255)
1.067***
(0.272)
Bilateral
exchange rate
-0.116***
(0.044)
-0.081
(0.297)
0.007
(0.109)
-0.034
(0.304)
-0.018
(0.158)
-0.034
(0.219)
Interest rate
differential
0.221***
(0.042)
0.085*
(0.047)
0.103**
(0.044)
0.097**
(0.042)
0.098**
(0.042)
0.072*
(0.037)
Political
stability
(recipient)
-2.951
(2.023)
-2.287**
(0.972)
-2.476**
(1.000)
-2.343**
(0.996)
-2.433**
(0.953)
-2.592**
(1.304)
No. of
observation
249 249 249 249 249 241
R-Squared 0.832 0.757 0.7929 0.8404 0.748
Hausman test
Fixed Vs
Random
Effects
Prob>chi2
0.0494
Hansen J stat. P-val. =
0.2404
Note: *** p<0.01, ** p<0.05, * p<0.1. Robust standard errors in parenthesis. All the variables except dummies are in natural logs. The
endogenous variables in the Hausman and Taylor approach are GDP (source country), GDP (recipient country) and migrant’s stock.
The relationship between remittances and source country unemployment is intuitively
negative, but it is only statistically significant in the pooled OLS regression (Column 1 in
Table 4). We also take into account the receiving country’s financial sector development and
the quality of institutions prevailing in the source and receiving country. As expected,

remittances are positively and significantly related to financial sector development11
. The
findings show that better financial development in the source and receiving countries are
translated into higher remittance flows. The financial improvement in the recipient country
would enhance the availability of low cost remittance services that could then direct large
amount of remittances through official channels (Freund and Spatafora, 2008; and Wahba,
1991). Thus, countries with well-developed financial markets have more opportunities to
attract remittances through formal channels and thereby, are more likely to channel it into
more productive uses.
The coefficient of the political stability variable representing institutional quality in the
recipient country is negative and significant, suggesting that unstable political environment
(associated with lower growth) may encourage larger amounts of remittances. This result
supports the notion of altruistic behavior of the migrant that encourages sending more
remittances in caring for the families in the home country12
. Remittances could also increase
by higher outflow of emigrant’s to other economically well-off destinations due to political
turmoil at home. This stabilization role of remittances to compensate for the loss of
purchasing power due to political instability indicates that remittances are used to hedge
against political turmoil.
Table 5: Remittances explained with transaction cost
Pooled
OLS
Fixed
Effects
Random
Effects
Mundlak
Approach
Hausman
and Taylor
Approach
GDP (source) 0.195***
(0.072)
0.331
(0.385)
-0.029
(0.201)
0.332
(0.385)
-0.021
(0.231)
GDP (recipient) 2.036***
(0.310)
2.010***
(0.594)
2.370***
(0.405)
1.995***
(0.589)
2.345***
(0.262)
Transaction cost -3.533***
(0.179)
-0.202
(0.467)
-1.525***
(0.306)
-0.227
(0.470)
-0.855**
(0.379)
Common language 1.774***
(0.250)
1.563*
(0.905)
1.703***
(0.653)
1.360
(1.098)
Bilateral exchange rate -0.096*
(0.058)
0.147*
(0.085)
0.112
(0.091)
0.150*
(0.085)
0.124
(0.112)
Interest rate differential 0.246***
(0.054)
0.064
(0.071)
0.112*
(0.062)
0.072
(0.066)
0.083*
(0.050)
Political stability (recipient) -0.769
(2.905)
-2.078*
(1.140)
-1.705
(1.081)
-2.093*
(1.154)
-1.916
(1.172)
No. of observation 252 252 252 252 252
R-squared 0.670 0.632 0.6156 0.6317
Hausman test P-val.
0.000
Note: *** p<0.01, ** p<0.05, * p<0.1. Robust standard errors in parenthesis. All the variables except dummies are in natural logs. The
endogenous variables in the Hausman and Taylor approach are GDP (Source) and GDP (Recipient)
Finally, Table 5 reports the estimates of equation (4). In the context of this specification, we
include the transaction cost variable instead of geographical distance. Financial development
11
However, in some of the estimated models, the variable financial sector development in the source countries
has a positive sign. 12
In unpredictable political situations, the cost of capital would increase and consequently, investors will look
for more stable investment destinations. Therefore, political instability deters economic growth (Aisen and
Veiga, 2013).
and migrant’s stock are dropped due to high collinearity with the transaction cost variable. As
expected, we found a negative coefficient for transaction cost, indicating that higher transfer
costs deter transfer of money back home. However, the coefficient is not always significant
when using different estimation techniques. In light of these findings, remittances could be
encouraged via official channels to reduce the transfer cost of remittances by devising
policies that improve competition in the financial sector in the migrant’s recipient and source
countries.
5- Concluding Remarks
International migration from Pakistan has not only accelerated the country’s integration into
the global economy, but has also led to a substantial amount of remittance flows to the
country. As a result, remittances have tremendous potential to promote economic
development of a country experiencing sluggish growth.
In this study, we examined the relative importance of the determinants that drive the volume
of remittance flows to Pakistan. With this aim, we estimate a gravity model of remittances
using bilateral remittances data for 23 major remittance-sending countries during the period
2001-2011 and present the results obtained applying a variety of panel data estimation
techniques to tackle several econometric issues. According to our findings, remittances
respond to home economic performance, but no significant effect of host economy output
could be identified. The positive coefficient of the recipient country output supports the
investment-oriented behaviour of the migrant’s. On the other hand, the negative coefficient
of the political stability seems to support the altruistic motive in shielding the recipient
economy in time of political or economic uncertainty. Finally, interest rate differentials
positively affect remittances indicating that migrant’s take advantage of attractive returns on
financial investment in the recipient country. However, it may also reflect economic
instability and hence, result in increased remittances back home if driven by altruistic
motives. In both scenarios, remittance volumes increase.
From these findings, it is hard to disentangle which of the two motives for remitting prevails.
This finding is consistent with the earlier literature in which remittances are often seen to be
driven by a combination of motives. The motives of migrant’s crucially depend on whether
migrant stays abroad are temporary or permanent. Pakistani migrant’s who are permanently
settled in the OECD countries along with their immediate families tend to remit less than
migrant’s in the Persian Gulf working on a temporary work visa. The latter may not only
remit more in order to build their financial nest eggs back home, but also because they
maintain stronger ties with the home country.
Our findings also suggest that migrant’s stock and financial sector development strongly
influence the size of remittance flows to Pakistan, with remittances rising as a result of
gradually increasing migrant’s stock and improvement in the financial sector, respectively.
Similarly, another important finding refers to the geographical distance between the recipient
and the source countries. Geographical distance is not statistically significant in any of the
estimated models. This indicates that geographical distance is not a good proxy for the cost of
remitting. The latter can be better understood in terms of migrant networks and improvements
in recipient and source country financial services. While the effect of transaction cost is
found to be negative, its significance was not strongly supported in our analysis.
Based on the findings in this study, we conclude that remittances to Pakistan react
predominantly to the macroeconomic factors of the receiving-end rather than the sending

countries. This suggests that remittance flows are not highly vulnerable to the vagueries of
the macroeconomic fluctuations taking place overseas, or the economic crises in the host
economies generating job losses.
These empirical findings recommend policy to focus on the transaction cost of sending
money. Transaction costs can be lowered by increasing access to financial services in the
remote areas through innovations such as mobile banking. The improved financial
development will redirect these flows from informal to formal channels in the medium term
that will eventually lead to higher remittances. Finally, to ensure economic stability, the
government should not rely solely on remittances, but should carry out domestic structural
reform to improve the economic climate of the country, and reduce the need for international
migration.

References
Adams Jr, R. H. (2009). The determinants of international remittances in developing
countries. World Development, 37(1), 93-103.
Addleton, J.S. (1992). Undermining the centre: The Gulf migration and Pakistan. Oxford
University Press
Agarwal, R., & Horowitz, A. W. (2002). Are international remittances altruism or insurance?
Evidence from Guyana using multiple-migrant households. World Development, 30(11),
2033-2044.
Ahmed, J and Zarzoso, I.M (2013). Blessing or Curse: The stabilizing role of remittances,
foreign aid and FDI to Pakistan. May 2013, discussion papers, Center for European
Governance and Economic Development Research, No. 153
Aisen, A., & Veiga, F. J. (2013). How does political instability affect economic growth?
European Journal of Political Economy, 29, 151-167.
Al-Mashat, R., & Billmeier, A. (2012). Push or pull? The determinants of remittances to
Egypt, Review of Middle East Economics and Finance, Vol. 8, No. 2
Anwar, A. I., & Mughal, M. Y. (2012). Motives to remit: Some microeconomic evidence
from Pakistan. Economics Bulletin, 32(1), 574-585.
Anderson, J. E. (1979). A theoretical foundation for the gravity equation. American economic
review, 69(1), 106-116.
Anderson, James E., and Eric van Wincoop. (2003). Gravity with gravitas: A solution to the
border puzzle. American Economic Review, 93(1): 170-192.
Andreoni, J. (1989). Giving with impure altruism: Applications to charity and Ricardian
equivalence. The Journal of Political Economy, 97(6), 1447.
Amjad, R., Arif, G. M., & Irfan, M. (2012). Preliminary study: Explaining the ten-fold
increase in remittances to Pakistan 2001-2012. Working papers & research reports, 2012.
Arif, G. M. (2009). Economic and social impacts of remittances on households: The case of
Pakistani migrants working in Saudi Arabia. Pakistan Institute of Development Economics.
Azam, F. 1991. “Labor migration from Pakistan: Trends, impacts and implications. Regional
Development Dialogue 12(3): 53-71.
Baltagi, B. H., Bresson, G., & Pirotte, A. (2003). Fixed effects, random effects or Hausman–
Taylor?: A pretest estimator. Economics letters, 79(3), 361-369
Baum, C. F. (2006). An introduction to modern econometrics using Stata. Stata Press.
Bergstrand, J. H. (1985). The gravity equation in international trade: some microeconomic
foundations and empirical evidence. The review of economics and statistics, 474-481.
Bergstrand, J. H. (1989). The generalized gravity equation, monopolistic competition, and the
factor-proportions theory in international trade. Review of Economics and statistics, 71(1),
143-153.
Borjas, G. J. (1991). Immigration and self-selection. In Immigration, trade and the labor
market (pp. 29-76). University of Chicago Press.
Bouhga-Hagbe, J. (2006). Altruism and workers’ remittances: Evidence from selected
countries in the Middle East and central Asia (No. 06/130). International Monetary Fund.
Bureau of Emigration and Overseas Employment (BE&OE), Labor and manpower division,
Government of Pakistan
Collier, W., Piracha, M., & Randazzo, T. (2011). Remittances and return migration (No.
6091). Discussion Paper series, IZA
Cox, D. (1987). Motives for private income transfers. Journal of political economy, 95(3),
508-46.
Cox, D., Eser, Z., & Jimenez, E. (1998). Motives for private transfers over the life cycle: An
analytical framework and evidence for Peru. Journal of Development Economics, 55(1), 57-
80.
Dustmann, C., Metres J. (2010). Remittances and temporary migration. Journal of
Development Economics 92, 62-70
Dakila, F., & Claveria, R. (2007). Identifying the determinants of overseas Filipinos’
remittances: Which exchange rate measure is most relevant? Center for Monetary and
Financial Policy. BSP Working Paper Series, (2007-02).
De Sousa, J., & Duval, L. (2010). Geographic distance and remittances in Romania: Out of
sight, out of mind? International Economics, 121, 81-97.
Demekas, D. G., Horváth, B., Ribakova, E., & Wu, Y. (2005). Foreign direct investment in
Southeastern Europe: how (and how much) can policies help? IMF Working Paper 05/110.
Docquier, F., Rapoport, H., & Salomone, S. (2012). Remittances, migrant’s education and
immigration policy: Theory and evidence from bilateral data. Regional Science and Urban
Economics, 42(5), 817-828.
Elbadawi, I., & Rocha, R. R. (1992). Determinants of expatriate workers' remittances in
North Africa and Europe (No. 1038). Country Economics Department, World Bank.
El-Sakka, M. I., & McNabb, R. (1999). The macroeconomic determinants of emigrant
remittances. World Development, 27(8), 1493-1502.
Faini, R. (1994). Workers’ remittances and the real exchange rate. Journal of Population
Economics, 7(2), 235-245.
Faini, R. (2007). Remittances and the Brain Drain: Do more skilled migrants remit more?
The World Bank Economic Review, 21(2), 177-191.
Frankel, J., & Rose, A. (2002). An estimate of the effect of common currencies on trade and
income. The Quarterly Journal of Economics, 117(2), 437-466.
Frankel, J. (2011). Are bilateral remittances countercyclical? Open Economies Review,
22(1), 1-16.
Feenstra, R. C., Markusen, J. R., & Rose, A. K. (2001). Using the gravity equation to
differentiate among alternative theories of trade. Canadian Journal of Economics/Revue
canadienne d'économique, 34(2), 430-447.
Freund, C., & Spatafora, N. (2008). Remittances, transaction costs, and informality. Journal
of Development Economics, 86(2), 356-366.
Funkhouser, E. (1995). Remittances from international migration: A comparison of El
Salvador and Nicaragua. The review of economics and statistics, 137-146.
Gazdar. H (2003). A review of migration issues in Pakistan. Paper presented at the regional
conference on migration, development and pro-poor policy choices in Asia. Dhaka
Gibson, J., McKenzie, D., & Rohorua, H. (2006). How cost elastic are remittances? Estimates
from Tongan migrant’s in New Zealand. University of Waikato, Department of Economics.
Greene, William H. Econometric analysis. Prentice Hall; 7 edition (February 13, 2011)
Government of Pakistan (2013) Economic survey of Pakistan, Ministry of Finance, Pakistan.
Gubert, F. (2002). Do migrant’s insure those who stay behind? Evidence from the Kayes area
(Western Mali). Oxford Development Studies, 30(3), 267-287.
Glytsos, N., & Katseli, L. T. (1986). Theoretical and empirical determinants of international
labour mobility: A Greek-German Perspective (No. 148). CEPR Discussion Papers.
Hagen-Zanker, J., & Siegel, M. (2007). The determinants of remittances: A review of the
literature. Working Paper, Maastricht University
Hattari, R., & Rajan, R. S. (2008). Sources of FDI flows to developing Asia: The roles of
distance and time zones (No. 117). ADBI working paper series.
Head, K. (2003). Gravity for beginners. University of British Columbia, 2053.
Helpman, E. (1987). Imperfect competition and international trade: Evidence from fourteen
industrial countries. Journal of the Japanese and international economies, 1(1), 62-81.
Hernandez-Coss, R. (2006). The impact of remittances: observations in remitting and
receiving countries.
Hsiao, C. (2003). Analysis of panel data (Vol. 34). Cambridge university press.
Hoddinott, J. (1994). A model of migration and remittances applied to Western Kenya.
Oxford Economic Papers, 459-476.
Ilahi, N., & Jafarey, S. (1999). Guestworker migration, remittances and the extended family:
evidence from Pakistan. Journal of Development Economics, 58(2), 485-512.
Iqbal, M., & Khan, M. F. (1981). Economic implications of the return flow of immigrants
from the Middle East: a preliminary study. PIDE, Research Reports No. 132.
Javorcik, B. S., Özden, Ç., Spatareanu, M., & Neagu, C. (2011). Migrant networks and
foreign direct investment. Journal of Development Economics, 94(2), 231-241.
Johnson, E. and Whitelaw, E. (1974) Urban–rural income transfers in rural Kenya: An
estimated remittance functions” Economic Development and Cultural Change 22, 473–479.
Karemera, D., Oguledo, V. I., & Davis, B. (2000). A gravity model analysis of international
migration to North America. Applied Economics, 32(13), 1745-1755.
Katseli, L. T., & Glytsos, N. P. (1986). Theoretical and empirical determinants of
international labour mobility: A Greek-German perspective (No. 148). Centre for Economic
Policy Research.
Kemegue, F., Owusu-Sekyere, E., & van Eyden, R. (2011). What drives remittance inflows to
Sub-Saharan Africa? A dynamic panel approach. Unpublished manuscript.
Kock, U., & Sun, Y. (2011). Remittances in Pakistan: Why have they gone up, and why aren't
they coming down? International Monetary Fund.
Lambert, S. (1994): La migration comme instrument de diversification intrafamiliale des
risques. Application au cas de la Cote d’Ivoire, Revue d’Economie du Développement, 0, 2:
3-38.
Lewer, J. J., & Van den Berg, H. (2008). A gravity model of immigration. Economics letters,
99(1), 164-167.
Lin, H. (2011). Determinants of remittances: Evidence from Tonga. IMF Working Papers, 1-
17.
Lucas, R. E., & Stark, O. (1985). Motivations to remit: Evidence from Botswana. The Journal
of Political Economy, 93(5), 901.
Lueth, E., & Ruiz-Arranz, M. (2008). Determinants of bilateral remittance flows. The BE
Journal of Macroeconomics, 8(1).
Mayda, A. M. (2010). International migration: A panel data analysis of the determinants of
bilateral flows. Journal of Population Economics, 23(4), 1249-1274.
McKenzie, D., & Sasin, M. J. (2007). Migration, remittances, poverty, and human capital:
conceptual and empirical challenges (No. 4272). The World Bank.
McKenzie, D. (2005). Beyond remittances: the effects of migration on Mexican households.
International migration, remittances and the brain drain, McMillan and Palgrave, 123-47.
Makhlouf, F., & Mughal, M. Y. (2011). Volatility of remittances to Pakistan: What do the
data tell?. Economics Bulletin, 31(1), 605-612.
Ministry of Finance, Government of Pakistan (2013). Pakistan Economic survey 2012-13.
Government of Pakistan, Islamabad.
Mundlak, Y. (1978). On the pooling of time series and cross section data. Econometrica,
46(1), 69-85.
Mughal, M. Y. (2013). Remittances as development strategy: stepping stones or slippery
slope?. Journal of International Development, 25(4), 583-595.
Mughal, M.Y. and Ahmed, J. (2013). Remittances and business Cycles: Comparison of South
Asian countries", Working Papers 2012-2013_4, CATT - UPPA - Université de Pau et des
Pays de l'Adour.
Niimi, Y., & Ozden, C. (2006). Migration and remittances: causes and linkages (No. 4087).
The World Bank.
Nishat, M. and Bilgrami, N. (1993). The determinants of workers’ remittances in Pakistan,
The Pakistan Development Review 32(4), 1235-1245.
Oda, H. (2009). Pakistani migration to the United States: An economic perspective, IDE
Discussion Paper No. 196 March, Institute of Developing Economies, Japan.
OECD (2013). International migration database. OECD Publishing
Osili, U. O. (2004). migrant’s and housing investments: theory and evidence from Nigeria.
Economic Development and Cultural Change, 52(4), 821-849.
Özden, Ç., & Schiff, M. W. (Eds.). (2006). International migration, remittances, and the brain
drain. World Bank Publications.
Ozden, C. (2006). Remittance flows in Latin America and the Caribbean: Patterns and
determinants. Mimeo, Washington, DC: World Bank.
Peridy, N. J. (2006). Welfare magnets, border effects or policy regulations: What
determinants drive migration flows into the EU?. Global Economy Journal, 6 (4).
Pasha, A., and Altaf, A. (1987). Return migration in a life-cycle setting—an exploratory
study of Pakistani migrant in Saudi Arabia, Pakistan Journal of Applied Economics 6 (1),
1-21.
PILDAT (2008). Overseas Pakistanis workers: Significance and issues of migration, Briefing
paper No. 34, Pakistan Institute of Legislative Development and Transparency.
Pöyhönen, P. (1963). A tentative model for the volume of trade between countries.
Weltwirtschaftliches Archiv, 93-100.
Rapoport, H., & Docquier, F. (2006). The economics of migrants’ remittances. Handbook of
the economics of giving, altruism and reciprocity, 2, 1135-1198.
Schiopu, I., & Siegfried, N. (2006). Determinants of workers’ remittances: Evidence from the
European neighbouring region (No. 688). European Central Bank.

Singh, R. J., Haacker, M., Lee, K. W., & Le Goff, M. (2011). Determinants and
macroeconomic impact of remittances in Sub-Saharan Africa. Journal of African Economies,
20(2), 312-340.
Sultonov, M. (2013). The macroeconomic determinants of remittance flows from Russia to
Tajikistan. Transition Studies Review, 19(4), 417-430.
Stark, O. (1991) The migration of labor, Oxford and Cambridge, MA: Basil Blackwell.
Stark, O., & Taylor, J. E. (1991). Migration incentives, migration types: The role of relative
deprivation. The Economic Journal, 1163-1178.
Straubhaar, T. (1986). The determinants of workers’ remittances: The case of Turkey.
Weltwirtschaftliches Archiv, 122(4), 728-740.
Swamy, G. (1981). International migrant workers’ remittances: issues and prospects. World
Bank, Staff Working Paper, No. 481.
State Bank of Pakistan (2012), Country-wise workers’ remittances
http://www.sbp.org.pk/stats/survey/index.asp
Tinbergen, J. (1962). Shaping the world economy; suggestions for an international economic
policy. New York: Twentieth Century Fund.
Vargas-Silva, C., & Huang, P. (2006). Macroeconomic determinants of workers' remittances:
Host versus home country's economic conditions. Journal of International Trade & Economic
Development, 15(1), 81-99.
United Nations, Department of Economic and Social Affairs (2013). Trends in international
migrants stock.
UNCTAD (2013). UNCTADstat. New York: United Nations.
Wahba, S. (1991). What determines workers' remittances? Finance and Development28 (4),
41–44
Wooldridge, J. M. (2002). Econometric analysis of cross section and panel data. MIT press.
Woodruff, C., & Zenteno, R. (2001). Remittances and microenterprises in Mexico. UCSD,
Graduate School of International Relations and Pacific Studies Working Paper.
WDI (2013). World Development Indicators. Online Database, World Bank.
World Bank. (2013a). Remittance prices worldwide: Making markets more transparent
World Bank. (2013b). Migration and development brief 19.Washington, DC: Migration and
Remittances Unit, Development Prospects Group
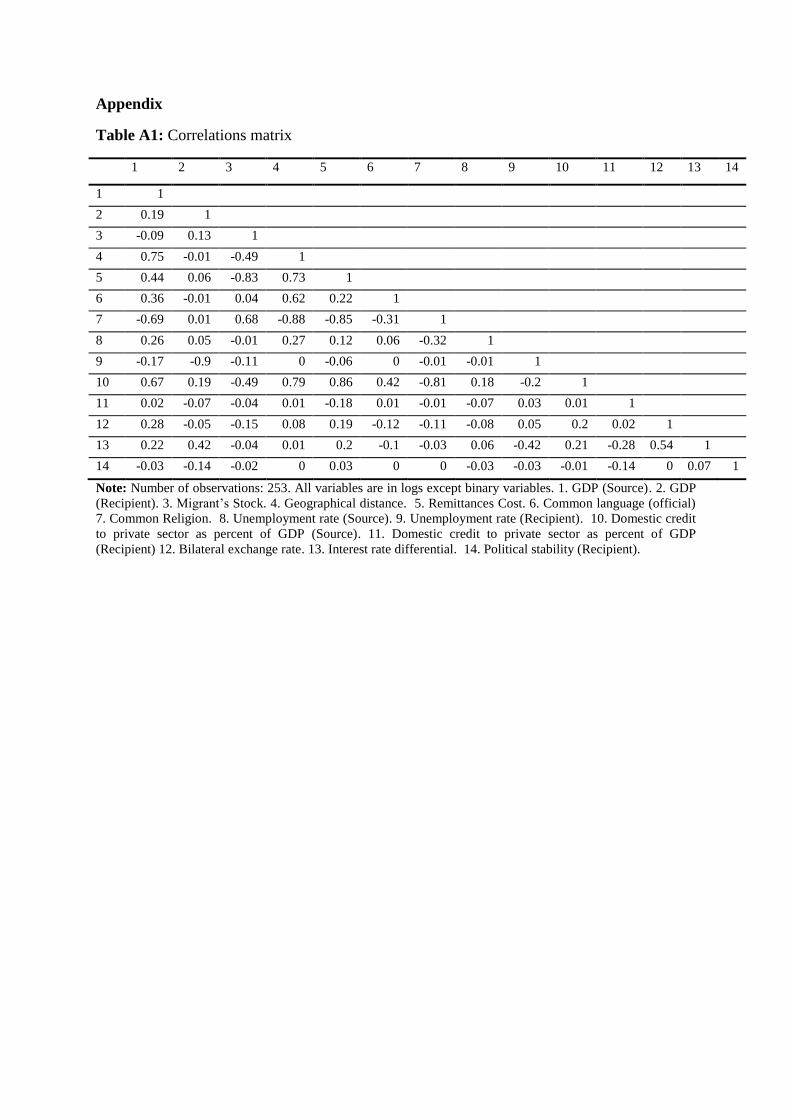
Appendix
Table A1: Correlations matrix
1 2 3 4 5 6 7 8 9 10 11 12 13 14
1 1
2 0.19 1
3 -0.09 0.13 1
4 0.75 -0.01 -0.49 1
5 0.44 0.06 -0.83 0.73 1
6 0.36 -0.01 0.04 0.62 0.22 1
7 -0.69 0.01 0.68 -0.88 -0.85 -0.31 1
8 0.26 0.05 -0.01 0.27 0.12 0.06 -0.32 1
9 -0.17 -0.9 -0.11 0 -0.06 0 -0.01 -0.01 1
10 0.67 0.19 -0.49 0.79 0.86 0.42 -0.81 0.18 -0.2 1
11 0.02 -0.07 -0.04 0.01 -0.18 0.01 -0.01 -0.07 0.03 0.01 1
12 0.28 -0.05 -0.15 0.08 0.19 -0.12 -0.11 -0.08 0.05 0.2 0.02 1
13 0.22 0.42 -0.04 0.01 0.2 -0.1 -0.03 0.06 -0.42 0.21 -0.28 0.54 1
14 -0.03 -0.14 -0.02 0 0.03 0 0 -0.03 -0.03 -0.01 -0.14 0 0.07 1
Note: Number of observations: 253. All variables are in logs except binary variables. 1. GDP (Source). 2. GDP
(Recipient). 3. Migrant’s Stock. 4. Geographical distance. 5. Remittances Cost. 6. Common language (official)
7. Common Religion. 8. Unemployment rate (Source). 9. Unemployment rate (Recipient). 10. Domestic credit
to private sector as percent of GDP (Source). 11. Domestic credit to private sector as percent of GDP
(Recipient) 12. Bilateral exchange rate. 13. Interest rate differential. 14. Political stability (Recipient).