What Does It Mean to be “Insured”? - Hilltop · PDF fileSource: KFF/HRET and...
28
What Does It Mean to be “Insured”? Paul Fronstin, Ph.D. Director, Health Research & Education Program Employee Benefit Research Institute UMBC The Changing Health Insurance Market Copyright© - Employee Benefit Research Institute Education and Research Fund, 1978-2006. All rights reserved. The information contained herein is not to be construed as an attempt to provide legal, accounting, actuarial, or other such professional advice. Permission to copy or print a personal use copy of this material is hereby granted and brief quotations for the purposes of news reporting and education are permitted. Otherwise, no part of this material may be used or reproduced without permission in writing from EBRI-ERF.
Transcript of What Does It Mean to be “Insured”? - Hilltop · PDF fileSource: KFF/HRET and...

What Does It Mean to be “Insured”?
Paul Fronstin, Ph.D.Director, Health Research & Education Program
Employee Benefit Research Institute
UMBCThe Changing Health Insurance Market
Copyright© - Employee Benefit Research Institute Education and Research Fund, 1978-2006. All rights reserved.
The information contained herein is not to be construed as an attempt to provide legal, accounting, actuarial, or other such professional advice. Permission to copy or print a personal use copy of this material is hereby granted and brief quotations for the purposes of news reporting and education are permitted. Otherwise, no part of this material may be used or reproduced without permission in writing from EBRI-ERF.

2
Premiums Rising 4-5 Times Faster than Inflation and Wages, 1988-2005
12.0%
18.0%
14.0%12.2%
10.3%8.5%
5.9%
0.8%
9.2%11.2%
13.9%12.9%
10.9%
8.2%
5.3%
0%
5%
10%
15%
20%
1988 1990 1992 1994 1996 1998 2000 2002 2004
Health Insurance PremiumsWorkers EarningsOverall Inflation
Source: KFF/HRET and Bureau of Labor Statistics.

3
Average Worker Monthly Contribution, 1988-2005
$8
$52$34
$124
$37
$122
$28
$138
$30
$150
$38
$174
$42
$201
$47
$222
51
226
$0
$50
$100
$150
$200
$250
Employee-Only Coverage Family Coverage
1988 1993 1996 2000 2001 2002 2003 2004 2005
Source: KFF/HRET.

4
Percentage of Premium Paid by Covered Workers, 1988-2005
11%
29%
20%
32%
20%
27%
14%
26%
14%
26%
16%
28%
16%
27%
16%
28%
16%
26%
0%
10%
20%
30%
40%
Employee-Only Coverage Family Coverage
1988 1993 1996 2000 2001 2002 2003 2004 2005
Source: KFF/HRET.

5
Average Annual Deductibles for Employee-Only Coverage, 1996-2005
(Among Covered Workers With or Without a Deductible)
180
71
175
79
204
92
251
54
275
113
287
210
323
220
0
50
100
150
200
250
300
350
400
450
500
PPO In-Network POS In-Network
1996 2000 2001 2002 2003 2004 2005
Source: KFF/HRET.

6
Physician Office Visit Co-Payments, 2004-2005
(Among Covered Workers With a Co-payment)
57%
39%
48% 49%
0%
10%
20%
30%
40%
50%
60%
70%
$5-$15/visit $20 or more/visit
2004 2005
Source: KFF/HRET.

7
Average Co-Pay for Drugs, 2000-2005
$-
$10
$20
$30
$40
$50
$60
$70
$80
Generic Drugs Preferred Drugs Non-Preferred Drugs Fourth-Tier
2000 2001 2002 2003 2004 2005
Source: KFF/HRET.

8
Drug Plan Incentives for PPO, Firms with 1,000 or More Employees, 1998 &
2003
10%6%Pay difference between generic & brand name
6%10%Higher coinsurance
<1%1%No deductible
69%45%Lower co-payment
20031998Generic Incentive
Source: Hewitt Associates.

9
Drug Plan Incentives for PPO, Firms with 1,000 or More Employees, 1998 &
2003
14%21%Higher coinsurance
8%12%No deductible
67%31%Lower co-payment
20031998Mail Order Incentive
Source: Hewitt Associates.

10
Drug Plan Incentives for PPO, Firms with 1,000 or More Employees, 1998 &
2003
6%22%No Generic or Mail Order Incentive
6%2%Pay difference between generic & brand name
1%1%Higher coinsurance
78%32%Lower co-payment
20031998Combination of Generic and Mail Order Incentive
Source: Hewitt Associates.

11
Tiered Provider Networks (TPNs)
• Hospitals & doctors.• Tiers vary with cost & quality.
– Similar to PPO (in vs. out)– Similar to Rx tiers.
• Cost sharing distinctions– Co-payment per hospital day.– Coinsurance rate per stay.– Overall deductible per stay.

12
Use of Tiered Physician or Hospital Networks, 2005
11%13%13%
12%13%
8%
0%
5%
10%
15%
20%
Have Tiered Provider Networks Considered Tiered Networks
HMO PPO POS
Source: KFF/HRET.

13
Consumerism:Potentials & Concerns
Potentials• Lower costs
– Reduction in use– Use of lower cost services
• Better engaged consumer• More satisfied consumer• Better health
outcomes/more appropriate care
• Improve affordability
Concerns• Low health literacy
– Reduce necessary care– Induce demand for
unnecessary care
• Lack of tools & resources to make decisions
• Impact on high cost users uncertain
• One-time savings

14
Evidence So FarFull Replacement HRA Study (McKinsey & Company, 2005)
• CDHP consumers are more engaged than “traditionally insured” in decision making
• Make decisions that may drive sustained decline in trend– Forego less serious care– Shop for most cost effective care when they can– Take greater responsibility for health and wellness
• Seek information to compare treatments, not providers• Are no more likely than employees in traditional plans
to seek quality info• Are less satisfied than with previous plans

15
Evidence So FarAetna Study: Medical Claims
2003: 3.7% YOY Increase
Change in utilization• Inpatient -5.2%• ER Visits -2.6%• Outpatient -14.4%• Office visits -3.3%
– PCP -10.9%– Specialist +3.4%
2004: 6% YOY Increase
Change in utilization• Inpatient -6.7%• ER Visits -15.9%• Outpatient -4.6%• Office visits -3.4%
– PCP -12.3%– Specialist +3.6%

16
Evidence So FarAetna Study: Pharmacy
• Overall Cost Increase – CDHP +13%– PPO +18%
• Generic Use– CDHP +2.1%– PPO +1.3%
• Mail Order– CDHP +3.5%– PPO +1.7%

17
Increase in medications that support chronic conditions
Eight percent decrease in total medical (non-pharmacy) costs
Eight percent increase in medication supply
Decrease in inpatient and outpatient costs
CIGNA Choice Fund StudyKey Findings
Increase in inpatient admits

18
Evidence So Far
• Risk Selection– Humana data studied by Kaiser: based on prior
use and prior claims, HDHP enrollees usage was 50-60% below those not choosing HDHP
– U. of Oregon study: selectivity related to education, income, health status
• Cost savings actions– U. of Oregon study: only difference related to
generic drug substitution• BCBSA Study

19
EBRI/Commonwealth Fund Consumerism in Health Care Survey
• Among adults with plans, lower satisfaction with quality of care, out-of-pocket costs, plan overall; few would recommend plan to friends/co-workers
• High out-of-pocket costs + premiums amount to substantial share of income, especially among those with lower income and health problems
• No differences in service use, but higher reported rates of cost-related delays, avoidance, or skipping care or Rx, esp. lower income and health problems
• More cost-conscious decision making behavior• Little quality/cost information provided by plans
20
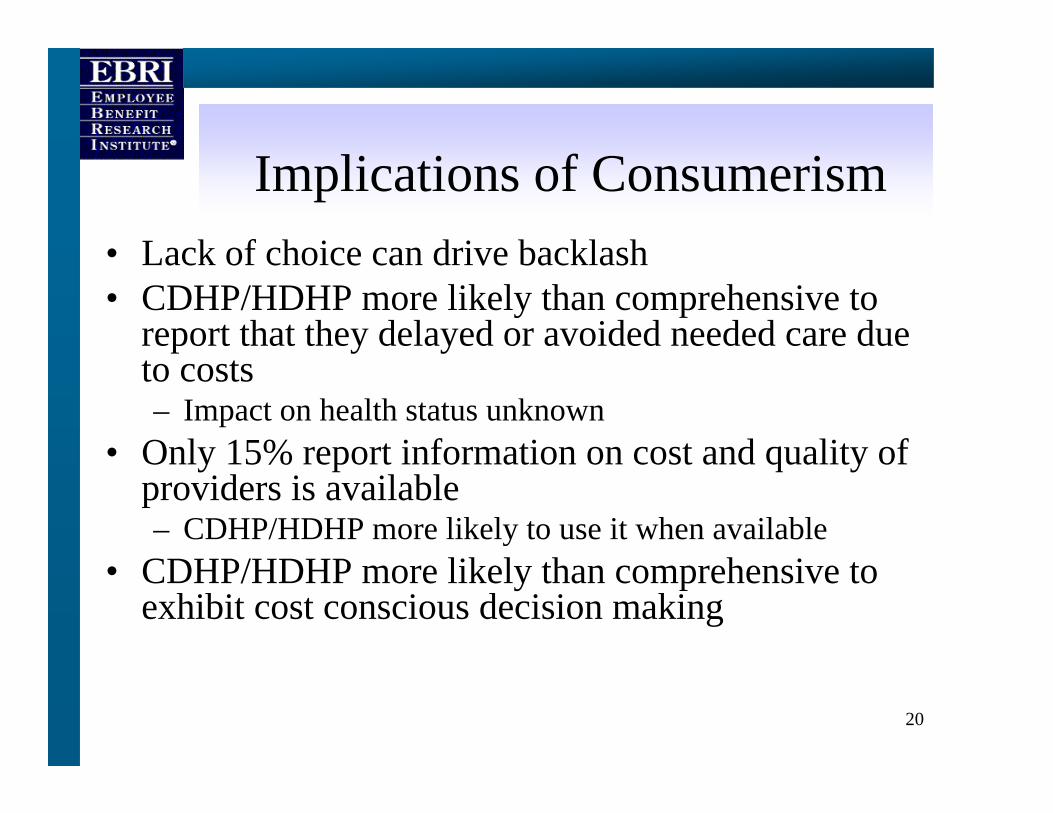
Implications of Consumerism • Lack of choice can drive backlash• CDHP/HDHP more likely than comprehensive to
report that they delayed or avoided needed care due to costs– Impact on health status unknown
• Only 15% report information on cost and quality of providers is available– CDHP/HDHP more likely to use it when available
• CDHP/HDHP more likely than comprehensive to exhibit cost conscious decision making

21
Percentage of Adults who Agree that Terms of Coverage Make Them Consider Cost When Deciding
to Seek Health Care Services
71*60*
38
0
20
40
60
80
Comprehensive HDHP CDHPNote: Comprehensive = plan w/ no deductible or <$1000 (ind), <$2000 (fam); HDHP = plan w/ deductible $1000+ (ind), $2000+ (fam), no account; CDHP = plan w/ deductible $1000+ (ind), $2000+ (fam), w/ account.*Difference between HDHP/CDHP and Comprehensive is statistically significant at p ≤ 0.05 or better.Source: EBRI/Commonwealth Fund Consumerism in Health Care Survey, 2005.
Percent of adults 21-64 who strongly or somewhat agree

22
Cost Conscious Decision-Making, by Insurance Source
27
43
49
19
32*
44*
55*
60*
14
23
0 20 40 60 80
Checked quality rating ofdoctor or hospital
Checked price of service
Asked doctor to recommendless costly prescription drugs
Talked to doctor abouttreatment options & costs
Checked whether plan wouldcover care
Comprehensive
HDHP/CDHP
Note: Comprehensive = plan w/ no deductible or <$1000 (ind), <$2000 (fam); HDHP = plan w/ deductible $1000+ (ind), $2000+ (fam), no account; CDHP = plan w/ deductible $1000+ (ind), $2000+ (fam), w/ account.*Difference between HDHP/CDHP and Comprehensive is statistically significant at p ≤ 0.05 or better.Source: EBRI/Commonwealth Fund Consumerism in Health Care Survey, 2005.
Percent of adults 21-64 who received health care in last twelve months

23
Annual Claims DistributionAdults Ages 18-64, 2001
$0
$10,000
$20,000
$30,000
$40,000
0% 10% 20% 30% 40% 50% 60% 70% 80% 90% 100%
Percent of Population
Ave
rage
Cos
t Per
Per
son
Average Cost = $2,454
or higher
20% of population that accounts for 80% of spending
Source: EBRI estimates from the 2001 MEPS.

24
15 Most Costly Conditions Account for Over 50% of Spending
56%Total spending
1%Kidney
2%Infectious disease
2%Endocrine
2%Skin disorders
2%Pneumonia
2%Cerebrovascular disease
3%Back problems
3%Arthritis
3%Diabetes
4%Hypertension
5%Mental disorders
6%Pulmonary conditions
6%Cancer
7%Trauma
9%Heart disease

25
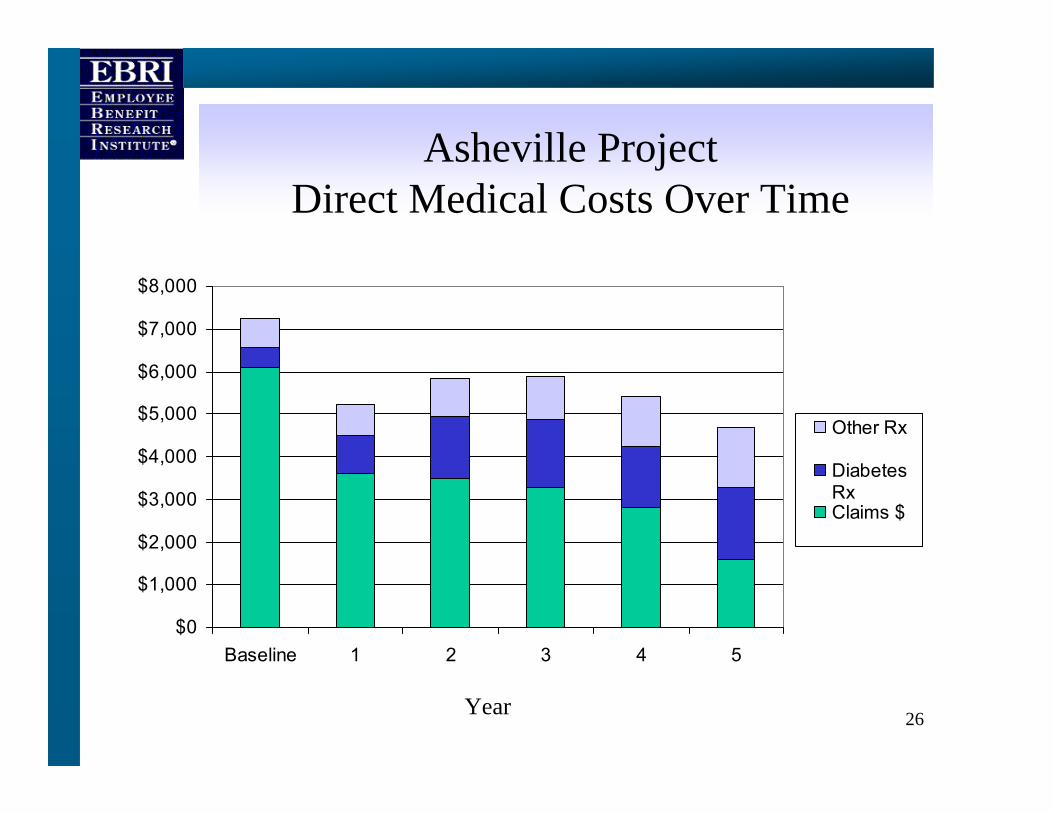
Asheville Project(J. of Amer. Pharma Assoc., 2003)
• No cost meetings with pharmacists– Education, home meter training, physical
assessments• Co-payments for diabetes-specific drugs
and supplies were waived
26
Asheville ProjectDirect Medical Costs Over Time
$0
$1,000
$2,000
$3,000
$4,000
$5,000
$6,000
$7,000
$8,000
Baseline 1 2 3 4 5
Other Rx
DiabetesRxClaims $
Year

27
Asheville ProjectAve. Annual Sick Days Among Diabetics
12.6
6.0
8.5
5.7 5.8 5.7 6.0
0
2
4
6
8
10
12
14
Baseline 1 2 3 4 5 6
Year

28
Cholesterol Lowering Drugs
• Recent Rand study, Journal of Managed Care• Increase in co-payment from $10 to $20
associated with a 6-10 percentage point reduction in compliance.
• Full compliance associated with 357 fewer hospitalizations in sample studied.
• Elimination of co-payments for certain patients would avert 80,000 hospitalizations and 31,000 ER visits nationally.
• National savings would be more than $1 billion.