Fecundity and Life-history Strategies in Marine Invertebrates

What does a fly’s individual fecundity pattern look like? Thedynamics of resource allocation in reproduction and ageing
V.N. Novoseltsev a,b,1,2, J.A. Novoseltseva a,3, A.I. Yashin b,c,*a Institute of Control Sciences, 117997 Profsoyuznaya 65, Moscow, Russia
b Max-Planck Institute for Demographic Research, 114 Doberaner Str., D 18057 Rostock, Germanyc Sanford Institute of Public Policy, Duke University, Durham, NC 27708-466, USA
Received 2 December 2002; received in revised form 29 January 2003; accepted 11 February 2003
Abstract
Reproduction is usually characterised by an average fecundity pattern having a maximum at earlier ages and a subsequent gradual
decline later on. An individual fecundity trajectory does not follow such a pattern and has no maximum. A three-stage pattern,
which includes maturation, maturity and reproductive senescence, is a more appropriate description. An analysis of the power
balance of an adult female fly during its life course allows us to predict two critical periods in an individual life history. The first
crisis occurs at early ages when the increasing power demand becomes greater than the power supply. It often results in premature
death. The surviving flies enjoy maturity and lay eggs at a presumably constant rate. The second critical period at advanced ages
ends up in a senescence-caused death. Our approach predicts that there will be a bimodal death time distribution for a population of
flies.
# 2003 Elsevier Science Ireland Ltd. All rights reserved.
Keywords: Fecundity pattern; Resource allocation; Premature death; Homeostenosis
1. Introduction
Strong correlations between fecundity, mortality and
longevity have been found in various species, particu-
larly, in flies (Williams, 1966; Rose, 1984, 1991; Reznick,
1985; Bell and Koufopanou, 1985; Partridge, 1986).
Fecundity timing influences other life history traits and
trade-offs and affects reproductive and mortality costs.
It also plays an essential role in the optimality hypoth-
esis of the evolutionary biology of ageing (Kirkwood,
1977, 1990, 2002; Rose, 1991; Partridge and Barton,
1993). However, in spite of a great interest in fecundity
scheduling, ‘surprisingly little detailed information exists
on the patterns of reproduction over the lifetime of even
a single insect species’ (Carey et al., 1998a).Despite the fact that in many laboratories the
‘fecundity of mated females was measured individually’
(Ackermann et al., 2001), usually only averaged fecund-
ity patterns have been analysed in insects. For example,
only population-averaged fecundity data were presented
and studied in numerous experiments on artificial
selection in Drosophila which were devoted to post-
poned senescence (Rose, 1984; Chippindale et al., 1993;
Djawdan et al., 1996), late fecundity (Luckinbill et al.,
1984; Arking, 1987; Arking et al., 2000), reproduction at
a ‘young’ or an ‘old’ age (Partridge and Fowler, 1992;
Roper et al., 1993 etc.). In many cases, researchers use
even more simple indicators of age-related averaged
fecundity. They evaluate ‘early’ or ‘late’ fecundity by
counting up the averaged productivity during several
first days after the onset of reproduction, and during
some period at advanced ages. Such indicators proved
to be adequate in the majority of insect fecundity
studies. Only in the latest publications were some
‘unpleasant’ findings presented showing that the early
* Corresponding author. Tel.: �/49-381-2081-106; fax: �/49-381-
2081-406.
E-mail addresses: [email protected], novoseltsev@demogr.
mpg.de (V.N. Novoseltsev), [email protected] (J.A.
Novoseltseva), [email protected] (A.I. Yashin).1 Tel.: �/95-334-88-91.2 Tel.: �/49-381-2081-106; fax: �/49-381-2081-406.3 Tel.: �/95-334-88-91.
Mechanisms of Ageing and Development 124 (2003) 605�/617
www.elsevier.com/locate/mechagedev
0047-6374/03/$ - see front matter # 2003 Elsevier Science Ireland Ltd. All rights reserved.
doi:10.1016/S0047-6374(03)00061-7

fecundity indicator is particularly sensitive to the assay
conditions (Ackermann et al., 2001).
Although some experiments involving individual
fecundity measurements were carried out about 20 yearsago (Aigaki and Ohba, 1984; Whittier and Shelley,
1993), only the latest studies have paid special attention
to individual fecundity (Carey et al., 1998a,b; Blay and
Yuval, 1999; Shelley, 2000; Muller et al., 2001). Accord-
ingly, little attention has been given to the study of
genetic and physiological mechanisms, which underlie
experimentally observed age-related fecundity trajec-
tories. Pioneering studies of individual fecundity wereperformed by Carey et al. (1998a,b) with 1000 Medi-
terranean fruit flies. Muller et al. (2001) presented a
thorough analysis of the associations of individual
fecundity with longevity in these flies.
Natural deaths in laboratory populations are mostly
senescence-caused. Fries (1980) and, independently,
Hayflick (1998) described senescence-caused death in
humans as resulting from a crisis in homeostatic abilityand energy exhaustion. Senescence-caused death occurs
because of homeostenosis, i.e. when a homeostatic
resource of an organism runs out so that even a smallest
internal or external violation of homeostasis results in
death. However, reproduction-related deaths may also
happen in populations of flies. Since reproduction is
costly, it may demand an extremely high expenditure of
energy at a period of maximal reproductive effort. Insome flies these demands are impossible to satisfy. These
flies die prematurely from reproduction overload.
The sporadic and vague evidence, which has now been
accumulated, supports the notion that at least some of
the early-aged deaths in fly populations are related to
reproduction. Chapman et al. (1998) suggest that
females flies ‘suffer a decrease in survival as a result of
egg production and of mating, and these costs areindependent of one another’ (Chapman et al., 1998). In
a paper devoted to the delayed wave of deaths from
reproduction, Sgro and Partridge (1999) observed
statistically non-significant peaks of deaths in Droso-
phila females shortly after mating which were presum-
ably reproduction-related. Carey et al. (1998a) report
that many ‘short-live flies died before they were old
enough to produce a high level of eggs’ (Carey et al.,1998a).
To date, the best-formalised description of individual
fecundity in a fly was presented by Muller et al. (2001).
These authors described patterns of individual repro-
ductive activity using a simple heuristic approach.
Namely, they considered only the latest stage of the
fecundity pattern and used an exponentially declining
function with a randomly located maximum for thedescription. However, such a method is not appropriate
for our goals since it does not allow for a detailed
investigation of the individual power allocation mechan-
ism, which plays an important role in both fecundity
and life span determination. In particular, energy
considerations can help clarify the causes of death in
animal populations.
In this paper we address the question of howindividual fecundity patterns can be described and
whether such a description might help in better under-
standing the connection between reproduction and life
span.
2. Species-specific mechanisms forming individual
fecundity
In Novoseltsev et al. (2002) we proposed a formalised
approach to the description of a fecundity pattern. We
hypothesised a mechanism by which reproductive cap-
abilities of a female organism under given conditions
manifest themselves in the form of an age-related
fecundity pattern. The realised pattern of an individual
fly was assumed to be determined by the following two
processes: an endowed age-related reproductive pro-gram and a decline in the homeostatic capacity of a
reproductive system that comes into play later in life.
On one hand, a fly’s genotype encodes an individual
pattern of reproductive activity and egg production.
Analysing published data and research findings on
various flies (Alujaa and Liedo, 1993; Lawrence, 1993;
Pitnick et al., 1995; Markow, 1996; Blay and Yuval,
1999; Harshman and Hoffmann, 2000; Shelley, 2000;Spencer and Miller, 2002), we came to the conclusion
that the endowed reproductive machinery is likely to be
designed to produce eggs at a constant rate. In this
respect the reproductive system in flies does not differ
from other functional systems, wherein functioning
reaches homeostatic stability in the maturation period
(e.g. systems responsible for flight capability; Bennett,
1991; Jones and Lindstedt, 1993; Suarez, 1996; Marden,2000; or vision; Bui et al., 2000). Not too much is known
about the genetic control of the development of different
functional systems in flies (Salazar-Ciudad et al., 2001),
and no genes are known to degenerate or stop the
activity of any one functional system in an organism
(Miller, 1999; Partridge and Gems, 2002). Functional
capacity in a system deteriorates at advanced ages
mostly due to resource inability. For example, at olderages flies cut off flying or demonstrate ‘supine’ beha-
viour (Sohal, 1986; Papadopoulos et al., 2002) presum-
ably due to a power shortage and not because of genetic
stoppage of the flying function.
A series of reproduction-related events that unfolds in
an organism of a developing fly imposes a number of
limitations at different ages on the power flux, which is
needed to perform the prescribed activities. We will call‘reproduction-related demand’ the power demand,
which is necessary for successful execution of the
corresponding biochemical and physiological processes.
V.N. Novoseltsev et al. / Mechanisms of Ageing and Development 124 (2003) 605�/617606

Daily egg production is traditionally used as a
measure of individual reproductive activity. The first
publication that uses such an individual measure of
reproductive efforts was the Aigaki and Ohba (1984)paper. These authors suggest that the ‘egg-laying
activity is a parameter which changes regularly with
female age and is appropriate for quantitative analysis
of individual variations in female reproductive activity’
(Aigaki and Ohba, 1984). We will use this measure to
estimate a reproductive-related power demand in ma-
ture female flies once the egg laying has started. We will
use the number of eggs, which is processed in the ovariesat different ages, to estimate the power demand before
the onset of reproduction.
Regulation of an ovipositional process is an issue of
interest in various Diptera. For example, the difference
in oviposition between virgin and mated flies was
studied in Musca domestica (Riemann and Thorson,
1969), Drosophila (Aigaki and Ohba, 1984; Partridge,
1986), medflies (Carey et al., 1998a,b; Blay and Yuval,1999), and onion flies (Spencer and Miller, 2002).
The process of egg maturation in the fly’s ovary is well
studied (Lin and Spradling, 1993; Markow, 1996;
Carlson et al., 1998; Carlson and Harshman, 1999).
The follicle cells are produced in the germarium. It can
be assumed that after the initial gap, the process of
follicle production has a genetically endowed constant
rate, which has been called ‘reproductive capacity’ (RC )(Novoseltsev et al., 2002). This rate is related to the
number of ovarioles and is regulated by the nutrient
income. The egg chambers produced enter the ovariole
and move ahead. After a time lag, which is needed for
ripening, the eggs arrive at the ovipositor and are laid.
The number of egg chambers that are simultaneously
processed inside the ovarioles increases from zero to a
maximum value. This maximum is achieved, on average,at the ‘onset of reproduction’, i.e. at the age when the
first mature egg leaves the ovariole. After this moment
the number of eggs which input, Finp (x), and output the
ovarioles, Fout(x ), are assumed to be equal. A steady
state arises in this case (Fig. 1). In Drosophila , an
ovariole has about six to seven progressively more
mature egg chambers (Lin and Spradling, 1993). A fly’s
ovaries can simultaneously process as many as 100 eggs(Markow, 1996).
Thus the most characteristic feature of the reproduc-
tive system is a genotype-specific maximal rate of egg
production in the germarium, RC , which is attainable in
a given environment (Novoseltsev et al., submitted for
publication, J. Gerontol.). Then the individual time-
pattern of fecundity can be represented as a step-wise
function with a steady state level RC :
Fout(x)�0; if xBXonset
RC; if x]Xonset
�(1)
where Xonset is the age of the onset of reproduction.
Such a constant rate of egg-laying will proceed until the
fly has enough power resources to sustain it.
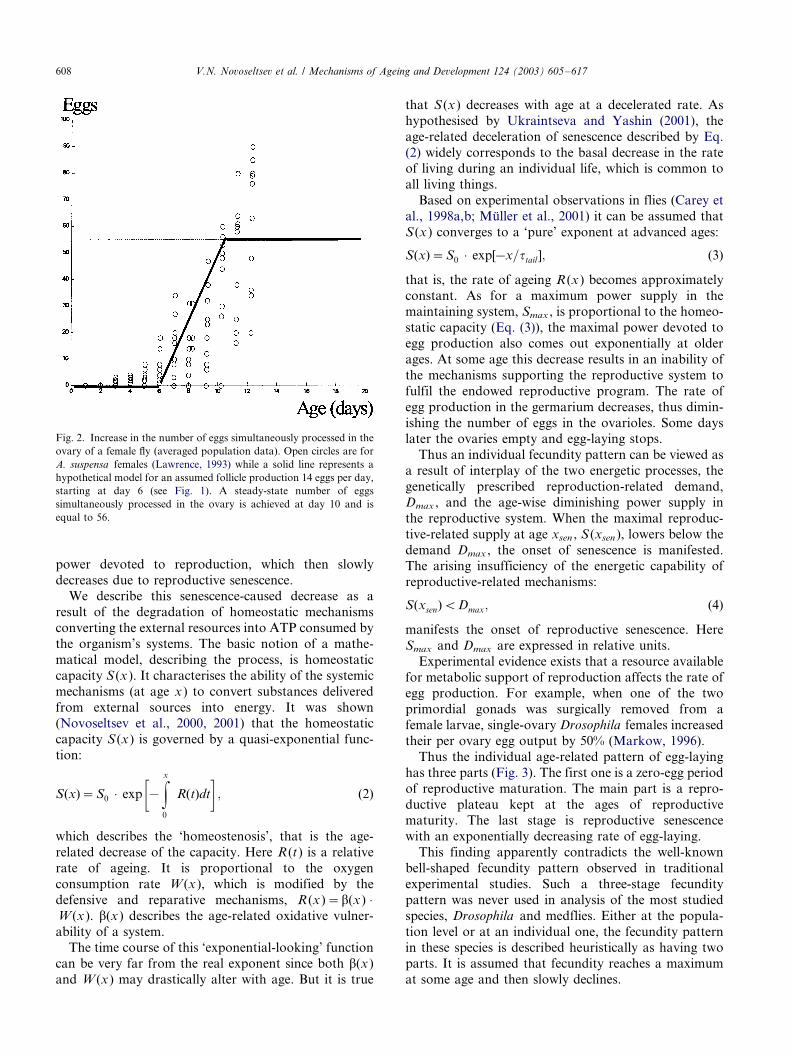
When the averaging procedure is applied, it smoothes
and widens the individual patterns. An experimental
pattern for a population of Caribbean fruit flies is
presented in Fig. 2 (Lawrence, 1993).
3. Decline of individual homeostatic capacity determines
the tail of the individual fecundity pattern
To analyse how an individual age-related fecundity
pattern is formed, we turn to the energy balance in the
reproductive system of a female fly. The first observa-
tion is that the increase of the power demand begins
earlier than the first egg is laid, thus reflecting the
expenditures needed for egg maturation in the ovaries.
We will assume that at any age the energy demand isproportional to the number of eggs being processed in
the ovarioles at this age. This means that the power
demand at early ages linearly increases until it reaches a
maximum value, Dmax , which is proportional to the RC
in Eq. (1).
The other process involved in the formation of a
fecundity pattern is the energy supply, that is, the
capability of the energetic mechanisms, which maintainsthe reproduction, to produce the power consumed in the
vitellogenesis and other related processes. The reproduc-
tion-related energy supply can be presented as the initial
Fig. 1. Hypothetical individual age-related patterns of egg production
in the gonads. From above: (A) follicles enter the ovaries of a fly from
the germarium at a rate of 14 eggs per day, starting at day 6, (B) at day
10 the first ripened egg leaves the ovary to be laid by the fly, (C) eggs
simultaneously processed in the ovaries have a steady state of 56 eggs
achieved at day 10. The values widely correspond to experimental data
on A. suspensa females (see Fig. 2).
V.N. Novoseltsev et al. / Mechanisms of Ageing and Development 124 (2003) 605�/617 607
power devoted to reproduction, which then slowly
decreases due to reproductive senescence.We describe this senescence-caused decrease as a
result of the degradation of homeostatic mechanisms
converting the external resources into ATP consumed by
the organism’s systems. The basic notion of a mathe-
matical model, describing the process, is homeostatic
capacity S (x ). It characterises the ability of the systemic
mechanisms (at age x ) to convert substances delivered
from external sources into energy. It was shown(Novoseltsev et al., 2000, 2001) that the homeostatic
capacity S (x) is governed by a quasi-exponential func-
tion:
S(x)�S0 � exp
��g
x
0
R(t)dt
�; (2)
which describes the ‘homeostenosis’, that is the age-
related decrease of the capacity. Here R (t) is a relative
rate of ageing. It is proportional to the oxygen
consumption rate W(x ), which is modified by the
defensive and reparative mechanisms, R (x )�/b(x) �/W (x ). b(x ) describes the age-related oxidative vulner-
ability of a system.The time course of this ‘exponential-looking’ function
can be very far from the real exponent since both b(x )
and W (x ) may drastically alter with age. But it is true
that S (x ) decreases with age at a decelerated rate. As
hypothesised by Ukraintseva and Yashin (2001), the
age-related deceleration of senescence described by Eq.
(2) widely corresponds to the basal decrease in the rateof living during an individual life, which is common to
all living things.
Based on experimental observations in flies (Carey et
al., 1998a,b; Muller et al., 2001) it can be assumed that
S (x ) converges to a ‘pure’ exponent at advanced ages:
S(x)�S0 � exp[�x=ttail ]; (3)
that is, the rate of ageing R (x ) becomes approximately
constant. As for a maximum power supply in themaintaining system, Smax , is proportional to the homeo-
static capacity (Eq. (3)), the maximal power devoted to
egg production also comes out exponentially at older
ages. At some age this decrease results in an inability of
the mechanisms supporting the reproductive system to
fulfil the endowed reproductive program. The rate of
egg production in the germarium decreases, thus dimin-
ishing the number of eggs in the ovarioles. Some dayslater the ovaries empty and egg-laying stops.
Thus an individual fecundity pattern can be viewed as
a result of interplay of the two energetic processes, the
genetically prescribed reproduction-related demand,
Dmax , and the age-wise diminishing power supply in
the reproductive system. When the maximal reproduc-
tive-related supply at age xsen , S (xsen ), lowers below the
demand Dmax , the onset of senescence is manifested.The arising insufficiency of the energetic capability of
reproductive-related mechanisms:
S(xsen)BDmax; (4)
manifests the onset of reproductive senescence. Here
Smax and Dmax are expressed in relative units.
Experimental evidence exists that a resource available
for metabolic support of reproduction affects the rate ofegg production. For example, when one of the two
primordial gonads was surgically removed from a
female larvae, single-ovary Drosophila females increased
their per ovary egg output by 50% (Markow, 1996).
Thus the individual age-related pattern of egg-laying
has three parts (Fig. 3). The first one is a zero-egg period
of reproductive maturation. The main part is a repro-
ductive plateau kept at the ages of reproductivematurity. The last stage is reproductive senescence
with an exponentially decreasing rate of egg-laying.
This finding apparently contradicts the well-known
bell-shaped fecundity pattern observed in traditional
experimental studies. Such a three-stage fecundity
pattern was never used in analysis of the most studied
species, Drosophila and medflies. Either at the popula-
tion level or at an individual one, the fecundity patternin these species is described heuristically as having two
parts. It is assumed that fecundity reaches a maximum
at some age and then slowly declines.
Fig. 2. Increase in the number of eggs simultaneously processed in the
ovary of a female fly (averaged population data). Open circles are for
A. suspensa females (Lawrence, 1993) while a solid line represents a
hypothetical model for an assumed follicle production 14 eggs per day,
starting at day 6 (see Fig. 1). A steady-state number of eggs
simultaneously processed in the ovary is achieved at day 10 and is
equal to 56.
V.N. Novoseltsev et al. / Mechanisms of Ageing and Development 124 (2003) 605�/617608

Such a description is very common in Drosophila at a
population level, starting from Lints and Lints (1968).
In medflies, the same description was also used at an
individual level. ‘Individual egg-laying trajectories rose
sharply after egg-laying began 5�/17 days after emer-
gence, reached a peak and then slowly declined’ (Muller
et al., 2001). Exponential approximation for a repro-
ductive decline was found both in Drosophila (Pretzlaff
and Arking, 1989) and medflies (Muller et al., 2001).
Various mathematical approaches were used to describe
reproductive patterns in different species, but to the best
of our knowledge, there were only a few attempts to
confront the results of mathematical modelling to the
experimentally measured fecundity pattern (Stearns et
al., 2000; Shanley and Kirkwood, 2000; Cichon, 2001).
Nonetheless, flat reproductive patterns were observed
in some Diptera species such as onion flies D. antiqua
and oriental fruit flies Bactrocera dorsalis . These flies
are characterised by a stable and prolonged reproductive
period, so that a usual way to describe fecundity is
‘cumulative egg production’ (Figs. 4 and 5). A linear
increase in a cumulative pattern is equivalent to a step-
wise individual daily fecundity. For example, in onion
flies ‘after mating, the egg-laying rate shifted abruptlyupward from near 0 to about 15 eggs per day and was
maintained for about 3 weeks’ (Spencer and Miller,
2002).
4. Parametric descriptions of individual reproductive
patterns
4.1. Three stages in the adult life history
Parameterisation is an inevitable stage in quantitative
analysis of any experimental data. The simplest techni-
que to parameterise age-related reproduction at a
population level is a usage of simple heuristic indicators
like early or late fecundity. Muller et al. (2001) made the
only parameterised description of individual age-related
fecundity known to the authors.As for individual fecundity, the obvious obstacle for
parameterisation is an extremely high degree of indivi-
dual variability in daily egg scores. Our three-stage
Fig. 3. The three-stage fecundity pattern of an individual female fly. (A) Mechanism underlying fecundity scheduling in an individual female fly. Two
age-related processes involved in giving form to a fecundity pattern are presented: an age trajectory of the energy demand endowed by the genetic
reproductive program, and a time function representing the power resource available for reproduction. At maturation stage, the energy demand is
governed by the needs of vitellogenesis and other processes preceding egg laying. The first ripened egg is laid at age Xonset thus giving the
manifestation of the onset of reproduction. Then the rate of egg-laying rapidly achieves a steady-state level. The power resource, initially enough to
sustain all the reproduction-related processes, decreases as time passes. At some point, the attainable power falls below the level needed for the full-
strength functioning of the reproductive machinery. Maintenance of the genetically prescribed rate of egg production becomes impossible. (B) The
resultant three-stage pattern of egg-laying in an individual female fly. The rate of egg-laying is zero at maturation stage, and at each age of maturity
and senescence it is a minimum of the two above curves.
V.N. Novoseltsev et al. / Mechanisms of Ageing and Development 124 (2003) 605�/617 609

presentation allows a stadial parameterisation of indi-
vidual fecundity. A maturation stage may be charac-
terised quantitatively by the two indicators, a duration
(or the age when maturity is achieved) and an egg
delivery rate to the ovaries. A maturity stage can also be
described by a duration (i.e. the difference between the
ages of the ‘onset of reproduction’ and the ‘onset of
senescence’) and a value of reproductive capacity. To
characterise mathematically a ‘tail’ stage, one may use
an age of ‘onset of senescence’ and a time constant of the
exponent of a reproductive decay. At this stage, an
additional indicator may be used, a duration of a post-
reproductive period.These indicators are not independent. For example,
knowing the maturation stage duration and the rate of
follicle delivery to the ovaries allows us to calculate the
steady-state rate of egg production. That is why we have
analysed various combinations of indicators to develop
a shortlist of only five parameters for a fly. The list
includes four parameters for reproductive life history
(the onset of reproduction Xonset , RC , duration of
maturity stage T , and the senescence time constant
ttail ), and the fifth one for an individual life span, LS . A
typical life history pattern parameterised with the
proposed technique is presented in Fig. 6.
4.2. Averaging masks and deforms individual fecundity
patterns
It can be shown that the averaging usually used in
experimental studies masks individual egg-laying scores
in the flies. A schematic example is presented in Fig. 7.
In this figure we take a three-stage pattern of fecundity
and randomly scatter its parameters. Then we average
the scattered curves to produce a ‘mean-population’
pattern of fecundity with a distinct maximum. The
reason why the maximum arose is that the population
Fig. 4. Fecundity patterns in oriental fruit flies. (A) Cumulative egg
production of females mated singly (closed circles, N�/ 61) and
multiply (open circles, N�/ 67). Weakly mean9/S.D. are given
(Shelley, 2000). Weekly fecundity for singly mated (B) and multiply
mated females (C) calculated from this data. Solid lines are for the
least-mean-squared approximations of three-stage patterns.
Fig. 5. Cumulative eggs laid over a lifetime by eight individual female
mated (A) or virgin (B) onion flies D. antiqua (Spencer and Miller,
2002). A linear increase indicates that the individual fecundity patterns
at these ages are step-wise ones with a constant rate of egg production,
which differs in individual flies.
Fig. 6. Parameterisation of a typical individual life history in a female
medfly. Fly #17 is presented from the study by courtesy of Blay and
Yuval (1999). We associate this fly with a standard fecundity pattern
shown in the figure with a thick solid line. The pattern has the
following parameters: RC�/ 31.1, Xonset �/ 3.0, T�/25.0, and ttail �/
2.35. In the exponent, t�/x�/T�/Xonset . Death occurs at day 38. The
onset of reproduction follows the last day without egg-laying.
V.N. Novoseltsev et al. / Mechanisms of Ageing and Development 124 (2003) 605�/617610

has the essential variance of the onset of reproduction
and the maturity stage.
Thus we predict that the averaging of experimental
individual fecundity patterns, each having a flat summit,
may yield a deformed and widened mean-population
pattern with a distinct maximum egg-laying figure. This
means that the maximum of fecundity usually observed
in experimental studies is an artefact caused by aver-
aging. A typical example of such a deformation is
presented in Fig. 8. Only few exceptions from the rule,
i.e. a flat plateau is seen in an averaged pattern of
fecundity, can be found in the published data. These
cases are mostly related to ‘very stable’ populations (as
presented in Figs. 4 and 5 above). The other example is a
population of D. subobscura (N�/41) where mean
fecundity data were essentially greater than the S.E.
values (Aigaki and Ohba, 1984; data of table 2).
Our observation*/that a degree of distortion of the
individual fecundity pattern in commonly used averaged
presentations strongly depends on the ratio mean value/
variance*/is of special interest. Such analysis, however,
is outside the scope of this paper.
5. Individual life history in a female fly
5.1. The tree of energy allocation forms life history
In terms of energy, the life history of an adult fly
depends on which resource is acquitted at the develop-
mental stage and how it is allocated between reproduc-
tion and maintenance (Gadgil and Bossert, 1970;
Reznick, 1985; Reznick et al., 2000).
Essential traits related to reproduction and mainte-nance may be analysed in different forms. We used
terms of power requirements, which were effectively
applied to analyse fitness and trade-offs in different
species. Brown and colleagues defined fitness in terms of
reproductive power, i.e. the rate of conversion of energy
into offspring, as follows.
‘‘An energetic definition of fitness has the potentialto unify areas of ecology and evolutionary biology
that have previously used models based on differ-
ent currencies.’’
(Brown et al., 1993).
Each physiological function in an organism may be
regarded as a two-faced issue having material and
energetic ingredients. For example, Marden (2000)studied this property in respect to flight muscles and
stressed that the flight system ‘‘is energetically and
materially expensive to build and maintain’’. During
the past decade a number of optimisation models were
presented, which describe energy allocation and trade-
offs. It was hypothesised that the N variables describing
the energy investments into various functions are
genetically determined at various nodes in the decisiontree (van Noordwijk and de Jong, 1986; de Jong, 1993).
Different versions of the standard ‘Y allocation tree’
were used in this analysis (de Jong and van Noordwijk,
Fig. 7. Mean-population averaging deforms an individual fecundity pattern. (A) A typical individual fecundity pattern in a fruit fly. Life span�/37.0,
Xonset �/ 6.0, plateau length T�/ 14.0, ttail �/ 8.0, and a duration of senescence period (LS�/T�/Xonset )�/ 17 days. Reproductive capacity, RC�/ 45.0
eggs per day. (B) Individual fecundity patterns of flies in a population (N�/100) depicted together. To represent individual variability, a plateau level
RC is assumed to be a Gaussian random variable with parameters 45.0 and 18.0. The values Xonset , T , ttail and a senescence period SP�/(LS�/T�/
Xonset ) all are the random variables distributed exponentially with the corresponding parameters 5.0, 13.0, 7.0 and 16.0. A constant time delay in
Xonset is 3.0. (C) The averaged daily fecundity for the population. A maximum in daily egg production (26.1 egg per day) is achieved at day 10.
Fig. 8. Individual and averaged fecundity in a population of onion
flies D. antiqua (N�/8; Spencer and Miller, 2002). (A) Individual
patterns experimentally observed in eight flies shown in Fig. 4A. (B)
Mean-cohort fecundity data calculated for the same cohort by
averaging the results from (A).
V.N. Novoseltsev et al. / Mechanisms of Ageing and Development 124 (2003) 605�/617 611

1992; de Jong, 1993). This approach was applied in the
analysis of positive versus negative correlations between
traits that comprise functional trade-offs (for a review
see Zera and Harshman, 2001). We hypothesise that the
life history of a female fly is genetically formed using a
multilevel decision tree as shown schematically in Fig. 9.
The basal partition of energy is made in the root node
N0. One energy flux is invested in the whole-organism
basal homeostatic branch and the other is channelled to
the other parts of the tree. It is in this second part that
functional organs are created. At the next level (N1
node) this energy is divided between soma and gonads.
Each of these branches is then twinned into the
structural and maintaining parts (in N2 nodes). This
representation distinguishes soma and ovaries as inde-
pendent systems in relation to reproduction (Markow,
1996). For example, male-derived products in Droso-
phila females ‘exhibit uptake into soma than into
ovaries’;*/she writes (Markow, 1996).
The N0 node is the most enigmatic. It seems as
though resource partition at such a deep level was
discussed only in plant physiology where resource
allocation between ‘organs’ and ‘maintaining respira-
tion’ was studied (Kiniry, 1993). Kiniry has found that
in shaded wheat plants 15�/68% of the total non-
structural carbohydrates were consumed by mainte-
nance respiration. An attempt was made to simulate
‘the loss of resources’ by maintenance respiration in
relation to a wider range of organisms, but no relation
to experimental studies was made (Sakai and Harada,
2001).
Each functional system (flight, reproduction, vision
etc.) in accordance with the scheme in Fig. 9 has its own
functional machinery supported with the function-
specified energetics. Thus the events in each physiologi-
cal system have their own ‘life history’. A steady state is
kept in each system until its maintaining resource is
sufficient to sustain its functional activity at an endowed
rate. Functional senescence arises when the energy
balance is destroyed and the ability to maintain thesteady state fails.
The scheme in Fig. 9 indicates that the energetic
balances in an organism are dual. The lower-level
balance is an inner property of each functional system.
It controls when specific functioning starts, at what level
it proceeds and when it decays. In particular, when the
flight capacity is emptied, the fly stops flying. When the
resource in the reproduction system is exhausted, thereproductive machinery becomes suppressed.
Energetically, the functional systems of an organism
jointly form a whole-organism demand. This demand is
age-related, as different activities vary during a lifetime.
The demand must be met by the whole-organism
homeostatic energy resource, which has been created
at the N0 root. Generally speaking,
‘‘Design of metabolic flux capacities at the bio-chemical level can only be meaningfully considered
in the context of. . . maximum physiological re-
quirements at the level of the whole organism’’
(Suarez, 1996).
The root-level balance compares the overall power
demand and the basal maintaining resource. Death
occurs when the demand becomes greater than themaintaining resource and when the balance is destroyed.
In this case, the whole-organism maintaining resource is
exhausted.
A number of experimental findings may be seen as
widely supporting this Y-allocation scheme, especially in
relation to gonadic properties.
Tight linear scaling of ovary volume to body size was
found by Bonduriansky and Brooks (1999), suggestingthe existence of ‘common physiological constraints on
relative ovary mass’. This means that the node N1 may
represent an independent level of branching with a
constant partition coefficient. Egg size was nearly
constant within each of the seven Diptera species,
whereas the egg number increased with body size,
presumably by a manifest species-specific stabilising
mechanism on egg size.When body size was manipulated by nutritional
deprivation of larvae, a proportional reduction in the
ovariole number and egg production was observed
(Robertson, 1957). This early result reveals the N0�/
N1�/N2R path in the decision tree. However, a lowered
energy flux forwarded to the reproduction branch N1
had no influence on the number of eggs produced per
ovariole, thus demonstrating the independence of energybranching in the N2R node.
The postponed senescence lines of D. melanogaster
(O-flies) were studied with respect to oocyte maturation
Fig. 9. Y-allocation tree forms a life history of a female fly. At the first
step (N0 node) the overall resource is allocated between an organism’s
functional organisation and basal homeostatic mechanisms. The
functional branch then divided (N1 node) for Gonads (reproduction
system) and Soma (other functional systems including the flight
muscles and the eye system). At the following step (N2R node) the
gonadic resource is allocated between egg-production machinery and
its metabolic support, whereas the somatic resources are parted in
node N2S for creating and supporting different somatic structures.
Each structure is supported with its own maintaining resources.
V.N. Novoseltsev et al. / Mechanisms of Ageing and Development 124 (2003) 605�/617612

and ovariole number (Carlson et al., 1998). It was found
that in these flies, early fecundity was reduced and
oocyte maturation delayed, suggesting a lowering of the
resource allocated to reproduction in the N1 node.Simultaneously, the number of ovarioles did not de-
crease, showing that there is no correlation between the
responses in the N1 and N2R nodes. Thus, these nodes
may be thought of as independent.
The essence of the above analysis is that the repro-
ductive-related traits are formed in the nodes located
downward the root energy allocation node N0. This
suggests that no direct correlations must be expectedbetween longevity and the reproduction-related traits of
an individual life history. This finding is widely sup-
ported by a number of observations in different species
of flies. An analysis of correlations between longevity
and reproduction in Drosophila virilis shows that
‘reproductive activity does not correlate simply with
lifespan in individual flies’ (Aigaki and Ohba, 1984). In
their study on medflies, Blay and Yuval (1999) con-cluded that size (and the overall energy resource)
‘determines the reproductive potential of the female,
but when females attempt to realise this potential, other
factors override the effect of size’. And thus at last, it
was suggested that ‘longevity and egg-laying can be
decoupled’ (Carey et al., 1998a).
5.2. Premature deaths in female flies and bimodal death
time distribution
A novel understanding of the interplay between the
age-related power demand and supply allows hypothe-
sising about a mechanism, which would determine the
causes of death in an individual fly. In any case, death
occurs at the critical point when the whole-organism
power demand can not be met by the power supply.Generally speaking, such a crisis arises in an organism
twice. The first crisis arises at early ages, when flies with
the smallest inherited power resources may die at the
maturation stage. When at these ages the power demand
drastically increases due to initiated egg production in
germarium, the available homeostatic resource can turn
out to be smaller than the demand. Premature death will
occur in this case. If the crisis is over, the fly enjoys asteady state period of reproduction until the second
critical period arises, which ends with a senescence-
caused death. Some flies may have both an insufficient
supply and an insufficient demand. These flies die from
senescence at advanced ages. Thus death time distribu-
tion for ‘weak’ flies is predicted to be bimodal (Fig. 10).
A similar bimodal death time distribution may be
predicted for ‘strong’ flies. Normally, they die fromsenescence, but in cases of extremely high rates of egg
production, death can occur prematurely. Individual
variability scatters individual deaths over these critical
periods, predicting two ‘waves of mortality’ in a female
fly population.
Novoseltsev et al. (2002) show that evolutionary
optimality yields a life history in which a fecundity
pattern nearly entirely corresponds to the senescence
stage in our classification. This means that under
optimal resource allocation, death of individual females
usually occurs at some age located along the final part of
the fecundity tail. Experimental data mainly supports
this finding. In D. virilis , for example, the reproductive
period occupied about 60% of the total life span (Aigaki
and Ohba, 1984). In medflies, this figure can be
evaluated as a percentage of eggs laid by a fly during
senescence, which is as high as 88.9% (Carey et al.,
1998a). Thus, in laboratory populations a majority of
flies die from senescence.
However, a small proportion of deaths might be
accounted for reproduction-caused ones. Indeed, about
3�/6% of flies in various species are non-egg layers. In
onion flies, one female out of 70 mated flies and 6 out of
70 virgin ones never produced eggs (Spencer and Miller,
2002). In oriental fruit flies, 3�/6% of flies failed to lay
any eggs (Shelley, 2000). These observations may be
conferred with 64 non-egg layers in a 1000-fly popula-
tion of female medflies (Carey et al., 1998a). Most all of
Fig. 10. Predicted premature deaths in female flies. Two groups of
flies-strong and weak- are shown with age-related trajectories of the
power supply represented with thin dashed lines. The solid-line
patterns represent age-related individual power demands endowed
for the highest-to-lowest levels of egg production. The demand/supply
intersection points define the ages of death. Weak flies mostly die early,
thus forming the M1 mode of the death distribution curve around age
X1, whereas the strong flies die around age X2, at the M2 mode.
Normally, the flies suffer senescence-caused death, but in the case of
overly endowed rates of egg production, death may occur prematurely.
A bimodal distribution of deaths arises, with M1 mode corresponding
to premature deaths, and M2, to senescence-caused ones.
V.N. Novoseltsev et al. / Mechanisms of Ageing and Development 124 (2003) 605�/617 613

these flies die at early ages and probably do not suffer
senescence, thus reproductive-related events may be
thought of as a cause of their death.
As a result, ‘death due to ageing and age-associatedchanges in reproductive activity can be considered as
under the control of different physiological processes’
(Aigaki and Ohba, 1984).
The flies, which lay no eggs during their lifetime, are
usually excluded from a fecundity analysis. Carey et al.
(1998a) were the first to analyse age-specific mortality
rates in such females (Fig. 11). A bimodal death time
distribution exists only for non-egg-layers, which areobviously the weakest group in the population. How-
ever, one can assume that a ‘premature death’ group was
also present in the egg-laying part of the population, but
was too small to produce a noticeable peak of mortality
at early ages.
6. Discussion and perspectives
Age-related fecundity is one of the important compo-
nents of an individual life history. To analyse it,averages of population egg-laying patterns were tradi-
tionally used. Such a pattern has a distinct maximum
located some days after the onset of reproduction
followed by the exponential decrease in egg-laying.
This form of description was also used in the cases in
which fecundity was studied individually (Carey et al.,
1998a, Carey et al., 1998b; Blay and Yuval, 1999; Muller
et al., 2001).We show that it is possible to represent the individual
trajectory of egg-laying in the life history of adult
females by the following three stages: maturation,
maturity, and senescence. At maturation, a fly laid no
eggs. Then the egg-laying activity abruptly comes up to
its steady state until the onset of reproductive senescence
arises with the exponentially decreasing fecundity tail.
Thus, an individual fecundity pattern of a fly has no
maximum, demonstrating a presumably constant rate of
egg-laying during a relatively long period of time.Such a pattern is seldom found in experimental
studies and was never observed in Drosophila and
Medfly. In these flies, egg-laying scores are random
and very different in their form. Physiologically they are
organised into ‘salvos’, which is clearly seen, e.g. in Fig.
6 in the paper. Insufficiency in reproductive resources
may often result in false starts, i.e. short blow-outs of
egg-laying that precede the main body of eggs, and in
numerous zero-egg days during a fly’s life time. The
arbitrary character of the individual patterns arises due
to many factors, which may influence the inconstancy of
a fecundity pattern. In particular, the number of
matings and the level of sperm storage seem to be
important. Ages at which flies reach reproductive
maturity vary drastically for different individual flies.
For example, Drosophila females reach maturity at
anytime from 1 to 21 days (Markow, 1996).
The egg maturation process is also affected by dietary
factors, which yield instability in the resultant fecundity
patterns. ‘The supply of nutrients places an important
constraint on the output of eggs’ (Markow, 1996). In
particular, nutrition strongly affects the parameters of
the individual patterns in the Medfly experiments (Carey
et al., 1998b). A flat averaged pattern of fecundity was
developed when the flies were fed with sugar until day 60
or 90 and thereafter fed protein additionally. The
probable cause of the phenomenon is that these long-
living flies are ‘slow’ in egg-laying and thus in providing
‘long’ individual fecundity patterns. A small variance in
the duration of a constant fecundity phase in individuals
in respect to the mean value may result in a ‘flat’ mean-
population pattern.
The individual form of a pattern proved to be useful
in analysing the causes of death in flies. In particular,
early reproduction-related deaths persist in evolution
because they may represent the minimum noise level in
the organism’s signal transduction system, which under-
lies the organism’s energy allocation into different
components. This may come via the mechanisms
described by Elowitz et al. (2002) and Swain et al.
(2002). These authors suppose that ‘intrinsic’ and
‘extrinsic’ noises are responsible for the phenotypic
variation. The heterogeneity in individual fecundity in
this study is treated analogously, due to the Gaussian
noise in a plateau level and the exponentially distributed
noise in the other parameters (see Fig. 7).
What other results may be awaited when the indivi-
dual pattern is applied?
Fig. 11. Distributions of deaths in a 1000-fly population of medfly
females observed for egg-layers and non-egg layers (modified from
Carey et al., 1998a). The dashed line is for a bimodal distribution with
two maximums of adult age, one of about 10 days, and the other of
about 30 days (non-egg layers, N�/ 64). The solid line represents a
unimodal distribution of deaths for egg laying flies with the same
location of the maximum as the second one in non-egg layers (N�/
936).
V.N. Novoseltsev et al. / Mechanisms of Ageing and Development 124 (2003) 605�/617614

The parametric description itself is a powerful tool of
investigation. We anticipate that individual fecundity
patterns will find a field of application in analysing
different life history traits and trade-offs, includingreproductive and mortality costs. For example, the
trade-off may be described in terms of reproductive
effort (Williams, 1966). It represents the resources that
are allocated to the current reproductive events, whereas
residual reproductive value describes what is saved for
the future. Thus our reproductive capacity may serve as
a measure of the reproductive effort whereas the
duration of the maturity phase and the time constantof the tail may be used to measure residual reproductive
value. Trade-offs may be evaluated by the comparison
of these values. As no trade-offs between reproduction
and fecundity were found in Medflies by Muller et al.
(2001), the problem arises: is it possible to find them out
by using the parameterisation as suggested in this paper?
To answer this question, one needs to apply the three-
stage description to large populations of flies, forexample, to a 1000-fly population of Medflies (Carey
et al., 1998a).
Experimental studies on artificial selection devoted to
postponed senescence, reproduction at a ‘young’ or an
‘old’ age, and high or low adult mortality present the
other field of application. In particular, the researchers
use ‘early’ or ‘late’ fecundity indices to describe the
changes in the fecundity of the experimental population.In our view, it would be cleverer to use individual
indicators in these cases. Indeed, early fecundity could
be associated with the onset of reproduction and
reproductive capacity, whereas late fecundity could be
associated with the duration of the maturity stage and
especially with the tail time constant.
In the paper, the individual fecundity patterns are
parameterised with five parameters. In principle, morecomplicated descriptions are also possible, but the five
parameters are enough to grasp the three main stages,
thus, admitting the usage of the description in different
studies. Of special interest is the exponential tail of the
pattern, which allows us to view ageing in flies as related
to the classical problem of vitality decline (Strehler and
Mildwan, 1960; Rose, 1991; Novoseltsev et al., sub-
mitted for publication, J. Gerontol.).This approach opens a new avenue in the studies of
genetic aspects of fecundity. Each parameter involved in
a description of the individual fecundity pattern may be
genetically endowed. To test this, hypothesis-specific
genetic analysis is needed. This analysis can be per-
formed in a similar way to that utilised in genetic studies
of life span (Curtsinger et al., 1995; Mylnikov and
Smirnova, 1997).The specificity of this approach is that we describe the
accumulation of oxidative damage as a factor directly
affecting the homeostatic capacity of an individual.
Thus the approach can be called a homeostenotic
modelling of ageing. This emphasises its close relation
to homeostenosis, a fundamental notion of the bioger-
ontology and physiology of ageing: a progressive decline
in the capacity to maintain homeostasis in the face ofchallenges in each system of an organism (Troncale,
1996).
This model can be applied to the data on different
regimes of diet and reproduction (Carey et al., 1998b).
Although this work was not possible to perform in the
framework of this study one may speculate which model
parameters may respond to changes in these factors. We
expect that changes in both dietary conditions andreproductive output will modulate the rate of decline
in homeostatic capacity (relative rate of individual
aging) described by index R (t) in Eq. (2). Dietary
conditions are likely to influence the rate of decline in
fecundity with age. The host deprivation in medflies
(which prevents egg-laying) in case of ad lib food is
likely to decrease R (t) and hence increase the mean and
maximum life span in respective population of medflies.Analysis of such changes in model parameters may help
to better understand the mechanism of trade-off con-
necting aging and reproduction in fruit flies.
Trade-offs play an essential role in evolutionary
approach to ageing (Sgro and Partridge, 1999; Kirk-
wood, 2002). In general, the relative importance of an
energetic mechanism is ‘a central unresolved issue in
trade-off physiology’ (Zera and Harshman, 2001). Theindividual pattern of fecundity in a fly has a close
relationship to the power allocation and trade-offs. The
detailed analysis of how this pattern is formed and how
it is linked to longevity will help researchers to better
understand the insects’ life history and shed light on the
mechanisms of reproductive senescence and the occur-
rence of death.
Acknowledgements
The authors thank James W. Vaupel for the oppor-
tunity to complete this work at the Max Planck Institute
for Demographic Research, Dr Blay and Dr Yuval forpresenting their rough data on individual fecundity in
medflies, and the anonymous referees for the high
evaluation of the paper. We are also thankful to Jenae
Tharaldson for reading it. The work on the paper was
partly supported by NIH/NIA grant PO1 AG08761-01.
References
Ackermann, M., Bijsma, R., James, A.C., Partridge, L., Zwaan, B.J.,
Stearns, S.C., 2001. Effects of assay conditions in life history
experiments with Drosophila melanogaster . J. Evol. Biol. 14, 199�/
209.
V.N. Novoseltsev et al. / Mechanisms of Ageing and Development 124 (2003) 605�/617 615

Aigaki, T., Ohba, S., 1984. Individual analysis of age-associated
changes in reproductive activity and lifespan of Drosophila virilis .
Exp. Gerontol. 19, 13�/23.
Alujaa, M., Liedo, P. (Eds.), Fruit Flies: Biology and Management.
Springer, New York 1993.
Arking, R., 1987. Genetic and environmental determinants of long-
evity in Drosophila . In: Woodhead, A.D., Thompson, K.H. (Eds.),
Evolution of Longevity in Animals. Plenum Press, New York and
London, pp. 1�/22.
Arking, R., Burde, V., Graves, K., Hari, R., Feldman, E., Zeevi, A.,
Soliman, S., Saraiya, A., Buck, S., Vettraino, J., Sathrasala, K.,
Wehr, N., Levine, R.L., 2000. Forward and reverse selection for
longevity in Drosophila is characterized by alteration of antiox-
idant gene expression and oxidative damage patterns. Exp.
Gerontol. 35, 167�/185.
Bell, G., Koufopanou, V., 1985. The cost of reproduction. In:
Dawkins, R., Ridley, M. (Eds.), Oxford Surveys in Evolutionary
Biology, vol. 3. Oxford University Press, pp. 83�/131.
Bennett, A.F., 1991. The evolution of activity capacity. J. Exp. Biol.
160, 1�/23.
Blay, S., Yuval, B., 1999. Oviposition and fertility in the Mediterra-
nean fruit fly (Diptera: Tephntidae): effect of male and female body
size and the availability of sperm. Ann. Entomol. Soc. Am. 92,
278�/284.
Bonduriansky, R., Brooks, R.J., 1999. Reproductive allocation and
reproductive ecology of seven species of Diptera. Ecol. Entomol.
24, 389�/395.
Brown, J.H., Marquet, P.A., Taper, M.L., 1993. Evolution of body-
size*/consequences of an energetic definition of fitness. Am. Nat.
142, 573�/584.
Bui, Q.T., Zimmerman, J.E., Liu, H., Gray-Board, G.L., Bonini,
N.M., 2000. Functional analysis of an eye enhancer of the
Drosophila eyes absent gene: differential regulation by eye speci-
fication genes. Dev. Biol. 221, 355�/364.
Carey, J.R., Liedo, P., Muller, H.-G., Wang, J.-L., Chiou, J.M., 1998a.
Relationship of age patterns of fecundity to mortality, longevity,
and lifetime reproduction in a large cohort of Mediterranean fruit
fly females. J. Gerontol. 53A, B245�/B251.
Carey, J.R., Liedo, P., Muller, H.-G., Wang, J.-L., Vaupel, J.W.,
1998b. Dual modes of aging in Mediterranean fruit fly females.
Science 281, 996�/998.
Carlson, K.A., Harshman, L.G., 1999. Extended longevity lines of
Drosophila melanogaster : characterization of oocyte stages and
ovariole numbers as a function of age and diet. J. Gerontol. 54A,
B432�/B440.
Carlson, K.A., Nusbaum, T.J., Rose, M.R., Harshman, L.G., 1998.
Oocyte maturation and ovariole number in lines of Drosophila
melanogaster selected for postponed senescence. Funct. Ecol. 12,
514�/520.
Chapman, T., Miyatake, T., Smith, H.K., Partridge, L., 1998.
Interactions of mating, egg production and death rates in females
of the Mediterranean fruit fly, Ceratitis capitata . Proc. R. Soc.
Lond.: Biol. Sci. 265, 1879�/1894.
Chippindale, A.K., Leroi, A.M., Kim, S.B., Rose, M., 1993. Pheno-
typic plasticity and selection in Drosophila life-history evolution. I.
Nutrition and the cost of reproduction. J. Evol. Biol. 6, 171�/193.
Cichon, M., 2001. Diversity of age-specific reproductive rates may
result from ageing and optimal resource allocation. J. Evol. Ecol.
14, 180�/185.
Curtsinger, J.W., Fukui, H.H., Khazaeli, A.A., Kirscher, A., Pletcher,
S.D., Promislow, D.E.L., Tatar, M., 1995. Genetic variation and
aging. Annu. Rev. Gen. 29, 553�/575.
de Jong, G., 1993. Covariances between traits deriving from successive
allocations of a resource. Funct. Ecol. 7, 75�/83.
de Jong, G., van Noordwijk, A.J., 1992. Acquisition and allocation of
resources*/genetic (co)variances, selection and life histories. Am.
Nat. 139, 749�/770.
Djawdan, M., Sugiyama, T.T., Shlaeger, L.K., Bradley, T.J., Rose,
M., 1996. Metabolic aspects of the trade-off between fecundity and
longevity in Drosophila melanogaster . Physiol. Zool. 69, 1176�/
1195.
Elowitz, M.B., Levine, A.J., Siggia, E.G., Swain, P.S., 2002. Stochastic
gene expression in a single cell. Science 297, 1183�/1186.
Fries, J.F., 1980. Aging, natural death and the compression of
morbidity. New Engl. J. Med. 303, 130�/135.
Gadgil, M., Bossert, W.H., 1970. Life historical consequences of
natural selection. Am. Nat. 104, 1�/24.
Harshman, L.G., Hoffmann, A.A., 2000. Laboratory selection experi-
ments using Drosophila : what do they really tell us. TREE 15, 32�/
36.
Hayflick, L., 1998. How and why we age. Exp. Gerontol. 33, 639�/653.
Jones, J.H., Lindstedt, S.L., 1993. Limits to maximal performance.
Annu. Rev. Physiol. 55, 547�/569.
Kiniry, J.R., 1993. Nonstructural carbohydrate utilization by wheat
shaded during grain growth. Agron. J. 85, 844�/849.
Kirkwood, T.B.L., 1977. Evolution of aging. Nature 270, 301�/304.
Kirkwood, T.B.L., 1990. The disposable soma theory of aging. In:
Harrison, D.E. (Ed.), Genetic Effects on Aging II. Caldwell, NJ,
pp. 9�/19.
Kirkwood, T.B.L., 2002. Evolution of ageing. Mech. Age Dev. 123,
737�/745.
Lawrence, P.O., 1993. Egg development in Anastrepha suspensa :
influence of the ecdysone agonist, RH 5849. In: Alujaa, M., Liedo,
P. (Eds.), Fruit Flies: Biology and Management. Springer, New
York.
Lin, H., Spradling, A., 1993. Germline stem cell division and egg
chamber development in Drosophila germaria . Dev. Biol. 159,
140�/152.
Lints, F.A., Lints, C.V., 1968. Respiration in Drosophila . II. Respira-
tion in relation to age by wild, inbred and hybrid Drosophila
melanogaster images. Exp. Gerontol. 3, 341�/349.
Luckinbill, L.S., Arking, R., Clare, M.J., Cicocco, W.C., Buck, S.A.,
1984. Selection for delayed senescence in Drosophila melanogaster .
Evolution 38, 996�/1003.
Marden, J.H., 2000. Variability in size, composition, and function of
insect flight muscles. Annu. Rev. Physiol. 62, 157�/178.
Markow, T.A., 1996. Evolution of Drosophila mating system. Evol.
Biol. 29, 73�/106.
Miller, R.A., 1999. Kleemeier award lecture: are there genes for aging.
J. Gerontol. 54, B297�/B307.
Muller, H.G., Carey, J.R., Wu, D.Q., Liedo, P., Vaupel, J.W., 2001.
Reproductive potential predicts longevity of female Mediterranean
fruitflies. Proc. R. Soc. Lond.: Ser. B 268, 445�/450.
Mylnikov, S.V., Smirnova, A.N., 1997. Estimating heritability of basic
parameters of aging in Drosophila melanogaster . Genetica 33, 616�/
622.
Novoseltsev, V.N., Carey, J., Liedo, P., Novoseltseva, J.A., Yashin,
A.I., 2000. Anticipation of oxidative damage decelerates aging in
virgin female medflies: a hypothesis tested by statistical modeling.
Exp. Gerontol. 35, 971�/987.
Novoseltsev, V.N., Novoseltseva, J.A., Yashin, A.I., 2001. A homeo-
static model of oxidative damage explains paradoxes observed in
earlier aging experiments: fusion and extension of older theories of
aging. Biogerontology 2, 127�/138.
Novoseltsev, V.N., Arking, R., Novoseltseva, J.A., Yashin, A.I., 2002.
Evolutionary optimality applied to Drosophila experiments: hy-
pothesis of constrained reproductive efficiency. Evolution 56,
1136�/1149.
Papadopoulos, N.T., Carey, J.R., Katsoyannis, B.I., Koulossis, N.A.,
Muller, H.-G., Liu, X.L., 2002. Supine behaviour predicts the time
to death in make Mediterranean fruit flies (Ceratitis capitata ).
Proc. R. Soc. Lond.: Biol. Sci. 269, 1633�/1637.
V.N. Novoseltsev et al. / Mechanisms of Ageing and Development 124 (2003) 605�/617616

Partridge, L., 1986. Sexual activity and life span. In: Collatz, K.-G.,
Sohal, R.S. (Eds.), Insect Aging. Strategies and Mechanisms.
Springer, pp. 45�/54.
Partridge, L., Barton, N., 1993. Evolution of aging: testing the theory
using Drosophila . Genetica 91, 89�/98.
Partridge, L., Fowler, K., 1992. Direct and correlated responses to
selection on age at reproduction in Drosophila melanogaster .
Evolution 46, 76�/91.
Partridge, L., Gems, D., 2002. The evolution of longevity. Curr. Biol.
12, R544�/R546.
Pitnick, S., Markow, T.A., Spicer, G., 1995. Delayed male maturity is
a cost of producing large sperm in Drosophila . Proc. Natl. Acad.
Sci. 92, 10614�/10618.
Pretzlaff, R., Arking, R., 1989. Patterns of amino acid incorporation in
long-lived genetic strains of Drosophila melanogaster . Exp. Ger-
ontol. 24, 67�/81.
Reznick, D., 1985. Cost of reproduction: en evaluation of empirical
evidence. Oicos 44, 257�/267.
Reznick, D., Nunney, L., Tessier, A., 2000. Big houses, big cars,
superfleas and the costs of reproduction. TREE 15, 421�/425.
Riemann, J.G., Thorson, B.J., 1969. The effect of male accessory
material on oviposition and mating by female houseflies. Ann.
Entomol. Soc. Am. 62, 828�/834.
Robertson, F.W., 1957. Studies in quantitative inheritance. X. Genetic
variations in ovary size in Drosophila . J. Genet. 55, 410�/427.
Roper, C., Pignatelli, P., Partridge, L., 1993. Evolutionary effects of
selection on age at reproduction in larval and adult Drosophila
melanogaster . Evolution 47, 445�/455.
Rose, M.R., 1984. Laboratory evolution of postponed senescence in
Drosophila melanogaster . Evolution 38, 1004�/1010.
Rose, M.R., 1991. Evolutionary Biology of Aging. Oxford University
Press, Oxford, New York.
Sakai, S., Harada, Y., 2001. Sink limitation and size�/number trade-
offs of organs: production of organs using a fixed amount of
reserves. Evolution 55, 467�/476.
Salazar-Ciudad, I., Newman, S.A., Sole, R.V., 2001. Phenotypic and
dynamical transitions in model genetic networks I. Emergence of
patterns and genotype�/phenotype relationships. Evol. Dev. 3, 84�/
94.
Sgro, C.M., Partridge, L., 1999. A delayed wave of death from
reproduction in Drosophila . Science 286, 2521�/2524.
Shanley, D.P., Kirkwood, T.B.L., 2000. Calorie restriction and aging:
a life-history analysis. Evolution 54, 740�/750.
Shelley, T.E., 2000. Fecundity of female oriental fruit flies (Diptera:
Tephriditae): effects of methyl eugenol-fed and multiple mates.
Ann. Entomol. Soc. Am. 93, 559�/564.
Sohal, R.S., 1986. The rate of living theory: a contemporary
interpretation. In: Collatz, K.-G., Sohal, R.S. (Eds.), Insect Aging.
Strategies and Mechanisms. Springer, pp. 23�/43.
Spencer, J.L., Miller, J.R., 2002. Lifetime ovipositional patterns of
mated and virgin onion flies, Delia antiqua (Diptera: Anthomyii-
dae). J. Insect Physiol. 48, 171�/180.
Stearns, S.C., Ackermann, M., Doebeli, M., Kaiser, M., 2000.
Experimental evolution of aging, growth, and reproduction in fruit
flies. Proc. Natl. Acad. Sci. 97, 3309�/3313.
Strehler, B.L., Mildwan, A.S., 1960. General theory of mortality and
aging. Science 132, 14�/21.
Suarez, R.K., 1996. Upper limits to mass-specific metabolic rates.
Annu. Rev. Physiol. 58, 583�/605.
Swain, P.S., Elowitz, M.B., Siggia, E.G., 2002. Intrinsic and extrincic
contributions to stochasticity in gene expression. Proc. Natl. Acad.
Sci. 99, 12795�/12800.
Troncale, J.A., 1996. The aging process. Physiologic changes and
pharmacologic implications. Postgrad. Med. 99 111�/114, 120�/122.
Ukraintseva, S.V., Yashin, A.I., 2001. How individual age-associated
changes may influence human morbidity and mortality patterns.
Mech. Age Dev. 122, 1447�/1460.
van Noordwijk, A.J., de Jong, G., 1986. Acquisition and allocation of
resources: their influence on variation in life history tactics. Am.
Nat. 128, 137�/142.
Whittier, T.S., Shelley, T.E., 1993. Productivity of singly vs. multiply
mated female Mediterranean fruit flies (Diptera, Tephritidae). J.
Kansas Entomol. Soc. 66, 200�/209.
Williams, G.C., 1966. Natural selection, the cost of reproduction and a
refinement of Lack’s principle. Am. Nat. 100, 687�/690.
Zera, A.J., Harshman, L.G., 2001. The physiology of life history trade-
offs in animals. Annu. Rev. Ecol. Syst. 32, 95�/126.
V.N. Novoseltsev et al. / Mechanisms of Ageing and Development 124 (2003) 605�/617 617