What are the chances……
51
What are the chances…… What are the chances……
-
Upload
priscilla-hunt -
Category
Documents
-
view
36 -
download
1
description
What are the chances……. Of winning a football game?. Of getting Bingo?. Of a coin landing on tails twice after being flipped twice?. Of winning a race?. What are the chances of finding a magic lamp with a genie inside?. How about swimming with mermaids?. Is there a chance of a snow day?. - PowerPoint PPT Presentation
Transcript of What are the chances……
What are the What are the chances……chances……

Of winning a football game?
Of getting Bingo?
Of a coin landing on tails twice after being flipped twice?
Of winning a race?

What are the chances of finding a magic lamp with a
genie inside?
Is there a chance of a snow day?
PROBABILITY IS EVERYWHERE!!!!!
!
How about swimming with mermaids?

•Define probability •Determine if a game is “fair” •Calculate theoretical and experimental probability •Conduct an experiment •Display the results •Use a tree diagram to help solve probability problems •Complete the PROBABILITY FINAL PROJECT

Probability Check List You are responsible for the following
activities and they should be handed in all together. Complete Fraction Review Page
Complete “Probability 1” Complete Penny Game Table Complete “Probability 2” Complete Rock-Paper-Scissor
Complete Final Project

WHAT IS WHAT IS PROBABILITY?PROBABILITY?
Probability is the likelihood that an event will occur.
What is the probability of landing on red?
What are the chances of landing on a shade of green?

In a perfect world, teams would all be equal in size,
talent and ability.
What things can impact the probability of winning a game?

What are the chances that the sun will set tonight?
What are the chances that you will roll a 7 on a 6-sided die?
What are the chances of it raining on Sunday?
ChanceChance is the possibility of an is the possibility of an outcome in a certain event. outcome in a certain event. An An eventevent is a happening or occurrence. is a happening or occurrence.
An An outcomeoutcome is a result of an event. is a result of an event.

The probability of The probability of the Chiefs winning the Chiefs winning
the Super Bowl the Super Bowl is .03……is .03…… OR IS IT?????OR IS IT?????
MORE IMPORTANTLY: MORE IMPORTANTLY:
WHAT DOES THAT WHAT DOES THAT MEAN?????MEAN?????
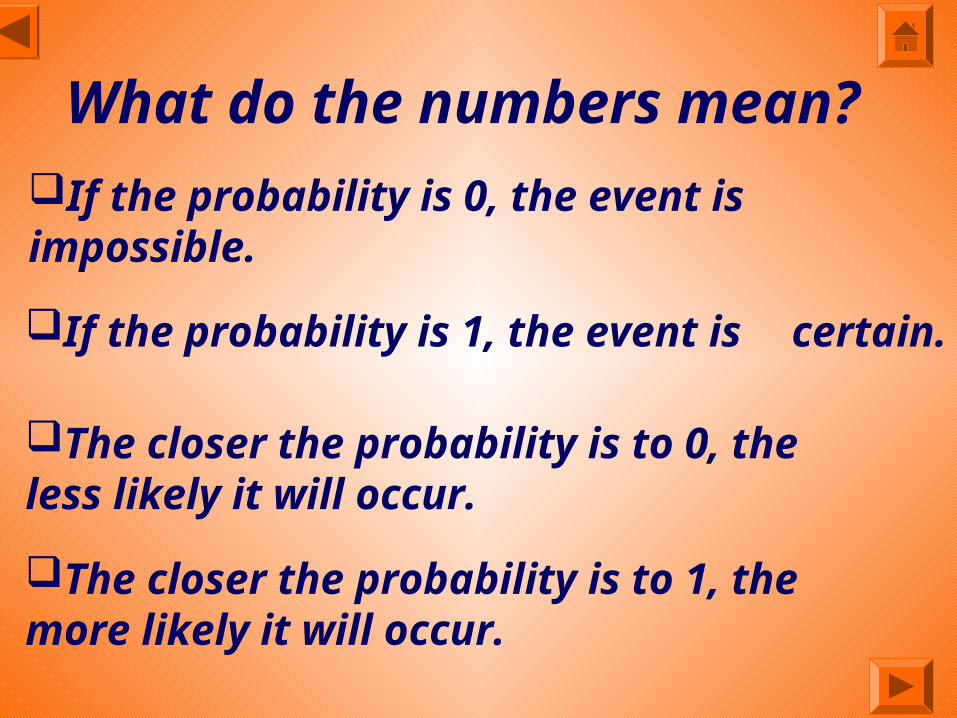
What do the numbers mean?If the probability is 0, the event is
impossible.
The closer the probability is to 1, the more likely it will occur.
The closer the probability is to 0, the less likely it will occur.
If the probability is 1, the event is certain.
So what does that mean for the Kansas City
Chiefs?With a probability of .03, it is not likely that they will win the Super Bowl this year.
Keep in mind that this is assuming all teams have an equal chance of winning the Super Bowl,
but do they????????

How can probabilities be written?
As a fraction: ¼
As a decimal: .25
As a percent: 25%


We better review! Use the links below to review
fractions, decimals and percents.
Change a fraction to a percent
Change a decimal to a percent
Simplify Fractions
Change a fraction to a decimal
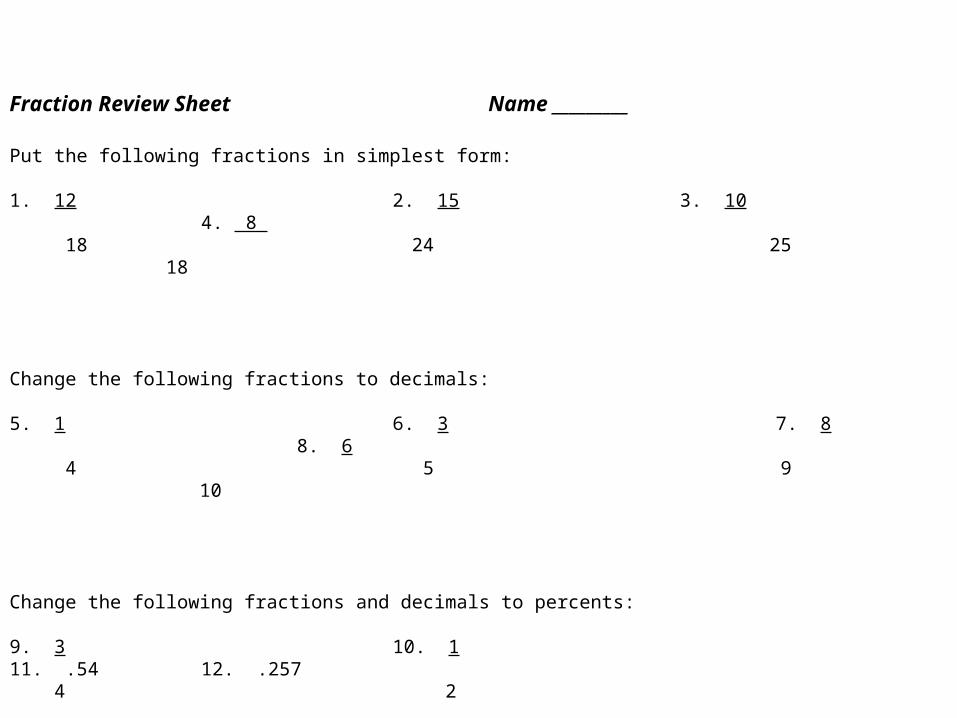
Fraction Review Sheet
Complete fraction review sheet

Fraction Review Sheet Name _________ Put the following fractions in simplest form: 1. 12 2. 15 3. 10
4. 8 18 24 25 18 Change the following fractions to decimals: 5. 1 6. 3 7. 8
8. 6 4 5 9 10 Change the following fractions and decimals to percents: 9. 3 10. 1 11. .54
12. .257 4 2

Flipping a penny and it lands on tails?
Use the spinner and land on red?
Rolling a 6-sided die and getting a 5?
ProbabilityNext Slide 1

• PROBABILITY 1
Name_________
• • 1. You roll a 6-sided die. • a. What is the probability that you will
roll a 4? • P (4) = • • b. What is the probability that you will roll
a 2 or 5?• P (2 or 5) = • • c. What is the probability that you will roll
an even number?
• P (Even) = You spin the spinner at the right.
• d. What is the probability of landing on green?
• P (green) =
• a. What is the probability of not landing on yellow?
• P (not yellow) = • • b. What is the probability of landing on blue
or red?• P (blue or red) = • • 2. You have a standard deck of 52 playing
cards. • a. What is the probability of picking a nine?• P (9) = • • b. What is the probability of picking a
diamond?• P (diamond) =• • c. What is the probability of picking a black
card?• P (black card) =• • d. What is the probability of picking a face
card?• P (face card) =•

How can we calculate How can we calculate probabilities?probabilities?
There are four common ways to calculate probabilities:
Make a guess
Conduct an experiment
Use a data table
Assume that all possible results have the same chance


Penny Game Directions:
Get a partner, a penny, and a game sheet
You are going to flip the penny two times.
If the coin lands tails up both times player A gets 1 point. Any other outcome, Player B gets 1 point.
GameNext Slide sheet

Player A:Player A: Player B:Player B:
Penny TrackingPenny Tracking
Rounds:Rounds: Flip #1Flip #1 Flip #2Flip #2
11
22
33
44
55
66
77
88
99
10 10

Do you think this game is fair?
A fair game is a game in which each player or team has the same chance of winning.
If any player or team has an advantage or disadvantage, then the game is not fair.

Rock
Paper
Scissors

HOW MANY POSSIBLE OUTCOMES ARE
THERE?We should display all the possibilities,
BUT HOW DO WE DO THAT???

Using a Table:
Player 1 Player 2
Rock Rock
Paper Rock
Scissor Rock
Rock Paper
Paper Paper
Scissor Paper
Rock Scissor
Paper Scissor
Scissor Scissor

USE A LIST
Rock-Rock Paper-RockScissor-Rock Rock-Paper Paper-Paper Scissor-Paper
Rock-Scissor Paper-Scissor Scissor-Scissor

USE A TREE DIAGRAM
Rock Paper Scissor
Rock
Rock
Rock
Paper
Paper
Paper
Scissors
Scissors
Scissors

What is the probability that you will win at Rock Paper
Scissor?Let’s look at the possible outcomes from our tree
diagram
Scissor-Scissor
Scissor-PaperScissor-
Rock
Paper-Scissor
Rock-Rock
Paper-PaperPaper-Rock
Rock-Scissor
Rock-Paper
You could win 3 different ways

How many possible outcomes did we find in our tree diagram???tree
How many times could we win?
Now we turn what we know into a fraction: P (winning) =
Number of times we could winTotal possible outcomes

P(winning)=3
9
The chances of events happening as determined by calculating results that would occur under ideal circumstances.
Is that in simplest form???
1
3=
Theoretical Probability

QUESTION: If you flip a coin twice how many possible
outcomes are there? (Use a tree diagram to show these outcomes)
When you are ready complete “Probability 2”
Probability

POBABILITY 2 Name ___________
1. You flip a coin three times. Use a table, list or tree diagram to display the total number of outcomes. 2. You roll a 6-sided die twice. Use a table, list or tree diagram to display the total number of outcomes.

Experimental Probability:
The chances of something happening, based on repeated testing and
observing results. It is the ratio of the number of times an event occurred to
the number of times tested.

You will be playing with a partner and recording the results on the Rock, Paper, Scissor Data Table.
Rock-Paper-Scissor Data Table

Let’s Compare
Our theoretical probability was 1/3.
What was your experimental probability?

Let’s Look at An Let’s Look at An ExampleExample
Miss M and Mrs. D’s
Game Table
Based on their results what is the probability of Miss M
winning?2 out of 10Based on their results what is
the probability of Mrs. D winning?
4 out of 10
Based on their results what is the probability of it being a tie?
4 out of 10
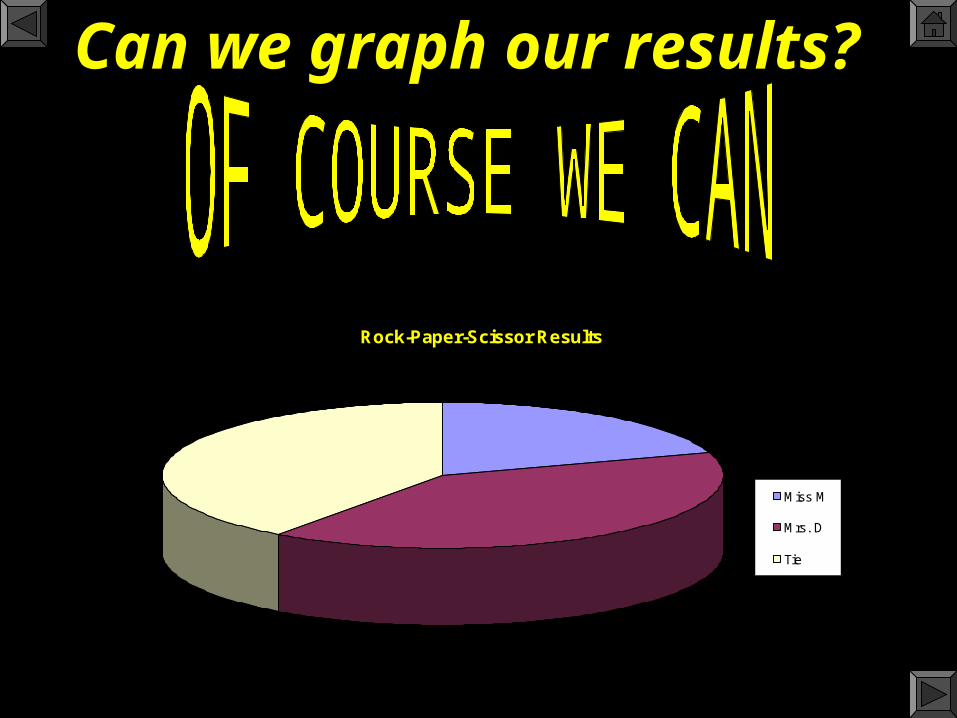
Can we graph our results?
Rock-Paper-Scissor Results
Miss M
Mrs. D
Tie

Rock-Paper-Scissor Results
2
4 4
0
0.5
1
1.5
2
2.5
3
3.5
4
4.5
Miss M Mrs. D Tie
How About How About a Bar a Bar
Graph???Graph???

Let’s Think
What things might influence our experimental probability?

LET’S WRAP UP!What is probability?
How can we represent the possible outcomes?
Are all games fair?
What is difference between theoretical and experimental probability?
Is Probability Fun?

1. Design a two-player game- It may use coins, dice, spinners, etc.
2. Collect data (table)
3. Display data (Graph)
4. Conduct analysis of game ( tree diagram)
5. Explain why your game is or is not fair
6. Include a peer-review from a classmate
FINAL PROJECT

Probability Check List These are the assignments that need to be
handed in. Use the buttons on the right to take you back to the corresponding pages.
Complete Fraction Review Page Complete “Probability 1” Complete Penny Game Table Complete “Probability 2” Complete Rock-Paper-Scissor
Complete Final Project
F
P1
G
P2
R
P

Adapted from http://www.nynetresources.org/Future%20Grant%20Projects/Projects/Probability/PROBABILITYClip Art http://www.csun.edu/~hcmth014/comics.html - Peanut Comic Strips http://clipartuniverse.com/free-animation.shtml -
Bingo pic, penny guy, runner, penny flip http://www.animationcity.net/animcity.htm
dice http://dgl.microsoft.com/?CAG=1
rain, balance
http://disneyclipart.com
genie, flounder

Sound files http://soundamerica.com Peanuts theme song- jeopardy- Monday night football
Text
Everyday Learning Corporation. Everyday Mathematics: Student Reference Book. Everyday Learning. Chicago,
Illinois,1998.

Photos
http://dgl.microsoft.com/?CAG=1 sunset
Fraction Review Sheet Name _________ Put the following fractions in simplest form: 1. 12 2. 15 3. 10
4. 8 18 24 25 18 Change the following fractions to decimals: 5. 1 6. 3 7. 8
8. 6 4 5 9 10 Change the following fractions and decimals to percents: 9. 3 10. 1 11. .54
12. .257 4 2

Player A:Player A: Player B:Player B:
Penny TrackingPenny Tracking
Rounds:Rounds: Flip #1Flip #1 Flip #2Flip #2
11
22
33
44
55
66
77
88
99
10 10

POBABILITY 2 Name ___________
1. You flip a coin three times. Use a table, list or tree diagram to display the total number of outcomes. 2. You roll a 6-sided die twice. Use a table, list or tree diagram to display the total number of outcomes.

Rock-Paper-ScissorRock-Paper-ScissorDuring each round you need to record each players During each round you need to record each players signal and who won that round. Use “T” if there is signal and who won that round. Use “T” if there is
a tie.a tie.Rules: Rules: Rocks beat scissor Rocks beat scissor
Paper beats rockPaper beats rockScissor beats paperScissor beats paper
Game TrackingGame Tracking
Rounds:Rounds: Player APlayer A Player BPlayer B Who won:Who won:
ExampleExample ScissorScissor RockRock BB
11
22
33
44
55
66
77
88
99
10 10

Rock-Paper-ScissorRock-Paper-ScissorDuring each round you need to record each players signal and who During each round you need to record each players signal and who
won that round. Use “T” if there is a tie.won that round. Use “T” if there is a tie.Rules: Rules: Rocks beat scissor Rocks beat scissor
Paper beats rockPaper beats rockScissor beats paperScissor beats paper
Game TrackingGame TrackingRounds:Rounds: Player A: Miss MPlayer A: Miss M Player B: Mrs. DPlayer B: Mrs. D Who won:Who won:
ExampleExample ScissorScissor RockRock BB
11 RR PP Mrs. DMrs. D
22 SS RR Mrs. DMrs. D
33 RR RR TT
44 PP PP TT
55 PP SS Miss MMiss M
66 RR PP Mrs. DMrs. D
77 RR PP Mrs. DMrs. D
88 SS SS TT
99 PP RR Miss MMiss M
10 10 PP PP TT