What a successful grasp tells about the success chances of … · 2012. 11. 30. · What a...
8
What a successful grasp tells about the success chances of grasps in its vicinity Leon Bodenhagen, Renaud Detry, Justus Piater and Norbert Kr¨ uger Abstract—Infants gradually improve their grasping competences, both in terms of motor abilities as well as in terms of the internal shape grasp representations. Grasp densities [3] provide a statistical model of such an internal learning process. In the concept of grasp densities, kernel density estimation is used based on a six-dimensional kernel representing grasps with given position and orientation. For this so far an isotropic kernel has been used which exact shape have only been weakly justified. Instead in this paper, we use an anisotropic kernel that is statistically based on measured conditional probabilities representing grasp success in the neighborhood of a successful grasp. The anisotropy has been determined utilizing a simulation environment that allowed for evaluation of large scale experiments. The anisotropic kernel has been fitted to the conditional probabilities obtained from the experiments. We then show that convergence is an important prob- lem associated with the grasp density approach and we propose a measure for the convergence of the densities. In this context, we show that the use of the statistically grounded anisotropic kernels leads to a significantly faster convergence of grasp densities. I. I NTRODUCTION When using already made grasping experience with a specific object there is no way to repeat the exactly same grasp due to uncertainties on pose estimation as well as the actual grasping process as such. Hence assumptions about grasps likely to be successful in the vicinity of grasps already tested and memorized are required even when exactly the same grasp is repeated for the same object in a new situation. To tackle this, recently the concept of grasp densities [3] has been introduced which describes grasp affor- dances associated with specific objects in a probabilis- tic way. It is based on a kernel density estimation [9] in which the success likelihood of already tried grasps is described by 6-dimensional kernels (illustrated in figure 1 bottom left). The set of all grasp affordances associated with an object can then be expressed as the sum of these spatially extended 6D kernels (see figure 1 top right). Grasp densities have proven very useful in applications since they allow for the formulation of optimal grasps under constraints (see figure 2). In addi- tion, since grasp densities reflect success likelihoods of each grasp, these can be used in higher level processes such as action sequence planning. L. Bodenhagen and N. Kr¨ uger are at University of Southern Den- mark. Email: [email protected] R. Detry is at the Royal Institute of Technology, Sweden J. Piater is at the University of Innsbruck, Austria Fig. 1: Illustration of the parallel-jaw gripper (top left) and the 6D-kernel associated with the grasp (bottom left). And a visualization of a grasp density associated with an artificial object (top right). The left part shows all kernels, the right part only 10% of the kernels in order to provide a better overview. The original object is shown at the bottom (right). However, currently two severe problems exist when using grasp densities. First, the exact shape of the kernels being used in previous work is only weakly motivated and is in particular isotropic (see figure 1 bottom left). Nonetheless high structural dependencies can be assumed to exist in the space of grasps as- sociated with objects due to the intrinsic regularities of objects. The understanding of these regularities and how they can be expressed in kernels is an interesting topic in itself. In this context the first contribution of our paper is to give a statistical justification of the shape of the success likelihood of grasps in the vicinity of already successfully tested grasps. This is done by means of statistically derived conditional probabilities in grasp simulations. As we will show in this paper, a second problem of the grasp density approach [3] is a rather slow convergence of the algorithm when the complete set of affordances is supposed to be represented as it requires a large set of grasp attempts. In this paper we give evidence that by using the statistically derived anisotropic kernel, we can speed up the convergence of the algorithm significantly. The paper is structured as following. In section II, we introduce basic notations and methods used in this paper. In section III, we introduce the results on our statistics which motivate the choice of a new anisotropic kernel. The adaption of the new anisotropic kernel to the statistical results is outlined in section III
Transcript of What a successful grasp tells about the success chances of … · 2012. 11. 30. · What a...

What a successful grasp tells about thesuccess chances of grasps in its vicinity
Leon Bodenhagen, Renaud Detry, Justus Piater and Norbert Kruger
Abstract—Infants gradually improve their graspingcompetences, both in terms of motor abilities as wellas in terms of the internal shape grasp representations.Grasp densities [3] provide a statistical model of suchan internal learning process. In the concept of graspdensities, kernel density estimation is used based on asix-dimensional kernel representing grasps with givenposition and orientation. For this so far an isotropickernel has been used which exact shape have onlybeen weakly justified. Instead in this paper, we use ananisotropic kernel that is statistically based on measuredconditional probabilities representing grasp success inthe neighborhood of a successful grasp. The anisotropyhas been determined utilizing a simulation environmentthat allowed for evaluation of large scale experiments.The anisotropic kernel has been fitted to the conditionalprobabilities obtained from the experiments.
We then show that convergence is an important prob-lem associated with the grasp density approach and wepropose a measure for the convergence of the densities.In this context, we show that the use of the statisticallygrounded anisotropic kernels leads to a significantlyfaster convergence of grasp densities.
I. INTRODUCTION
When using already made grasping experience witha specific object there is no way to repeat the exactlysame grasp due to uncertainties on pose estimation aswell as the actual grasping process as such. Henceassumptions about grasps likely to be successful in thevicinity of grasps already tested and memorized arerequired even when exactly the same grasp is repeatedfor the same object in a new situation.
To tackle this, recently the concept of grasp densities[3] has been introduced which describes grasp affor-dances associated with specific objects in a probabilis-tic way. It is based on a kernel density estimation [9]in which the success likelihood of already tried graspsis described by 6-dimensional kernels (illustrated infigure 1 bottom left). The set of all grasp affordancesassociated with an object can then be expressed as thesum of these spatially extended 6D kernels (see figure1 top right). Grasp densities have proven very usefulin applications since they allow for the formulation ofoptimal grasps under constraints (see figure 2). In addi-tion, since grasp densities reflect success likelihoods ofeach grasp, these can be used in higher level processessuch as action sequence planning.
L. Bodenhagen and N. Kruger are at University of Southern Den-mark. Email: [email protected]. Detry is at the Royal Institute of Technology, SwedenJ. Piater is at the University of Innsbruck, Austria
Fig. 1: Illustration of the parallel-jaw gripper (top left)and the 6D-kernel associated with the grasp (bottomleft). And a visualization of a grasp density associatedwith an artificial object (top right). The left part showsall kernels, the right part only 10% of the kernels inorder to provide a better overview. The original objectis shown at the bottom (right).
However, currently two severe problems exist whenusing grasp densities. First, the exact shape of thekernels being used in previous work is only weaklymotivated and is in particular isotropic (see figure 1bottom left). Nonetheless high structural dependenciescan be assumed to exist in the space of grasps as-sociated with objects due to the intrinsic regularitiesof objects. The understanding of these regularities andhow they can be expressed in kernels is an interestingtopic in itself. In this context the first contribution ofour paper is to give a statistical justification of theshape of the success likelihood of grasps in the vicinityof already successfully tested grasps. This is done bymeans of statistically derived conditional probabilitiesin grasp simulations.
As we will show in this paper, a second problemof the grasp density approach [3] is a rather slowconvergence of the algorithm when the complete setof affordances is supposed to be represented as itrequires a large set of grasp attempts. In this paperwe give evidence that by using the statistically derivedanisotropic kernel, we can speed up the convergenceof the algorithm significantly.
The paper is structured as following. In sectionII, we introduce basic notations and methods usedin this paper. In section III, we introduce the resultson our statistics which motivate the choice of a newanisotropic kernel. The adaption of the new anisotropickernel to the statistical results is outlined in section III

Fig. 2: Grasp success likelihoods learned by meansof exploration are represented in green. A local max-imum indicates optimal grasp points. Constraints ofgraspability (e.g., on invoked by workspace constraintsas indicated by the sharp green border) can be easilyintegrated.
as well as its application to grasp density estimation.
II. METHODS
In the following we provide a detailed overview ofthe different methods used throughout this paper. Insection II-A our parametrization of grasping actionsis defined, the association from actions to objectsusing grasp densities is described in section II-B. Twodifferent designs for anisotropic kernels are outlinedin section II-C. The simulation environment whereinactions are performed is introduced in section II-Dand in section II-E the choice of bandwidths for anisotropic kernel is discussed.
A. Grasps and their transformations
A grasping action, A, is in this context defined as apoint in the special Euclidean space, A ∈ SE(3) anddefines the transformation from the object referenceframe to the tool which performs the grasp. In thiswork, the tool is considered to be a parallel fingergripper — the setup is illustrated in Fig. 3.
Based on a set of evaluated and successful grasps,S = {A1, . . . , An}, for one specific object it isinvestigated if a grasp still would be successful whenit becomes transformed locally:
P (TRBM (A) is successful|A is successful)
where TRBM (x) denotes a rigid body motion appliedto the action A, thus
TRBM : SE(3)→ SE(3)
Note that A and TRBM , although both elements ofSE(3) have two separate meanings, A representing agrasp and TRBM a rigid transformation.
The success of a transformed action, TRBM (A), isestimated by comparing it with all grasps in S usingthe grasp density (introduced in section II-B). To be
able to do a reasonable comparison it is required thatthe density covers the entire object. It is not feasibleto evaluate every TRBM (A) physically or even in asimulator as this still would be far too time consuming.
B. Grasp Densities
A grasp density models the distribution of successfulgrasps relative to an object. A density is defined as aprobability density function, pX|O=s (x), where X ∈SE(3) represents a gripper pose and O ∈ {s, f} isthe outcome of a grasp which can be either successor failure. The value of a grasp density at a concretepose x ∈ SE(3) is proportional to the likelihood of asuccessful grasp when the gripper is moved to this poseand closed. A typical applications for grasp densitiesis for example the search for a local maximum whichprovides the user with a grasp hypothesis with a highlikelihood of being successful (see figure 2). Externalconstraints, e.g. due limited workspace of a robot, caneasily be integrated by limiting the search space (seefigure 2).
A grasp density d(x) is estimated using kerneldensity estimation (see also [2], [9]):
d(x) =
n∑i=0
wiKµi,σ(x) (1)
where wi is a weight that compensated the impactof the sampling strategy. The kernel K is definedas a product of a trivariate Gaussian kernel, N, forthe position and a orientation kernel Θ defined onSO(3) by the von-Mises-Fisher distribution [5] (seealso figure 1):
Kµ,σ(x) = Nµt,σt(λ)Θµr,σr (θ) (2)
where
Θµr,σr (θ) =1
2C4(σr)
(eσr cos(β) + e−σr cos(β)
)(3)
β = cos−1(µTr θ
)(4)
where σt denotes the width of the kernel for theposition and σr denotes the width of the kernel for theorientation. Similar µt and µr denote the mean valuesin SE(3). λ and θ are the pure positional respectivelyorientional part of x = (λ, θ) — orientations are inall cases represented using quaternions. C4(σr) is aconstant which ensures that the density integrates toone. Note that Θµr,σr (θ) basically depends on theangle between two quaternions which is a scalar (forfurther details, see [3]).
C. Anisotropic kernels
One property of the kernel K as introduced inequation 2 and in more detail in [3] is that boththe position and the orientation are modeled isotropi-cally (see figure 1a). Different strategies to model ananisotropic kernel, K, which expresses the structuralproperties of successful grasps in a neighborhood have

been considered. Note that an anisotropic kernel canbe defined as a sum of multiple isotropic kernels withconstant widths:
KSµ,σ(x) =
m∑j=0
wjKµj ,σj (x) (5)
allowing for an approximation d(x) of d(x) by
d(x) =
n∑i=0
wiKSµ,σ(x) (6)
Although the approach in equation (5) is computa-tionally not optimal it can be used to investigate theimpact of using anisotropic kernels for the generationof grasp densities and it does not imply any restrictionon the shape of the anisotropic kernel.
The alternative is an analytic expression of Kµ,σ(x).Remembering that the value of original kernel usedfor the orientation is dependant on the angle betweentwo quaternions (see equation 3). This angle can beweighted which leads to the following formulation ofthe kernel:
Θµr,σr (θ) =1
2C4(σr)
(eσr cos(wµr (θ)β)
)+
1
2C4(σr)
(e−σr cos(wµr (θ)β)
) (7)
where the angle is weighted by wµ(θ), which is similarto Mahalanobis distance measure [8]:
wµr (θ) =
√(θ − 0)S−1Rµr (θ − 0)
′ (8)
where S is a diagonal matrix that describes a 4D-ellipsoid and Rµr represents the rotation that alignsthe ellipsoid with the mean-orientation of the kernel.Similarly the Gaussian kernel N can be defined usinga covariance matrix to use the Mahalanobis distancerather than the Euclidean. In this paper we describethe basis for such an approximation as outlined in thediscussion.
D. Simulator and SimulationsAs a large set of evaluated grasps is required to
achieve complete coverage of grasp affordances a sim-ulator [7] has been used (in total we simulated about10.000.000 grasps). The setup is illustrated in figure 3.The use of a simulator allows us to evaluate large setsof grasps efficiently while avoiding the overhead ofusing a real setup and circumventing the introductionof errors by usage of a pose estimation algorithm toobtain the pose of the object.
In the simulator both objects and grippers are de-fined by geometric models as well as mass and fric-tion information. While the material of the gripper isknown, we estimate the mass of the objects and assumethem to be made of plastic. For the gripper it is inaddition ensured that the realistic constraints on theposition, velocity and acceleration of the fingers aremaintained.
Fig. 3: Screenshot from the simulator.
The positions of the grasps that are to be simulatedare obtained by defining a 6D grid covering all theposes that are in the vicinity of the object. The resolu-tion of this grid needs to be limited in order to ensurethat simulation still is tractable. In our simulation, weused a grid of 10mm and approximately 15 degrees.
The simulator models the interaction between thetool, a simulated Schunk PG70 parallel-jaw gripperwith a maximum finger distance of 70mm, and theobject during the grasping process using a physicsengine. The execution of a grasp is finished when eitherthe gripper is closed entirely or the object preventsit from doing so (see figure 3). Grasp hypothesesthat would lead to collisions between gripper andobject beforehand are discarded. Whether a grasp issuccessful or not is estimated by calculating the graspforce wrench and determining whether the grasp cancounteract gravity (see also [4]). If that is the case, thegrasp is considered to be successful. We only considerthe force wrench as the simulation is based on hardcontacts. Therefore a stable grasp may consist of onlytwo contact points, although the object might rotatefreely on the axis defined by the two contact points.
The four different objects used in our simulations areshown in figure 4. The screwdriver and the coffee-mughave been found on the web1. Their size matches thesize of common real world objects. The screw driver isapprox. 280mm long and up 30mm wide, the body ofthe cup is approx. 60mm wide and 80mm high. Theelongated D-shaped object (top right in figure 4) andthe cone are purely artificial objects. The width of thecone is 80mm at it’s base and 20mm at the top whilethe overall length is 400mm. The dimensions of theelongated D are approx. 140mm× 140mm× 350mm.
Figure 5 shows a visualization of a grasp densitythat has been created for the cone. For the projectionsof the density a plane has been defined that containsthe main axis of the cone and is parallel to the image
1http://sketchup.google.com/3dwarehouse/
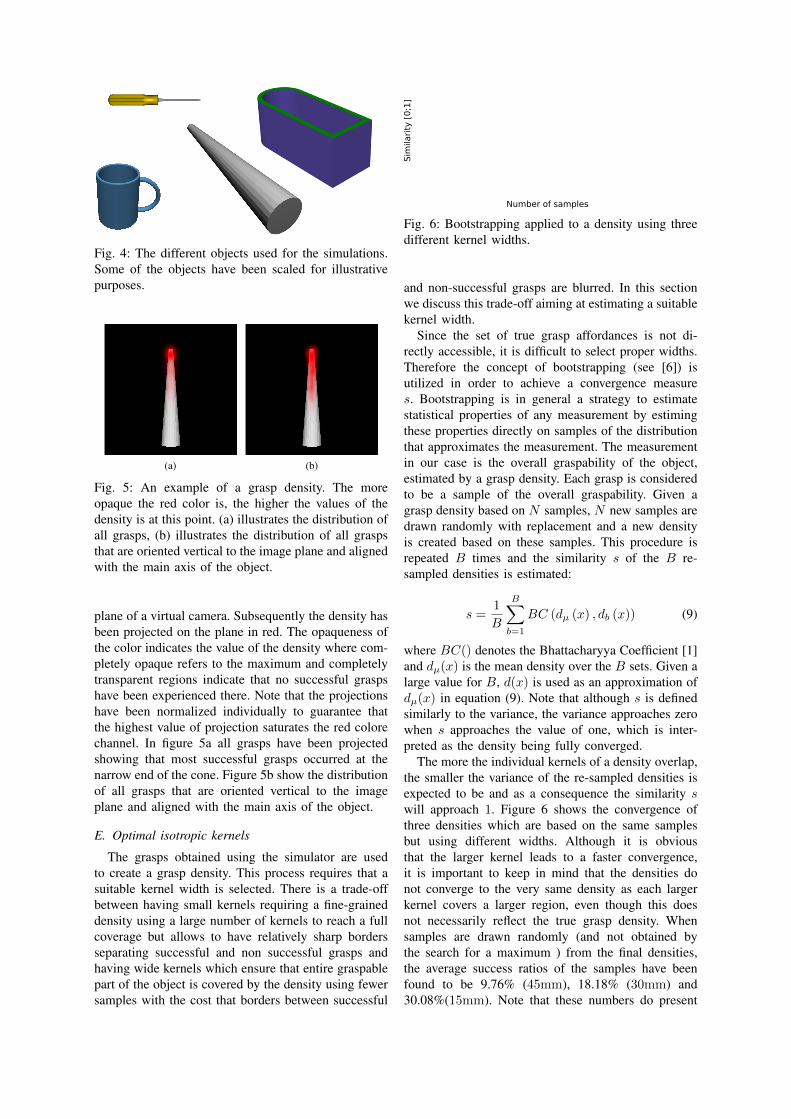
Fig. 4: The different objects used for the simulations.Some of the objects have been scaled for illustrativepurposes.
(a) (b)
Fig. 5: An example of a grasp density. The moreopaque the red color is, the higher the values of thedensity is at this point. (a) illustrates the distribution ofall grasps, (b) illustrates the distribution of all graspsthat are oriented vertical to the image plane and alignedwith the main axis of the object.
plane of a virtual camera. Subsequently the density hasbeen projected on the plane in red. The opaqueness ofthe color indicates the value of the density where com-pletely opaque refers to the maximum and completelytransparent regions indicate that no successful graspshave been experienced there. Note that the projectionshave been normalized individually to guarantee thatthe highest value of projection saturates the red colorechannel. In figure 5a all grasps have been projectedshowing that most successful grasps occurred at thenarrow end of the cone. Figure 5b show the distributionof all grasps that are oriented vertical to the imageplane and aligned with the main axis of the object.
E. Optimal isotropic kernels
The grasps obtained using the simulator are usedto create a grasp density. This process requires that asuitable kernel width is selected. There is a trade-offbetween having small kernels requiring a fine-graineddensity using a large number of kernels to reach a fullcoverage but allows to have relatively sharp bordersseparating successful and non successful grasps andhaving wide kernels which ensure that entire graspablepart of the object is covered by the density using fewersamples with the cost that borders between successful
Number of samples
Sim
ilari
ty [
0;1
]
Fig. 6: Bootstrapping applied to a density using threedifferent kernel widths.
and non-successful grasps are blurred. In this sectionwe discuss this trade-off aiming at estimating a suitablekernel width.
Since the set of true grasp affordances is not di-rectly accessible, it is difficult to select proper widths.Therefore the concept of bootstrapping (see [6]) isutilized in order to achieve a convergence measures. Bootstrapping is in general a strategy to estimatestatistical properties of any measurement by estimingthese properties directly on samples of the distributionthat approximates the measurement. The measurementin our case is the overall graspability of the object,estimated by a grasp density. Each grasp is consideredto be a sample of the overall graspability. Given agrasp density based on N samples, N new samples aredrawn randomly with replacement and a new densityis created based on these samples. This procedure isrepeated B times and the similarity s of the B re-sampled densities is estimated:
s =1
B
B∑b=1
BC (dµ (x) , db (x)) (9)
where BC() denotes the Bhattacharyya Coefficient [1]and dµ(x) is the mean density over the B sets. Given alarge value for B, d(x) is used as an approximation ofdµ(x) in equation (9). Note that although s is definedsimilarly to the variance, the variance approaches zerowhen s approaches the value of one, which is inter-preted as the density being fully converged.
The more the individual kernels of a density overlap,the smaller the variance of the re-sampled densities isexpected to be and as a consequence the similarity swill approach 1. Figure 6 shows the convergence ofthree densities which are based on the same samplesbut using different widths. Although it is obviousthat the larger kernel leads to a faster convergence,it is important to keep in mind that the densities donot converge to the very same density as each largerkernel covers a larger region, even though this doesnot necessarily reflect the true grasp density. Whensamples are drawn randomly (and not obtained bythe search for a maximum ) from the final densities,the average success ratios of the samples have beenfound to be 9.76% (45mm), 18.18% (30mm) and30.08%(15mm). Note that these numbers do present

Object successes failures ratioCone 166.690 3.331.043 5.0 %Elongated D 2.898 99.764 2.9 %Screwdriver 159.947 1.574.709 10.1 %Mug 19.051 4.127.861 0.46 %
TABLE I: Overview over the number of successful andfailing grasps for the individual objects and the successratio.
results in a very sub-optimal use of grasp densitiesin which also grasps are tested which are known tohave a low success likelihood (i.e., where the graspdensity has low values). This can be very useful, whenwe want to explore grasps corresponding to areas inSE(3) where there are unstable grasps. It is a qualityof the grasp density also to represent these kind ofareas appropriately. However, one needs to be awareof the trade–off discussed here.
III. RESULTS
The estimated conditional probabilitiesP (TRBM (A) is successful|A is successful) of thesuccess of the displaced successful grasps for variousobjects is given in section III-A. Results in the contextof the adaption of an anisotropic kernel to thesestatistics is outlined in section III-B. results on theconvergence using this anisotropic kernel are given insection III-C.
A. Statistical Results
A feasible method for an investigation of the resultsof the statistical investigation are multidimensional his-tograms where one axis covers the likelihood of a graspto be successful and each direction of displacementleads to an additional axis. As it is hard to visualizehigh-dimensional histograms, only two dimensions ofdisplacements will be covered in a single histogramand the mean success likelihoods of the grasps associ-ated with the individual bins are computed.
Given an object that can be grasped at its edge, itis expected that successful grasps can be translatedalong the edge (see figure 7a where the green markerrepresents a successful grasp and the orange onesrepresent grasps we would expect to succeed as well).However, grasps will also be translatable on the twoorthogonal directions depending on the finger-width ofthe gripper (in conjunction with the thickness of theedge) as well as the length of the fingers. Further itis expected that grasps can be rotated around the axisdefined by the normal of the surface ending at thisedge (illustrated in figure 7b). Figure 7c indicates theassociated coordinate system.
The numbers of succeeding and failing grasps forthe different objects are listed in table I. Note that thesuccess likelihood is very different for the differentobjects. The screwdriver is relatively easy to grasp,even a random grasp has a success chance of more
(a) (b)
xy
‐z
(1) (2) (3)
(c)
Fig. 7: (a) and (b):Given that the green grasps (visual-ized in 2D) have been found to be successful and thegray box represents the grasped object, it is expectedthat the orange grasps would be successful as well. (c)Illustration of the gripper (1), a simplified view (2) andthe 3 axes of the associated frame (3).
than 10%. For the ’Elongated D’ a random grasp hasa probability of success of less than 3% while for thethe cone the success likelihood is 5%. For the muga random grasp has a very low success chance ofonly 0.5%. Note that for the mug only few grasps willsucceed since there are only few graspable positions,and these need to be approached with carefully alignedgrasp orientation. For each object an individual graspdensity has been created based on the successful grasps(see, e.g., figure 5). Note that the kernel K does nothandle the fact that the gripper is mirror-symmetricaround its approach axis. Therefore each sample isused to create the density both unaltered and rotated180 degrees around the approach-axis of the gripper(the Z-axis, illustrated in figure 7c).
Subsequently each successfully tried grasp is usedto generate a set of samples in its vicinity. For eachof these samples the grasp density associated withthe object is used to estimate the likelihood of grapscorresponding to the new sample to be successful. As itis intractable to sample the complete 6D neighborhoodfor every tried grasp, a kernel is defined at the locationof a tried grasp. Subsequently this kernel is sampled.Thereby the entire neighborhood of grasps can becovered, without exhausting it with every single triedgrasp.
The average success likelihoods of the trans-formed grasps relative to the transformation (i.e.,P (TRBM (A) is successful|A is successful)) for theobject ’Elongated D’ is shown on the histograms infigure 8. The color of each bin reflects the success-likelihood of the grasps, 0 at the scale indicate 0%success likelihood, 1 indicates 100%.
The histograms in the top row cover the translations— each histograms covers the translations in the X-and Y- axis (horizontal resp. vertical axis on thehistogram). Further, each histogram is accumulatedover a range of displacements of 16mm in the Z-axis(−24mm to −40mm in the leftmost histogram, 24mmto 40mm in the rightmost). Each histogram in thebottom row covers two axis of rotations. The relationbetween a grasp and the different axes is shown in

P (TRBM (A) is successful|A is successful), object not aligned
0 90 1800
90
180
rot
z
[De
gre
e]
Fig. 8: Results for the object ’Elongated D’ for both rotation and translation using the grasp densities with30mm wide kernels for position.
figure 7c.Results indicate that successful grasps are more
robust towards translation in x– and z–direction androtations around their y-axis than the two remainingaxes. This confirms our expectations visualized in fig-ure 7. Note that when rotations are applied symmetriesbecome explicit (see bottom row in figure 8). When agrasp for instance is rotated 180 degrees around bothit’s x- and y-axis, the resulting configuration will beidentical with the initial one, just mirrored around theZ-axis which is identical with the approach-vector ofthe tool. Due to symmetry of the gripper the resultinggrasp is considered to be identical with the initial one.
However, the results are not as explicit as one mighthave expected. It can be observed that a wide rangeof different orientations may still lead to a successfulgrasp at the very same position. Hence grasps donot have to be aligned with the edge of the objectin order to be successful. But when the grasp andthe object are not aligned, the translations we applyare not aligned with the object either and will leadto likely to be unsuccessful grasps. This becomesevident when we look at the corresponding statisticswhen we align the kernel with the main orientationof the object (see figure 9): It can be seen that theanisotropic structure is much more expressive both intranslation and orientation. As a consequence of thisinvestigations we can conclude that it is important toalign an anisotropic kernel with the visually extractededge shape structure.
In figure 10 - 12 we see the analog statistics (onlythe two center sub-figures corresponding to figure 9and 8 are displayed). As we can see, the results forthe screwdriver (figure 10) and the cone (see figure12) look similar to the object ’Elongated D’. However,the structure of the conditional probabilities is differentfor the mug (figure 11). The reason is that the mughas only highly curved edges for which only slight
translations of successful grasps lead to errors. Herealso an alignment to the actual curved object shapewould be appropriate.
0
0.2
0.4
0.6
0.8
1
Succ
ess
lik
elih
ood
0 1.10.6
0.6
1.1
X-axis
Y-axis
(a) Rotations (aligned axes)
0
0.2
0.4
0.6
0.8
1
Succ
ess
lik
elih
ood
0 80.040.0
40.0
80.0
X-axis
Y-axis
(b) Translations (aligned axes)
0
0.2
0.4
0.6
0.8
1
Succ
ess
lik
elih
ood
0 1.10.6
0.6
1.1
X-axis
Y-axis
(c) Rotations (original axes)
0
0.2
0.4
0.6
0.8
1
Succ
ess
lik
elih
ood
0 80.040.0
40.0
80.0
X-axis
Y-axis
(d) Translations (original axes)
Fig. 10: Histograms for the screwdriver
0
0.2
0.4
0.6
0.8
1
Succ
ess
lik
elih
ood
0 1.10.6
0.6
1.1
X-axis
Y-axis
(a) Rotations
0
0.2
0.4
0.6
0.8
1
Succ
ess
lik
elih
ood
0 80.040.0
40.0
80.0
X-axis
Y-axis
(b) Translations
Fig. 11: Histograms for the mug (not aligned)

P (TRBM (A) is successful|A is successful), object aligned
0 40 800
40
80
0 90 1800
90
180
rot
z
[De
gre
e]
Fig. 9: Results for the object ’Elongated D’ when the grasps are translated aligned with the object structure.
0
0.2
0.4
0.6
0.8
1
Succ
ess
lik
elih
ood
0 1.10.6
0.6
1.1
X-axis
Y-axis
(a) Rotations (aligned axes)
0
0.2
0.4
0.6
0.8
1
Succ
ess
lik
elih
ood
0 80.040.0
40.0
80.0
X-axis
Y-axis
(b) Translations (aligned axes)
0
0.2
0.4
0.6
0.8
1
Succ
ess
lik
elih
ood
0 1.10.6
0.6
1.1
X-axis
Y-axis
(c) Rotations (original axes)
0
0.2
0.4
0.6
0.8
1
Succ
ess
lik
elih
ood
0 80.040.0
40.0
80.0
X-axis
Y-axis
(d) Translations (original axes)
Fig. 12: Histograms for the cone
B. Adapted kernel
When using the definition of a kernel given inequation (5) the anistropic kernel is defined as a sumof isotropic kernels. This sum of kernels can directlybe obtained by drawing are sufficiently large numberof samples from the results that form the basis for thehistograms in section III-A. Figure 13 illustrates thesimilarity between the results used for the histogramsand the anisotropic kernel with respect to the numberof samples used for the kernel estimation. The resultsshow that a rather high number of samples are requiredin order to achieve estimate of the anisotropich kernel.In order to limit the computational costs we limit thekernel to consist of 900 samples which leads to asimilarity of approximately 0.8, estimated using theBhattacharyya Coefficient [1].
0 200 400 600 800 1000 1200 1400 1600 1800
0.4
0.5
0.6
0.7
0.8
0.9
1
Number of samples
Sim
ilari
ty [
0;1
]
Fig. 13: Comparing the sampled kernel with the fulldata set used for the histograms for different numbersof samples.
C. Convergence
The usage of the anisotropic kernel does not implysignificant changes to the learning of a grasp density.Independent on the type of the kernel, one kernel isadded to the density every time a successful grasp isexperienced. When the anisotropic kernel is used allkernels that it consists of are transformed accordingto the pose of experienced grasp and subsequentlythe composition of kernels is added to the density.Figure 14 shows a comparison of the convergence oftwo densities (both are based on the set of graspslearned for the elongated D), one using the anisotropickernel and one using the isotropic kernel with a similarwidth. It becomes explicit the density that is using theanisotropic kernel converges significantly faster.
IV. CONCLUSION AND DISCUSSION
In this paper we have investigated the conditionalprobabilities of grasps in the vicinity of an alreadyperformed successful grasp for a number of objects.We found a large degree of structure in these condi-tional probabilities with large anisotropies. We haveused these anisotropies to derive statistically justifiedkernels for grasp density estimation [3] and we have

50150
250350
450550
650750
850950
10501150
12501350
0.75
0.8
0.85
0.9
0.95
1
isotropicanisotropic
Number of samples
Sim
ilari
ty [
0;1
]
Fig. 14: Comparing convergence of the isotropic kerneland the anisotropic kernel. The vertical bars indicatethe standard deviation of the individual similarity mea-surement.
shown that based on these kernels a faster conver-gence of grasp densities can be achieved. By thatthe statistical experience made during grasping caninfluence the actual learning approach on a meta level.We believe that the efficient use of such statisticallyderived conditional probabilities is one of the mainreasons for successful development of cognitive agents.We have also shown that it is important to align thederived kernels with the actual structure of the objectshape: Considering the scenario in [3] where local 3Dedge-descriptors of the scene have been used to createa proposal grasp density describing potential grasps.We imagine that the introduction of anisotropic kernelsallows us to utilize the edge information further. Ratherthan generating a proposal density consisting of a vastnumber of kernels, anisotropic kernels can be fittedto edge segments, thereby covering structural similarregions. As a consequence less samples are neededto formulate a proposal density and less samples arerequired to sample the entire object.
In future work we will finalize the experiments withthe analytically defined anisotropic kernel. Further-more we aim at comparing the simulation data withreal robot data and to derive higher order conditionalprobabilities associated with more complex featuregrasp associations such as coplanar and/or parallel edgeand surface structures.
V. ACKNOWLEDGMENTS
This work was supported by the EU CognitiveSystems project XPERIENCE (FP7-ICT-270273).
REFERENCES
[1] A. Bhattacharyya. On a measure of divergence between twostatistical populations defined by probability distributions. Bull.Calcutta Math. Soc., 1943. p. 99 - 109.
[2] R. Detry, E. Baseski, N. Kruger, M. Popovic, Y. Touati,O. Kroemer, J. Peters, and J. Piater. Learning object-specificgrasp affordance densities. In Int. Conf. on Development andLearning, 2009.
[3] R. Detry, D. Kraft, O. Kroemer, L. Bodenhagen, J. Peters,N. Kruger, and J. Piater. Learning grasp affordance densities.Paladyn Journal of Behavioral Robotics, (accepted), 2011.
[4] C. Ferrari and J. Canny. Planning Optimal Grasps. In IEEE Int.Conf. on Robotics and Automation, pages 2290–2295, 1992.
[5] R. Fisher. Dispersion on a sphere. Royal Society of London.Series A, Mathematical and Physical Sciences, Volume 217Issue 1130:295–305, 1953.
[6] R. W. Johnson. An Introduction to the Bootstrap. Journal ofthe Royal Statistical Society, 23:49–54, 2001.
[7] J. A. Jørgensen and H. G. Petersen. Usage of simulations to planstable grasping of unknown objects with a 3-fingered Schunkhand. In IEEE Int. Conf. on Intelligent RObots and Systems(IROS), Workshop - Robot simulators: available software, sci-entific applications and future trends, 2008.
[8] P. C. Mahalanobis. On the generalised distance in statistics.Proceedings of the National Institute of Science of India, 12:49–55, 1936.
[9] B. W. Silverman. Density Estimation for Statistics and DataAnalysis. Chapman and Hall/CRC, 1986.