WGG Coal Retirement Case Transmission Repurposed for Renewables.
44
WGG Coal Retirement Case Transmission Repurposed for Renewables
-
Upload
thomasine-bryan -
Category
Documents
-
view
222 -
download
0
Transcript of WGG Coal Retirement Case Transmission Repurposed for Renewables.

WGG Coal Retirement Case
Transmission Repurposed for Renewables
2
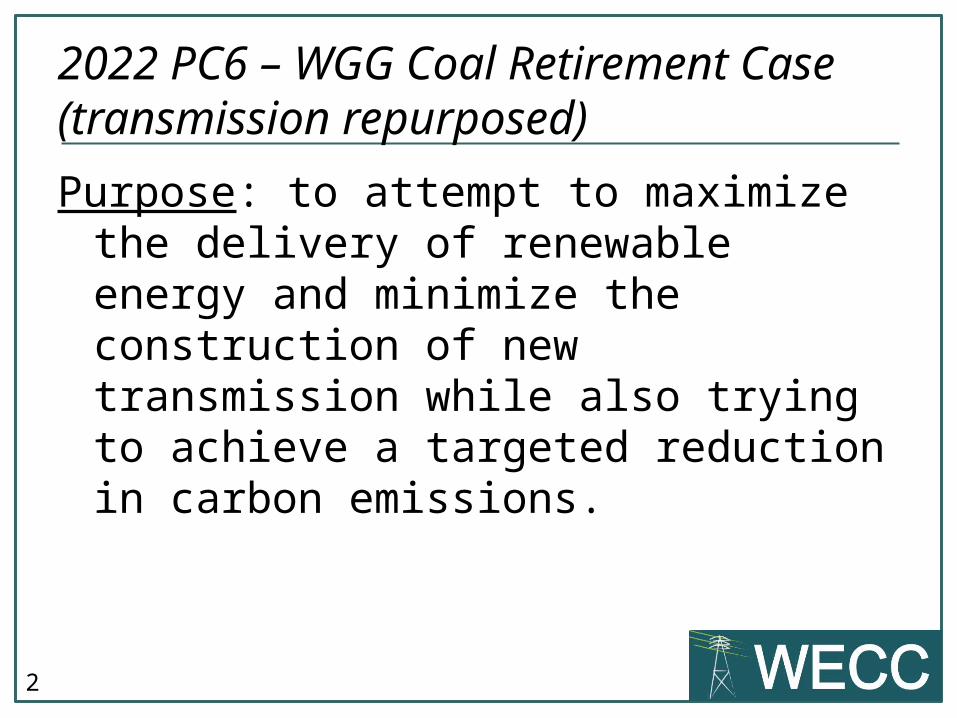
2022 PC6 – WGG Coal Retirement Case (transmission repurposed)
Purpose: to attempt to maximize the delivery of renewable energy and minimize the construction of new transmission while also trying to achieve a targeted reduction in carbon emissions.
3
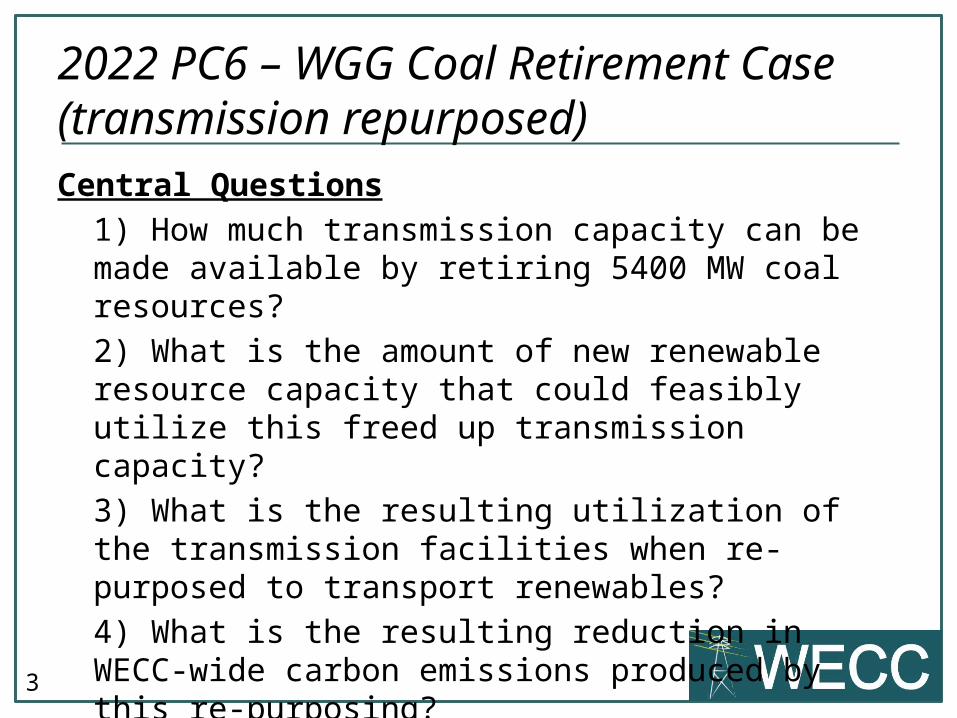
2022 PC6 – WGG Coal Retirement Case (transmission repurposed)Central Questions
1) How much transmission capacity can be made available by retiring 5400 MW coal resources?
2) What is the amount of new renewable resource capacity that could feasibly utilize this freed up transmission capacity?
3) What is the resulting utilization of the transmission facilities when re-purposed to transport renewables?
4) What is the resulting reduction in WECC-wide carbon emissions produced by this re-purposing?

4
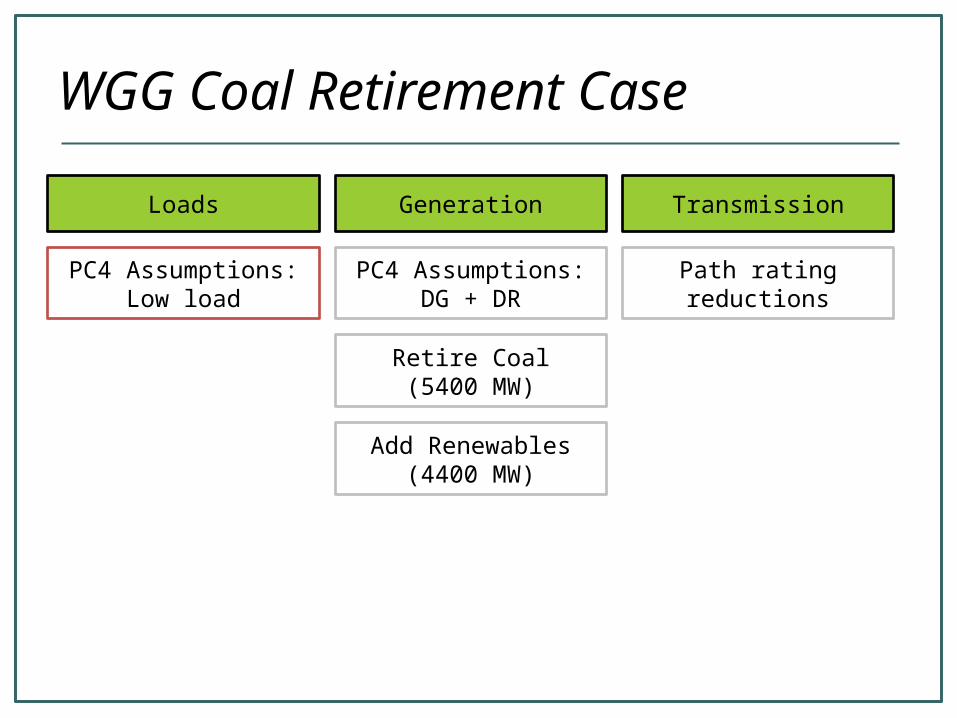
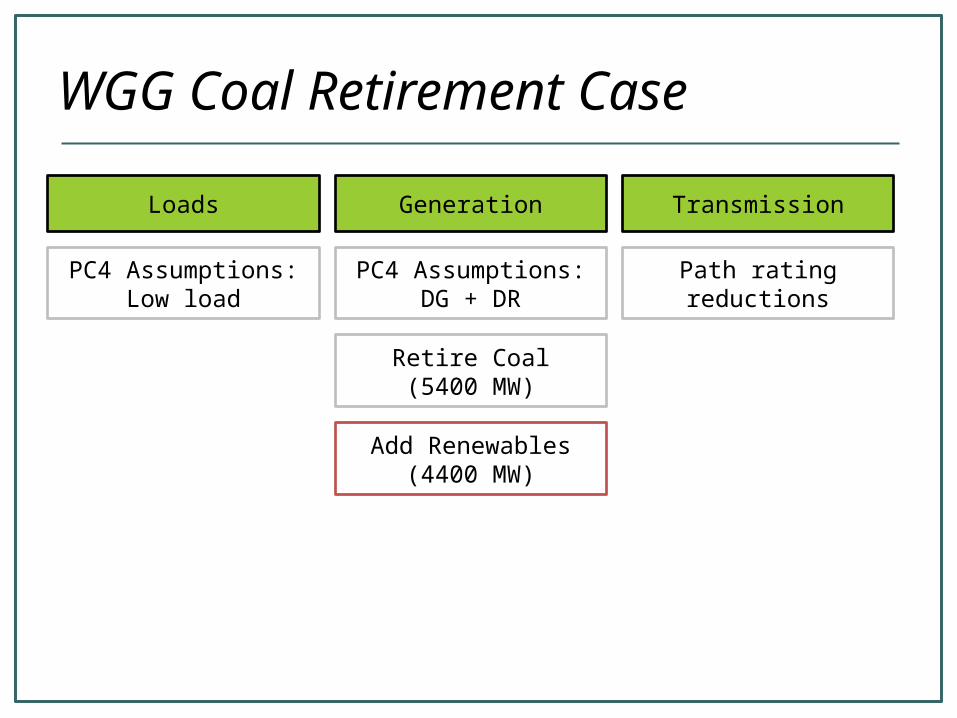
2022 PC6 – WGG Coal Retirement Case (transmission repurposed)Assumptions
Loads – decreased to reflect the assumption that “all cost-effective EE potential” is achieved throughout the West (PC4 assumption)
Transmission System – Path rating reductions
Generation – DG resources increased based on ‘interconnection potential’ of distributed
PV and ‘technical potential’ of distributed CHP as estimated by E3 (link to E3 report)
RPS resources adjusted for lower loads due to EE and behind-the-meter DG, and for increased PV DG
DSM increased based on LBNL analysis of demand response potential estimated using an updated FERC DR Potential Estimates model
Retired 25% of WECC coal fleet (5400 MW) Added renewables to repurpose transmission (~4400 MW)
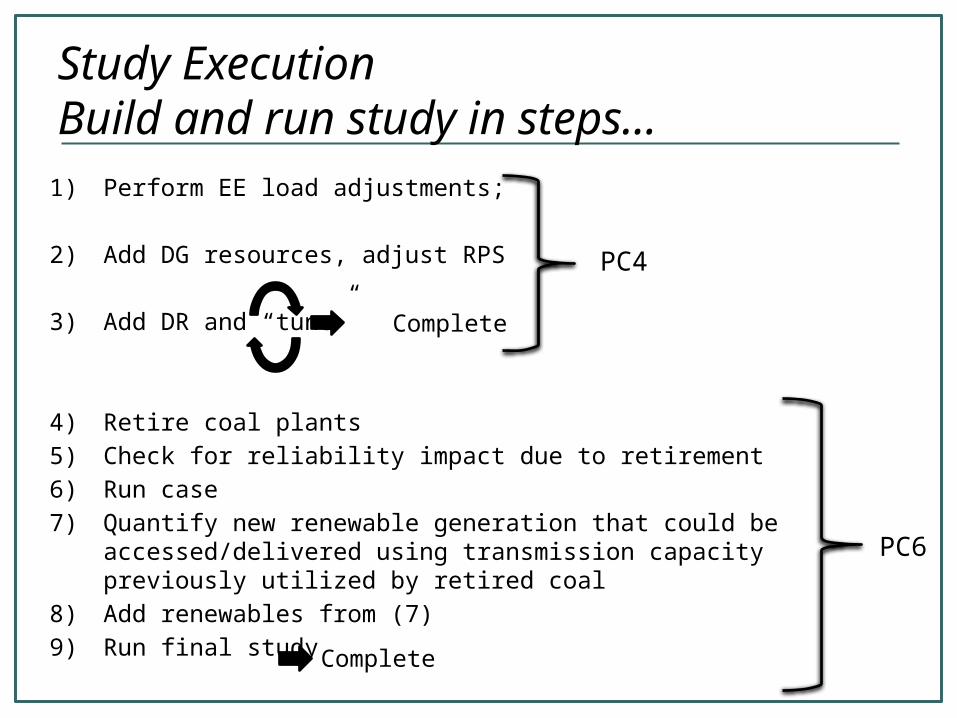
Study ExecutionBuild and run study in steps…
1) Perform EE load adjustments;
2) Add DG resources, adjust RPS
3) Add DR and “tune”
4) Retire coal plants
5) Check for reliability impact due to retirement
6) Run case
7) Quantify new renewable generation that could be accessed/delivered using transmission capacity previously utilized by retired coal
8) Add renewables from (7)
9) Run final study
Complete
PC4
Complete
PC6
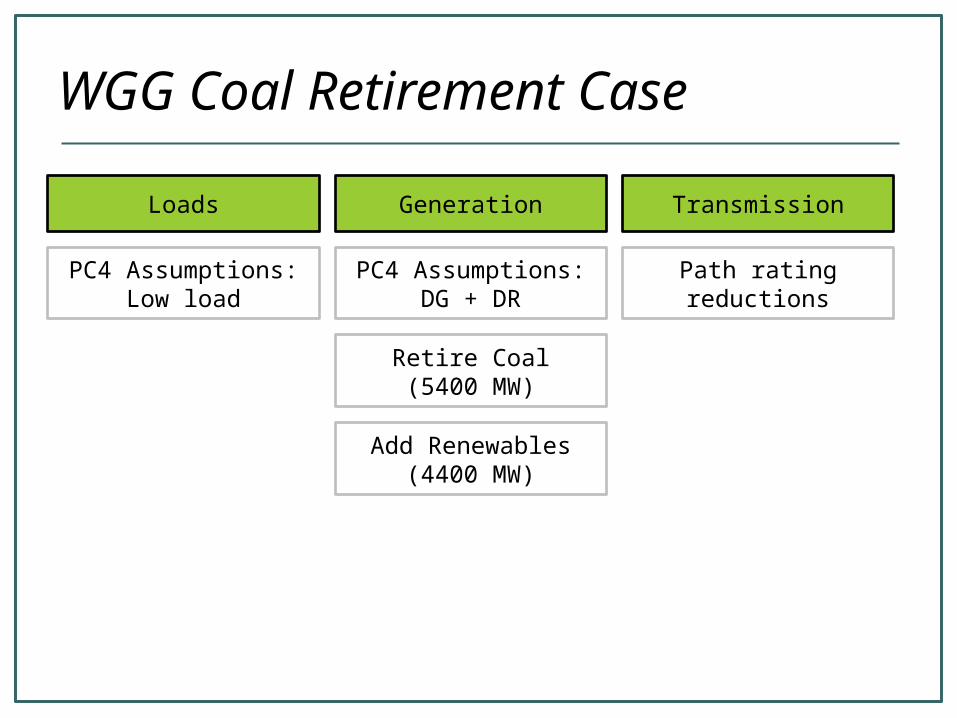
WGG Coal Retirement Case
Loads Generation Transmission
PC4 Assumptions:Low load
PC4 Assumptions:DG + DR
Path rating reductions
Retire Coal(5400 MW)
Add Renewables(4400 MW)
WGG Coal Retirement Case
Loads Generation Transmission
PC4 Assumptions:Low load
PC4 Assumptions:DG + DR
Path rating reductions
Retire Coal(5400 MW)
Add Renewables(4400 MW)
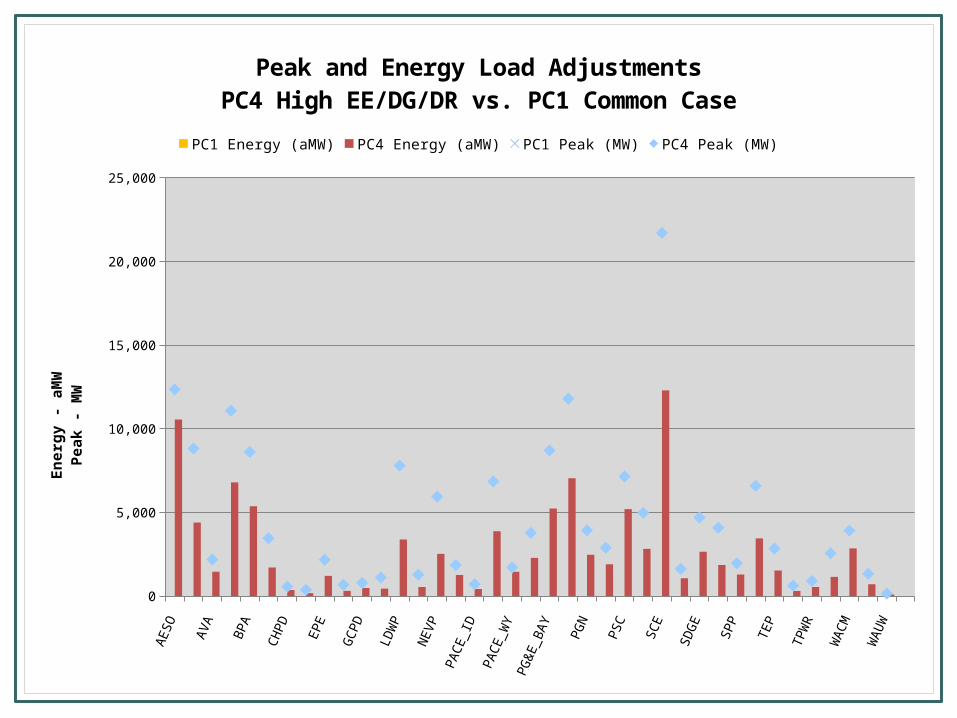
Summary of Aggressive EE Load Adjustments
AE
SO
A
PS
A
VA
B
CH
B
PA
C
FE
CH
PD
D
OP
D
EP
E
FAR
EA
ST
GC
PD
IID
LD
WP
M
AG
IC V
LY
NE
VP
N
WM
T P
AC
E_I
D
PA
CE
_UT
PA
CE
_WY
P
AC
W
PG
&E
_BA
Y
PG
&E
_VLY
P
GN
P
NM
P
SC
P
SE
S
CE
S
CL
SD
GE
S
MU
D
SP
P
SR
P
TEP
TI
DC
TP
WR
TR
EA
S V
LY
WA
CM
W
ALC
W
AU
W
0
5,000
10,000
15,000
20,000
25,000
Peak and Energy Load AdjustmentsPC4 High EE/DG/DR vs. PC1 Common Case
PC1 Energy (aMW) PC4 Energy (aMW) PC1 Peak (MW) PC4 Peak (MW)
En
erg
y -
aMW
Pea
k -
MW

WGG Coal Retirement Case
Loads Generation Transmission
PC4 Assumptions:Low load
PC4 Assumptions:DG + DR
Path rating reductions
Retire Coal(5400 MW)
Add Renewables(4400 MW)
10
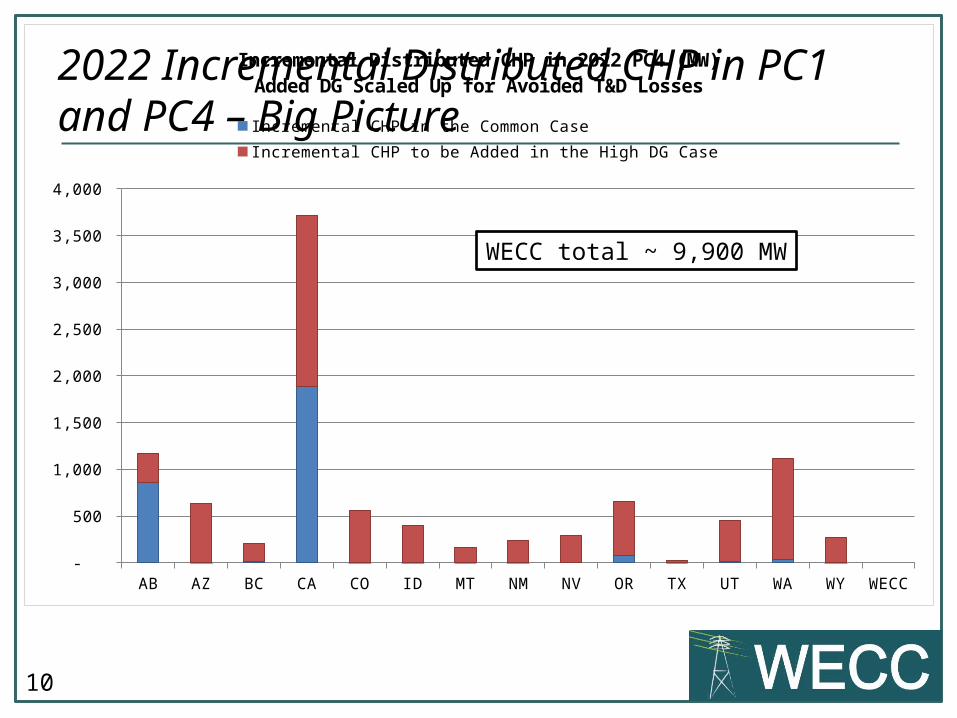
2022 Incremental Distributed CHP in PC1 and PC4 – Big Picture
AB AZ BC CA CO ID MT NM NV OR TX UT WA WY WECC -
500
1,000
1,500
2,000
2,500
3,000
3,500
4,000
Incremental Distributed CHP in 2022 PC4 (MW)Added DG Scaled Up for Avoided T&D Losses
Incremental CHP in the Common Case Incremental CHP to be Added in the High DG Case
WECC total ~ 9,900 MW
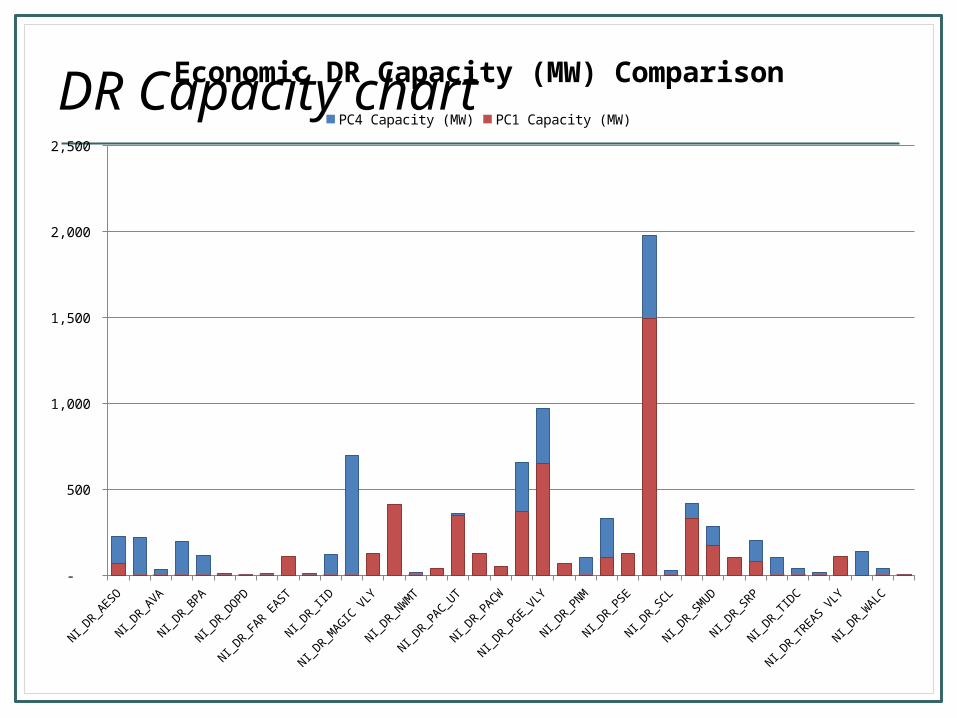
DR Capacity chart
NI_DR_A
ESO
NI_DR_A
PS
NI_DR_A
VA
NI_DR_B
CH
NI_DR_B
PA
NI_DR_C
HPD
NI_DR_D
OPD
NI_DR_E
PE
NI_DR_F
AR EAST
NI_DR_G
CPD
NI_DR_I
ID
NI_DR_L
DWP
NI_DR_M
AGIC V
LY
NI_DR_N
EVP
NI_DR_N
WM
T
NI_DR_P
AC_ID
NI_DR_P
AC_UT
NI_DR_P
AC_WY
NI_DR_P
ACW
NI_DR_P
GE_BAY
NI_DR_P
GE_VLY
NI_DR_P
GN
NI_DR_P
NM
NI_DR_P
SC
NI_DR_P
SE
NI_DR_S
CE
NI_DR_S
CL
NI_DR_S
DGE
NI_DR_S
MUD
NI_DR_S
PP
NI_DR_S
RP
NI_DR_T
EP
NI_DR_T
IDC
NI_DR_T
PWR
NI_DR_T
REAS VLY
NI_DR_W
ACM
NI_DR_W
ALC
NI_DR_W
AUW
-
500
1,000
1,500
2,000
2,500
Economic DR Capacity (MW) ComparisonPC4 Capacity (MW) PC1 Capacity (MW)

WGG Coal Retirement Case
Loads Generation Transmission
PC4 Assumptions:Low load
PC4 Assumptions:DG + DR
Path rating reductions
Retire Coal(5400 MW)
Add Renewables(4400 MW)
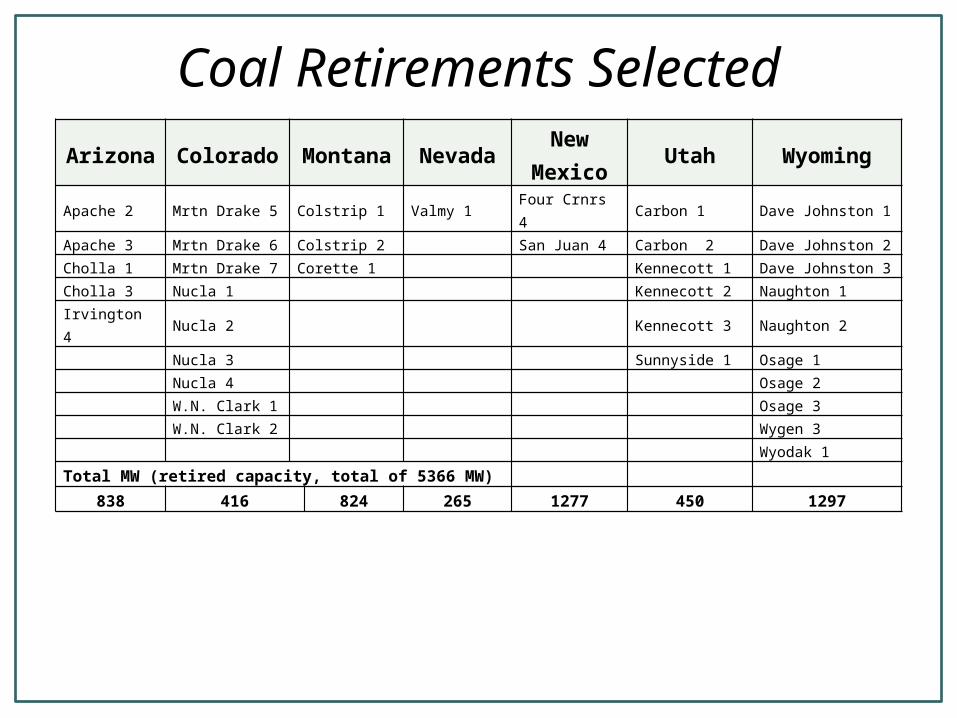
Coal Retirements SelectedArizona Colorado Montana Nevada
New Mexico
Utah Wyoming
Apache 2 Mrtn Drake 5 Colstrip 1 Valmy 1 Four Crnrs 4 Carbon 1 Dave Johnston 1
Apache 3 Mrtn Drake 6 Colstrip 2 San Juan 4 Carbon 2 Dave Johnston 2
Cholla 1 Mrtn Drake 7 Corette 1 Kennecott 1 Dave Johnston 3
Cholla 3 Nucla 1 Kennecott 2 Naughton 1
Irvington 4 Nucla 2 Kennecott 3 Naughton 2
Nucla 3 Sunnyside 1 Osage 1
Nucla 4 Osage 2
W.N. Clark 1 Osage 3
W.N. Clark 2 Wygen 3
Wyodak 1
Total MW (retired capacity, total of 5366 MW)838 416 824 265 1277 450 1297

Coal Retirements Selected
25% of WECC coal fleet– 3250 MW retired prior to 2022 in the Common Case– 5370 MW retired based on WGG’s economic analysis
Arizona Colorado Montana Nevada New Mexico Oregon Utah Washington Wyoming0
200
400
600
800
1000
1200
1400
1600
1800
2000
Retirements Selected for 2022 PC6
Retired in Common Case Incremental Retirements

WGG Coal Retirement Case
Loads Generation Transmission
PC4 Assumptions:Low load
PC4 Assumptions:DG + DR
Path rating reductions
Retire Coal(5400 MW)
Add Renewables(4400 MW)

16
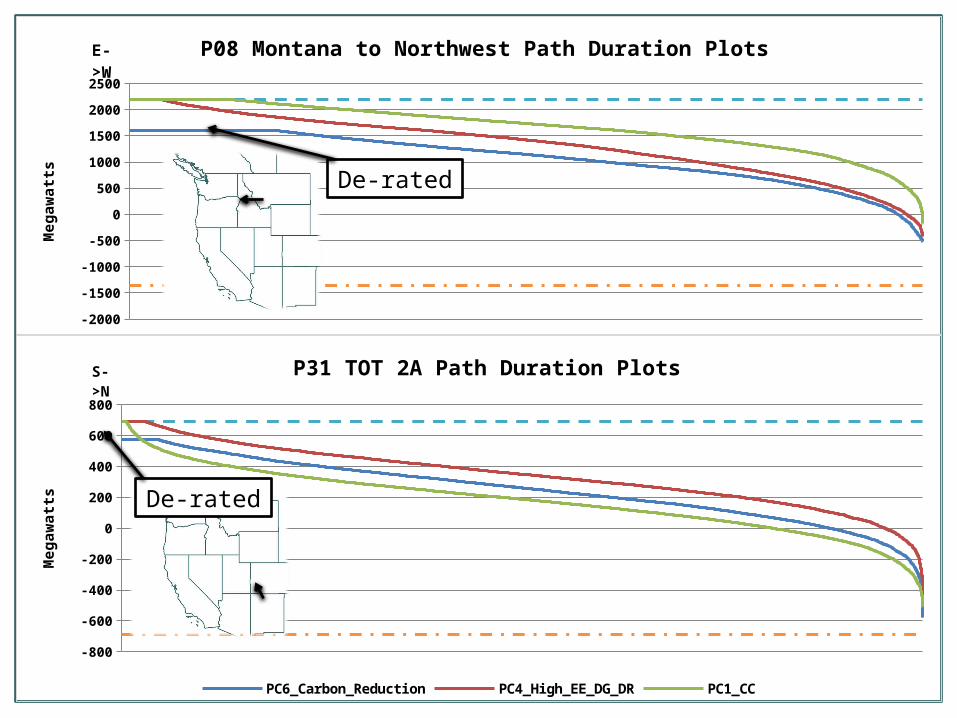
• Incomplete information provided by the Technical Studies Subcommittee (TSS)oRetirement – Colstrip 1 and 2
Path 8 Montana-Northwest derated to 1600 MW
oRetirement – Nucla 1-4 TOT 2 derated to 690 MW minus output of Nucla 1-4
(total max cap of 115 MW)
• Path rating catalog reviewed to identify additional path rating impacts; no conclusive information found
Path Rating Impacts of Selected Retirements
WGG Coal Retirement Case
Loads Generation Transmission
PC4 Assumptions:Low load
PC4 Assumptions:DG + DR
Path rating reductions
Retire Coal(5400 MW)
Add Renewables(4400 MW)

18
• Add incremental renewable resources to WREZ zones closest to the retired coal plants, attempting to take advantage of any freed-up transmission capacity
• Used capacity values from various resources to recalculate PRM and decide how many new CTs to add
Adding Incremental Renewables

Added Renewables
StateGeothermal Solar CSP Solar PV Wind Total
MW GWh MW GWh MW GWh MW GWh MW GWh
Arizona 115 343 414 1064 529 1407Colorado 331 874 331 874Montana 906 2850 906 2850Nevada 265 2068 265 2068New Mexico 735 2073 385 859 684 2334 1804 5266Utah 450 991 450 991Wyoming 1427 5551 1427 5551Total 265 2068 955 2416 835 1850 3762 12673 5712 19007
Arizona Colorado Montana Nevada New Mexico Utah Wyoming 0
200
400
600
800
1000
1200
1400
1600
Geothermal MW
Solar CSP MW
Solar PV MW
Wind MW

20
Coal Retirements vs. New Renewables & CTs - Wyoming/Montana Area
Coal Plant Retirement
WREZ Hub centroid, approximate location of incremental renewables
WECC Path Cut Plane
Incremental wind resource
Incremental CTs
906 MW
1,012 MW
415 MW
450 MW
380 MW
370 MW

21
• Wyoming:oCoal retired – 1,297 MWo Incremental wind added – 1,427 MWo Incremental CTs added – 1,200 MW
• Montana:oCoal retired – 824 MWo Incremental wind added – 906 MWo Incremental CTs added – 0 MW
Wyoming/Montana Area Summary

22
Coal Retirements vs. New Renewables & CTs – Colorado/New Mexico Area
Coal Plant Retirement
WREZ Hub centroid, approximate location of incremental renewables
WECC Path Cut Plane
Incremental wind resource
Incremental CTs
330 MW
684 MW
Incremental solar resource
770 MW
200 MW

23
• Colorado:oCoal retired – 416 MWo Incremental wind added – 330 MWo Incremental CTs added – 0 MW
• New Mexico:oCoal retired – 1,277 MWo Incremental wind added – 684 MWo Incremental solar added – 770 MWo Incremental CTs added – 200 MW
Colorado/New Mexico Area Summary
24
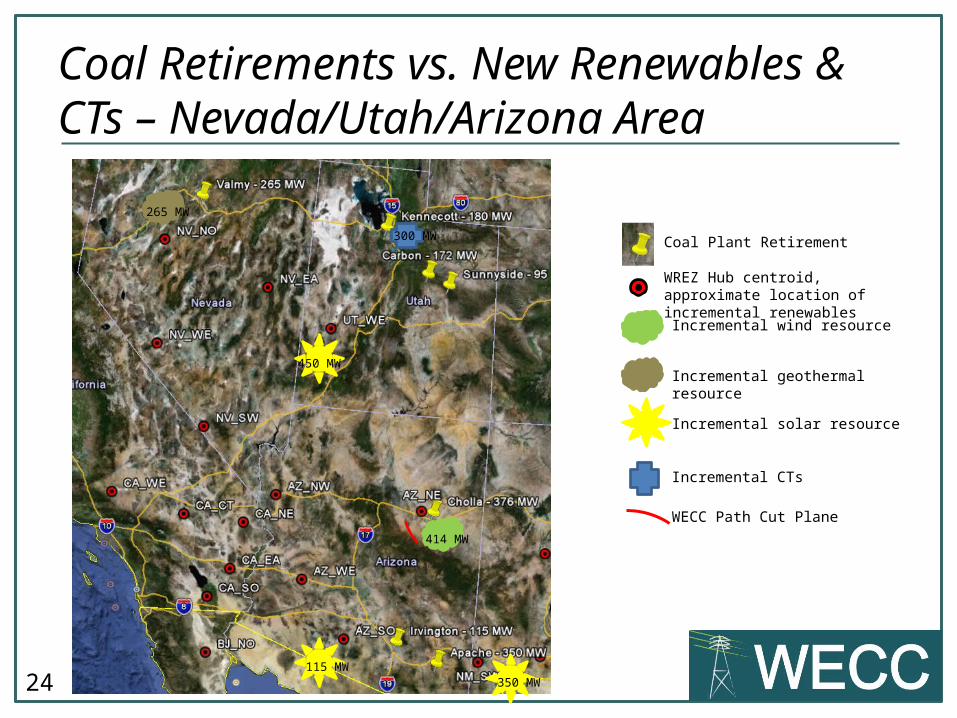
Coal Retirements vs. New Renewables & CTs – Nevada/Utah/Arizona Area
Coal Plant Retirement
WREZ Hub centroid, approximate location of incremental renewables
WECC Path Cut Plane
Incremental wind resource
Incremental CTs
Incremental solar resource
300 MW
Incremental geothermal resource
265 MW
450 MW
414 MW
115 MW350 MW

25
• Nevada:o Coal retired – 265 MWo Incremental geothermal added – 265 MWo Incremental CTs added – 0 MW
• Utah:o Coal retired – 450 MWo Incremental solar added – 450 MWo Incremental CTs added – 300 MW
• Arizona:o Coal retired – 841 MWo Incremental wind added – 414 MWo Incremental solar added – 465 MWo Incremental CTs added – 0 MW
Nevada/Utah/Arizona Area Summary
26
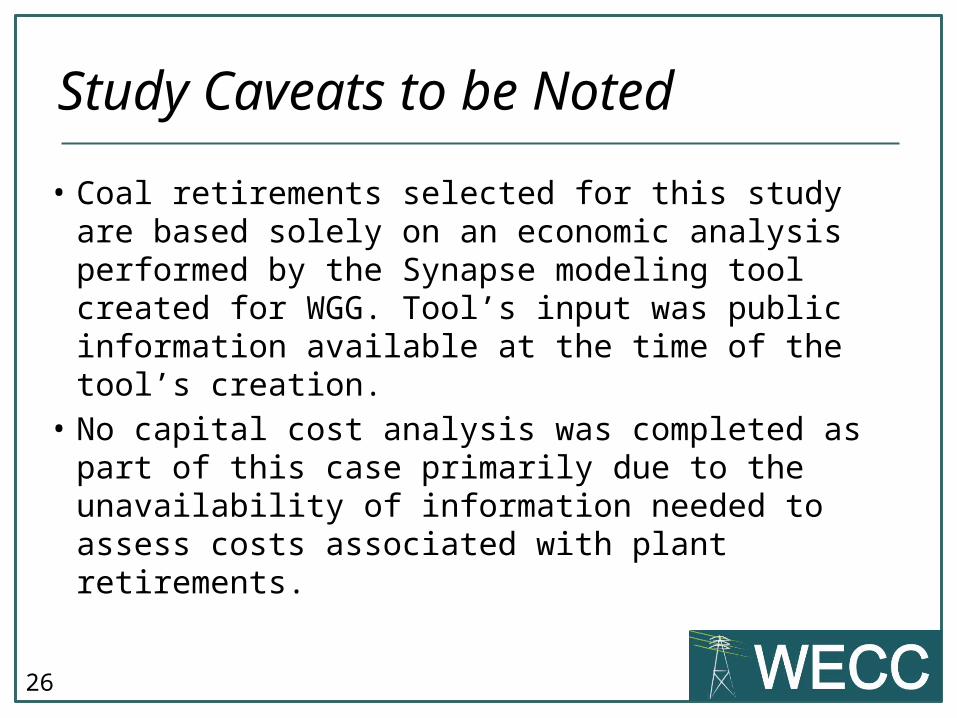
• Coal retirements selected for this study are based solely on an economic analysis performed by the Synapse modeling tool created for WGG. Tool’s input was public information available at the time of the tool’s creation.
• No capital cost analysis was completed as part of this case primarily due to the unavailability of information needed to assess costs associated with plant retirements.
Study Caveats to be Noted

27
• A full assessment of the reliability impacts of the modeled coal retirements cannot be completed as part of this study (at this time).
• Many possible combinations of renewable resources could be analyzed as part of this study, but only a single selection of incremental renewable resources was selected for this case.
Caveats, cont.
28
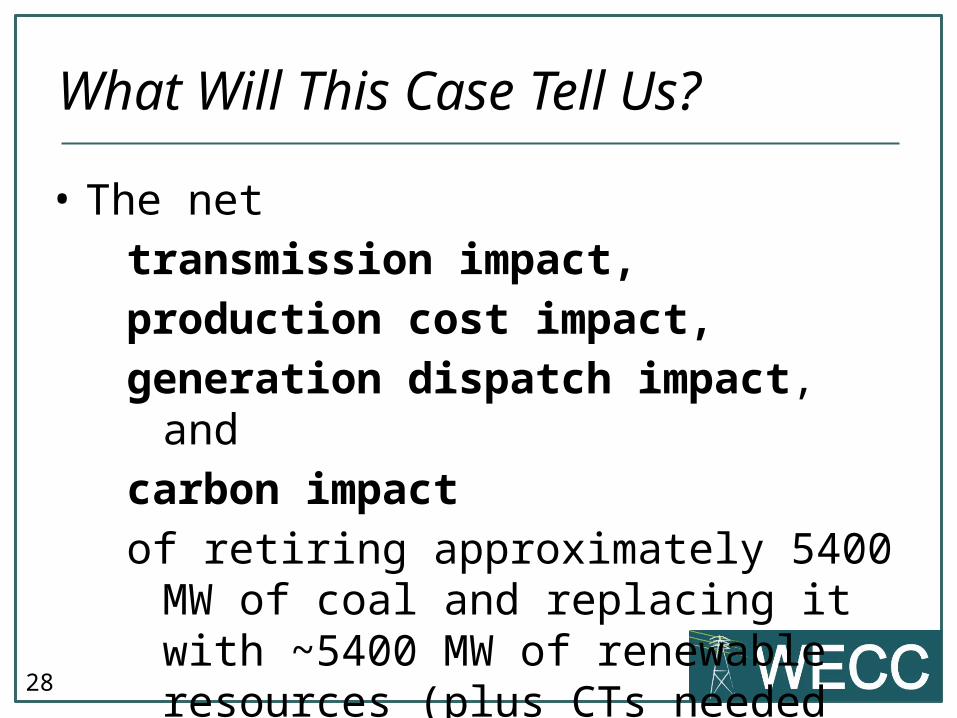
• The net
transmission impact,
production cost impact,
generation dispatch impact, and
carbon impact
of retiring approximately 5400 MW of coal and replacing it with ~5400 MW of renewable resources (plus CTs needed for load/gen balance)
What Will This Case Tell Us?
29
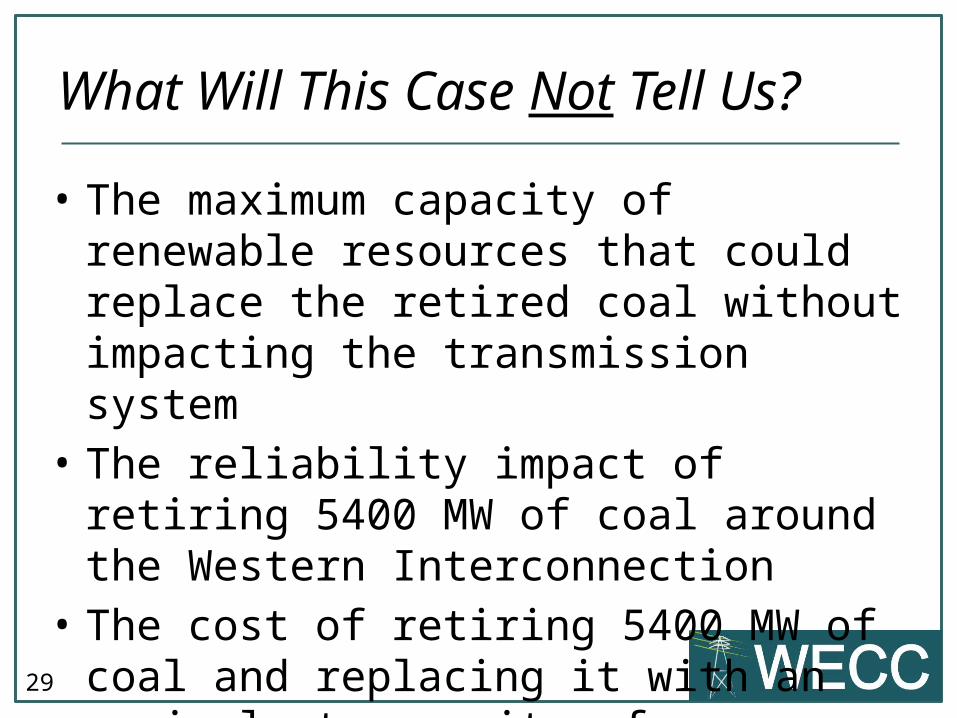
• The maximum capacity of renewable resources that could replace the retired coal without impacting the transmission system
• The reliability impact of retiring 5400 MW of coal around the Western Interconnection
• The cost of retiring 5400 MW of coal and replacing it with an equivalent capacity of renewables
What Will This Case Not Tell Us?
WGG Coal Retirement Case
Generation Impact

Conventional Hydro
Pumped Storage
Steam - Coal
Steam - Other
Nuclear
Combined Cycle
Combustion Turbine
Cogeneration
IC
Negative Bus Load
Biomass RPS
Geothermal
Small Hydro RPS
Solar
Wind
(100,000,000) (50,000,000) 0 50,000,000
Annual Energy Difference: 2022 PC1 Common Case vs. 2022 PC6 Carbon Reduction
GWh
Load is 10% less!and
change in multiple resource assumptions
?
?
Alber
ta
Arizon
a
British
Col
umbi
a
Califo
rnia
Color
ado
Idah
o
Mex
ico
Mon
tana
Nevad
a
New M
exico
Orego
n
South
Dak
ota
Texas
Utah
Was
hing
ton
Wyo
min
g-40,000,000
-30,000,000
-20,000,000
-10,000,000
0
10,000,000
20,000,000
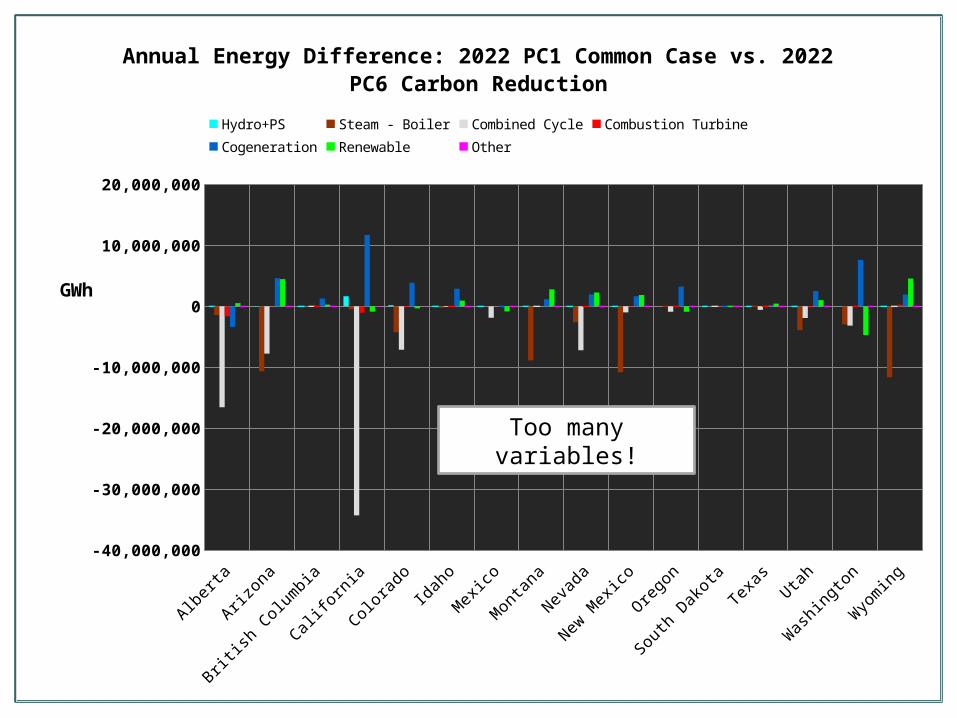
Annual Energy Difference: 2022 PC1 Common Case vs. 2022 PC6 Carbon Reduction
Hydro+PS Steam - Boiler Combined Cycle Combustion Turbine
Cogeneration Renewable Other
GWh
Too many variables!
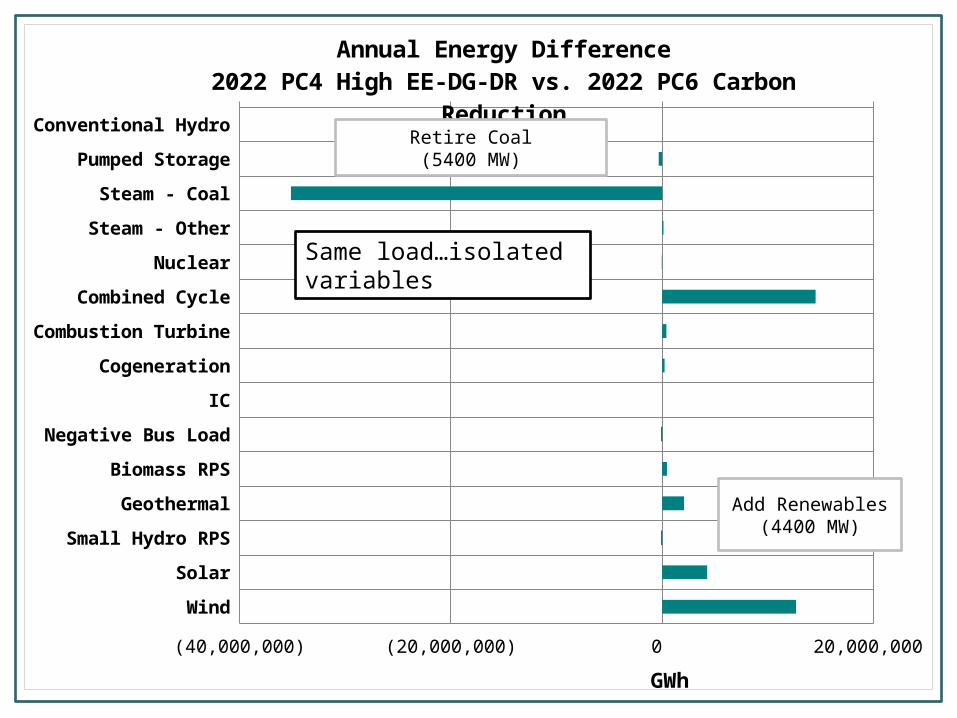
Conventional Hydro
Pumped Storage
Steam - Coal
Steam - Other
Nuclear
Combined Cycle
Combustion Turbine
Cogeneration
IC
Negative Bus Load
Biomass RPS
Geothermal
Small Hydro RPS
Solar
Wind
(40,000,000) (30,000,000) (20,000,000) (10,000,000) 0 10,000,000 20,000,000
Annual Energy Difference2022 PC4 High EE-DG-DR vs. 2022 PC6 Carbon Reduction
GWh
Same load…isolated variables
Retire Coal(5400 MW)
Add Renewables(4400 MW)

Alberta
Arizon
a
British
Colu
mbia
Califo
rnia
Colora
do
Idah
o
Mex
ico
Mon
tana
Nevad
a
New M
exico
Orego
n
South
Dak
ota
Texas
Utah
Was
hingt
on
Wyo
ming
-15,000,000
-10,000,000
-5,000,000
0
5,000,000
10,000,000
Annual Energy Difference: 2022 PC4 High EE-DG-DR vs. 2022 PC6 Carbon Reduction
Hydro+PS Steam - Boiler Combined Cycle Combustion Turbine
Cogeneration Renewable Other
GWh
Retire Coal(5400 MW)
Add Renewables(4400 MW)
Energy
WGG Coal Retirement Case
Production Cost and CO2 Impact

Production Cost Summary
Category
2022 PC1 Common
Case2022 PC6 Carbon
Reduction Difference Diff %
Dump Energy 397,104 1,519,300 1,122,196 282.595%
Emergency Energy 2,676 1,372 (1,305) -48.742%
CO2 Emissions (MMetricTons) 359 282 (78) -21.627%
CO2 Adder ($/metric ton) 0.000 0.000
Variable Production Cost (thermal units excl DSM)
CO2 Adder (Total M$) 0 0 0 0.000%
Other Variable Costs (M$) 14,851 11,963 (2,888) -19.446%
Total Var. Prod. Cost (M$) 14,851 11,963 (2,888) -19.446%

Production Cost Summary
Category2022 PC4 High EE-DG-DR
2022 PC6 Carbon Reduction Difference Diff %
Dump Energy 1,515,266 1,519,300 4,034 0.266%
Emergency Energy 1,372 1,372 0 0.000%
CO2 Emissions (MMetricTons) 310 282 (29) -9.207%
CO2 Adder ($/metric ton) 0.000 0.000
Variable Production Cost (thermal units excl DSM)
CO2 Adder (Total M$) 0 0 0 0.000%
Other Variable Costs (M$) 11,902 11,963 61 0.514%
Total Var. Prod. Cost (M$) 11,902 11,963 61 0.514%

Summary of Production Cost and CO2
Production Cost: Savings of 20% from the Common Case is due to the PC4 assumptions, not the Coal Retirement Assumptions
CO2: About half of the 20% reduction in CO2 emissions from the Common Case is due to the coal retirements and added renewables. The other half can be credited to PC4 assumptions.

WGG Coal Retirement Case
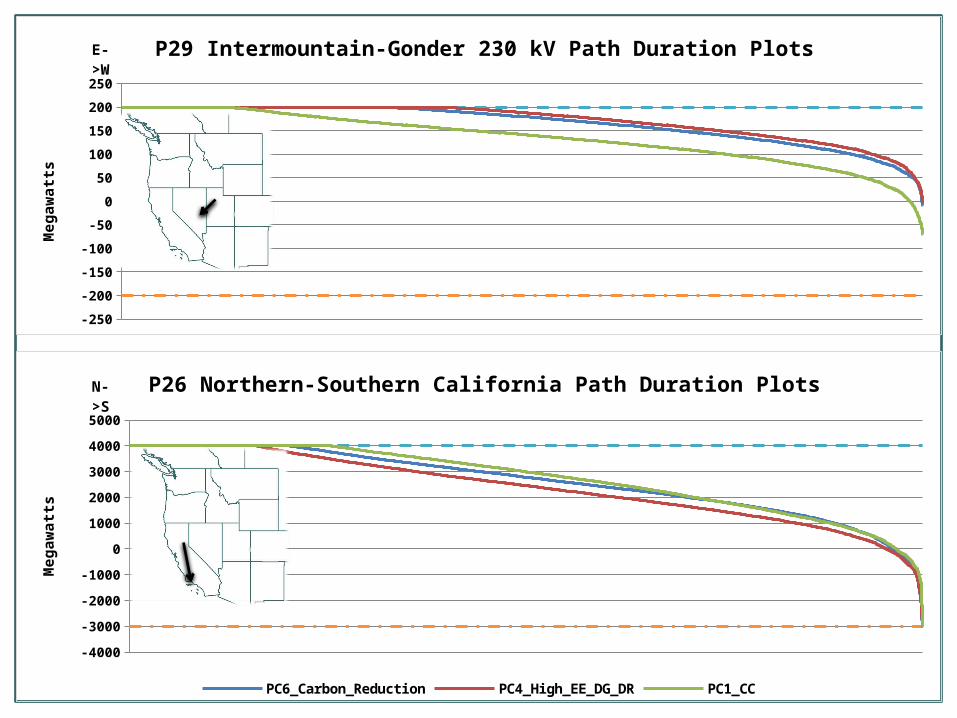
Transmission Impact
-2000
-1500
-1000
-500
0
500
1000
1500
2000
2500
P08 Montana to Northwest Path Duration PlotsM
egaw
atts
E->W
-800
-600
-400
-200
0
200
400
600
800
P31 TOT 2A Path Duration Plots
PC6_Carbon_Reduction PC4_High_EE_DG_DR PC1_CC
Meg
awat
ts
S->N
De-rated
De-rated

-4000
-3000
-2000
-1000
0
1000
2000
3000
4000
P03 Northwest-British Columbia Path Duration Plots
PC6_Carbon_Reduction PC4_High_EE_DG_DR PC1_CC
Meg
awat
ts
S->N
-8000
-6000
-4000
-2000
0
2000
4000
6000
8000
10000
Interstate COI plus PDCI Path Duration PlotsM
egaw
atts
N->S
-4000
-3000
-2000
-1000
0
1000
2000
3000
4000
5000
P26 Northern-Southern California Path Duration Plots
PC6_Carbon_Reduction PC4_High_EE_DG_DR PC1_CC
Meg
awat
ts
N->S
-250
-200
-150
-100
-50
0
50
100
150
200
250
P29 Intermountain-Gonder 230 kV Path Duration PlotsM
egaw
atts
E->W
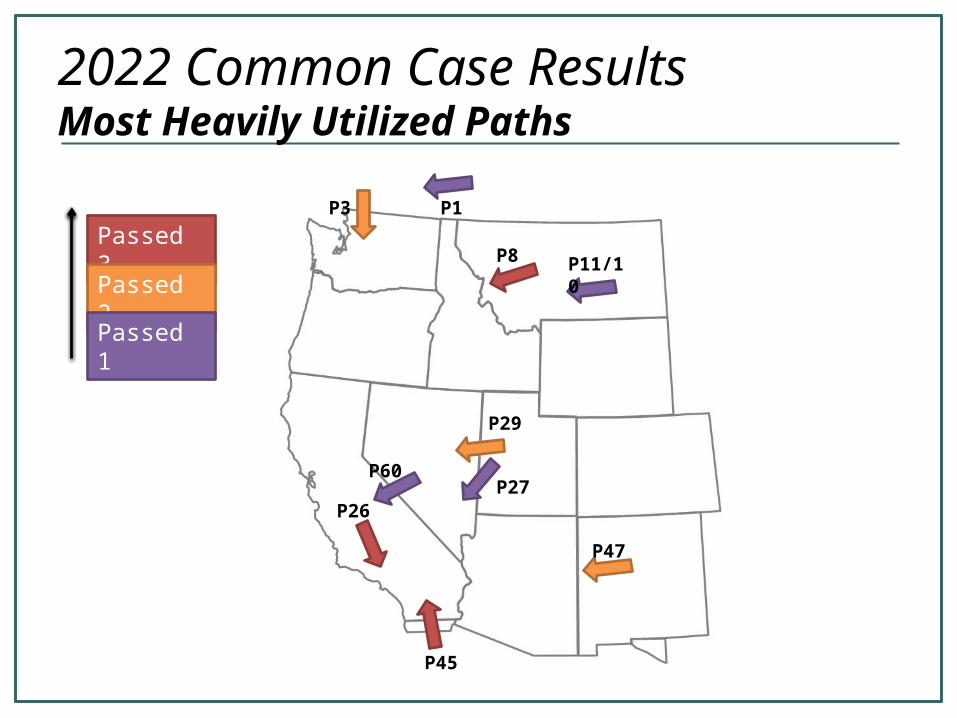
2022 Common Case Results Most Heavily Utilized Paths
Passed 3
Passed 2
Passed 1
P45
P26
P8
P3
P29
P47
P60P27
P1
P11/10
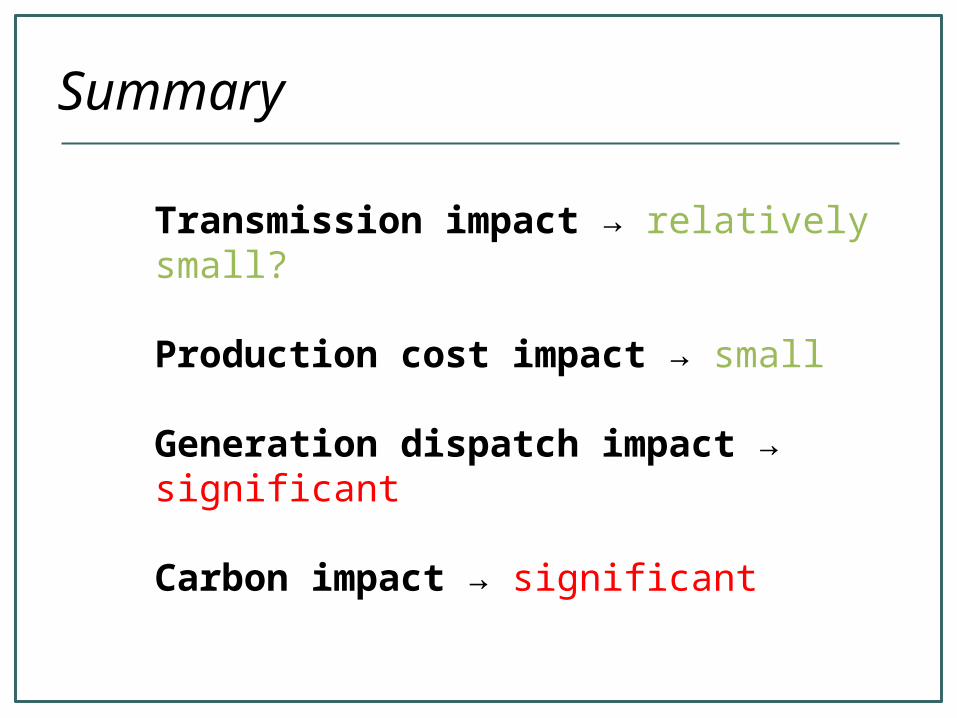
Summary
Transmission impact → relatively small?
Production cost impact → small
Generation dispatch impact → significant
Carbon impact → significant