WFP Ethiopia
6
WFP Ethiopia Drought Emergency Household Food Security Bulletin #2 31 May 2016 Page | 1 Funded by the Humanitarian Response Fund (HRF) WFP Ethiopia Drought Emergency Household Food Security Monitoring Bulletin #2 The ability of the affected population to cover food needs from its own means (own production, cash purchase, and/or credit) has improved somewhat since February, but remains very low. 80 percent of affected households can still barely cover half of their minimum daily food needs from their own means/ For the poorest 20 percent of the affected population, the situation remains especially worrying. This group can meet, on average, only 16 percent of their food needs through their own means. The richest 20 percent by comparison, are fully self-sufficient, able to meet more than 100 percent of their food +7% (=) +3% +6% +12% 16% 26% 37% 54% 114% 0% 40% 80% 120% QUINTILE 1 (MOST POOR) QUINTILE 2 QUINTILE 3 QUINTILE 4 QUINTILE 5 (MOST RICH) PERCENT OF MINIMUM CALORIC NEEDS COVERED FROM OWN MEANS AMONG AFFECTED HOUSEHOLDS FEBRUARY VS. MARCH/APRIL 2016 SURVEY ROUNDS FEBRUARY MARCH-APRIL Minimum daily caloric requirement 31 May 2016 MAIN FINDINGS Food consumption among relief beneficiaries is showing some encouraging trends as rates of inadequate food consumption has dropped overall. However, the situation remains critical, with severely constrained food access and, a high use of negative coping strategies, and low dietary diversity. Even non-targeted households are reporting inadequate food consumption, indicating that actual needs might be higher than current targeting estimates. BULLETIN #2 This bulletin presents the results of the second round of data collection to monitor the 2016 Food Sector response to the ongoing drought emergency in Ethiopia. The data covers the months of March and April. This bulletin is a joint product of the Food Sector. IN NUMBERS 31 percent reduction in inadequate food consumption among relief beneficiaries since February 80 percent of affected households still cannot access their minimum daily food needs through own means 36 percent of non-targeted households also report inadequate food consumption FOOD CONSUMPTION among relief beneficiaries is showing .some improvement, but remains worryingly low
Transcript of WFP Ethiopia

WFP Ethiopia Drought Emergency Household Food Security Bulletin #2
31 May 2016
Page | 1
Funded by the Humanitarian Response Fund (HRF)
WFP Ethiopia Drought Emergency Household Food Security Monitoring Bulletin #2
The ability of the affected population to cover
food needs from its own means (own
production, cash purchase, and/or credit) has
improved somewhat since February, but
remains very low. 80 percent of affected
households can still barely cover half of their
minimum daily food needs from their own
means/
For the poorest 20 percent of the affected
population, the situation remains especially
worrying. This group can meet, on average,
only 16 percent of their food needs through
their own means. The richest 20 percent by
comparison, are fully self-sufficient, able to
meet more than 100 percent of their food
+7%
(=)
+3%
+6%
+12%
16%
26%
37%
54%
114%
0%
40%
80%
120%
QUINTILE 1
(MOST POOR)
QUINTILE 2 QUINTILE 3 QUINTILE 4 QUINTILE 5
(MOST RICH)
PERCENT OF MINIMUM CALORIC NEEDS COVERED FROM OWN MEANS AMONG AFFECTED HOUSEHOLDS
FEBRUARY VS. MARCH/APRIL 2016 SURVEY ROUNDS
FEBRUARY MARCH-APRIL
Minimum daily
caloric requirement
31 May 2016
MAIN FINDINGS
Food consumption among relief beneficiaries is showing some encouraging trends as rates of inadequate food consumption has dropped overall.
However, the situation remains critical, with severely constrained food access and, a high use of negative coping strategies, and low dietary diversity.
Even non-targeted households are reporting inadequate food consumption, indicating that
actual needs might be higher than current targeting estimates.
BULLETIN #2
This bulletin presents the
results of the second round
of data collection to monitor
the 2016 Food Sector
response to the ongoing
drought emergency in
Ethiopia. The data covers
the months of March and
April.
This bulletin is a joint
product of the Food Sector.
IN NUMBERS
31 percent reduction in
inadequate food consumption among relief beneficiaries since February
80 percent of affected households
still cannot access their minimum daily food needs through own means
36 percent of non-targeted
households also report inadequate
food consumption
FOOD CONSUMPTION among relief beneficiaries is showing
.some improvement, but remains
worryingly low
WFP Ethiopia Drought Emergency Household Food Security Bulletin #2
31 May 2016
Page | 2
Funded by the Humanitarian Response Fund (HRF)
requirements without assistance. In fact,
this group, the group least in need, is
responsible for the lion’s share of
improvement since February.
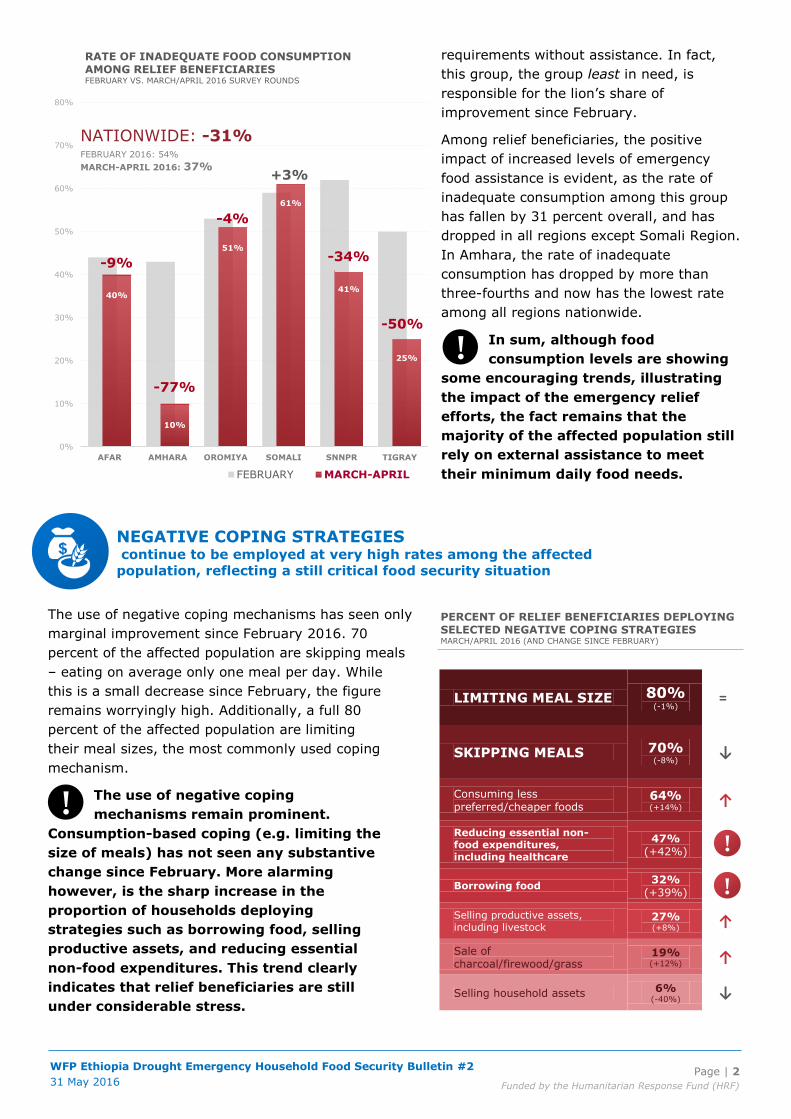
Among relief beneficiaries, the positive
impact of increased levels of emergency
food assistance is evident, as the rate of
inadequate consumption among this group
has fallen by 31 percent overall, and has
dropped in all regions except Somali Region.
In Amhara, the rate of inadequate
consumption has dropped by more than
three-fourths and now has the lowest rate
among all regions nationwide.
In sum, although food
consumption levels are showing
some encouraging trends, illustrating
the impact of the emergency relief
efforts, the fact remains that the
majority of the affected population still
rely on external assistance to meet
their minimum daily food needs.
The use of negative coping mechanisms has seen only
marginal improvement since February 2016. 70
percent of the affected population are skipping meals
– eating on average only one meal per day. While
this is a small decrease since February, the figure
remains worryingly high. Additionally, a full 80
percent of the affected population are limiting
their meal sizes, the most commonly used coping
mechanism.
The use of negative coping
mechanisms remain prominent.
Consumption-based coping (e.g. limiting the
size of meals) has not seen any substantive
change since February. More alarming
however, is the sharp increase in the
proportion of households deploying
strategies such as borrowing food, selling
productive assets, and reducing essential
non-food expenditures. This trend clearly
indicates that relief beneficiaries are still
under considerable stress.
LIMITING MEAL SIZE 80% (-1%) =
SKIPPING MEALS 70% (-8%) ↓
Consuming less preferred/cheaper foods
64% (+14%) ↑
Reducing essential non-food expenditures, including healthcare
47% (+42%)
Borrowing food
32% (+39%)
Selling productive assets, including livestock
27% (+8%) ↑
Sale of charcoal/firewood/grass
19% (+12%) ↑
Selling household assets 6%
(-40%) ↓
NEGATIVE COPING STRATEGIES continue to be employed at very high rates among the affected
population, reflecting a still critical food security situation
!
!
-9%
-77%
-4%
+3%
-34%
-50%
40%
10%
51%
61%
41%
25%
0%
10%
20%
30%
40%
50%
60%
70%
80%
AFAR AMHARA OROMIYA SOMALI SNNPR TIGRAY
RATE OF INADEQUATE FOOD CONSUMPTION AMONG RELIEF BENEFICIARIESFEBRUARY VS. MARCH/APRIL 2016 SURVEY ROUNDS
FEBRUARY MARCH-APRIL
NATIONWIDE: -31% FEBRUARY 2016: 54%
MARCH-APRIL 2016: 37%
!
!
PERCENT OF RELIEF BENEFICIARIES DEPLOYING SELECTED NEGATIVE COPING STRATEGIES MARCH/APRIL 2016 (AND CHANGE SINCE FEBRUARY)
WFP Ethiopia Drought Emergency Household Food Security Bulletin #2
31 May 2016
Page | 3
Funded by the Humanitarian Response Fund (HRF)
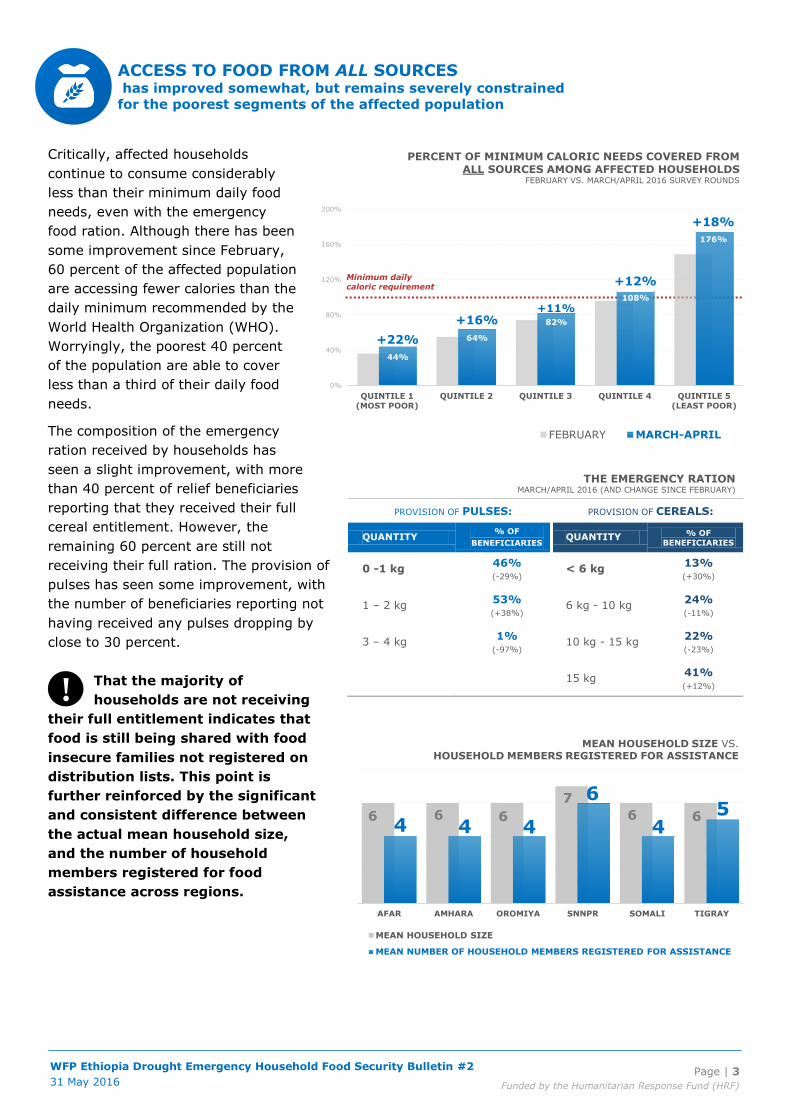
Critically, affected households
continue to consume considerably
less than their minimum daily food
needs, even with the emergency
food ration. Although there has been
some improvement since February,
60 percent of the affected population
are accessing fewer calories than the
daily minimum recommended by the
World Health Organization (WHO).
Worryingly, the poorest 40 percent
of the population are able to cover
less than a third of their daily food
needs.
The composition of the emergency
ration received by households has
seen a slight improvement, with more
than 40 percent of relief beneficiaries
reporting that they received their full
cereal entitlement. However, the
remaining 60 percent are still not
receiving their full ration. The provision of
pulses has seen some improvement, with
the number of beneficiaries reporting not
having received any pulses dropping by
close to 30 percent.
That the majority of
households are not receiving
their full entitlement indicates that
food is still being shared with food
insecure families not registered on
distribution lists. This point is
further reinforced by the significant
and consistent difference between
the actual mean household size,
and the number of household
members registered for food
assistance across regions.
THE EMERGENCY RATION MARCH/APRIL 2016 (AND CHANGE SINCE FEBRUARY)
PROVISION OF PULSES: PROVISION OF CEREALS:
QUANTITY % OF
BENEFICIARIES QUANTITY % OF
BENEFICIARIES
0 -1 kg 46% (-29%)
< 6 kg 13% (+30%)
1 – 2 kg 53% (+38%)
6 kg - 10 kg 24% (-11%)
3 – 4 kg 1%
(-97%) 10 kg - 15 kg
22% (-23%)
15 kg
41% (+12%)
+22%
+16%+11%
+12%
+18%
44%
64%
82%
108%
176%
0%
40%
80%
120%
160%
200%
QUINTILE 1
(MOST POOR)
QUINTILE 2 QUINTILE 3 QUINTILE 4 QUINTILE 5
(LEAST POOR)
PERCENT OF MINIMUM CALORIC NEEDS COVERED FROM ALL SOURCES AMONG AFFECTED HOUSEHOLDS
FEBRUARY VS. MARCH/APRIL 2016 SURVEY ROUNDS
FEBRUARY MARCH-APRIL
Minimum daily caloric requirement
ACCESS TO FOOD FROM ALL SOURCES .has improved somewhat, but remains severely constrained
for the poorest segments of the affected population
6 6 6
7
6 64 4 4
6
45
AFAR AMHARA OROMIYA SNNPR SOMALI TIGRAY
MEAN HOUSEHOLD SIZE VS.HOUSEHOLD MEMBERS REGISTERED FOR ASSISTANCE
MEAN HOUSEHOLD SIZE
MEAN NUMBER OF HOUSEHOLD MEMBERS REGISTERED FOR ASSISTANCE
!

WFP Ethiopia Drought Emergency Household Food Security Bulletin #2
31 May 2016
Page | 4
Funded by the Humanitarian Response Fund (HRF)
DIETARY DIVERSITY
Access to, and consumption of
other foods remains limited. The
main items regularly consumed
by households are cereals and
oil—and primarily, the source of
these items is the emergency
food ration. Although there has
been a slight increase in
consumption of pulses and
vegetables since February,
dietary diversity remains low,
with little to no nutrient dense
foods being eaten by family
members. This has serious
implications for malnutrition
rates among young children who
do not have access to a sufficient
quantity and variety of foods at
the household level.
The continued critical situation for the drought-affected population, with access to
food severely limited, low dietary diversity, and the continued widespread use of
negative and damaging coping strategies, means that the importance of timely, consistent
and complete food rations, combined with a solid response across other key humanitarian
sectors cannot be overestimated.
KEY REGIONAL FINDINGS
REGION
FOOD CONSUMPTION AND DIETARY DIVERSITY COPING ECONOMIC
VULNERABILITY POOREST 20%
INADEQUATE FOOD CONSUMPTION
DIETARY DIVERSITY
LOW DIETARY DIVERSITY
COPING STRATEGIES
HIGH FOOD
EXPENDITURE
SHARE (65%+)
FOOD REQUIREMENTS COVERED THROUGH OWN
MEANS
% Households Mean number of
food groups (0-7) % Households
Mean Coping
Strategy Index % Households % monthly coverage
AFAR 40 (-27%) 4 (+1) 67 (-19%) 15 (-5) 72 (+82%) 15 (=)
AMHARA 10 (-76%) 3 (=) 95 (=) 23 (-6) 79 (-22%) 18 (+12%)
OROMIA 51 (-6%) 3 (-1) 84 (+1%) 21 (+3) 70 (+27%) 16 (+45%)
SNNPR 41 (-32%) 4 (=) 65 (-10%) 17 (-2) 68 (-3%) 10 (-47%)
SOMALI 61 (+3%) 3 (-1) 90 (+12%) 12 (+1) 66 (+24%) 19 (+90%)
TIGRAY 25 (-50%) 4 (=) 59 (-29%) 7 (-7) 73 (-10%) 17 (=)
Again, sampled relief beneficiary households in all regions are reporting poor food consumption, poor
dietary diversity, and a high food expenditure share. Across most regions, however, food consumption
has improved significantly, with the exception being Somali region, which is reporting a very slight
deterioration.
Households in Amhara continue to warrant special attention, even with the lowest
rate of inadequate food consumption. With the lowest rate of dietary diversity, the
highest use of negative coping strategies, and the highest share of disposable income going
towards food purchases – the situation in the region warrants concern.
00
+1
+1
0
2
4
6
8
FOOD CONSUMPTION AND DIETARY DIVERSITYCOUNTRYWIDE, MARCH/APRIL 2016 (AND CHANGE FROM FEBRUARY)
FEBRUARY
MEAN
NU
MBER O
F D
AYS C
ON
SU
MED
!
!
WFP Ethiopia Drought Emergency Household Food Security Bulletin #2
31 May 2016
Page | 5
Funded by the Humanitarian Response Fund (HRF)
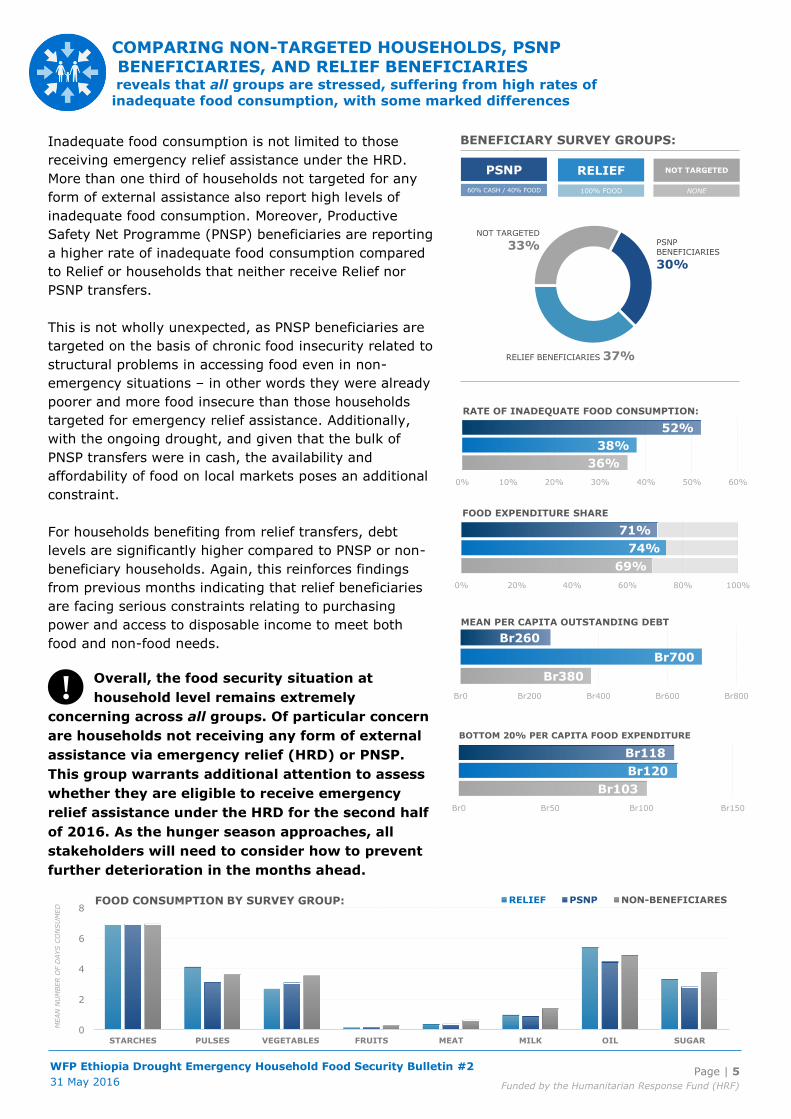
Inadequate food consumption is not limited to those
receiving emergency relief assistance under the HRD.
More than one third of households not targeted for any
form of external assistance also report high levels of
inadequate food consumption. Moreover, Productive
Safety Net Programme (PNSP) beneficiaries are reporting
a higher rate of inadequate food consumption compared
to Relief or households that neither receive Relief nor
PSNP transfers.
This is not wholly unexpected, as PNSP beneficiaries are
targeted on the basis of chronic food insecurity related to
structural problems in accessing food even in non-
emergency situations – in other words they were already
poorer and more food insecure than those households
targeted for emergency relief assistance. Additionally,
with the ongoing drought, and given that the bulk of
PNSP transfers were in cash, the availability and
affordability of food on local markets poses an additional
constraint.
For households benefiting from relief transfers, debt
levels are significantly higher compared to PNSP or non-
beneficiary households. Again, this reinforces findings
from previous months indicating that relief beneficiaries
are facing serious constraints relating to purchasing
power and access to disposable income to meet both
food and non-food needs.
Overall, the food security situation at
household level remains extremely
concerning across all groups. Of particular concern
are households not receiving any form of external
assistance via emergency relief (HRD) or PNSP.
This group warrants additional attention to assess
whether they are eligible to receive emergency
relief assistance under the HRD for the second half
of 2016. As the hunger season approaches, all
stakeholders will need to consider how to prevent
further deterioration in the months ahead.
0
2
4
6
8
STARCHES PULSES VEGETABLES FRUITS MEAT MILK OIL SUGAR
FOOD CONSUMPTION BY SURVEY GROUP: RELIEF PSNP NON-BENEFICIARES
MEAN
NU
MBER O
F D
AYS C
ON
SU
MED
Br103
Br120
Br118
Br0 Br50 Br100 Br150
BOTTOM 20% PER CAPITA FOOD EXPENDITURE
36%
38%
52%
0% 10% 20% 30% 40% 50% 60%
RATE OF INADEQUATE FOOD CONSUMPTION:
69%
74%
71%
0% 20% 40% 60% 80% 100%
FOOD EXPENDITURE SHARE
Br380
Br700
Br260
Br0 Br200 Br400 Br600 Br800
MEAN PER CAPITA OUTSTANDING DEBT
COMPARING NON-TARGETED HOUSEHOLDS, PSNP .BENEFICIARIES, AND RELIEF BENEFICIARIES reveals that all groups are stressed, suffering from high rates of
inadequate food consumption, with some marked differences
!
PSNP RELIEF NOT TARGETED
BENEFICIARY SURVEY GROUPS:
60% CASH / 40% FOOD 100% FOOD NONE
PSNP
BENEFICIARIES
30%
RELIEF BENEFICIARIES 37%
NOT TARGETED
33%

WFP Ethiopia Drought Emergency Household Food Security Bulletin #2
31 May 2016
Page | 6
Funded by the Humanitarian Response Fund (HRF)
GAMBELLA
B.GUMUZ
SURVEY COVERAGE
412 relief beneficiary
households
340 PSNP households
370 non-beneficiary
households
1122 HOUSEHOLDS TOTAL
Humanitarian needs in Ethiopia have tripled since early 2015 as severe drought
in some regions, exacerbated by the strongest El Nino in decades, caused
successive harvest failures and widespread livestock deaths. Acute malnutrition
has risen sharply, and one quarter of Ethiopia’s districts are now officially
classified as facing a nutrition crisis. Out of 10.2 million people now requiring
urgent humanitarian assistance, WFP is tasked with supporting the government
in meeting the needs of 7.6 million people in 2016.
As Ethiopia enters the traditional “hunger season”, additional
resources for these efforts are required immediately. So far, in spite of
the best efforts of many donors, funding has not kept pace with needs.
2016 ETHIOPIA DROUGHT EMERGENCY
[email protected] | wfp.org/countries/Ethiopia