Westside Reinvestment Plan - cdac.files. · PDF fileW estside Reinvestment Plan Executive...
24
W tside R einvtment Plan City San Antonio, Planning and Development Servic Department September 2009
Transcript of Westside Reinvestment Plan - cdac.files. · PDF fileW estside Reinvestment Plan Executive...

Westside Reinvestment Plan
City of San Antonio, Planning and Development Services DepartmentSeptember 2009

City of San Antonio Planning & Development Services Department� �
Acknowledgments
Mayor and City CouncilJulián Castro, MayorMary Alice P. Cisneros, District 1Ivy R. Taylor, District 2Jennifer V. Ramos, District 3Philip A. Cortez, District 4David Medina, Jr., District 5Ray Lopez, District 6Justin Rodriguez, District 7W. Reed Williams, District 8Elisa Chan, District 9John G. Clamp, District 10
City ManagerSheryl L. Sculley
Deputy City ManagersPat DiGiovanniA.J. Rodriguez
Assistant City ManagersFrances A. GonzalezErik J. WalshPenny Postoak FergusonT.C. BroadnaxSharon de la Garza
Community Development Advisory CommitteeAlbert CarrisalezChristina Castano-PerezChristine DrennonJennifer GonzalezDebra GuerreroDominique HalabyIgnacio PerezJ. Oscar RamirezNancy RochaSteven Sano
City of San AntonioPlanning & Development Services DepartmentRoderick J. Sanchez, AICP, CBO, DirectorPatrick B. Howard, AICP, Assistant DirectorRichard L. Milk, AICP, CD CoordinatorNina Nixon-Mendez, AICP, Planning Manager
Andrea Gilles; Senior Management Analyst*Gary Edenburn; Senior Planner**Joe G. Mendoza; Senior Management AnalystKristine Egan; Senior GIS AnalystCory Lime; Senior Real Estate SpecialistMichael Taylor, AICP; Senior PlannerRebecca Paskos; Senior PlannerLoretta Olison; Senior PlannerJohn Osten; Senior PlannerLauren Edlund; PlannerTyler Sorrells, AICP; PlannerSidra Maldonado; Planner
*Project Lead** Project Planner
Advisory StakeholdersWestside Development Corporation (WDC)Avenida Guadalupe AssociationGuadalupe Cultural Arts CenterUniversity of Texas at San AntonioVIA Metropolitan TransitCOSA TIF UnitCOSA Office of Historic PreservationUniversity Health SystemChristus Santa RosaHaven for HopeSan Antonio River Authority (SARA)
�Westside Reinvestment Plan
�
Table of Contents
Executive Summary ...................................................................................................................................... 5
I. Introduction ....................................................................................................................................... 7Plan PurposeStudy AreaPlanning ProcessRelationship to Other Plans
II. AreaProfile........................................................................................................................................15DemographicsPhysical ConditionsMarket ConditionsCapacity: Neighborhood Associations
III. Assets and Opportunities ................................................................................................................. 25IntroductionSegment A: Cattleman Square Area .............................................................................................. 27
Priority Actions ........................................................................................................................... 40Segment B: Avenida Guadalupe Area ........................................................................................... 41
Priority Actions ........................................................................................................................... 46Segment C: Apache Creek/Union Stockyards Area ...................................................................... 47
Priority Actions ........................................................................................................................... 49Segment D: S. Flores/Cevallos St. Area ........................................................................................ 50
Priority Actions ........................................................................................................................... 53Segment E: Roosevelt Park/S. Presa Street Area ........................................................................ 54
Priority Actions ........................................................................................................................... 55
IV. Reinvestment Strategies .................................................................................................................. 57PolicyAction Plan Matrix Summary .......................................................................................................... 61Action Plan Matrix ........................................................................................................................... 62
V. Appendix ............................................................................................................................................ 69Adopted Neighborhood and Community Plan GoalsWestside Studies, Reports and Plans
ExhibitsMap I: Westside Reinvestment Plan Study Area .......................................................................... 9Map II: Study Area Segments - Westside Reinvestment Plan ..................................................... 10Map III: Westside Reinvestment Plan and Tax Increment Reinvestment Zone Boundaries ..... 13Map IV: Segment A Study Area ...................................................................................................... 27Map V: Segment B Study Area ....................................................................................................... 41Map VI: Segment C Study Area ...................................................................................................... 47Map VII: Segment D Study Area ..................................................................................................... 50Map VIII: Segment E Study Area .................................................................................................... 54

City of San Antonio Planning & Development Services Department� �
Maps Disclaimer
The City of San Antonio has attempted to assure the accuracy of this data for its internal uses and for no oth-er purposes. The City of San Antonio did not develop this data as a commercial produce. Consequently, the City of San Antonio makes no warranty, representation or guaranty as to the content, sequence, accuracy, timeliness or completeness of all or any part of this data. The users should not rely on the data provided for any reason unless and until the user independently verifies the accuracy of any such data to the user’s per-sonal satisfaction. The City of San Antonio explicitly disclaims any representation and warranties, including, without limitation, the implied warranties of merchantability and fitness for a particular purpose. The City of San Antonio assumes no liability for any errors, omissions or inaccuracies in the data provided regardless of how caused. The City of San Antonio assumes no liability for any decision made or actions taken or not taken by the user of this data in reliance upon any data furnished hereunder.
The use of this data indicates your unconditional acceptance of all risks associated with the use of this data.
Copies of this plan may be obtained at:Cliff Morton Development & Business Services Center1901 South Alamo StreetSan Antonio, TX 78204
�Westside Reinvestment Plan
�
Executive Summary
The Westside Reinvestment Plan considers anticipated development projects within the boundary area and provides specific public investment recommendations intended to promote and encourage additional private development. Using adopted area plans and stakeholder master plans as guides, the reinvestment plan recommendations complement the development activity occurring and proposed for the Reinvestment Plan area.
This document provides a summary of the reinvestment plan purpose, an explanation of the determined boundary, a demographic profile of the area, an overview of area assets and opportunities including planned and proposed projects, and reinvestment strategies to guide implementation. The reinvestment plan recommendations seek to leverage planned projects to further private economic activity in the Westside. Moreover, these recommendations demonstrate future project commitments to the area, the development community, and stakeholders.
The document is divided into five sections: Introduction and Background;Area Profile;Assets and Opportunities; Reinvestment Strategies; andAppendix
Due to the large scale of the Reinvestment Plan area, it has been broken down into five, more manageable segments based on geography, character, and commonalities between stakeholders. The Assets and Opportunities section outlines planned and proposed projects by segment. At the end of each segment description a list of priority actions, based on goals from adopted plans, current master planning processes, and stakeholder input, is outlined.
In the Reinvestment Strategies section of the document, the priority actions that have been outlined by segment in the previous section are again integrated as a whole into a consolidated Action Plan Matrix. This matrix is used to identify each recommended action, potential funding source, and project partner. While it serves to be the guiding section of the working plan, it is also intended to be a dynamic document for funding and prioritized project resources. The Action Plan Matrix may be updated as new funding sources become available, new projects are adopted and/or implemented, and/or priorities change for the Westside Reinvestment Plan area.
The Appendix includes a more detailed list of goals and objectives, relevant to the Reinvestment Plan area, from the applicable Neighborhood and Community Plans adopted by City Council. A list of additional plans, reports and studies that were reviewed to inform the Reinvestment Plan is also included.
•••••

City of San Antonio Planning & Development Services Department�
This Page Intentionally Left Blank

�
I. Introduction
City of San Antonio Planning & Development Services Department� �
Plan Purpose
Reinvestment Plans set comprehensive community development goals for an area of study, including strategies for targeted reinvestments in the physical environment; infrastructure, housing, transportation, parks and in the social elements; education, health, workforce development, and economic opportunity. Some areas within the Reinvestment Plan may already be covered by adopted Neighborhood, Community, and Perimeter Plans that outline multiple goals and objectives as established by the different neighborhoods.
The Westside Reinvestment Plan is guided by four adopted plans; the Downtown Neighborhood Plan, the Guadalupe Westside Community Plan, the Nogalitos/S. Zarzamora Community Plan, and the South Central San Antonio Community Plan. The goals in those plans have been inventoried into a manageable set of concrete priority actions that outline the foundation for implementation.
In December 2008, the Westside Tax Increment Reinvestment Zone (TIRZ) Number 30 was established to finance the implementation of plan goals and stimulate additional private investment within the zone. Before increment can be dispersed, a project plan must be prepared for the TIRZ that describes the nature, cost, and phasing of the public and private improvements to be supported by the TIRZ. The Westside Reinvestment Plan has been prepared to establish a framework for the TIRZ Project Plan.
In addition to TIRZ eligible projects, the Plan also targets areas within which to focus the resources of multiple city departments, public agencies and other stakeholders in order to maximize the impact of services and reinvestment. To accomplish these tasks, a key component of the Reinvestment Planning process is to build and solidify partnerships among the stakeholders and approach implementation through a coordinated effort.
Study Area
The Westside Reinvestment Plan falls within Council Districts 1 and 5, and its southernmost portion is adjacent to Districts 2 and 3. The area is generally situated between Martin Street to the north, Zarzamora Street to the west, IH 10 to the south and South Flores Street to the east. The major east/west arterials within the interior of the plan area are Commerce Street and Avenida Guadalupe. The area consists of approximately 2,187 acres and encompasses 3.4 square miles. A map of the Westside Reinvestment Plan area can be found on the adjacent page (Map I).
Introduction

�Westside Reinvestment Plan
�
Map I: Westside Reinvestment Plan Study Area
Given the vast scope of the Westside Reinvestment Plan, the area has been segmented to more effectively manage data and the analysis for the area. These segments, identified as A, B, C, D and E, are conceptual and intentionally overlap to acknowledge that projects and proposals between segments are interrelated and in many cases the strength of the area as a whole depends upon a individual projects in any given segment. The overlapping of the sections also conveys the importance of linking each of the areas; for example, exploring near Westside connectivity to and from the Downtown Central Business District, which is currently constrained by physical and perceived barriers.
Section A includes the Cattleman Square Historic District, the UTSA downtown campus, the proposed Westside Multimodal facility, and several planned private and public developments. Commerce St., from S. Flores to Zarzamora St., is the focus of the east-west corridor. Frio St. functions as the north-south corridor, connecting Sections A, B, and C. The purpose of connectivity is not to uniform the Sections, but rather to link each area’s unique character by establishing gateway corridors and a thread of destination points.
Section B primarily focuses on the Avenida Guadalupe area. Most of the reinvestment goals and objectives for this section stem from the Guadalupe Westside Community Plan and Avenida Guadalupe Corridor Strategic Revitalization Plan. Adopted in 2007, these plans serve as the foundation for reinvestment strategies in Section B. Additional considerations for this area include improved connectivity to the downtown area and
!"#$53
!"#$01
(/182
!"#$73
(/09!"#$01
HA
CK
BER
RY
ST
FR
IOS
T
W COMMERCE ST
FRIO
CITY
RD
ZA
RZ
AM
OR
AS
T.
SB
RA
ZO
SS
T
GUADALUPE ST
NOLAN
CO
LO
RA
DO
ST
MARTIN ST
NOGALI
TOS
ST
E HOUSTON ST
IOWA ST
STEVESAVE.
ZA
RZ
AM
OR
AS
T.
Roosevelt
Amistad
Milam
G. Martinez
Escobar FieldCassiano
Columbus
Mario Farias
Commanders House
Eduardo Garcia
0 0.2 0.4 0.6
Miles
Westside Reinvestment Plan Areaµ
Map Last Edited: 10 July 2009PDF: K:\Neighborhoods\Reinvestment Plans\Westside\Maps PDFs
Data Source: City of San Antonio Enterprise GIS, Bexar Metro 911, Bexar Appraisal District
Map Created by: Andrea GillesMap file location: K:\Neighborhoods\Reinvestment Plans\Westside\Mapping
"This Geographic Information System Product, received from The City of San Antonio is provided "as is" without warranty of any kind, and theCity of San Antonio expressly disclaims all express and implied warranties, including but not limited to the implied warranties of merchantability andfitness for a particular purpose. The City of San Antonio does not warrant, guarantee, or make any representations regarding the use, or the resultsof the use, of the information provided to you by the City of San Antonio in terms of correctness, accuracy, reliability, timeliness or otherwise.The entire risk as to the results and performance of any information obtained from the City of San Antonio is entirely assumed by the recipient."
"Please contact the responsible City of San Antonio Department for specific determinations."
moola
Westside RPACouncil District
1235ParksCreekways
City of San AntonioPlanning & Development Services
Department
Development and Business Services Center1901 S. Alamo
San Antonio, TX 78204
Roderick J. Sanchez, AICP, CBODirector
City of San Antonio
Introduction

City of San Antonio Planning & Development Services Department10 11
surrounding sections. Avenida Guadalupe is a vibrant cultural gateway to the Westside, with several projects and developments planned along the corridor.
Section C consists of the lower section of the Westside TIRZ boundary which incorporates the Produce Terminal and Guadalupe Lumber areas to the west near Zarzamora Street and extends east across IH 35. Apache Creek bounds the segment to the north. The Union Stockyards is also included in this area where SAHA is currently developing a new, modern multi-family complex.
Segment D encompasses the S. Flores/S. Alamo/Cevallos Streets neighborhood. Although the area does have pockets of established single family neighborhoods, industrial and warehouse uses were also prominent for years. The area is currently transitioning back to a more residential address with the recent construction of several urban, mixed use developments. Several loft developments have sprung up along S. Flores and other are proposed near Cevallos and Probandt Streets. The area is also positioned just to the west of the Eagleland River Improvements project currently underway.
Segment E provides development opportunities along the former Presa Real Neighborhood Commercial Revitalization corridor on South Presa to the southeast of the Reinvestment Plan area. The Lone Star Brewery off of Probandt is just outside of the Plan area and Newell Recycling anchors the segment to the south. Although this section is geographically disconnected from the Westside, projects within these sections can help link the plan area to the Roosevelt Reinvestment Plan efforts immediately to the south of IH 10.
Map II: Study Area Segments - Westside Reinvestment Plan
!"#$53
!"#$01
(/182
!"#$73
(/09!"#$01
Roosevelt
Amistad
Milam
G. Martinez
Escobar FieldCassiano
Columbus
Mario FariasEduardo Garcia
Commanders House
Segment E
Segment DSegment C
Segment B
Segment A
HACKBER
RY
ST
FRIO
ST
W COMMERCE ST
FRIO
CITY RD
ZARZAM
ORA
ST.
SBRAZO
SST
GUADALUPE ST
STEVES AVE.
NOLAN
CO
LORAD
OST
MARTIN ST
NOGA
LITO
SST
KELL
YPA
RKW
AY
SW
24TH
ST
E HOUSTON ST
E COMMERCE ST.
IOWA ST
NW
24TH
ST
FLORES
ST
CASTROVILLE RD
PRO
BANDT
ST
E. DURANGOBLVD
ZARZAM
ORA
ST.
0 0.2 0.4 0.6
Miles
Westside Reinvestment Planµ
Map Last Edited: 7 August 2009PDF: K:\Neighborhoods\Reinvestment Plans\Westside\Maps PDFs\Wside_RPA_w_Segments_Update
Data Source: City of San Antonio Enterprise GIS, Bexar Metro 911, Bexar Appraisal District
Map Created by: Andrea GillesMap file location: K:\Neighborhoods\Reinvestment Plans\Westside\Mapping
"This Geographic Information System Product, received from The City of San Antonio is provided "as is" without warranty of any kind, and theCity of San Antonio expressly disclaims all express and implied warranties, including but not limited to the implied warranties of merchantability andfitness for a particular purpose. The City of San Antonio does not warrant, guarantee, or make any representations regarding the use, or the resultsof the use, of the information provided to you by the City of San Antonio in terms of correctness, accuracy, reliability, timeliness or otherwise.The entire risk as to the results and performance of any information obtained from the City of San Antonio is entirely assumed by the recipient."
"Please contact the responsible City of San Antonio Department for specific determinations."
moola
Westside RPAParksCreekwaysSan Antonio RiverRailroads
City of San AntonioPlanning & Development Services
Department
Development and Business Services Center1901 S. Alamo
San Antonio, TX 78204
Roderick J. Sanchez, AICP, CBODirectorStudy Area Segments

10Westside Reinvestment Plan
11
Planning Process
On September 4, 2008, the Strategic Plan for Community Development was adopted by the San Antonio City Council. The Plan provides a framework for focusing and coordinating public and private sector resources to targeted areas to stimulate sustainable redevelopment. To oversee implementation, the Community Development Advisory Committee (CDAC) was created. The committee is composed of 11 members representing the various sectors impacting community development goals; public transit, real estate, non profit housing, school districts, etc.
In February 2009, the CDAC selected three Reinvestment Plan areas: Dignowity Hill on the eastside; the Roosevelt Corridor to the south; and the Westside Multimodal, UTSA, and Avenida Guadalupe on the near westside. Neighborhood Planners were charged with analyzing existing conditions and proposed projects within each of the areas, and based upon that analysis, finalizing the Plan boundaries. The current Westside Reinvestment Plan boundary is a reflection of that analysis as well as a response to planning needs within the larger area, specifically, the establishment of the Westside Tax Increment Reinvestment Zone (TIRZ).
The Westside Reinvestment Plan builds upon previous studies, reports and plans that have been prepared for the area over the past three decades. A list of the documents that were reviewed can be found in the Appendix. In addition to document review, individual and small group meetings with key stakeholders began in April 2009 to discuss opportunity projects in the area. Several stakeholders within the plan area are undergoing concentrated master planning processes. Meetings were held with each of the stakeholders to gather additional project information. Larger meetings were held with key stakeholders between July and September in the Avenida Guadalupe neighborhood and near Cattleman Square. Commonalities and complementary project goals were summarized and, along with objectives from the adopted plans, formed the basis for the Reinvestment Plan strategies and action priorities.
Relationship to Other Plans and Programs
Strategic Plan for Community DevelopmentThe Strategic Plan for Community Development was adopted by City Council on September 4, 2008. Within its three-year “rolling” time span, the Plan proposes a rationale for focused investment strategies to address all elements of the living and built environment that constitute a sustainable community.
The Strategic Plan includes three innovative elements:Coordination of public and private sector investments are facilitated through the Community Development Advisory Committee (CDAC)The annual identification of Reinvestment Plan Areas focuses the resources of multiple departments, agencies, and stakeholders in targeted areas to stimulate comprehensive community developmentImplementation proposals, reporting, and evaluation rely on indicators and measurable outcomes derived from a city-wide real estate market value analysis
The Strategic Plan builds on previous and ongoing community development efforts by the City of San Antonio, local public agencies, non-profit organizations, community development corporations, neighborhoods, and the private sector. The successful implementation of the Strategic Plan for Community Development requires the close coordination of a diverse array of resources. This coordination is conceptualized as three components: 1) Reinvestment Planning; 2) Coordinating City Resources; and 3) Leveraging Private Sector Investment. The responsibility for overseeing implementation progress among these three components lies within the Community Development Advisory Committee.
1.
2.
3.
Introduction

City of San Antonio Planning & Development Services Department1� 1�
Community and Neighborhood PlansThe Westside Reinvestment Plan area is guided by four Community and Neighborhood Plans that have been adopted by City Council:
Downtown Neighborhood Plan; adopted 1999, updated 2004 and 2009 Nogalitos/S. Zarzamora Community Plan; adopted 2004South Central San Antonio Community Plan; adopted 1999, updated 2005Guadalupe Westside Community Plan; adopted 2007
Community and Neighborhood Plans identify a comprehensive set of strategies and goals that outline a community’s vision for the future and the action steps necessary to achieve that vision. Neighborhood Plans are of a smaller scale than Community Plans and are generally composed of the geographic size of two or more neighborhood association areas and/or the population necessary to support an elementary school. Community Plans focus on larger geographic areas that include between 20,000 and 60,000 people and several neighborhoods; the population generally necessary to support at least one middle or high school.
All plans include goals pertaining to land use, community facilities, and transportation networks. They may also identify housing and economic development related goals. Each plan is formally approved by Planning Commission and adopted by City Council as a component of the City’s Comprehensive Master Plan.
Tax Increment Reinvestment ZoneTax Increment Financing (TIF) is a tool used to attract development and reinvestment to areas that are currently not benefiting from private-sector investment. The area in which TIF is being used is known as a Tax Increment Reinvestment Zone (TIRZ). The City of San Antonio’s highest priority use of TIF is the revitalization of inner-city neighborhoods and commercial districts, particularly in those areas located inside Loop 410 and south of Highway 90. Tax Increment Reinvestment Zones act as economic stimuli to surrounding areas. By leveraging private investment for certain types of development within a targeted area, TIF can be used to finance new and/or enhanced public improvements and infrastructure. Ideally, these improvements and infrastructure, in turn, attract additional private investment in surrounding areas.
A TIRZ is one of the few planning tools available to the City that contains a built-in mechanism to finance implementation. TIF allows a percentage of future ad valorem and sales tax revenue to pay for the construction of public infrastructure improvements. A Finance Plan created to demonstrate how new development or redevelopment will generate new tax revenue (“tax increment”), and to what extent that tax increment can pay for the public infrastructure that is required to support the new development. Since Zones are created with defined life spans of up to 25 years, development must take place fairly quickly. Tax increment is a relatively small amount of money; the City’s share is $0.58 per $1,000 of value, for example. Increment does not include any existing value, only the new value that is created as a result of the Zone.
Westside TIRZThe Westside TIRZ #30 was established in December 2008 to fund capital improvements and stimulate additional private investment in the area. The Zone covers approximately 1,531 acres, and consists of 1,131.69 parcel acreage, of which, 121.85 acres is residential. The term of the Westside TIRZ is 25 years, and will extend through fiscal year 2033. Currently, the City is the only participating taxing entity. The tax year 2008 was used to asses the base value of the zone.
Table I: TIRZ 2008 Base Values2008 Base Appraised Exemption
Amount2008 Base
Taxable ValueLand Value Impr. Value Total Value257,497,552 296,835,481 554,333,033 (150,680,587) 403,652,446
Source: City of San Antonio, Finance Department, June 2009
••••

1�Westside Reinvestment Plan
1�
!"#$53
!"#$01
(/182
!"#$73
(/09!"#$01
!"#$53
ÆP
ÆPÆPÆP
ÆP
ÆP ÆP
ÆP
ÆP
ÆP
¹½
¹½
¹½
¹½
¹½
¹½
¹½
¹½
¹½
¹½
¹½¹½
¹½
¹½
¹½
¹½
¹½ ¹½
¹½
¹½
¹½
Æc
FRIO
ST
MALONE ST
W COMMERCE ST
ZARZAM
ORA
ST.
FRIO
CITY RD
CO
LORAD
OST
NOGA
LITO
SST
SBRAZO
SST
GUADALUPE ST
STEVES AVE.
CYPRESS
PRO
BANDT
ST
MARTIN ST
FLORESST
SPR
ESA
ST.
SANPED
ROAVE
RO
OSEV
ELTAV
E.
NM
AIN
AVE
NOLAN
McCULLO
UGH
AVE
NLA
REDO
ST
FREDERICKSBURG RD
BROOKLYN
AVE
ZARZAM
ORA
ST.
FLORES
ST
Roosevelt
Amistad
Milam
G. Martinez
Escobar Field
Eduardo Garcia
Cassiano
Columbus
Mario Farias
Commanders House
0 0.2 0.4 0.6
Miles
Westside Reinvestment Plan Area µMap Last Edited: 10 July 2009PDF: K:\Neighborhoods\Reinvestment Plans\Westside\Maps PDFs
Data Source: City of San Antonio Enterprise GIS, Bexar Metro 911, Bexar Appraisal District
Map Created by: Andrea GillesMap file location: K:\Neighborhoods\Reinvestment Plans\Westside\Mapping
"This Geographic Information System Product, received from The City of San Antonio is provided "as is" without warranty of any kind, and theCity of San Antonio expressly disclaims all express and implied warranties, including but not limited to the implied warranties of merchantability andfitness for a particular purpose. The City of San Antonio does not warrant, guarantee, or make any representations regarding the use, or the resultsof the use, of the information provided to you by the City of San Antonio in terms of correctness, accuracy, reliability, timeliness or otherwise.The entire risk as to the results and performance of any information obtained from the City of San Antonio is entirely assumed by the recipient."
"Please contact the responsible City of San Antonio Department for specific determinations."
moola
Westside RPAWestside TIRZ
¹½ SchoolsÆc
LibrariesÆP
hospitalsParksCreekwaysSan Antonio RiverRailroads
City of San AntonioPlanning & Development Services
Department
Development and Business Services Center1901 S. Alamo
San Antonio, TX 78204
Roderick J. Sanchez, AICP, CBODirectorCity of San Antonio
Map III: Westside Reinvestment Plan and Tax Increment Reinvestment Zone Boundaries
As previously mentioned, one of the purposes of the Westside Reinvestment Plan is to inform the project plan for the TIRZ. The TIRZ boundary was used to establish the Reinvestment Plan area, which incorporates the census block groups immediately adjacent to the TIRZ. The Map III below shows the Westside TIRZ boundary as it relates to the Westside Reinvestment Plan area.
Introduction

City of San Antonio Planning & Development Services Department1�
This Page Intentionally Left Blank

1�
II. Area Profile
City of San Antonio Planning & Development Services Department1� 17
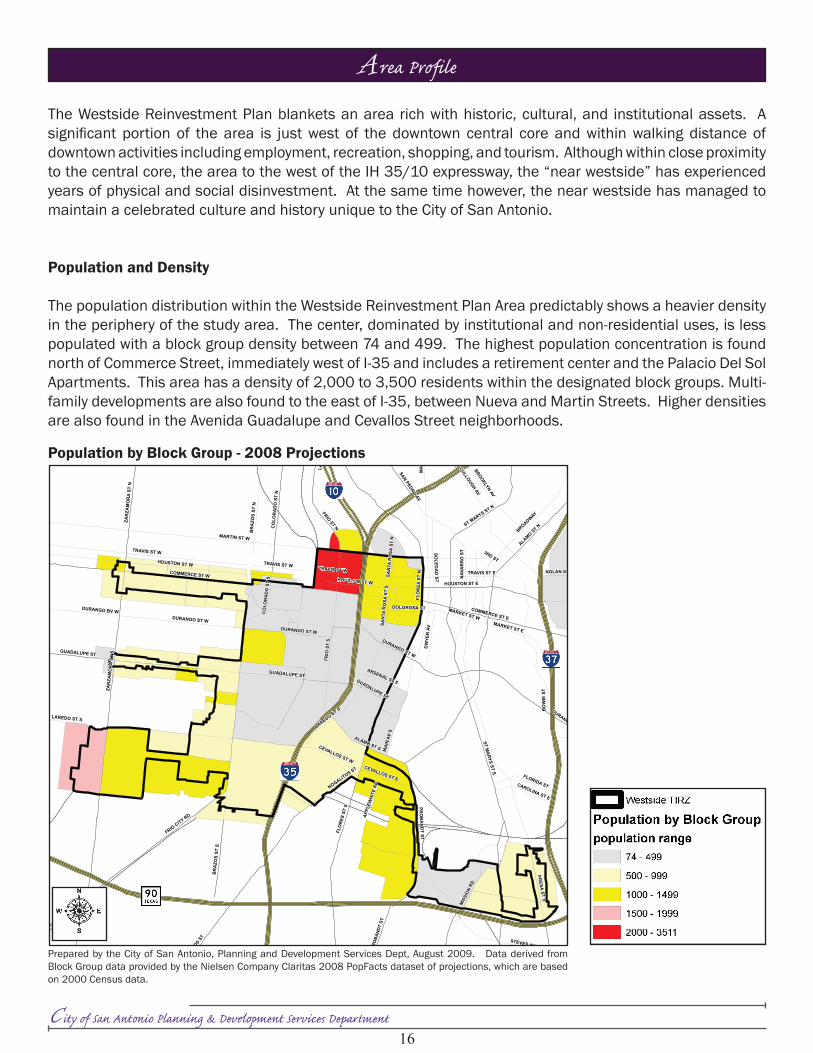
Area Profile
The Westside Reinvestment Plan blankets an area rich with historic, cultural, and institutional assets. A significant portion of the area is just west of the downtown central core and within walking distance of downtown activities including employment, recreation, shopping, and tourism. Although within close proximity to the central core, the area to the west of the IH 35/10 expressway, the “near westside” has experienced years of physical and social disinvestment. At the same time however, the near westside has managed to maintain a celebrated culture and history unique to the City of San Antonio.
Population and Density
The population distribution within the Westside Reinvestment Plan Area predictably shows a heavier density in the periphery of the study area. The center, dominated by institutional and non-residential uses, is less populated with a block group density between 74 and 499. The highest population concentration is found north of Commerce Street, immediately west of I-35 and includes a retirement center and the Palacio Del Sol Apartments. This area has a density of 2,000 to 3,500 residents within the designated block groups. Multi-family developments are also found to the east of I-35, between Nueva and Martin Streets. Higher densities are also found in the Avenida Guadalupe and Cevallos Street neighborhoods.
Prepared by the City of San Antonio, Planning and Development Services Dept, August 2009. Data derived from Block Group data provided by the Nielsen Company Claritas 2008 PopFacts dataset of projections, which are based on 2000 Census data.
PRESA
STS
FLO
RES
STS
ZAR
ZAM
OR
AST
S
BR
AZO
SST
S
COMMERCE ST W
MARTIN ST W
MALONE ST W
STM
ARYSST
S
FRIOCITY RD
STEVES AV
HOUSTON ST W
MA
INAV
N
MAI
NAV
S
ALAMO ST S
FLO
RES
STN
FRIOST N
BO
WIE
ST
FRIO
STS
BROADWAY
RO
OSEVELT
AV
ST MARYS ST N
THEO AV E
HOUSTON ST E
NAV
AR
RO
ST
PRO
BA
ND
TST
COMMERCE ST E
THEO AV W
MCCULLOUGH
AV
DURANGO ST E
CO
LOR
AD
OST
N
NOGALITOS ST
DURANGO ST W
BR
AZO
SST
N
ZAR
ZAM
OR
AST
N
MIS
SIO
NRD
LAREDO ST S
BROOKLYNAV
SOLED
AD
ST
DURANGO BV W
SANPEDRO
AV
DW
YER
AV
TRAVIS ST E
SAN
TAR
OSA
STS
MARKET ST E
FLORIDA ST
DOLOROSA ST
NOLAN ST
MARKET ST W
CEVALLOS ST W
CH
ERRY
STS
CEVALLOS ST E
CO
LOR
AD
OST
S
TRAVIS ST W
CAROLINA ST E
GUADALUPE ST
LAR
EDO
STN
SAN
TAR
OSA
STN
ALAMOST N
ARSENAL ST E
APPL
EWHI
TERD
3RD STTRAVIS ST W
HOUSTON ST W
GUADALUPE ST
DURANGO ST W
THEO AV W
DURANGO ST W
LAREDO ST S
PRO
BAN
DT
ST
NOGALITO
SST
TRAVIS ST W
GUADALUPE ST
Westside Reinvestment Plan Area
City of San Antonio0 0.25 0.5 0.75 10.125 Miles
POPULATIONWestside TIRZ
Population by Block Grouppopulation range
74 - 499
500 - 999
1000 - 1499
1500 - 1999
2000 - 3511
"This Geographic Information System Product, received from The City of San Antonio is provided "as is" without warranty of any kind, and theCity of San Antonio expressly disclaims all express and implied warranties, including but not limited to the implied warranties of merchantability andfitness for a particular purpose. The City of San Antonio does not warrant, guarantee, or make any representations regarding the use, or the resultsof the use, of the information provided to you by the City of San Antonio in terms of correctness, accuracy, reliability, timeliness or otherwise.The entire risk as to the results and performance of any information obtained from the City of San Antonio is entirely assumed by the recipient."
"Please contact the responsible City of San Antonio Department for specific determinations."
City of San Antonio Planning Department Planning Manager: Nina Nixon-Mendez, [email protected]. Maps may be ordered at: (210) 207-7873
Map Created by:Map Creation Date:Map file location:PDF Filename:
Population by Block Group - 2008 Projections

1�Westside Reinvestment Plan
17
Age
A younger population is prevalent around the UTSA and Avenida Guadalupe areas, exhibiting a median age of 25 and under. With the exception of a portion of the Cevallos Street neighborhood, the median age to the east of I-35 is between 35 and 50. In comparison with the City of San Antonio and Bexar County, the Reinvestment Plan area as a whole has a younger population with a median age of 31 in contrast to 34 for the City and County.
Table II: 2008 Projected Median and Average Ages
Bexar County City of San Antonio Westside RPA
Median Age 34 34 31Average Age 35 35 34Source: The data in this table are derived from Block Group data provided by the Nielsen Company Claritas 2008 PopFacts dataset of projections, which are based on 2000 Census data.
Prepared by the City of San Antonio, Planning and Development Services Dept, August 2009. Data derived from Block Group data provided by the Nielsen Company Claritas 2008 PopFacts dataset of projections, which are based on 2000 Census data.
PRESA
STS
FLO
RES
STS
ZAR
ZAM
OR
AST
S
BR
AZO
SST
S
COMMERCE ST W
MARTIN ST W
MALONE ST W
STM
ARYS
STS
FRIOCITY RD
STEVES AV
HOUSTON ST W
MA
INAV
N
MA
INAV
S
ALAMO ST S
FLO
RES
STN
FRIOST N
BO
WIE
ST
FRIO
STS
BROADWAY
RO
OSEVELT
AV
ST MARYS ST N
THEO AV E
HOUSTON ST E
NAV
AR
RO
ST
PRO
BA
ND
TST
COMMERCE ST E
THEO AV W
MCCULLOUGH
AV
DURANGO ST E
CO
LOR
AD
OST
N
NOGALITOS ST
DURANGO ST W
BR
AZO
SST
N
ZAR
ZAM
OR
AST
N
MIS
SIO
NRD
LAREDO ST S
BROOKLYNAV
SOLED
AD
ST
DURANGO BV W
SANPEDRO
AV
DW
YER
AV
TRAVIS ST E
SAN
TAR
OSA
STS
MARKET ST E
FLORIDA ST
DOLOROSA ST
NOLAN ST
MARKET ST W
CEVALLOS ST W
CH
ERRY
STS
CEVALLOS ST E
CO
LOR
AD
OST
S
TRAVIS ST W
CAROLINA ST E
GUADALUPE ST
LAR
EDO
STN
SAN
TAR
OSA
STN
ALAMOST N
ARSENAL ST E
APPL
EWHI
TERD
3RD STTRAVIS ST W
HOUSTON ST W
GUADALUPE ST
DURANGO ST W
THEO AV W
DURANGO ST W
LAREDO ST S
PRO
BAN
DT
ST
NOGALITO
SST
TRAVIS ST W
GUADALUPE ST
Westside Reinvestment Plan Area
City of San Antonio0 0.25 0.5 0.75 10.125 Miles
MEDIAN AGE
Westside TIRZ
Median Age by Block Group
age range19.80 - 24.99
25.00 - 29.99
30.00 - 34.99
35.00 - 39.99
40.00 - 44.99
45.00 - 49.99
50.00 - 54.99
"This Geographic Information System Product, received from The City of San Antonio is provided "as is" without warranty of any kind, and theCity of San Antonio expressly disclaims all express and implied warranties, including but not limited to the implied warranties of merchantability andfitness for a particular purpose. The City of San Antonio does not warrant, guarantee, or make any representations regarding the use, or the resultsof the use, of the information provided to you by the City of San Antonio in terms of correctness, accuracy, reliability, timeliness or otherwise.The entire risk as to the results and performance of any information obtained from the City of San Antonio is entirely assumed by the recipient."
"Please contact the responsible City of San Antonio Department for specific determinations."
City of San Antonio Planning Department Planning Manager: Nina Nixon-Mendez, [email protected]. Maps may be ordered at: (210) 207-7873
Map Created by:Map Creation Date:Map file location:PDF Filename:
Median Age by Block Group - 2008 Projections
Area Profile

City of San Antonio Planning & Development Services Department1� 1�
Educational Attainment
The map below is based on 2008 U.S. Census projections and shows by block group, the percentage of the population, over age 25 with less than a high school diploma. The numbers in the table and as shown in the map, clearly demonstrate a dire need for emphasis to be placed on education and retention in this area. In a significant portion of the plan area, 50% or more of the population over 25 does not have a high school diploma, compared to 21% and 23% in Bexar County and the City of San Antonio respectively.
Table III: 2008 Projected Educational AttainmentBexar
%City of San
Antonio %Westside
RPA %Total Population 1,585,685 1,290,393 30,281Population, Age 25+ 975,271 61.5% 793,988 61.5% 18,385 60.7%< 9Th Grade 100,162 10.3% 89,407 11.3% 5,782 31.4%Some HS, No Diploma 106,743 10.9% 92,173 11.6% 4,316 23.5%HS Graduate (Inc. Equivalency) 231,652 23.8% 187,409 23.6% 4,823 26.2%Some College, No Degree 238,510 24.5% 190,244 24.0% 2,165 11.8%Associate Degree 61,251 6.3% 48,461 6.1% 492 2.7%Bachelor’s Degree 149,587 15.3% 118,118 14.9% 514 2.8%Master’s/Professional/Doctorate 58,471 9.0% 45,487 8.6% 170 1.6%Source: The data in this table are derived from Block Group data provided by the Nielsen Company Claritas 2008 PopFacts dataset of projections, which are based on 2000 Census data.
The westside has a young and able workforce, but the numbers show too many do not meet the minimum educational requirements to fill existing and projected positions of employment. This data suggests that any economic development action plan must coincide with strategies and investment for overall community development on the City’s westside, with particular focus on education. If this is not realized, the gap between job opportunities and a prepared local workforce will continue to increase.
Prepared by the City of San Antonio, Planning and Development Services Dept, August 2009. Data derived from Block Group data provided by the Nielsen Company Claritas 2008 PopFacts dataset of projections, which are based on 2000 Census data.
Educational Attainment by Block Group - 2008 Projections

1�Westside Reinvestment Plan
1�
Median Household Income
The highest median income concentrations appear east of I-35, between Guadalupe Street and Durango, and an area immediately north of Highway 90, between Probandt Street and Mission Road. The median household income for the two block group sections range from $50,000 to $85,000. The Vista Verde Neighborhood block group, east of I-35, south of Guadalupe Street, and extending west to Brazos, has a significantly higher annual median household income of $40,000 to $45,000 compared to the surrounding area. However, the block group for the same neighborhood extending from Guadalupe Street to Durango reflects a lower median household income of under $20,000. In comparison with the City and County, both Median Household Income and Per Capita Income, are significantly lower in the Westside Reinvestment Plan area.
Table IV: 2008 Projected Median Household and Per Capita IncomesMedian Household Income Per Capita Income
Westside RPA $21,710 $10,419Bexar County $49,270 $21,564City of San Antonio $46,511 $20,517Source: The data in this table are derived from Block Group data provided by the Nielsen Company Claritas 2008 PopFacts dataset of projections, which are based on 2000 Census data.
PRESAST
S
FLO
RES
STS
ZARZ
AMO
RAST
S
BRAZ
OS
STS
COMMERCE ST W
MARTIN ST W
MALONE ST W
STM
ARYSST
S
FRIOCITY RD
STEVES AV
HOUSTON ST W
MAI
NAV
N
MAI
NAV
S
ALAMO ST S
FLO
RES
STN
FRIOST N
BOW
IEST
FRIO
STS
BROADWAY
ROO
SEVELTAV
ST MARYS ST N
THEO AV E
HOUSTON ST E
NAVA
RRO
ST
PRO
BAND
TST
COMMERCE ST E
THEO AV W
MCCULLOUGH
AV
DURANGO ST E
COLO
RAD
OST
N
NOGALITOS ST
DURANGO ST W
BRAZ
OS
STN
ZARZ
AMO
RAST
N
MIS
SION
RD
LAREDO ST S
BROOKLYNAV
SOLEDAD
ST
DURANGO BV W
SANPEDRO
AV
DWYE
RAV
TRAVIS ST E
SANT
ARO
SAST
S
MARKET ST E
FLORIDA ST
DOLOROSA ST
NOLAN ST
MARKET ST W
CEVALLOS ST W
CHER
RYST
S
CEVALLOS ST E
COLO
RAD
OST
S
TRAVIS ST W
CAROLINA ST E
GUADALUPE ST
LARE
DOST
N
SANT
ARO
SAST
N
ALAMOST N
ARSENAL ST E
APPL
EWHI
TERD
3RD STTRAVIS ST W
HOUSTON ST W
GUADALUPE ST
DURANGO ST W
THEO AV W
DURANGO ST W
LAREDO ST S
PRO
BAND
TST
NOGALITOS
ST
TRAVIS ST W
GUADALUPE ST
Westside Reinvestment Plan Area
City of San Antonio0 0.25 0.5 0.75 10.125 Miles
MEDIAN HOUSEHOLD INCOME
Westside TIRZ
Median Household IncomeIncome Range
$9999 - $14999
$15000 - $19999
$20000 - $24999
$25000 - $29999
$30000 - $34999
$35000 - $39999
$40000 - $44999
$45000 - $49999
$50000 - $54999
$55000 - $83333
"This Geographic Information System Product, received from The City of San Antonio is provided "as is" without warranty of any kind, and theCity of San Antonio expressly disclaims all express and implied warranties, including but not limited to the implied warranties of merchantability andfitness for a particular purpose. The City of San Antonio does not warrant, guarantee, or make any representations regarding the use, or the resultsof the use, of the information provided to you by the City of San Antonio in terms of correctness, accuracy, reliability, timeliness or otherwise.The entire risk as to the results and performance of any information obtained from the City of San Antonio is entirely assumed by the recipient."
"Please contact the responsible City of San Antonio Department for specific determinations."
City of San Antonio Planning Department Planning Manager: Nina Nixon-Mendez, [email protected]. Maps may be ordered at: (210) 207-7873
Map Created by:Map Creation Date:Map file location:PDF Filename:
Prepared by the City of San Antonio, Planning and Development Services Dept, August 2009. Data derived from Block Group data provided by the Nielsen Company Claritas 2008 PopFacts dataset of projections, which are based on 2000 Census data.
Median Household Income - 2008 Projections
Area Profile

City of San Antonio Planning & Development Services Department�0 �1
Foreclosures
Predictably, the foreclosure totals within the core of the reinvestment plan area are low. The land uses in this area are primarily government and institutional, with some scattered commercial and residential uses dispersed throughout the area. The low density neighborhoods along the periphery and fringe of the reinvestment plan show higher numbers of foreclosures compared to the central core of the plan area. Residential areas around Probandt Street and Highway 90, South Presa and I-37, and Commerce Street and Zarzamora experienced a range of 20 to 25 foreclosures compared to 0 to 4 for the core area. It is interesting to note that the low density Vista Verde neighborhood, the area west of I-35 and south of Guadalupe, also reflects a very low foreclosure rate; 0 to 4.
Foreclosures Area Wide

�0Westside Reinvestment Plan
�1
Zarzamora Creek
Alaz
anCr
eek
SanAntonio
River
MARTIN ST W
PRESA
STS
FLO
RES
STS
COMMERCE ST W
BR
AZO
SST
S
HOUSTON ST W
ZAR
ZAM
OR
AST
S
FRIOCITY RD
STM
ARYS
STS
HA
CK
BER
RYST
S
MA
INAV
S
ALAMO ST S
CH
ERRY
STS
BO
WIE
ST
HOUSTON ST E
FRIO
STS
COMMERCE ST E
DURANGO ST EN
AVA
RR
OST
PRO
BA
ND
TST
LAREDO ST S
CH
ERRY
STN
MIS
SIO
NRD
STEVES AV
NOGALITOS ST
DURANGO ST WM
AIN
AVN
ROO
SEVE
LTAV
FRIO
STN
HA
CK
BER
RYST
N
NOLAN ST
ALAMOST N
FLO
RES
STN
SOLED
AD
ST
STM
ARY
SST
N
DW
YER
AV
TRAVIS ST E
SAN
TAR
OSA
STS
MARKET ST E
FLORIDA ST
DOLOROSA ST MARKET ST W
CO
LOR
AD
OST
N
LOSO
YA
CEVALLOS ST WCEVALLOS ST E
24TH
STN
W
ZAR
ZAM
OR
AST
N
CO
LOR
AD
OST
S
TRAVIS ST W
JEFF
ERSO
NST
IOWA ST
CAROLINA ST E
OLD CASTROVILLE RD
DURANGO BV W
GUADALUPE ST
SAN
TAR
OSA
STN
ARSENAL ST E
APPL
EWHI
TERD
3RD ST
DURANGO ST W
IOWA ST
HOUSTON ST W
GUADALUPE ST
NOGALITO
SST
TRAVIS ST W
LAREDO ST S
DURANGO ST W
PRO
BAN
DT
ST
LAREDO ST S
DURANGO BV W
GUADALUPE ST
Westside Reinvestment Plan Area
City of San Antonio0 0.25 0.5 0.75 10.125 Miles
TAX EXEMPT PARCELS
Public and Institution Parcels
Westside Reinvestment Plan Area
Westside TIRZ
"This Geographic Information System Product, received from The City of San Antonio is provided "as is" without warranty of any kind, and theCity of San Antonio expressly disclaims all express and implied warranties, including but not limited to the implied warranties of merchantability andfitness for a particular purpose. The City of San Antonio does not warrant, guarantee, or make any representations regarding the use, or the resultsof the use, of the information provided to you by the City of San Antonio in terms of correctness, accuracy, reliability, timeliness or otherwise.The entire risk as to the results and performance of any information obtained from the City of San Antonio is entirely assumed by the recipient."
"Please contact the responsible City of San Antonio Department for specific determinations."
City of San Antonio Planning Department Planning Manager: Nina Nixon-Mendez, [email protected]. Maps may be ordered at: (210) 207-7873
Map Created by:Map Creation Date:Map file location:PDF Filename:
Tax Exempt Parcels
The Tax Increment Reinvestment Zone (TIRZ) boundary within the Westside Reinvestment area consists of 2,665 parcels. 351 of those parcels are Public with Government Institutional uses. As shown in the map, there is a significant distribution of tax exempt properties within the TIRZ, from which, increment will not be captured. UTSA, the City of San Antonio, University Health Systems, and Bexar County services comprise the largest areas and accumulation of public parcels in the area. Properties managed by the San Antonio Housing Authority (SAHA) are also included in this grouping. SAHA has significant holdings at Alazan and Apache Courts on and near the Guadalupe Street Corridor and new, higher density units are being constructed at the Union Stockyards site.
Although such a proportion of tax exempt properties is generally a concern with regard to the generation of additional tax increment, many of the public institutions are area anchors and have plans for expansion. The additional employee, student, and residential populations have the potential to increase demand for additional supply of services and industry that would add to the area tax base.
Tax Exempt Parcels within the Westside TIRZ
Area Profile

City of San Antonio Planning & Development Services Department�� ��
!"#$53
!"#$01
(/182
!"#$73
(/09!"#$01
FLO
RES
ST
S
PR
ES
AS
TS
COMMERCE ST W
BR
AZ
OS
ST
S
ZA
RZA
MO
RA
ST
S
HOUSTON ST W
MARTIN ST W
FRIO
CITY
RD
ST
MA
RY
SST
S
HA
CK
BE
RR
YS
TS
OL
IVE
ST
S
ALAMO ST S
MA
INA
VS
CH
ER
RY
ST
S
HOUSTON ST E
OL
IVE
ST
N
COMMERCE ST E
BO
WIE
ST
FR
IOS
TS
DURANGOST E
STEVES
AV
CH
ER
RY
ST
N
PR
OB
AN
DT
ST
NA
VA
RR
OS
T
LAREDO ST S
BROAD
WAY
MA
INA
VN
FRIO
STN
ALAM
OST
N
MIS
SIO
NR
D
NOGALITOS
ST
FLORES
STN
HA
CK
BE
RR
YS
TN
DURANGO ST W
24
TH
ST
SW
RO
OS
EV
ELT
AV
ST MARYS ST N
NOLAN ST
SO
LE
DA
DS
T
DW
YE
RA
V
TRAVIS ST E
SA
NT
AR
OS
AS
TS
MARKET ST E
MC
CULLOUGH
AV
CO
LO
RA
DO
ST
N
FLORIDA ST
DOLOROSA ST
24
TH
ST
NW
BROOKLYN
AV
MARKET ST W
LO
SO
YA
ZA
RZ
AM
OR
AS
TN
BR
AZ
OS
ST
N
CEVALLOS ST W
CEVALLOS ST E
MARTIN ST E
ISH
WY
10
W/
35
/U
SH
WY
87
CO
LO
RA
DO
ST
S
JEFF
ER
SO
NS
T
OLD CASTROVILLE RD
CAROLINA ST E
TRAVIS ST W
IOWA ST
MARTIN L KING
DURANGO BV W
GUADALUPE ST
SA
NT
AR
OS
AS
TN
ALA
MO
PLA
ZA
RIGSBY AV
ARSENAL ST E
AP
PLE
WH
ITE
RD
EL PASO ST
LEONA ST S
CAROLINA ST W
3RDST
GUADALUPE ST
LAREDO ST S
TRAVIS ST W
LA
RE
DO
ST
S
TRAVIS ST W
DURANGO BV W
OL
IVE
ST
S
HOUSTON ST W
NO
GALI
TOS
ST
LARED
OST
S
TRAVIS ST W
DURANGO ST W
DURANGO ST W
OL
IVE
ST
S
PR
OB
AN
DT
ST
IOWA ST
GUADALUPE ST
0 500 1,000 1,500 2,000
Feet
Employer Square Mile Density µMap Last Edited: August 2009PDF:
Data Source: City of San Antonio Enterprise GIS, Bexar Metro 911, Bexar Appraisal District
Map Created by: Kristine Egan. Updated by Andrea GillesMap file location: K:\Neighborhoods\Reinvestment Plans\Westside\Mapping
"This Geographic Information System Product, received from The City of San Antonio is provided "as is" without warranty of any kind, and theCity of San Antonio expressly disclaims all express and implied warranties, including but not limited to the implied warranties of merchantability andfitness for a particular purpose. The City of San Antonio does not warrant, guarantee, or make any representations regarding the use, or the resultsof the use, of the information provided to you by the City of San Antonio in terms of correctness, accuracy, reliability, timeliness or otherwise.The entire risk as to the results and performance of any information obtained from the City of San Antonio is entirely assumed by the recipient."
"Please contact the responsible City of San Antonio Department for specific determinations."
moola
City of San AntonioPlanning and Development
Services Department
Development & Business Services Center1901 S. Alamo
San Antonio, TX 78204
Westside Reinvestment Plan AreaWestside Reinvestment Plan Area
Westside RPAEmployer Locations
Square Mile Density
401 - 2,850 (Very High)251 - 400176 - 250 (High)126 - 175101 - 125 (Moderate)76 - 10051 - 75 (Low)26 - 500 - 25 (Very Low)
Roderick J. Sanchez, AICP, CBODirector
Employers Per Square Mile
As shown in the map below, there is a high concentration of employers per square mile in a significant portion of the Reinvestment Plan area. The density is particularly high in the northern segment on both sides of IH 35 and remains strong throughout the central and near west sections. Much of this can be attributed to the proximity to the Downtown central core as well as the existence of several major corridors within the Reinvestment Plan area. However, within the Reinvestment Plan itself, there are several major employers including UTSA, SAISD, Christus Santa Rosa, University Health System, and the City of San Antonio. In addition, a number of key employers have short and long term expansion plans which should create additional market opportunities in the area not only within those industries themselves, but for complementary businesses as well. Coupled with proposed mass transit expansion plans and a young work force in the area, there is potential for areas within the Westside Reinvestment Plan to be strong, diverse employment centers.
Employers Per Square Mile
��Westside Reinvestment Plan
��
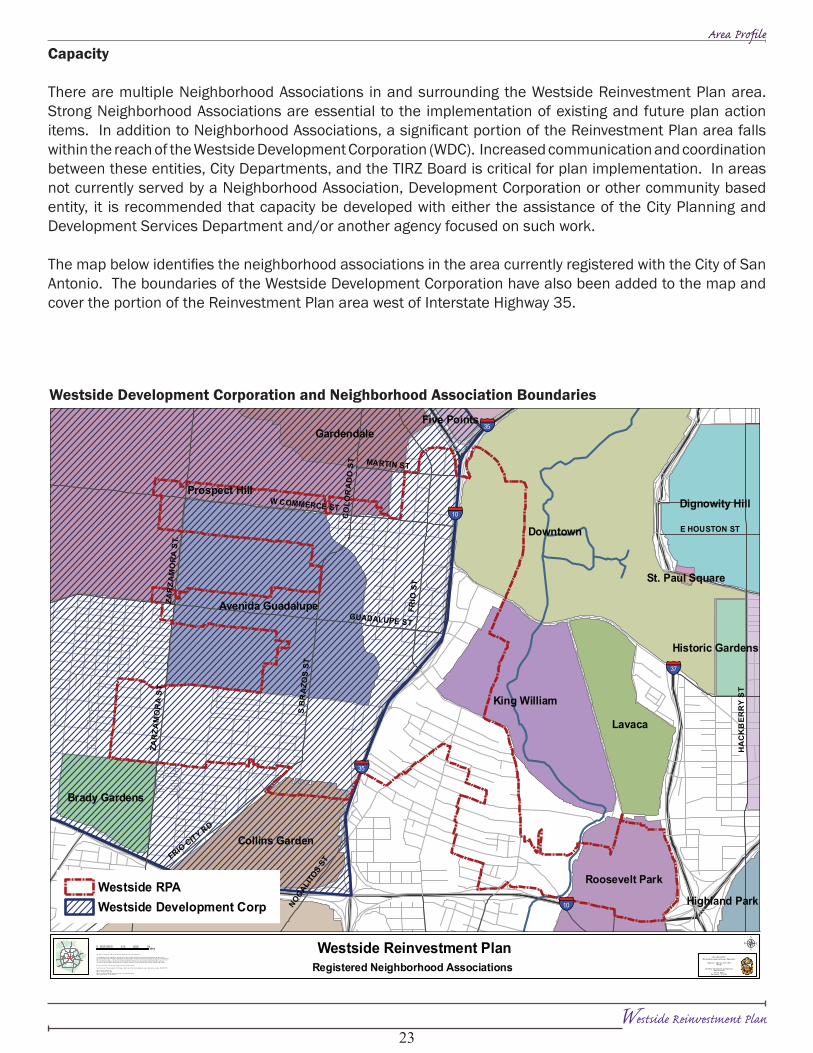
Capacity
There are multiple Neighborhood Associations in and surrounding the Westside Reinvestment Plan area. Strong Neighborhood Associations are essential to the implementation of existing and future plan action items. In addition to Neighborhood Associations, a significant portion of the Reinvestment Plan area falls within the reach of the Westside Development Corporation (WDC). Increased communication and coordination between these entities, City Departments, and the TIRZ Board is critical for plan implementation. In areas not currently served by a Neighborhood Association, Development Corporation or other community based entity, it is recommended that capacity be developed with either the assistance of the City Planning and Development Services Department and/or another agency focused on such work.
The map below identifies the neighborhood associations in the area currently registered with the City of San Antonio. The boundaries of the Westside Development Corporation have also been added to the map and cover the portion of the Reinvestment Plan area west of Interstate Highway 35.
§̈¦10
§̈¦10
§̈¦35
§̈¦35
§̈¦37
£¤90
Downtown
Prospect Hill
Avenida Guadalupe
King William
Lavaca
Dignowity Hill
Collins Garden
Roosevelt Park
Gardendale
Palm Heights
Brady Gardens
Historic Gardens
Highland Park
Five Points
St. Paul Square
FRIO
ST
HA
CK
BE
RR
YS
T
W COMMERCE ST
FRIOCITY RD
ZAR
ZAM
OR
AS
T.
SB
RA
ZOS
ST
GUADALUPE ST
CO
LOR
AD
OS
T MARTIN ST
NOGALITO
SST
E HOUSTON ST
ZAR
ZAM
OR
AS
T.
µDat a Sour ce: C i ty of S anA nt onio E nte rpr i seG I S, B exar M et r o9 11, Be xar Ap pr aisal D is tr ict
"T his G eogr aphi cI nf or ma ti on Syst em P ro duct r ecei ved fr om the C it y of San A nton io is pr ovi ded " asi s" w it hout war r ant yof any kind , and t heCi ty of S anA nt onio exp res sly disc lai ms al l expr essed an di m pli ed war r ant ies, incl udi ng but no t li mi te dt o th ei m pli ed war r ant ies of m er chan tab il it yan dfi tne ssf or a par t icul ar p urp ose. T he Ci ty of S an Ant oni od oes not w arr an t, g uar ant ee, or ma kea nyr epr ese nta ti ons reg ar ding t he use, o r th er esul t sof th eu se, of t he in for m at ion pr ovi ded to you by t he Ci ty of S anA nt onio i nt er m so f cor re ctne ss, accur acy, r el iab il it y, ti m eli ness or ot her w ise.The ent ir e ri sk ast o th er esul ts an dpe rf or m ance of an yi nfo rm at io nob tai ned f ro m th eC it y of Sa nA nto nio i sen ti re ly assum ed by the r eci pien t. "
"P lea seco nta ct th eC it y of Sa nA nto nio D epar tm en t for speci fi cd ete rm i nati ons. "
Ci ty of S anA nt onio P lann ing D epar tm en t GI S M anage r: Dal eWo odr uff , D ale .Woo dru ff @sanan ton io. gov. M aps ma ybe or de red at (21 0) 207 -7 873.
Map C re ate db y: Andr ea G il lesMap C re ati on Da te: A ugust 2009Map F ile Lo cati on: K :\ N eigh bor hoods\ R einve stm ent Pl ans\ Westsi de\ M appi ngPDF F il enam e: WR PA_ Cou ncil _Di st ri cts
Registered Neighborhood AssociationsWestside Reinvestment Plan0 0.075 0.15 0.225 0.30.0375
Miles
City of SanAntonioPlanning& Dev elopm ent Services Department
Roderick J . Sanc hez ,AICP, CBODirec tor
Cli ff Morton Developm ent and Buis inessServ ic es Center1901S. Alam o
San Antonio, TX 78204
Westside RPAWestside Development Corp
Westside Development Corporation and Neighborhood Association Boundaries
Area Profile

City of San Antonio Planning & Development Services Department��
This Page Intentionally Left Blank