Westpac 2019 Investor Presentation
68
Westpac 2019 Investor Presentation November 2019 Fixed Income Investor Roadshow Westpac Banking Corporation ABN 33 007 457 141
Transcript of Westpac 2019 Investor Presentation

Westpac 2019 Investor Presentation
November 2019Fixed Income Investor Roadshow
Westpac Banking CorporationABN 33 007 457 141

Disclaimer 2
Westpac Group Debt Investor Presentation I November 2019
The material contained in this presentation is intended to be general background information on Westpac Banking Corporation(“Westpac”) (ABN 33 007 457 141) and its activities.
It should not be reproduced, distributed or transmitted to any person without the consent of Westpac and is not intended for distributionin any jurisdiction in which such distribution would be contrary to local law or regulation. It does not constitute a prospectus, offeringmemorandum or offer of securities.
The information is supplied in summary form and is therefore not necessarily complete. Also, it is not intended that it be relied upon asadvice to investors or potential investors, who should consider seeking independent professional advice depending upon their specificinvestment objectives, financial situation or particular needs. The material contained in this presentation may include informationderived from publicly available sources that have not been independently verified. No representation or warranty is made as to theaccuracy, completeness or reliability of the information.
All amounts are in Australian dollars unless otherwise indicated.
Financial information in this presentation may be presented on a cash earnings basis. Cash earnings is a non-GAAP measure. Referto Westpac’s 2019 Annual Report on Form 20-F for the year ended 30 September 2019 (“2019 Annual Report on Form 20-F”) filedwith the SEC for details of the basis of preparation of cash earnings. Refer to Appendix 6 for a reconciliation of reported net profit tocash earnings.
Financial data in this presentation is as at 30 September 2019 unless otherwise indicated. Comparisons of FY19 financial results areto FY18 unless otherwise stated.
Information contained in or otherwise accessible through the websites mentioned in this presentation does not form part of thepresentation unless we specifically state that the information is incorporated by reference thereby forming part of the presentation. Allreferences in this presentation to websites are inactive textual references and are for information only.
Disclosure regarding forward-looking statementsThis presentation contains statements that constitute “forward-looking statements” within the meaning of Section 27A of the USSecurities Act of 1933, as amended, and Section 21E of the US Securities Exchange Act of 1934, as amended. Forward-lookingstatements are statements about matters that are not historical facts. Forward-looking statements appear in a number of places in thispresentation and include statements regarding our intent, belief or current expectations with respect to our business and operations,market conditions, results of operations and financial condition, including, without limitation, future loan loss provisions, financialsupport to certain borrowers, indicative drivers, forecasted economic indicators and performance metric outcomes.
We use words such as ‘will’, ‘may’, ‘expect’, 'indicative', ‘intend’, ‘seek’, ‘would’, ‘should’, ‘could’, ‘continue’, ‘plan’, ‘aim’, ‘probability’,‘risk’, ‘forecast’, ‘likely’, ‘estimate’, ‘anticipate’, ‘believe’, or other similar words to identify forward-looking statements. These forward-looking statements reflect our current views with respect to future events and are subject to change, certain risks, uncertainties andassumptions which are, in many instances, beyond our control and have been made based upon management’s expectations andbeliefs concerning future developments and their potential effect upon us. There can be no assurance that future developments will bein accordance with our expectations or that the effect of future developments on us will be those anticipated. Should one or more ofthe risks or uncertainties materialise, or should underlying assumptions prove incorrect, actual results could differ materially from theexpectations described in this presentation. Factors that may impact on the forward-looking statements made include, but are notlimited to, those described in the section entitled ‘Risk factors’ in Westpac’s 2019 Annual Report on Form 20-F filed with the SEC.When relying on forward-looking statements to make decisions with respect to us, investors and others should carefully consider suchfactors and other uncertainties and events. We are under no obligation, and do not intend, to update any forward-looking statementscontained in this presentation, whether as a result of new information, future events or otherwise, after the date of this presentation.

3
Westpac Group Debt Investor Presentation I November 2019
1 Internationally comparable methodology aligns with the APRA study titled ‘International Capital Comparison Study’ dated 13 July 2015.
Balance sheet strength prioritised• CET1 capital ratio 10.7%, APRA Basel III basis, above APRA’s “unquestionably strong” benchmark• CET1 capital ratio 15.9%, Basel III internationally comparable1 basis • LCR 127% • NSFR 112%• TLAC framework announced July 2019; Issued A$4.2bn in FY19; Tier 2 at 2.8% at 30 Sep 2019• Highly rated AA- / Aa3 / AA- (Stable outlook S&P and Moody’s; Negative outlook Fitch)
Asset quality sound• Loan impairment charges to average loans annualised 11bps in FY19 (FY18: 12bps)• Stressed assets to total committed exposures 1.20% (30 Sep 2018: 1.08%)• Australian mortgages 90+ day delinquencies 88bps (30 Sep 2018: 72bps)
• Restructured wealth business, including exiting Financial Planning business• Provisioned for customer remediation• Responding to Royal Commission and Culture, Governance and Accountability (CGA) self-
assessment• Expect to raise $2.5bn via an equity capital raising, expected to increase 30 Sep 2019 pro forma
CET1 ratio to ~11.25% (16.6% Basel III internationally comparable1 basis)• Dividend reset
Acting decisively to reshape our business
Operating environment subdued• Australian economy – election uncertainty removed, fiscal position strong, housing market
recovering but overall growth is below trend• Low rate environment resulting in slower balance sheet growth
Westpac FY19 Summary

CET1 ratio of 10.7%, increasing to ~11.25% on a pro forma basis
Westpac Group Debt Investor Presentation I November 2019
1 Internationally comparable methodology aligns with the APRA study titled ‘International Capital Comparison Study’ dated 13 July 2015. For more details on adjustments refer slide Appendix 2 2. Group 1 banks BIS 75th percentile fully phased-in Basel III capital ratios from BIS monitoring report released 2 October 2019.
Key capital ratios (%)
CET1 capital ratio (%) and CET1 capital ($bn)
4
Capital ratios (APRA basis, %) Sep-18 Mar-19 Sep-19
CET1 capital ratio 10.6 10.6 10.7
Additional Tier 1 capital 2.2 2.2 2.2
Tier 1 capital ratio 12.8 12.8 12.8
Tier 2 capital 2.0 1.8 2.8
Total regulatory capital ratio 14.7 14.6 15.6
Risk weighted assets (RWA) ($bn) 425 420 429
Leverage ratio 5.8 5.7 5.7
Internationally comparable ratios1
Leverage ratio 6.5 6.4 6.4
CET1 capital ratio 16.1 16.2 15.9
10.712.8
15.6 15.918.6
22.1
CET1 Tier 1 Totalregulatory
capital
CET1 Tier 1 Totalregulatory
capital
APRA basis Internationally comparable1 basis
40 43 44 45 45 46 47
10.010.6 10.5 10.6 10.6 10.7
~11.25
0
2
4
6
8
10
12
15
20
25
30
35
40
45
50
55
Mar-17 Sep-17 Mar-18 Sep-18 Mar-19 Sep-19 Sep-19 Proforma
Westpac CET1 capital (lhs, $bn)
Westpac CET1 capital ratio (rhs, %)
Future developments • AASB16 leasing accounting standard applies from 1 October 2019
(~8bps reduction to the CET1 ratio)
• APRA unquestionably strong capital of 10.5% to be met by 1 January 2020
• Further clarity on revised APRA capital framework expected over 2019/20
• Final RBNZ capital proposals expected in December 2019
Table does not add due to rounding
BIS 75th Percentile2

Long term wholesale funding 5
Westpac Group Debt Investor Presentation I November 2019
1 Based on residual maturity and FX spot currency translation. Includes all debt issuance with contractual maturity greater than 13 months excluding US Commercial Paper and Yankee Certificates of Deposit. 2 Contractual maturity date for hybrids and callable subordinated instruments is the first scheduled conversion date or call date for the purposes of this disclosure. 3 Perpetual sub-debt has been included in >FY25 maturity bucket. Maturities exclude securitisation amortisation. 4 Tenor excludes RMBS and ABS. 5 WAM is weighted average maturity.
18 7 5
177 11
1
3038 42
43 46 41
FY17 FY18 FY19
>5years
5 years
4 years
3 years
2 years
1 year
5.8yrs
New term issuance by tenor2,4 (%)
6.5yrs WAM5
New term issuance by type (%) New term issuance by currency (%)
66 7351
18 13
24
5 58
4 54
8 4 13
FY17 FY18 FY19
SubordinateddebtHybrid
Securitisation
Covered bonds
Seniorunsecured 7 15 7
2221
21
49 3227
2132
46
FY17 FY18 FY19
AUD
USD
EUR
Other
Charts may not add to 100 due to rounding. Charts may not add to 100 due to rounding. Charts may not add to 100 due to rounding.
6.0yrs
33 31
4237
32 34 31 33
26
18
25
6
28
FY14
FY15
FY16
FY17
FY18
FY19
FY20
FY21
FY22
FY23
FY24
FY25
>FY
25
Covered bond Hybrid Senior/Securitisation Sub debt
Issuance Maturities
Term debt issuance and maturity profile1,2,3 ($bn)• A$33.5bn new term wholesale funding raised in FY19
• Majority of new issuance in senior unsecured bonds (51%) and covered bonds (24%) in line with prior years
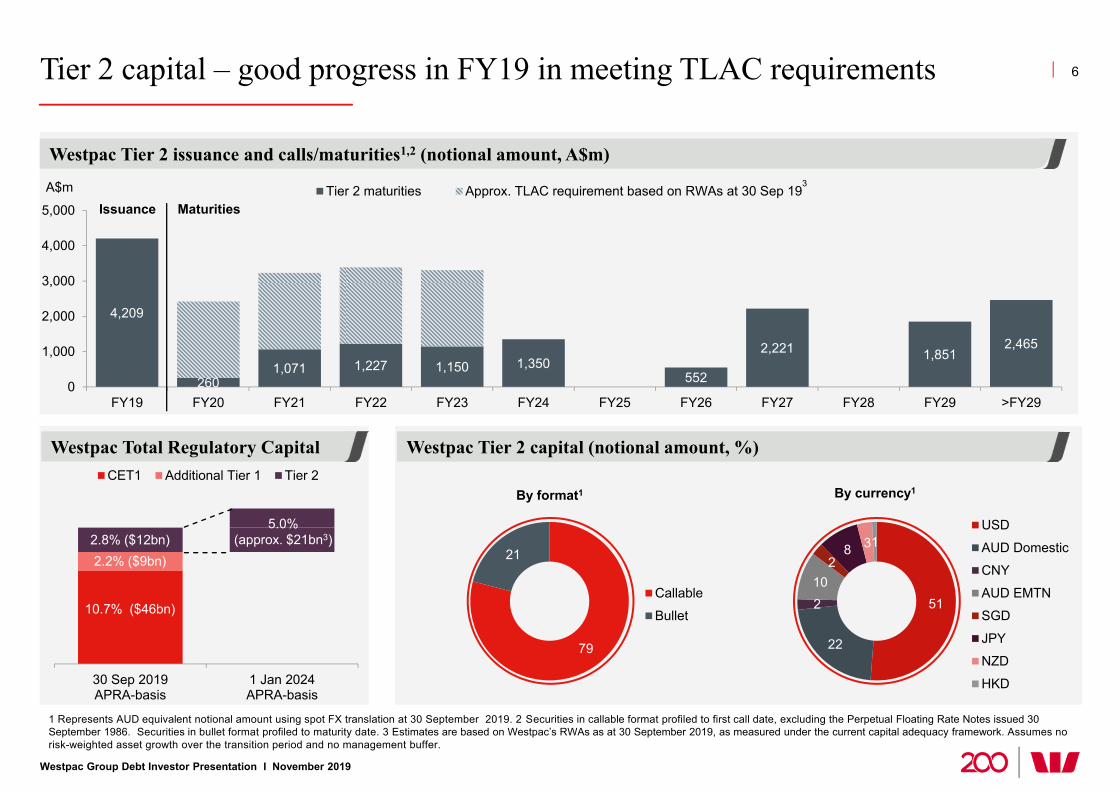
• Increased Tier 2 issuance ($4.2bn), as the Group made good progress towards meeting APRA’s TLAC requirements
• Additional diversity provided through issuance of $1.4bn AT1 and $2.8bn in RMBS
• Higher proportion of AUD term issuance in FY19 reflects strong liquidity and demand in the Australian market relative to prior years
Tier 2 capital – good progress in FY19 in meeting TLAC requirements
Westpac Group Debt Investor Presentation I November 2019
1 Represents AUD equivalent notional amount using spot FX translation at 30 September 2019. 2 Securities in callable format profiled to first call date, excluding the Perpetual Floating Rate Notes issued 30 September 1986. Securities in bullet format profiled to maturity date. 3 Estimates are based on Westpac’s RWAs as at 30 September 2019, as measured under the current capital adequacy framework. Assumes no risk-weighted asset growth over the transition period and no management buffer.
6
Westpac Tier 2 issuance and calls/maturities1,2 (notional amount, A$m)
By format1 By currency1
Westpac Tier 2 capital (notional amount, %)Westpac Total Regulatory Capital
4,209
2601,071 1,227 1,150 1,350
552
2,221 1,8512,465
0
1,000
2,000
3,000
4,000
5,000
FY19 FY20 FY21 FY22 FY23 FY24 FY25 FY26 FY27 FY28 FY29 >FY29
Tier 2 maturities Approx. TLAC requirement based on RWAs at 30 Sep 19Issuance Maturities
79
21
Callable
Bullet51
22
210
28 31
USD
AUD Domestic
CNY
AUD EMTN
SGD
JPY
NZD
HKD
A$m 3
30 Sep 2019APRA-basis
1 Jan 2024APRA-basis
CET1 Additional Tier 1 Tier 2
5.0% (approx. $21bn3)
10.7% ($46bn)
2.2% ($9bn)2.8% ($12bn)

Benefits of SEC registration; USD issuance volumes lower
1. Trading days calculated from issue date to 2 October 2019. Source: TRACE (note all trades >US$5m are reported by TRACE as US$5m); JP Morgan. 2 Source: Bloomberg, Bank of America.
867
293424
161
912
297
1323
194
WSTP CBA (Total) WSTP CBA (Total)
Volume: >$250k Volume: All trades
151
5334
7
101120
WSTPSEC-Reg
CBA 144A CBA Reg S
Days traded Days not traded
Secondary trading analysis SEC Registered vs 144A/Reg S
Volume ($m) Number of tradesDays traded1
Westpac Group Debt Investor Presentation I November 2019
7
Fixed tranche WSTP 3.300% 02/24 CBA 3.350% 06/24
Trade date 19 Feb 2019 25 Feb 2019
Format SEC Registered 144A Reg S
Maturity 26 Feb 2024 4 Jun 2024
Tenor 5 year FXD 5.25 year FXD
Currency/size US$1.25bn US$750m
Denoms 2,000 / 1,000 2,000 / 1,000
Reoffer spread T+85bps T+88bps
Reoffer yield 3.308% 3.363%
Coupon 3.300% 3.350%
5.5
1.5
5.0
7.26.0
0.0
5.0
2.1
10.2
4.3
7.3
4.1
8.9
6.2
9.0 9.6
Australian major bank USD term issuance vs USD term maturities2 (US$bn)
WSTP
2018 2019 2018 2019YTD YTD
Issuance Maturities
ANZ
2018 2019 2018 2019YTD YTD
Issuance Maturities
CBA
2018 2019 2018 2019YTD YTD
Issuance Maturities
NAB
2018 2019 2018 2019YTD YTD
Issuance Maturities
Financial performance impacted by remediation and wealth reset
Westpac Group Debt Investor Presentation I November 2019
8
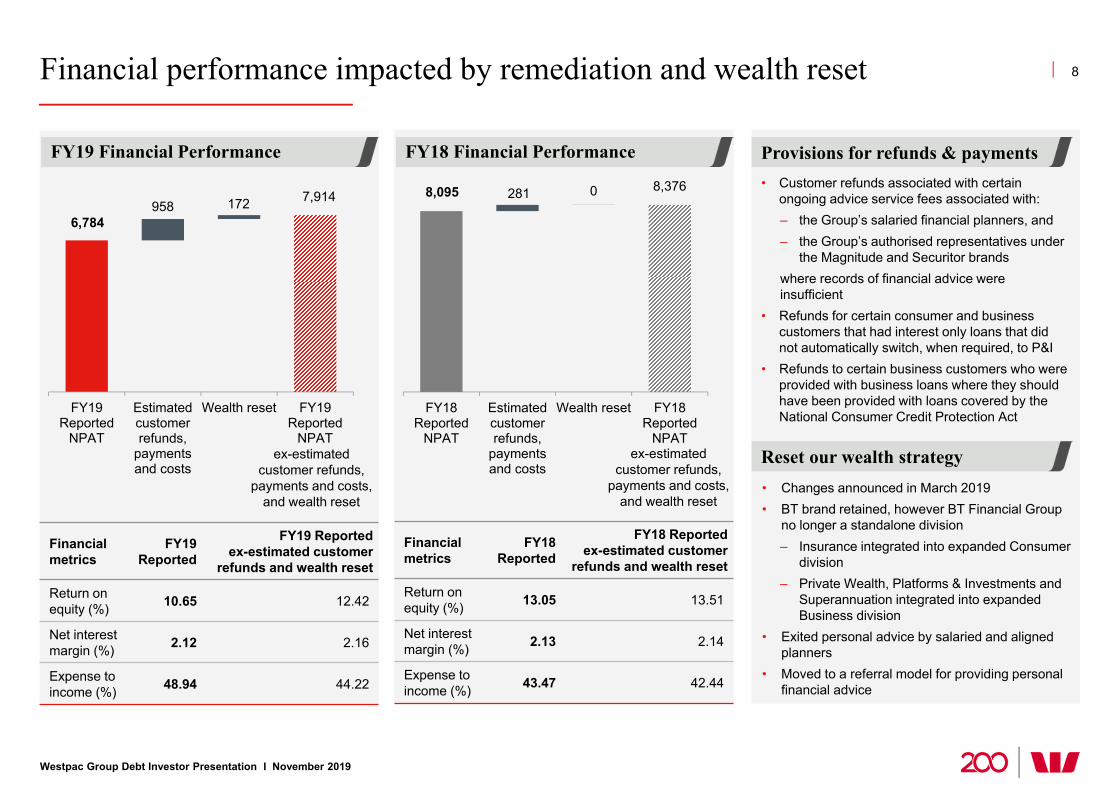
FY19 Financial Performance Provisions for refunds & payments• Customer refunds associated with certain
ongoing advice service fees associated with:– the Group’s salaried financial planners, and – the Group’s authorised representatives under
the Magnitude and Securitor brandswhere records of financial advice were insufficient
• Refunds for certain consumer and business customers that had interest only loans that did not automatically switch, when required, to P&I
• Refunds to certain business customers who were provided with business loans where they should have been provided with loans covered by the National Consumer Credit Protection Act
Financial metrics
FY19 Reported
FY19 Reported ex-estimated customer
refunds and wealth reset
Return on equity (%) 10.65 12.42
Net interest margin (%) 2.12 2.16
Expense to income (%) 48.94 44.22
6,784
7,914958 172
FY19Reported
NPAT
Estimatedcustomerrefunds,
paymentsand costs
Wealth reset FY19Reported
NPAT
FY18 Financial Performance
Financial metrics
FY18 Reported
FY18 Reported ex-estimated customer
refunds and wealth reset
Return on equity (%) 13.05 13.51
Net interest margin (%) 2.13 2.14
Expense to income (%) 43.47 42.44
8,095 8,376281 0
FY18Reported
NPAT
Estimatedcustomerrefunds,
paymentsand costs
Wealth reset FY18Reported
NPAT
• Changes announced in March 2019• BT brand retained, however BT Financial Group
no longer a standalone division– Insurance integrated into expanded Consumer
division– Private Wealth, Platforms & Investments and
Superannuation integrated into expanded Business division
• Exited personal advice by salaried and aligned planners
• Moved to a referral model for providing personal financial advice
Reset our wealth strategyex-estimated customer refunds,
payments and costs, and wealth reset
ex-estimated customer refunds,
payments and costs, and wealth reset

FY19 financial metrics
Westpac Group Debt Investor Presentation I November 2019
9
Operating expenses ($m)
Balance sheet ($bn)
Net interest margin (%)
710 715
445 449
FY18 FY19
Total loans Aust. Housing
518 525
FY18 FY19
1 Pre-2008 does not include St.George. 2008 and 2009 are pro forma including St.George for the entire period with 1H09 ASX Profit Announcement providing details of the pro forma adjustment.
Up 1%
Up 1%
Up 1%
Impairment charges (bps)
11
0
20
40
60
80
100
FY07
FY08
FY09
FY10
FY11
FY12
FY13
FY14
FY15
FY16
FY17
FY18
FY19
AASB 9 / AASB 15
Impairment charges to average gross loans1 (bps)
2.14 2.09 2.09 2.10 2.06 2.13 2.12
0.0
0.5
1.0
1.5
2.0
2.5
3.0
FY13
FY14
FY15
FY16
FY17
FY18
FY19
Customer deposits
9,566 10,106
5,091 5,015
FY18 FY19 1H19 2H19
Expenses Notable items
Stressed exposures as a % of TCE (%)
0.170.48
0.55
1.20
0.0
1.0
2.0
3.0
Sep-11 Sep-13 Sep-15 Sep-17 Sep-19
Watchlist and substandard90+ day past due and not impairedImpaired
Credit quality sound; Provisions higher on adoption of AASB 9
Westpac Group Debt Investor Presentation I November 2019
10
1,218
1,748 1,519
1,343
1,060 1,194
997 958
708 609 607 633
1,078
477 589
440 471 450 519 550
1H10
2H10
1H11
2H11
1H12
2H12
1H13
2H13
1H14
2H14
1H15
2H15
1H16
2H16
1H17
2H17
1H18
2H18
1H19
2H19
New and increased gross impaired assets ($m) Total impairment provisions ($m)
Sep-18 Mar-19 Sep-19
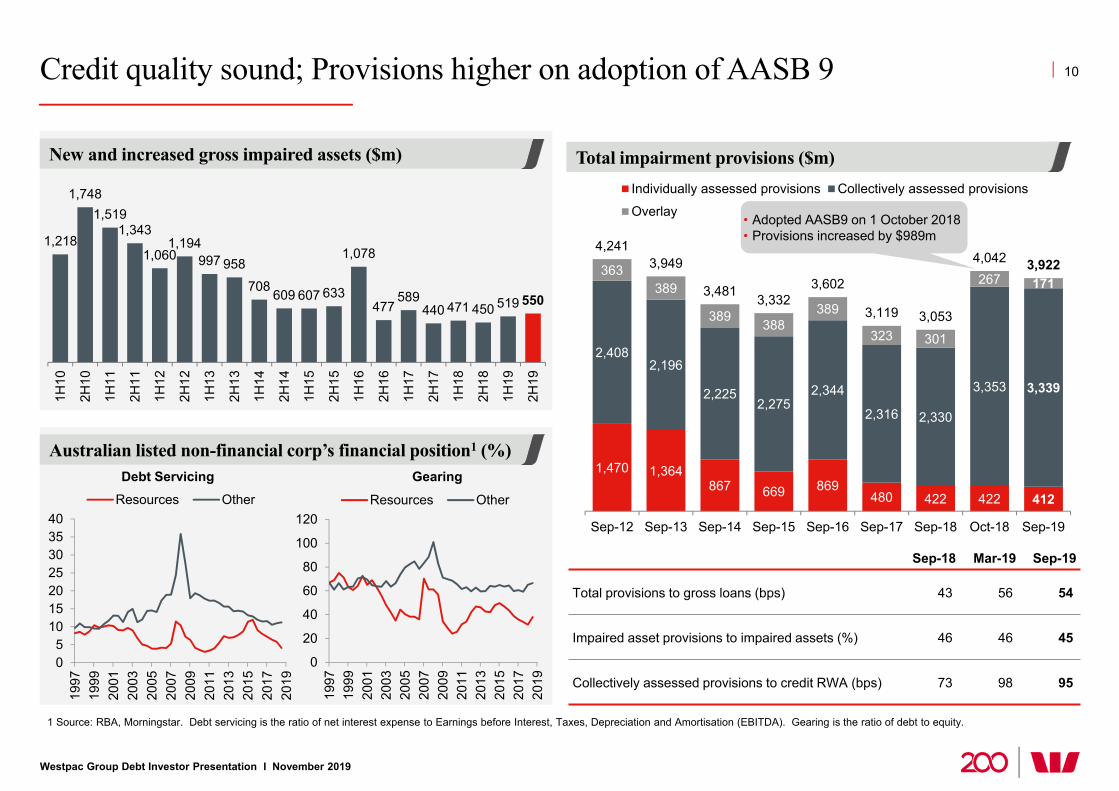
Total provisions to gross loans (bps) 43 56 54
Impaired asset provisions to impaired assets (%) 46 46 45
Collectively assessed provisions to credit RWA (bps) 73 98 95
• Adopted AASB9 on 1 October 2018• Provisions increased by $989m
1,470 1,364867 669 869
480 422 422 412
2,4082,196
2,2252,275
2,344
2,316 2,330
3,353 3,339
363389
389 388389
323 301
267 171
4,2413,949
3,481 3,3323,602
3,119 3,053
4,042 3,922
Sep-12 Sep-13 Sep-14 Sep-15 Sep-16 Sep-17 Sep-18 Oct-18 Sep-19
Individually assessed provisions Collectively assessed provisions
Overlay
05
10152025303540
1997
1999
2001
2003
2005
2007
2009
2011
2013
2015
2017
2019
Resources Other
0
20
40
60
80
100
120
1997
1999
2001
2003
2005
2007
2009
2011
2013
2015
2017
2019
Resources Other
Australian listed non-financial corp’s financial position1 (%)
1 Source: RBA, Morningstar. Debt servicing is the ratio of net interest expense to Earnings before Interest, Taxes, Depreciation and Amortisation (EBITDA). Gearing is the ratio of debt to equity.
Debt Servicing Gearing

Australian dwelling prices: Sydney, Melbourne prices recovering; Turnover remains low
Westpac Group Debt Investor Presentation I November 2019
11
Australian dwelling prices
Sources: ABS, CoreLogic, Westpac Economics.
Sources: CoreLogic, Westpac Economics.
Capital city Pop’nDwelling prices %ch last 3mths (Sep-19)
Dwelling prices YoY (Sep-19)
Sydney 4.8m Up 3.5% Down 4.8%
Melbourne 4.5m Up 3.4% Down 3.9%
Brisbane 2.3m Up 0.5% Down 2.1%
Perth 1.9m Down 1.9% Down 9.0%
Finance approvals by segment (%, value of housing finance)
Residential property: listings and sales2
90
110
130
150
170
190
210
230
90
110
130
150
170
190
210
230
Jan-04 Jan-06 Jan-08 Jan-10 Jan-12 Jan-14 Jan-16 Jan-18 Jan-20
index
Rest of Australia
Other capitals
Sydney-Melbourne
All dwellings (index, Jan 2004 = 100)
Sources: CoreLogic, Westpac Economics
index
1 Foreign buyers based on annual FIRB approvals. 2 Monthly, capital cities combined, seasonally adjusted by Westpac, smoothed.
15
17
19
21
23
25
27
29
31
15
17
19
21
23
25
27
29
31
Aug-07 Aug-09 Aug-11 Aug-13 Aug-15 Aug-17 Aug-19
‘000s‘000s new listings (lhs) sales (lhs)
Sources: ABS, Westpac Economics.
0
10
20
30
40
50
60
70
0
10
20
30
40
50
60
70
Sep-99 Sep-03 Sep-07 Sep-11 Sep-15 Sep-19
%% 'Upgraders' Investor Foreign buyers FHBs
54%
26%
2%
18%
latest
1
Physical supply/demand fundamentals
Westpac Group Debt Investor Presentation I November 2019
12
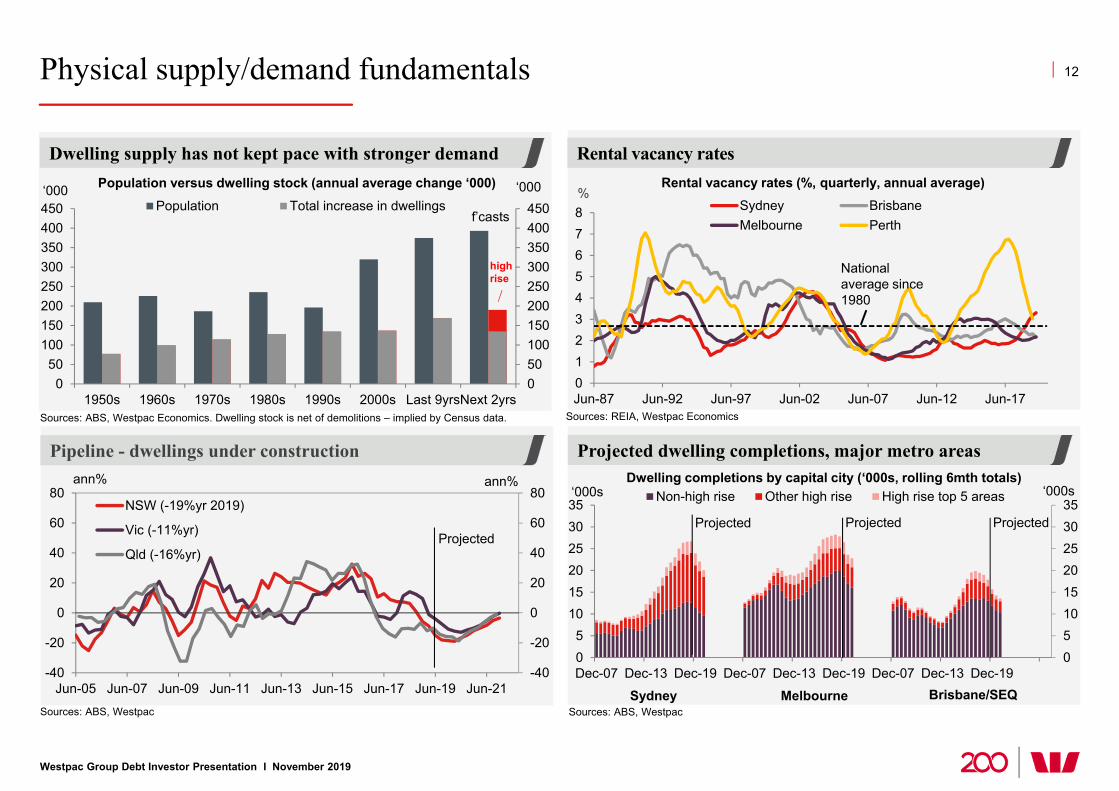
Sources: ABS, Westpac Economics. Dwelling stock is net of demolitions – implied by Census data.
Population versus dwelling stock (annual average change ‘000)
Dwelling supply has not kept pace with stronger demand
Projected dwelling completions, major metro areas
050100150200250300350400450
050
100150200250300350400450
1950s 1960s 1970s 1980s 1990s 2000s Last 9yrsNext 2yrs
‘000‘000Population Total increase in dwellings
high rise
f’casts
05101520253035
05
101520253035
Dec-07 Dec-13 Dec-19 Dec-07 Dec-13 Dec-19 Dec-07 Dec-13 Dec-19
‘000s‘000s Non-high rise Other high rise High rise top 5 areasDwelling completions by capital city (‘000s, rolling 6mth totals)
Projected
Sydney Brisbane/SEQMelbourne
Projected
Rental vacancy rates
Sources: REIA, Westpac Economics
Rental vacancy rates (%, quarterly, annual average)
012345678
Jun-87 Jun-92 Jun-97 Jun-02 Jun-07 Jun-12 Jun-17
%Sydney BrisbaneMelbourne Perth
National average since 1980
Pipeline - dwellings under construction
Sources: ABS, Westpac
-40
-20
0
20
40
60
80
-40
-20
0
20
40
60
80
Jun-05 Jun-07 Jun-09 Jun-11 Jun-13 Jun-15 Jun-17 Jun-19 Jun-21
ann%ann%
NSW (-19%yr 2019)
Vic (-11%yr)
Qld (-16%yr)Projected
Projected
Sources: ABS, Westpac
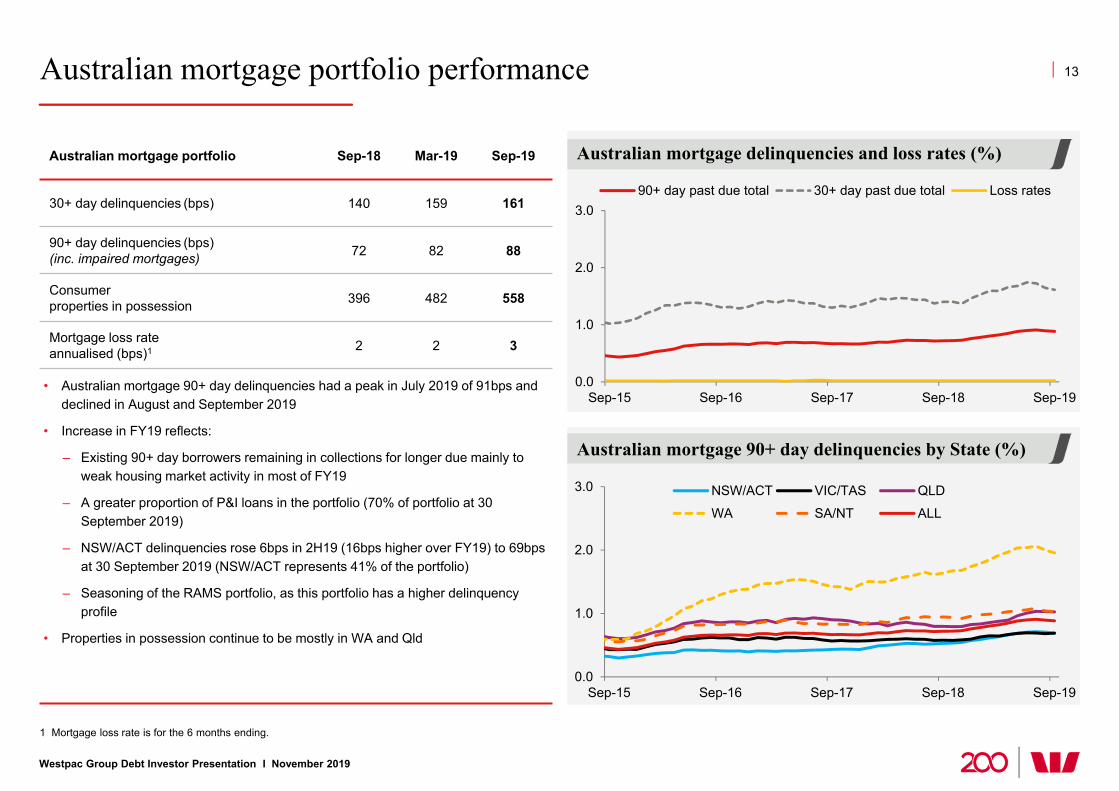
Australian mortgage portfolio performance
1 Mortgage loss rate is for the 6 months ending.
0.0
1.0
2.0
3.0
Sep-15 Sep-16 Sep-17 Sep-18 Sep-19
90+ day past due total 30+ day past due total Loss rates
0.0
1.0
2.0
3.0
Sep-15 Sep-16 Sep-17 Sep-18 Sep-19
NSW/ACT VIC/TAS QLD
WA SA/NT ALL
Australian mortgage delinquencies and loss rates (%)Australian mortgage portfolio Sep-18 Mar-19 Sep-19
30+ day delinquencies (bps) 140 159 161
90+ day delinquencies (bps) (inc. impaired mortgages) 72 82 88
Consumer properties in possession 396 482 558
Mortgage loss rate annualised (bps)1 2 2 3
• Australian mortgage 90+ day delinquencies had a peak in July 2019 of 91bps and declined in August and September 2019
• Increase in FY19 reflects:
– Existing 90+ day borrowers remaining in collections for longer due mainly to weak housing market activity in most of FY19
– A greater proportion of P&I loans in the portfolio (70% of portfolio at 30 September 2019)
– NSW/ACT delinquencies rose 6bps in 2H19 (16bps higher over FY19) to 69bps at 30 September 2019 (NSW/ACT represents 41% of the portfolio)
– Seasoning of the RAMS portfolio, as this portfolio has a higher delinquency profile
• Properties in possession continue to be mostly in WA and Qld
Australian mortgage 90+ day delinquencies by State (%)
Westpac Group Debt Investor Presentation I November 2019
13
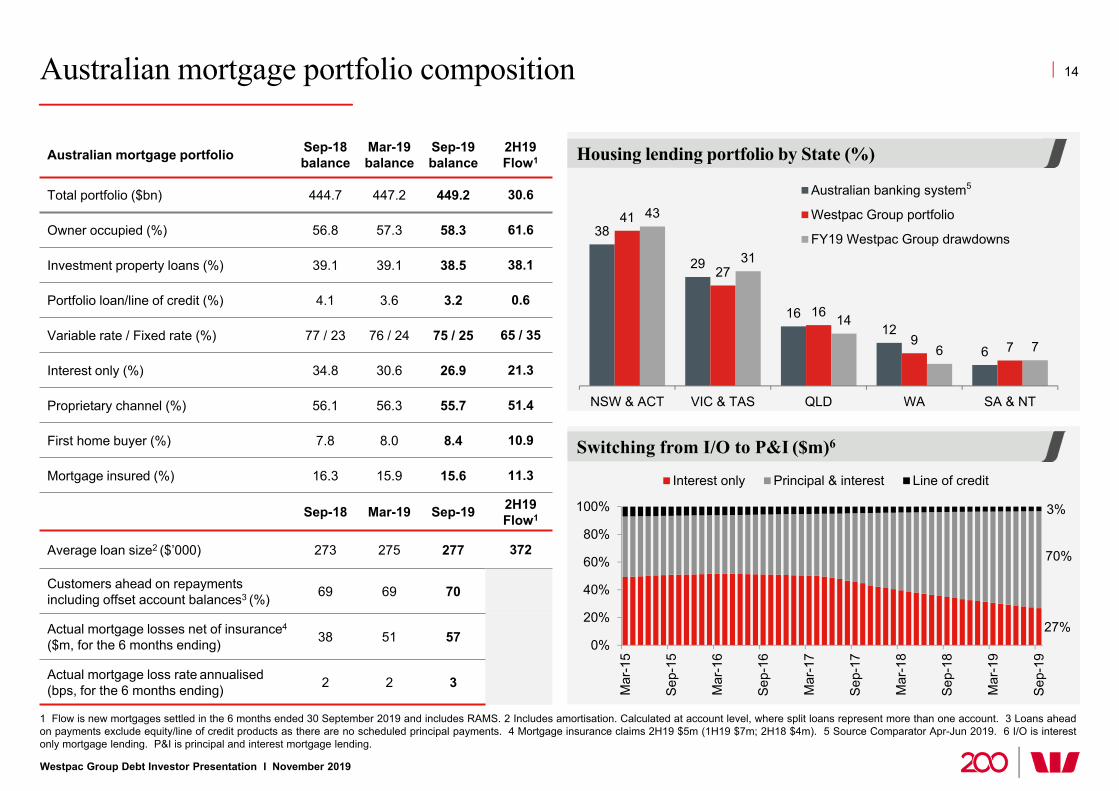
Australian mortgage portfolio composition
Westpac Group Debt Investor Presentation I November 2019
14
1 Flow is new mortgages settled in the 6 months ended 30 September 2019 and includes RAMS. 2 Includes amortisation. Calculated at account level, where split loans represent more than one account. 3 Loans ahead on payments exclude equity/line of credit products as there are no scheduled principal payments. 4 Mortgage insurance claims 2H19 $5m (1H19 $7m; 2H18 $4m). 5 Source Comparator Apr-Jun 2019. 6 I/O is interest only mortgage lending. P&I is principal and interest mortgage lending.
Australian mortgage portfolio Sep-18balance
Mar-19balance
Sep-19balance
2H19Flow1
Total portfolio ($bn) 444.7 447.2 449.2 30.6
Owner occupied (%) 56.8 57.3 58.3 61.6
Investment property loans (%) 39.1 39.1 38.5 38.1
Portfolio loan/line of credit (%) 4.1 3.6 3.2 0.6
Variable rate / Fixed rate (%) 77 / 23 76 / 24 75 / 25 65 / 35
Interest only (%) 34.8 30.6 26.9 21.3
Proprietary channel (%) 56.1 56.3 55.7 51.4
First home buyer (%) 7.8 8.0 8.4 10.9
Mortgage insured (%) 16.3 15.9 15.6 11.3
Sep-18 Mar-19 Sep-19 2H19Flow1
Average loan size2 ($’000) 273 275 277 372
Customers ahead on repayments including offset account balances3 (%) 69 69 70
Actual mortgage losses net of insurance4
($m, for the 6 months ending) 38 51 57
Actual mortgage loss rate annualised (bps, for the 6 months ending) 2 2 3
Housing lending portfolio by State (%)
38
29
1612
6
41
27
16
9 7
43
31
14
6 7
NSW & ACT VIC & TAS QLD WA SA & NT
Australian banking system
Westpac Group portfolio
FY19 Westpac Group drawdowns
5
Switching from I/O to P&I ($m)6
27%
70%
3%
0%
20%
40%
60%
80%
100%
Mar
-15
Sep-
15
Mar
-16
Sep-
16
Mar
-17
Sep-
17
Mar
-18
Sep-
18
Mar
-19
Sep-
19
Interest only Principal & interest Line of credit
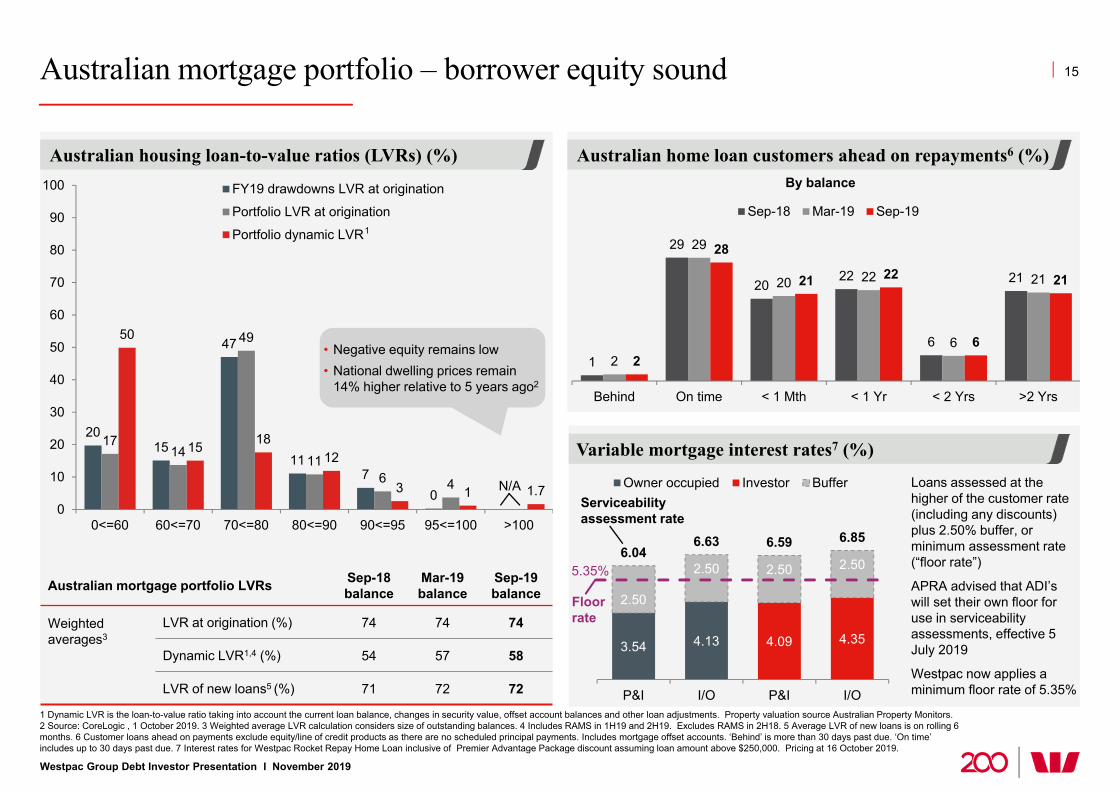
Australian mortgage portfolio – borrower equity sound
Westpac Group Debt Investor Presentation I November 2019
15
1 Dynamic LVR is the loan-to-value ratio taking into account the current loan balance, changes in security value, offset account balances and other loan adjustments. Property valuation source Australian Property Monitors. 2 Source: CoreLogic , 1 October 2019. 3 Weighted average LVR calculation considers size of outstanding balances. 4 Includes RAMS in 1H19 and 2H19. Excludes RAMS in 2H18. 5 Average LVR of new loans is on rolling 6 months. 6 Customer loans ahead on payments exclude equity/line of credit products as there are no scheduled principal payments. Includes mortgage offset accounts. ‘Behind’ is more than 30 days past due. ‘On time’ includes up to 30 days past due. 7 Interest rates for Westpac Rocket Repay Home Loan inclusive of Premier Advantage Package discount assuming loan amount above $250,000. Pricing at 16 October 2019.
Australian housing loan-to-value ratios (LVRs) (%)
Australian mortgage portfolio LVRs Sep-18 balance
Mar-19balance
Sep-19balance
Weighted averages3
LVR at origination (%) 74 74 74
Dynamic LVR1,4 (%) 54 57 58
LVR of new loans5 (%) 71 72 72
2015
47
117
0N/A
1714
49
116 4
50
15 1812
3 1 1.70
10
20
30
40
50
60
70
80
90
100
0<=60 60<=70 70<=80 80<=90 90<=95 95<=100 >100
FY19 drawdowns LVR at origination
Portfolio LVR at origination
Portfolio dynamic LVR1
Australian home loan customers ahead on repayments6 (%)
• Negative equity remains low • National dwelling prices remain
14% higher relative to 5 years ago2
Variable mortgage interest rates7 (%)
1
29
2022
6
21
2
29
20 22
6
21
2
28
21 22
6
21
Behind On time < 1 Mth < 1 Yr < 2 Yrs >2 Yrs
Sep-18 Mar-19 Sep-19
By balance
3.54 4.13 4.09 4.35
2.50
2.50 2.50 2.506.04
6.63 6.59 6.85
P&I I/O P&I I/O
Owner occupied Investor Buffer . Loans assessed at the higher of the customer rate (including any discounts) plus 2.50% buffer, or minimum assessment rate (“floor rate”)
APRA advised that ADI’s will set their own floor for use in serviceability assessments, effective 5 July 2019
Westpac now applies a minimum floor rate of 5.35%
Serviceability assessment rate
Floor rate
5.35%
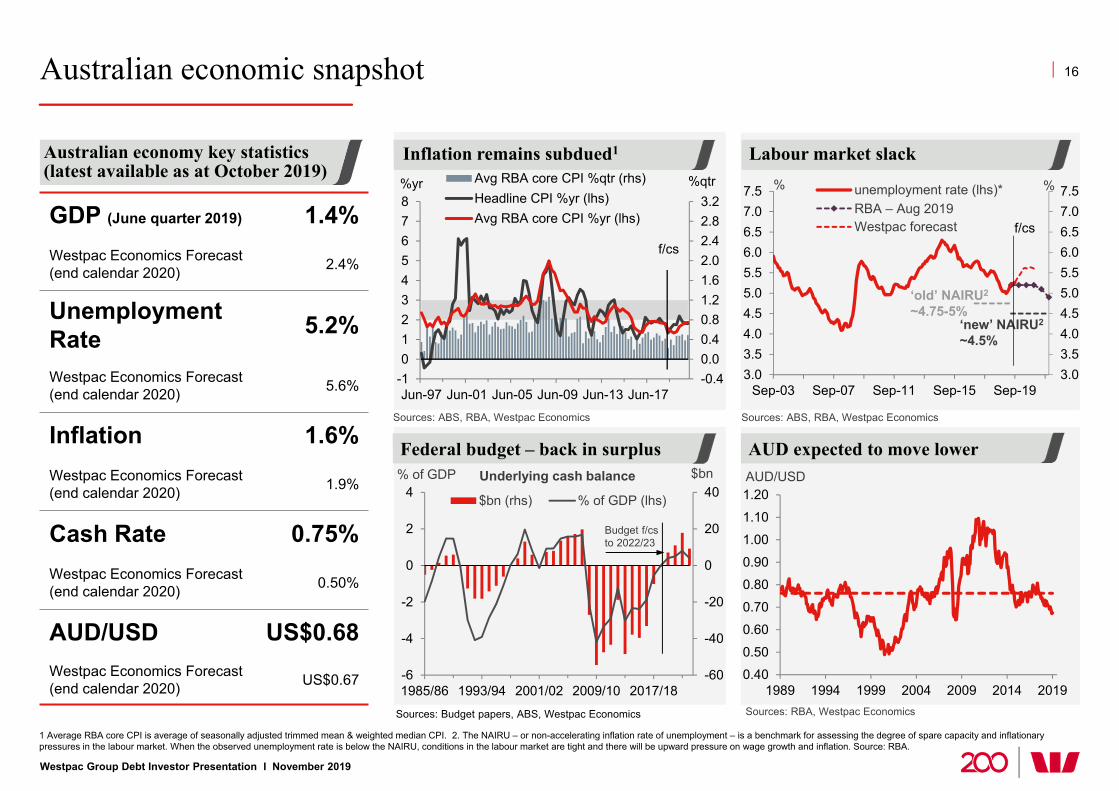
Australian economic snapshot
Inflation remains subdued1 Labour market slack
1 Average RBA core CPI is average of seasonally adjusted trimmed mean & weighted median CPI. 2. The NAIRU – or non-accelerating inflation rate of unemployment – is a benchmark for assessing the degree of spare capacity and inflationary pressures in the labour market. When the observed unemployment rate is below the NAIRU, conditions in the labour market are tight and there will be upward pressure on wage growth and inflation. Source: RBA.
-0.40.00.40.81.21.62.02.42.83.2
-1012345678
Jun-97 Jun-01 Jun-05 Jun-09 Jun-13 Jun-17
%qtr%yr Avg RBA core CPI %qtr (rhs)Headline CPI %yr (lhs)Avg RBA core CPI %yr (lhs)
f/cs
Sources: ABS, RBA, Westpac Economics
Australian economy key statistics (latest available as at October 2019)
Sources: ABS, RBA, Westpac Economics
Sources: RBA, Westpac Economics
0.40
0.50
0.60
0.70
0.80
0.90
1.00
1.10
1.20
1989 1994 1999 2004 2009 2014 2019
AUD/USD
AUD expected to move lower
3.03.54.04.55.05.56.06.57.07.5
3.03.54.04.55.05.56.06.57.07.5
Sep-03 Sep-07 Sep-11 Sep-15 Sep-19
%% unemployment rate (lhs)*RBA – Aug 2019Westpac forecast
‘old’ NAIRU2
~4.75-5%‘new’ NAIRU2
~4.5%
f/cs
Sources: Budget papers, ABS, Westpac Economics
Federal budget – back in surplus
-60
-40
-20
0
20
40
-6
-4
-2
0
2
4
1985/86 1993/94 2001/02 2009/10 2017/18
$bn
$bn (rhs) % of GDP (lhs)
Underlying cash balance
Budget f/cs to 2022/23
% of GDP
Westpac Group Debt Investor Presentation I November 2019
16
GDP (June quarter 2019) 1.4%Westpac Economics Forecast (end calendar 2020) 2.4%
Unemployment Rate 5.2%
Westpac Economics Forecast (end calendar 2020) 5.6%
Inflation 1.6%Westpac Economics Forecast (end calendar 2020) 1.9%
Cash Rate 0.75%Westpac Economics Forecast (end calendar 2020) 0.50%
AUD/USD US$0.68Westpac Economics Forecast (end calendar 2020) US$0.67

Additional information:Tier 2 capital securities

Australia’s approach to total loss-absorbing capacity (TLAC)
Westpac Group Debt Investor Presentation I November 2019
18
Australian D-SIB Total Regulatory Capital
CET1 CET1
Additional Tier 1
Additional Tier 1
Tier 2
Tier 2
CCB
CCBCapital Surplus
Capital Surplus
Current 1 Jan 2024
15.0%
11.5%
8.0%
6.0%
4.5%
18.0%
14.5%
6.0%
4.5%
1 As measured under the current capital adequacy framework. APRA does not expect changes from revisions to the capital framework to impact the absolute amount of additional capital. 2 Source: Per APRA’s paper “Response to Submissions – Loss-Absorbing Capacity” dated 9 July 2019. 3 Capital surplus of 3.5% is generally higher than the level D-SIBs may normally maintain, as D-SIBs have acted in anticipation of changes to the capital adequacy framework as a result of the ‘unquestionably strong’ capital benchmarks. APRA expects the D-SIBs to continue to maintain a normal capital surplus in excess of regulatory capital requirements once such changes are implemented. 4 CCB is the Capital Conservation Buffer. 5 All estimates are based on Westpac’s RWAs as at 30 September 2019, as measured under the current capital adequacy framework.
Westpac Total Regulatory Capital
30 Sep 2019APRA-basis
1 Jan 2024APRA-basis
CET1 Additional Tier 1 Tier 2
• Australian D-SIBs (the four major banks) will meet TLAC requirements through an increase in Total Regulatory Capital
– Additional 3.0 percentage points of RWA1 in Total Regulatory Capital (which APRA expects will be primarily satisfied by Tier 2) required by 1 Jan 2024
– Additional 1-2% of RWA1 through a ‘feasible alternative method’ will be considered by APRA over the next four years
11.0%
• Westpac’s Tier 2 required by 1 Jan 2024 – approx. $21bn (5.0% of RWA5)
• Westpac Tier 2 outstanding as at 30 September 2019 – $12bn (2.8% of RWA5)
5.0% (approx. $21bn5)
10.7% ($46bn)
2.2% ($9bn)
2.8% ($12bn)4
43
3
APRA’s changes to D-SIBs’ capital structures2 Westpac’s Total Regulatory Capital (% of RWA)
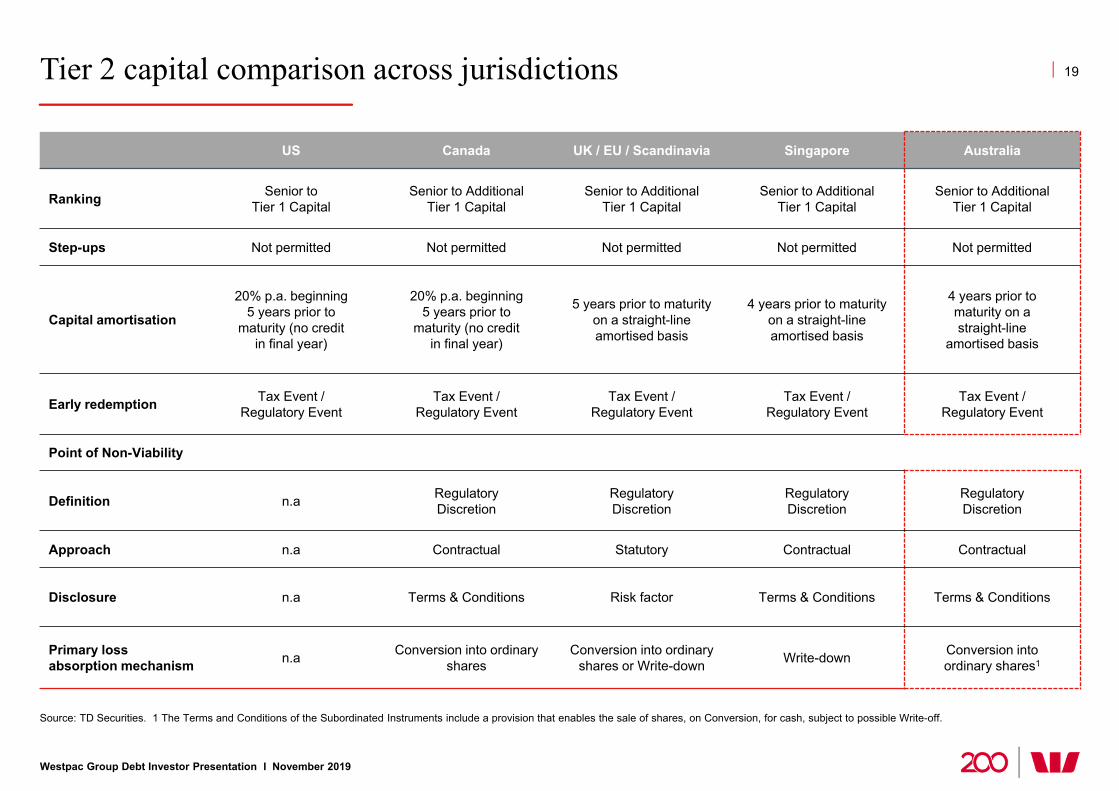
Tier 2 capital comparison across jurisdictions
Source: TD Securities. 1 The Terms and Conditions of the Subordinated Instruments include a provision that enables the sale of shares, on Conversion, for cash, subject to possible Write-off.
US Canada UK / EU / Scandinavia Singapore Australia
Ranking Senior toTier 1 Capital
Senior to Additional Tier 1 Capital
Senior to Additional Tier 1 Capital
Senior to Additional Tier 1 Capital
Senior to Additional Tier 1 Capital
Step-ups Not permitted Not permitted Not permitted Not permitted Not permitted
Capital amortisation
20% p.a. beginning 5 years prior to
maturity (no credit in final year)
20% p.a. beginning 5 years prior to
maturity (no credit in final year)
5 years prior to maturity on a straight-line amortised basis
4 years prior to maturity on a straight-line amortised basis
4 years prior to maturity on a straight-line
amortised basis
Early redemption Tax Event / Regulatory Event
Tax Event / Regulatory Event
Tax Event / Regulatory Event
Tax Event / Regulatory Event
Tax Event / Regulatory Event
Point of Non-Viability
Definition n.a RegulatoryDiscretion
Regulatory Discretion
Regulatory Discretion
Regulatory Discretion
Approach n.a Contractual Statutory Contractual Contractual
Disclosure n.a Terms & Conditions Risk factor Terms & Conditions Terms & Conditions
Primary loss absorption mechanism n.a Conversion into ordinary
sharesConversion into ordinary
shares or Write-down Write-down Conversion into ordinary shares1
Westpac Group Debt Investor Presentation I November 2019
19

Global Yankee Tier 2 comparison
Westpac BMO NAB Nordea Mizuho Financial Group UOB
Issue date 24 Jul 2019 05 Oct 2018 02 Aug 2019 13 Sep 2018 20 Oct 2015 15 Apr 2019
Issue ratingS&P/Moody’s/Fitch BBB1/Baa1/A+ BBB+/Baa1/A+ BBB1/Baa1/A+ AA-/Aa3/AA- BBB+/BBB/--- BBB+/A2/A+
Issuer RatingS&P/Moody’s/Fitch AA-/Aa3/AA- A+/Aa2/AA- AA-/Aa3/AA- A-/Baa1/A+ A-/A1/--- AA-/Aa1/AA-
Structure 15NC10 & 20 year bullet 10NC5 15NC10 15NC10 10 year Bullet 10NC5
Reset Fixed / Fixed & N/A Fixed / Fixed Fixed / Fixed Fixed / Fixed N/A Fixed / Fixed
Format SEC Global SEC Global 144A / Reg S 144A / Reg S 144A / Reg S 144A / Reg S
Point of Non-Viability
Definition APRA discretion OSFI discretion APRA discretionSRB Discretion
under BRRD or SRM Regulation
Triggered by Japan’s Prime Minister upon
suspension of payments or
negative net worth2
MAS discretion
Approach Contractual Contractual Contractual
Contractual acknowledgment of BRRD statutory bail-
in powers
Contractual Contractual
Primary Loss Absorption Mechanism
Conversion into Ordinary Shares subject to a floor
Cash out feature available
Conversion into common shares subject to a floor
Conversion into Ordinary Shares subject to a floor
Cash out feature available
Partial-permanent write-down
Permanent write-off
Permanent write-off
Source: Company filings and offering documents, TD Securities. 1 On 24 October 2019 S&P raised their ratings on Basel III compliant Tier 2 hybrid instruments issued by Westpac, ANZ, CBA and NAB to BBB+ from BBB. 2 Article 126-2, Paragraph 1, Item 2 of the Deposit Insurance Act.
Westpac Group Debt Investor Presentation I November 2019
20
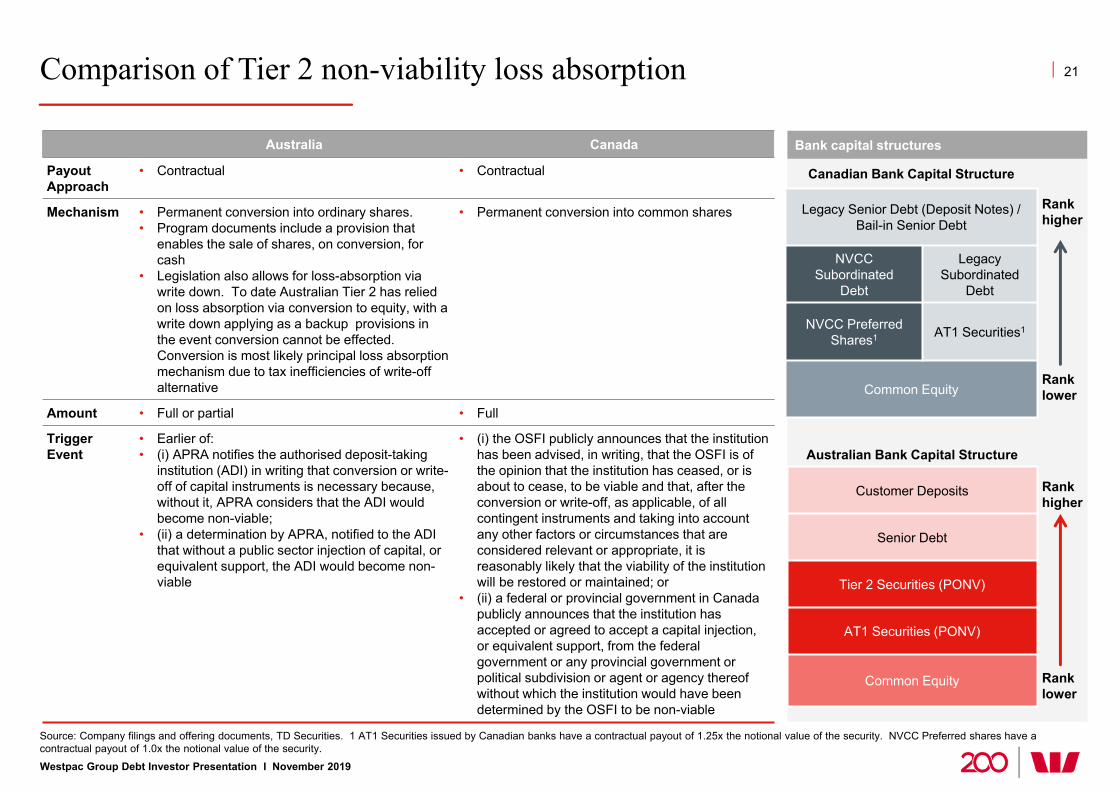
Comparison of Tier 2 non-viability loss absorption
Australia Canada
Payout Approach
• Contractual • Contractual
Mechanism • Permanent conversion into ordinary shares.• Program documents include a provision that
enables the sale of shares, on conversion, for cash
• Legislation also allows for loss-absorption via write down. To date Australian Tier 2 has relied on loss absorption via conversion to equity, with a write down applying as a backup provisions in the event conversion cannot be effected. Conversion is most likely principal loss absorption mechanism due to tax inefficiencies of write-off alternative
• Permanent conversion into common shares
Amount • Full or partial • Full
Trigger Event
• Earlier of:• (i) APRA notifies the authorised deposit-taking
institution (ADI) in writing that conversion or write-off of capital instruments is necessary because, without it, APRA considers that the ADI would become non-viable;
• (ii) a determination by APRA, notified to the ADI that without a public sector injection of capital, or equivalent support, the ADI would become non-viable
• (i) the OSFI publicly announces that the institution has been advised, in writing, that the OSFI is of the opinion that the institution has ceased, or is about to cease, to be viable and that, after the conversion or write-off, as applicable, of all contingent instruments and taking into account any other factors or circumstances that are considered relevant or appropriate, it is reasonably likely that the viability of the institution will be restored or maintained; or
• (ii) a federal or provincial government in Canada publicly announces that the institution has accepted or agreed to accept a capital injection, or equivalent support, from the federal government or any provincial government or political subdivision or agent or agency thereof without which the institution would have been determined by the OSFI to be non-viable
Source: Company filings and offering documents, TD Securities. 1 AT1 Securities issued by Canadian banks have a contractual payout of 1.25x the notional value of the security. NVCC Preferred shares have a contractual payout of 1.0x the notional value of the security.
Westpac Group Debt Investor Presentation I November 2019
Canadian Bank Capital Structure
Rankhigher
Rank lower
Legacy Senior Debt (Deposit Notes) / Bail-in Senior Debt
NVCC Subordinated
Debt
Legacy Subordinated
Debt
NVCC Preferred Shares1 AT1 Securities1
Common Equity
Australian Bank Capital Structure
Rankhigher
Rank lower
Customer Deposits
Senior Debt
Tier 2 Securities (PONV)
AT1 Securities (PONV)
Common Equity
Bank capital structures
21

Australian major bank dated Tier 2 calls
2,412
5,716
620
6,212
2,361
4,312
1,933
3,103
2,176
4,841
1,696
2,679
1,000
1,750
Westpac Peers Westpac Peers Westpac Peers Westpac Peers Westpac Peers Westpac Peers Westpac Peers Westpac Peers
Shown in A$m by calendar year
2010 2011 2012 2013 2014 - 2016
No call dates
Westpac amount callable
Westpac amount called
Australian major bank peers amount callable
Australian major bank peers amount called
Source: Bloomberg (as of 5 November 2019). Includes parent company securities >A$100m only. Amount callable determined based on the first par call date of the subordinated notes. FX as of issue date of each bond. Past performance may not be indicative of future performance. Australian major bank peers are ANZ, CBA and NAB.
2017 2018 2019 YTD
Westpac Group Debt Investor Presentation I November 2019
22

Additional information:Westpac Banking Corporation
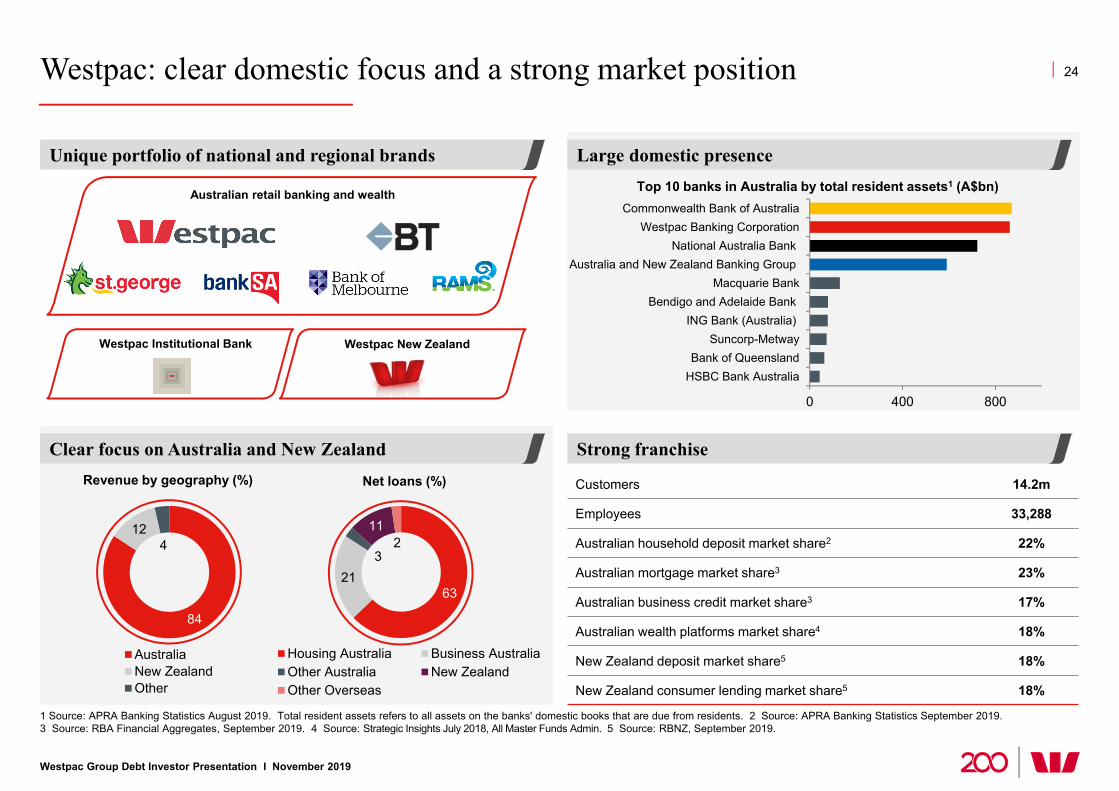
Westpac: clear domestic focus and a strong market position
Large domestic presence
Strong franchise
Unique portfolio of national and regional brands
Clear focus on Australia and New Zealand
1 Source: APRA Banking Statistics August 2019. Total resident assets refers to all assets on the banks' domestic books that are due from residents. 2 Source: APRA Banking Statistics September 2019. 3 Source: RBA Financial Aggregates, September 2019. 4 Source: Strategic Insights July 2018, All Master Funds Admin. 5 Source: RBNZ, September 2019.
24
Westpac Group Debt Investor Presentation I November 2019
Westpac New Zealand Westpac Institutional Bank
Australian retail banking and wealth
0 400 800
HSBC Bank AustraliaBank of Queensland
Suncorp-MetwayING Bank (Australia)
Bendigo and Adelaide BankMacquarie Bank
Australia and New Zealand Banking GroupNational Australia Bank
Westpac Banking CorporationCommonwealth Bank of Australia
Top 10 banks in Australia by total resident assets1 (A$bn)
Customers 14.2m
Employees 33,288
Australian household deposit market share2 22%
Australian mortgage market share3 23%
Australian business credit market share3 17%
Australian wealth platforms market share4 18%
New Zealand deposit market share5 18%
New Zealand consumer lending market share5 18%
Net loans (%)Revenue by geography (%)
84
124
AustraliaNew ZealandOther
6321
3
112
Housing Australia Business AustraliaOther Australia New ZealandOther Overseas

Westpac’s 2020 Sustainability Strategy
Westpac Group Debt Investor Presentation I November 2019
25
Helping people make better financial decisions
Helping people by being there when it matters most to them
Helping people create a prosperous nation
A culture of doing the right thing
Fundamentals
We believe in creating a fairer, more inclusive and confident society by helping people understand money.
Our aim is to help customers track and grow their wealth so they will feel more confident with financial decisions no matter their situation.
ALIGNMENT TO THE SUSTAINABLE DEVELOPMENT GOALS
ALIGNMENT TO THE SUSTAINABLE DEVELOPMENT GOALS
ALIGNMENT TO THE SUSTAINABLE DEVELOPMENT GOALS
ALIGNMENT TO THE SUSTAINABLE DEVELOPMENT GOALS
ALIGNMENT TO THE SUSTAINABLE DEVELOPMENT GOALS
We understand that life has its tough moments, and vulnerability is something that can affect anyone at any time.
We want to be by our customers’ side and help more people as they go through major life events.
Our world is changing at an unprecedented rate, affecting how we all live and work.
We want to help more people gain the skills that will be needed in the future, and accelerate how we identify and solve the biggest issues impacting Australia and the world.
We are committed to building a culture of care, inclusiveness and high integrity – where it’s expected that all our people demonstrate the values of our company and speak up if something isn’t right.
We believe in doing the right thing by our customers, communities and people –grounded in transparency and responsiveness to the concerns of our customers and the wider community.
We are committed to continuing to lead on the fundamentals: the sustainability policies, action plans and frameworks.
We are also continuing to report on additional metrics that are expected of a bank committed to sustainable business practices.

• Sustainability risk management framework• Risk management framework• Responsible sourcing code of conduct
• Sustainability strategy 2018-2020• Inclusion and diversity strategy• Divisional and business unit strategies
Sustainability governance framework 26
Westpac Stakeholder
Advisory Council
Westpac Indigenous Advisory
Committee
Westpac New Zealand
External Stakeholder
Panel
Westpac Board
Executive Team
Divisional committees and working groups
Westpac Group Sustainability Council Westpac Group Inclusion and Diversity Council
Westpac New Zealand Sustainable Business Steering Committee
Internal Committee
External Committee
Guiding our approach Managing risk Driving action• Principles for doing business• Stakeholder engagement framework• Social impact framework
• ESG credit policy• Financing Agribusiness Position Statement• Financing the Defence Sector Position Statement• Financing Tobacco Position Statement• Privacy Policy
• Climate Change Position Statement and 2020 Action Plan
• Reconciliation Action Plan• Accessibility Action Plan• Financial Inclusion Action Plan• Customer Vulnerability 2020 Action Plan
Policies and position statements Specific policies and positions Action plans and divisional strategies• Climate Change Position Statement and 2020
Action Plan• Human Rights Position Statement and Action Plan• Responsible Investment Position Statement• Supplier Inclusion and Diversity Policy• Wellbeing Policy
Global commitments and partnerships
Interim and annual reporting
• Global Investor Statement on Climate Change • Climate Action +100• Equator Principles• Financial Stability Board's TCFD
Westpac Group Debt Investor Presentation I November 2019
• Principles for Responsible Banking – United Nations Environment Programme Finance Initiative
• Banking Environment Initiative (Univ. of Cambridge)• Business Coalition Statement on Climate Change
• UN Environment Program - Finance Initiative• UN Principles for Responsible Investment• UN Global Compact• We Mean Business Coalition

Westpac Climate Change Position Statement and 2020 Action Plan
The Westpac Group has long recognised that climate change is one of the most significant issues that will impact the long-term prosperity of our economy and way of life
Since we set out our first climate change action plan almost a decade ago, we have been helping customers and communities transition to a low carbon economy
Westpac continues to integrate the consideration of climate-related risks and opportunities into business operations. This includes alignment with the recommendations of the Task Force on Climate-related Financial Disclosures (TCFD), which the Group has publicly committed to support
Westpac’s Approachto Climate Change
The core principles that guide and inform Westpac’s approach to climate change are:
Our Principles
The following focus areas will direct Westpac’s actions on climate change:
Our 2020 Action Plan
Transparency and disclosure matters
A transition to a net zero emissions economy is required
Economic growth and emissions reductions are complementary goals
Addressing climate change creates financial opportunities
Climate-related risk is a financial risk
1
2
3
4
5Advocate for policies that stimulate investment in climate change solutions
Provide finance to back climate change solutions
Support businesses that manage their climate-related risks
Help individual customers respond to climate change
Improve and disclose our climate change performance
1
2
3
4
5
27
Westpac Group Debt Investor Presentation I November 2019
Westpac was the first Australian bank to recognise the importance of limiting global warming to two degrees
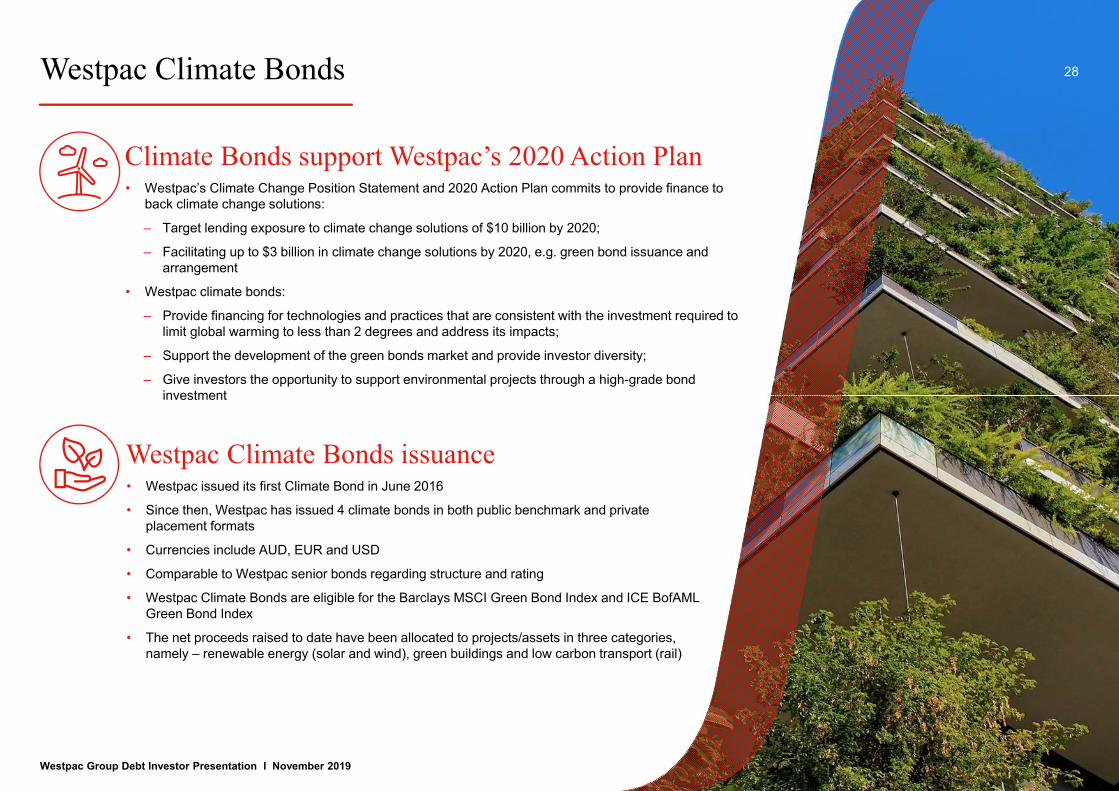
Westpac Climate Bonds 28
Westpac Group Debt Investor Presentation I November 2019
Climate Bonds support Westpac’s 2020 Action Plan• Westpac’s Climate Change Position Statement and 2020 Action Plan commits to provide finance to
back climate change solutions:
– Target lending exposure to climate change solutions of $10 billion by 2020;
– Facilitating up to $3 billion in climate change solutions by 2020, e.g. green bond issuance and arrangement
• Westpac climate bonds:
– Provide financing for technologies and practices that are consistent with the investment required to limit global warming to less than 2 degrees and address its impacts;
– Support the development of the green bonds market and provide investor diversity;
– Give investors the opportunity to support environmental projects through a high-grade bond investment
Westpac Climate Bonds issuance• Westpac issued its first Climate Bond in June 2016
• Since then, Westpac has issued 4 climate bonds in both public benchmark and private placement formats
• Currencies include AUD, EUR and USD
• Comparable to Westpac senior bonds regarding structure and rating
• Westpac Climate Bonds are eligible for the Barclays MSCI Green Bond Index and ICE BofAML Green Bond Index
• The net proceeds raised to date have been allocated to projects/assets in three categories, namely – renewable energy (solar and wind), green buildings and low carbon transport (rail)
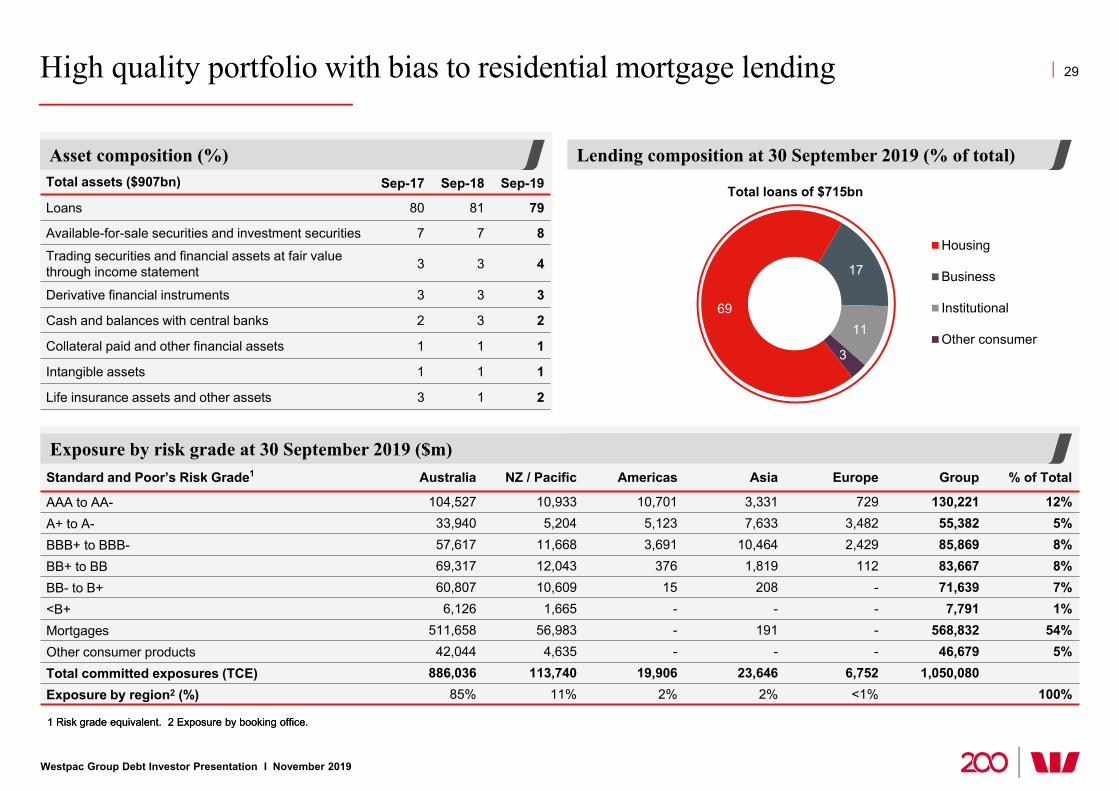
High quality portfolio with bias to residential mortgage lending
Westpac Group Debt Investor Presentation I November 2019
1 Risk grade equivalent. 2 Exposure by booking office.
Lending composition at 30 September 2019 (% of total)Asset composition (%)
29
69
17
11
3
Housing
Business
Institutional
Other consumer
Total loans of $715bn
1 Risk grade equivalent. 2 Exposure by booking office.
Exposure by risk grade at 30 September 2019 ($m)
Total assets ($907bn) Sep-17 Sep-18 Sep-19
Loans 80 81 79
Available-for-sale securities and investment securities 7 7 8Trading securities and financial assets at fair value through income statement 3 3 4
Derivative financial instruments 3 3 3
Cash and balances with central banks 2 3 2
Collateral paid and other financial assets 1 1 1
Intangible assets 1 1 1
Life insurance assets and other assets 3 1 2
Standard and Poor’s Risk Grade1 Australia NZ / Pacific Americas Asia Europe Group % of Total
AAA to AA- 104,527 10,933 10,701 3,331 729 130,221 12%A+ to A- 33,940 5,204 5,123 7,633 3,482 55,382 5%BBB+ to BBB- 57,617 11,668 3,691 10,464 2,429 85,869 8%BB+ to BB 69,317 12,043 376 1,819 112 83,667 8%BB- to B+ 60,807 10,609 15 208 - 71,639 7%<B+ 6,126 1,665 - - - 7,791 1%Mortgages 511,658 56,983 - 191 - 568,832 54%Other consumer products 42,044 4,635 - - - 46,679 5%Total committed exposures (TCE) 886,036 113,740 19,906 23,646 6,752 1,050,080 Exposure by region2 (%) 85% 11% 2% 2% <1% 100%
0 20 40 60 80 100 120
Mining
Other
Accommodation, cafes& restaurants
Construction
Utilities
Transport & storage
Agriculture, forestry & fishing
Services
Property services & business services
Manufacturing
Wholesale & retail trade
Property
Government admin. & defence
Finance & insurance
Sep-17
Sep-18
Sep-19
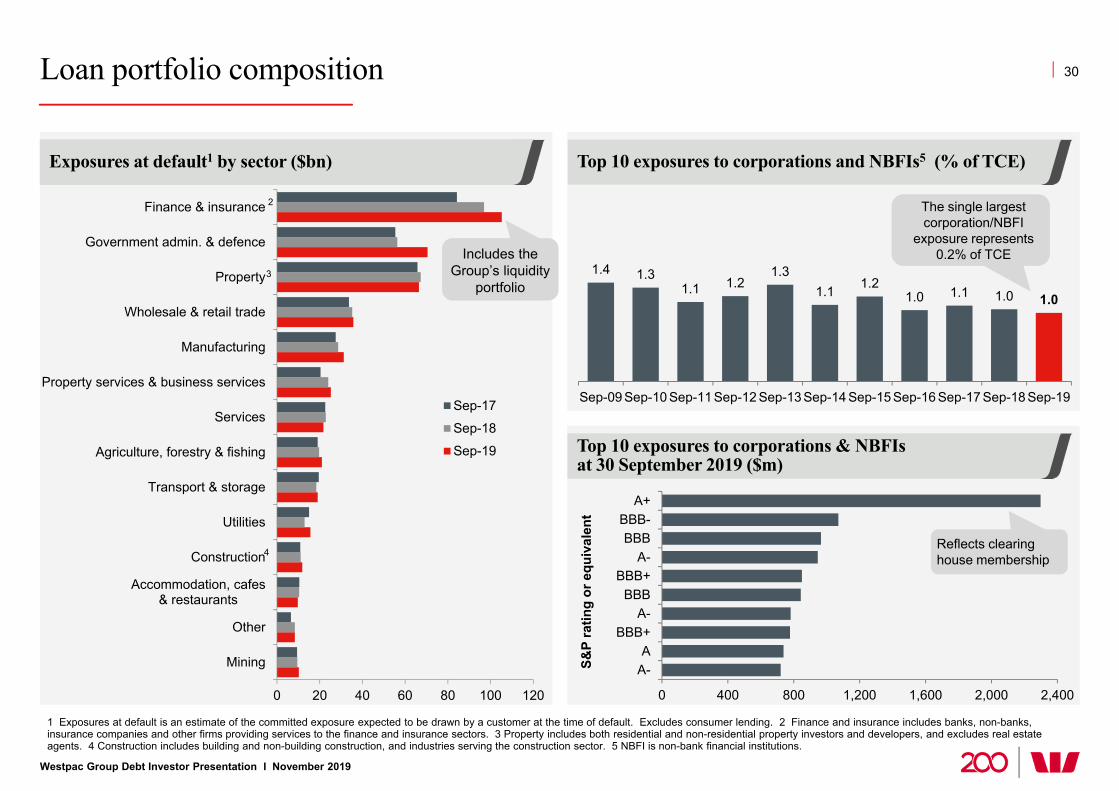
Loan portfolio composition
Westpac Group Debt Investor Presentation I November 2019
1 Exposures at default is an estimate of the committed exposure expected to be drawn by a customer at the time of default. Excludes consumer lending. 2 Finance and insurance includes banks, non-banks, insurance companies and other firms providing services to the finance and insurance sectors. 3 Property includes both residential and non-residential property investors and developers, and excludes real estate agents. 4 Construction includes building and non-building construction, and industries serving the construction sector. 5 NBFI is non-bank financial institutions.
1.4 1.31.1 1.2
1.31.1 1.2
1.0 1.1 1.0 1.0
Sep-09 Sep-10 Sep-11 Sep-12 Sep-13 Sep-14 Sep-15 Sep-16 Sep-17 Sep-18 Sep-19
Top 10 exposures to corporations and NBFIs5 (% of TCE)
Top 10 exposures to corporations & NBFIs at 30 September 2019 ($m)
30
Exposures at default1 by sector ($bn)
2
3
4
The single largest corporation/NBFI
exposure represents 0.2% of TCE
0 400 800 1,200 1,600 2,000 2,400
A-A
BBB+A-
BBBBBB+
A-BBB
BBB-A+
S&P
ratin
g or
equ
ival
ent
Includes the Group’s liquidity
portfolio
Reflects clearing house membership

Provision cover by portfolio category
Westpac Group Debt Investor Presentation I November 2019
31
Exposures as a % of TCE
0.15 0.14 0.17 0.17
0.37 0.39 0.43 0.48
0.57 0.55 0.50 0.55
3.24 3.03
98.91 98.92
95.66 95.77
Mar-18 Sep-18 Mar-19 Sep-19
Fully performing portfolio
Watchlist & substandard
90+ day past due and not impaired
Impaired
Fully performing portfolio
Small cover as low probability of default (PD) 0.20 0.18 0.09 0.09
Provisioning to TCE (%)
Mar-18 Sep-18 Mar-19 Sep-19
Watchlist & substandard
Still performing but higher cover reflects deterioration 4.71 5.27 5.59 5.27
90+ day past due and not impaired
In default but strong security 5.03 5.11 12.34 11.07
Impaired assets
In default. High provision cover reflects expected recovery 45.54 46.12 45.74 44.92
Stag
e 3
prov
isio
nsSt
age
2 pr
ovis
ions
Stag
e 1
prov
isio
ns
Non-stressed but significant increase in credit risk
Lifetime expected loss based on future economic conditions 4.18 4.32
Non-stressed but significant increase in credit risk
0.0
0.2
0.4
0.6
0.8
1.0
1.2
1.4
1.6
1.8
2.0
Who
lesa
le &
reta
il tra
de
Agr
icul
ture
, for
estry
&fis
hing
Pro
perty
Ser
vice
s
Pro
perty
ser
vice
s &
busi
ness
ser
vice
s
Man
ufac
turin
g
Con
stru
ctio
n
Tran
spor
t & s
tora
ge
Acc
omm
odat
ion,
caf
es&
rest
aura
nts
Fina
nce
& in
sura
nce
Min
ing
Util
ities
Sep-18 Mar-19 Sep-19
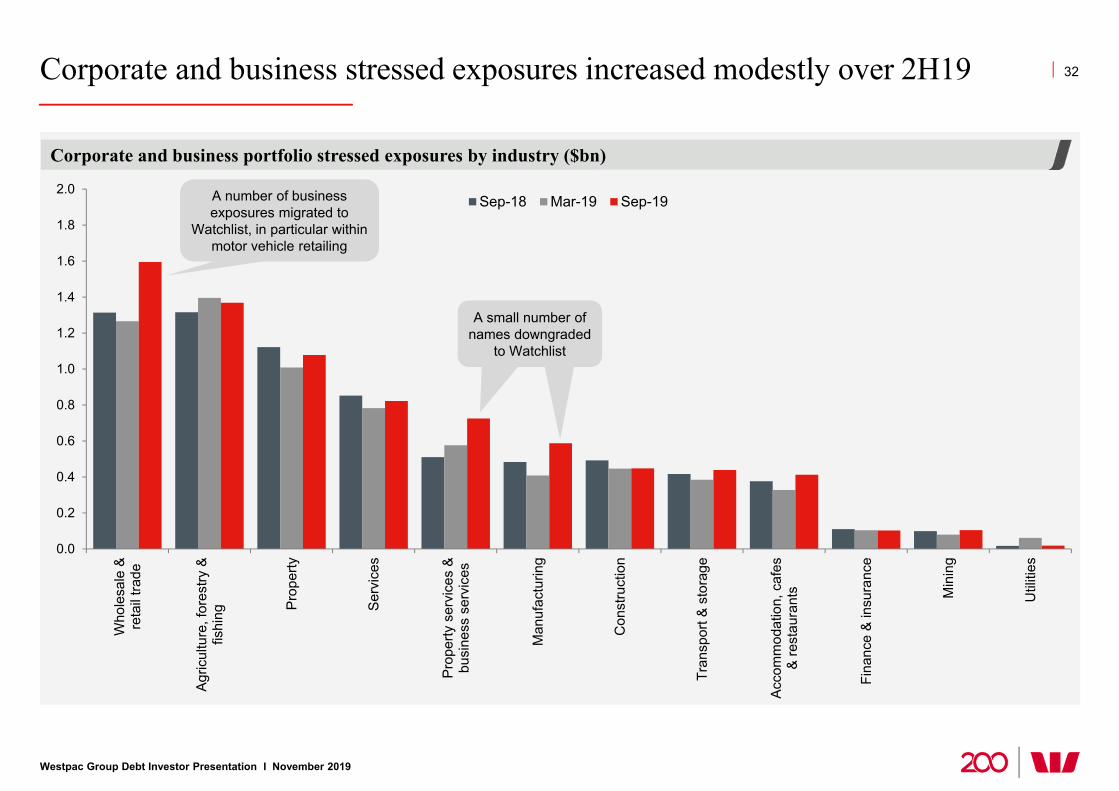
Corporate and business stressed exposures increased modestly over 2H19
Westpac Group Debt Investor Presentation I November 2019
Corporate and business portfolio stressed exposures by industry ($bn)
32
A number of business exposures migrated to
Watchlist, in particular within motor vehicle retailing
A small number of names downgraded
to Watchlist

Areas of interest: Commercial property
Westpac Group Debt Investor Presentation I November 2019
1 Includes impaired exposures. 2 Percentage of commercial property portfolio TCE.
Commercial property portfolio composition (%)
Commercial property exposures % of TCE and % in stressCommercial property portfolio
33
0
5
10
15
20
0
2
4
6
8
10
Mar
-10
Sep-
10M
ar-1
1Se
p-11
Mar
-12
Sep-
12M
ar-1
3Se
p-13
Mar
-14
Sep-
14M
ar-1
5Se
p-15
Mar
-16
Sep-
16M
ar-1
7Se
p-17
Mar
-18
Sep-
18M
ar-1
9Se
p-19
Commercial property as % of TCE (lhs)
Commercial property % in stress (rhs)
Sep-18 Mar-19 Sep-19
Total committed exposures (TCE) $67.6bn $66.9bn $66.9bn
Lending $52.0bn $52.3bn $51.7bn
Commercial property as a % of Group TCE 6.51 6.39 6.37
Median risk grade BB+ equivalent
BB+ equivalent
BB+ equivalent
% of portfolio graded as stressed1,2 1.66 1.51 1.61
% of portfolio in impaired2 0.23 0.22 0.15
19
10
74
411
45
NSW & ACT
Vic
Qld
SA & NT
WA
NZ & Pacific
Institutional(diversified)
43
8
36
13Investors &Developers <$10m
Developers >$10m
Investors >$10m
Diversified PropertyGroups and PropertyTrusts >$10m
42
25
23
10Commercial offices& diversified groups
Residential
Retail
Industrial
Borrower type (%)Region (%) Sector (%)

Areas of interest: Inner city apartments
Westpac Group Debt Investor Presentation I November 2019
34
1 Percentage of commercial property TCE. 2 Totals may not add up due to rounding.
Sep-18 Mar-19 Sep- 19 TCE (%)1
Residential apartment development >$20m 4.1 3.3 3.4 5.1 • Approvals and new starts lower and expected to slow further. • Tightened risk appetite for areas of concern remains in place• Settlements remain slightly slower than historical experience, but
Westpac’s debt has been repaid in full given low LVRsResidential apartment development >$20m in major markets, refer below2 2.6 2.8 2.8 4.2
Sydney major markets 1.8 2.1 2.0 3.0 • Increase due to expanding definition of ‘major ’ Sydney suburbs in Nov-18. Comparable TCE to Sep-18 would be $1.5bn at Sep-19
Inner Melbourne 0.6 0.5 0.5 0.7 • Weighted average LVR 48.8%
Inner Brisbane 0.1 0.1 0.1 0.1 • Slow market. Exposure low
Perth metro 0.1 0.1 0.1 0.1 • Activity slowly lifting.
Average portfolio LVR 49%
Consumer mortgages where security is within an inner city residential apartment development Sep-18 Mar-19 Sep-19
Total consumer mortgage loans for inner city apartments $15.2bn $15.3bn $15.3bn
Average LVR at origination 73% 72% 72%
Average dynamic LVR 57% 56% 56%
Dynamic LVR >90% 2.49% 3.59% 3.66%
90+ day delinquencies 44bps 62bps 66bps
Residential apartment development >$20m weighted average LVR (%) Consumer mortgages
Commercial property portfolio TCE ($bn)
46.9 50.6 47.6
2019 2020 2021Expected Completion Date
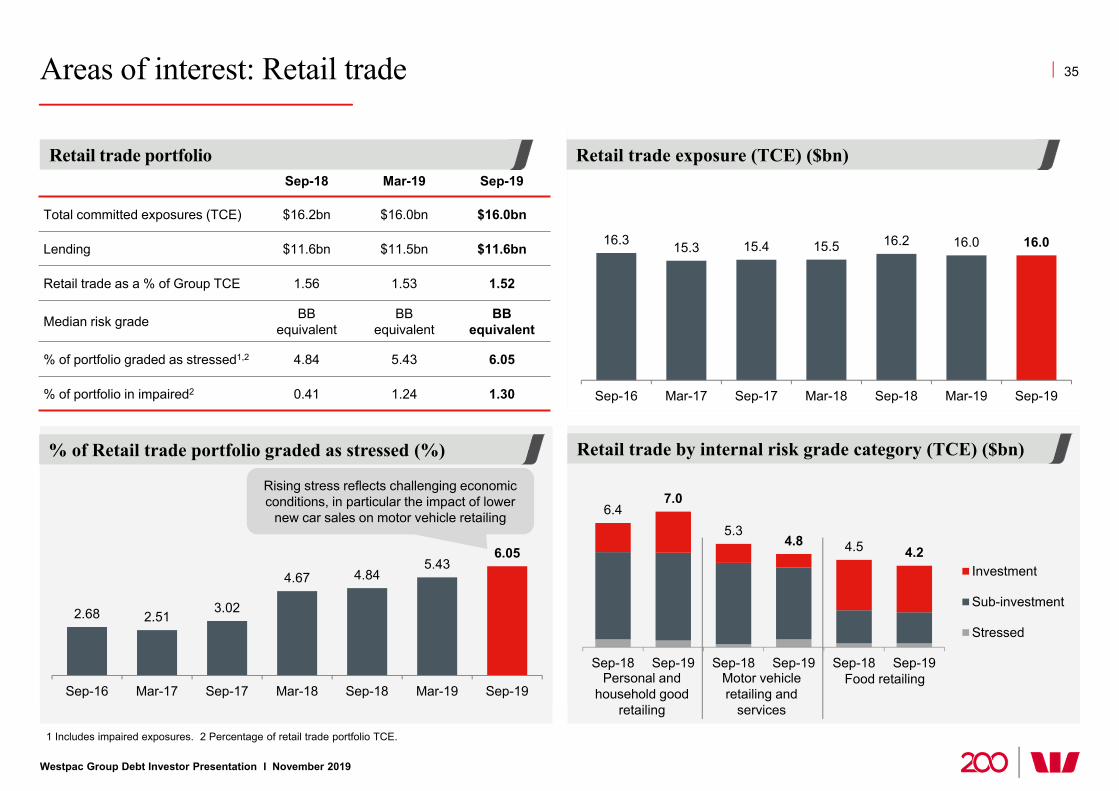
Areas of interest: Retail trade
6.47.0
5.34.8 4.5 4.2
Sep-18 Sep-19 Sep-18 Sep-19 Sep-18 Sep-19
Investment
Sub-investment
Stressed
Retail trade by internal risk grade category (TCE) ($bn)
35
% of Retail trade portfolio graded as stressed (%)
Westpac Group Debt Investor Presentation I November 2019
1 Includes impaired exposures. 2 Percentage of retail trade portfolio TCE.
Sep-18 Mar-19 Sep-19
Total committed exposures (TCE) $16.2bn $16.0bn $16.0bn
Lending $11.6bn $11.5bn $11.6bn
Retail trade as a % of Group TCE 1.56 1.53 1.52
Median risk grade BB equivalent
BB equivalent
BB equivalent
% of portfolio graded as stressed1,2 4.84 5.43 6.05
% of portfolio in impaired2 0.41 1.24 1.30
Retail trade portfolio
16.3 15.3 15.4 15.5 16.2 16.0 16.0
Sep-16 Mar-17 Sep-17 Mar-18 Sep-18 Mar-19 Sep-19
2.68 2.513.02
4.67 4.845.43
6.05
Sep-16 Mar-17 Sep-17 Mar-18 Sep-18 Mar-19 Sep-19
Retail trade exposure (TCE) ($bn)
Rising stress reflects challenging economic conditions, in particular the impact of lower
new car sales on motor vehicle retailing
Personal and household good
retailing
Motor vehicle retailing and
services
Food retailing

Areas of interest: Mining and Australian Agriculture
1 Includes impaired exposures. 2 Percentage of portfolio TCE. 3 Sourced from Westpac Economics and Bloomberg. 4 The steel index 62% Fe fines benchmark. 5 Brent oil price.
36
Iron Ore and Oil prices ($)3Mining portfolio (TCE) by sector (%)
35
23
16
11
78
Oil and gas Other metal oreMining services Iron oreCoal Other
Australian Agriculture (TCE) by state (%)
Australian Agriculture (TCE) portfolio composition (%)
20
60
100
140
Sep-16 Sep-17 Sep-18 Sep-19 Sep-20
Iron ore (USD/t) Crude oil (USD/bbl)4 5
Westpac Economics forecast
Westpac Group Debt Investor Presentation I November 2019
27
2121
14
116
NSW/ACT
QLD
VIC/TAS
WA
SA/NT
Institutional
32
249
7
65
54 3 3 2
GrainBeef & SheepHorticultureDairyServices to AgriCottonFishing & AquacultureViticultureForestry & LoggingPoultryOther
Australian Agriculture portfolio
Mining (inc. oil and gas) portfolio
Sep-18 Mar-19 Sep-19
Total committed exposure (TCE) $10.7bn $9.8bn $10.5bn
Lending $5.7bn $5.2bn $5.5bn
Median risk grade(S&P equivalent) BBB- BBB- BBB
% of Group TCE 1.03 0.94 1.00
% of portfolio graded as stressed1,2 0.99 0.81 0.99
% of portfolio in impaired2 0.17 0.16 0.16
Sep-18 Mar-19 Sep-19
Total committed exposure (TCE) $10.6bn $10.9bn $11.2bn
Lending $8.5bn $8.6bn $9.1bn
Median risk grade(S&P equivalent) BB BB BB
% of Group TCE 1.02 1.04 1.07
% of portfolio graded as stressed1,2 4.40 4.65 4.29
% of portfolio in impaired2 0.27 0.35 0.28

-
1.00
2.00
3.00
Sep-16 Mar-17 Sep-17 Mar-18 Sep-18 Mar-19 Sep-19
Total unsecuredconsumer lending
Total ex-hardship
Australian consumer unsecured lending, 3% of Group loans
Westpac Group Debt Investor Presentation I November 2019
90+ day delinquencies (%)Australian unsecured portfolio ($bn)1
1 Does not include Margin Lending.
37
Sep-18 Mar-19 Sep-19
Lending $21.1bn $20.7bn $19.5bn
30+ day delinquencies (%) 3.65 4.08 3.68
90+ day delinquencies (%) 1.73 1.87 1.77
Small increase in consumer unsecured 90+ day delinquencies over FY19 due to portfolio contraction, temporary changes to collections operations partly offset by an improvement in Auto Finance arrears
9.2
4.5 7.4
21.1
9.2
4.4 7.1
20.7
8.7
4.16.7
19.5
Credit cards Personal loans Auto loans(consumer)
Total consumerunsecured
Sep-18 Mar-19 Sep-19
Unsecured portfolio ($bn)Australian consumer unsecured lending portfolio1
0
1
2
3
10
13
15
18
20
23
25
Sep-
16
Nov
-16
Jan-
17
Mar
-17
May
-17
Jul-1
7
Sep-
17
Nov
-17
Jan-
18
Mar
-18
May
-18
Jul-1
8
Sep-
18
Nov
-18
Jan-
19
Mar
-19
May
-19
Jul-1
9
Sep-
19
Unsecured performing loans balance ($bn lhs)Unsecured 90+ day delinquencies balance ($bn rhs)
Australian mortgage portfolio underwriting
Westpac Group Debt Investor Presentation I November 2019
38
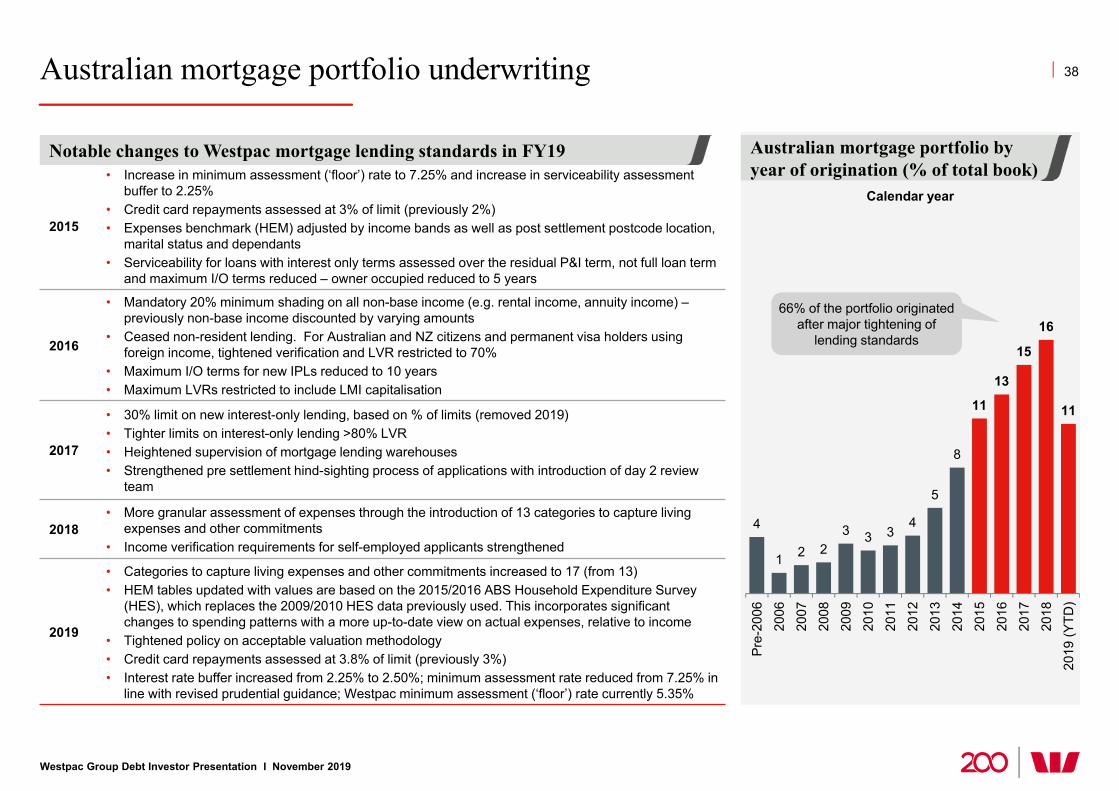
Notable changes to Westpac mortgage lending standards in FY19 Australian mortgage portfolio by year of origination (% of total book)
4
1 2 23 3 3
4
5
8
11
13
15
16
11
Pre-
2006
2006
2007
2008
2009
2010
2011
2012
2013
2014
2015
2016
2017
2018
2019
(YTD
)
Calendar year
66% of the portfolio originated after major tightening of
lending standards
2015
• Increase in minimum assessment (‘floor’) rate to 7.25% and increase in serviceability assessment buffer to 2.25%
• Credit card repayments assessed at 3% of limit (previously 2%)• Expenses benchmark (HEM) adjusted by income bands as well as post settlement postcode location,
marital status and dependants• Serviceability for loans with interest only terms assessed over the residual P&I term, not full loan term
and maximum I/O terms reduced – owner occupied reduced to 5 years
2016
• Mandatory 20% minimum shading on all non-base income (e.g. rental income, annuity income) –previously non-base income discounted by varying amounts
• Ceased non-resident lending. For Australian and NZ citizens and permanent visa holders using foreign income, tightened verification and LVR restricted to 70%
• Maximum I/O terms for new IPLs reduced to 10 years• Maximum LVRs restricted to include LMI capitalisation
2017
• 30% limit on new interest-only lending, based on % of limits (removed 2019)• Tighter limits on interest-only lending >80% LVR• Heightened supervision of mortgage lending warehouses• Strengthened pre settlement hind-sighting process of applications with introduction of day 2 review
team
2018• More granular assessment of expenses through the introduction of 13 categories to capture living
expenses and other commitments• Income verification requirements for self-employed applicants strengthened
2019
• Categories to capture living expenses and other commitments increased to 17 (from 13)• HEM tables updated with values are based on the 2015/2016 ABS Household Expenditure Survey
(HES), which replaces the 2009/2010 HES data previously used. This incorporates significant changes to spending patterns with a more up-to-date view on actual expenses, relative to income
• Tightened policy on acceptable valuation methodology• Credit card repayments assessed at 3.8% of limit (previously 3%)• Interest rate buffer increased from 2.25% to 2.50%; minimum assessment rate reduced from 7.25% in
line with revised prudential guidance; Westpac minimum assessment (‘floor’) rate currently 5.35%

Westpac Group Debt Investor Presentation I November 2019
Interest only mortgages 39
1 Weighted average LVR calculation takes into account size of outstanding balances. 2 Customer loans ahead on payments exclude equity/line of credit products as there are no scheduled principal payments.3 Excludes RAMS. Dynamic LVR is the loan-to-value ratio taking into account the current loan balance, changes in security value, offset account balances and other loan adjustments. Property valuation source Australian Property Monitors. 4 Excludes line of credit loans, I/O loans without date (including bridging loans and loans with construction purpose) and I/O loans that should have switched to P&I but for the previously announced mortgage processing error.
0.0
0.5
1.0
1.5
2.0
Sep-17 Mar-18 Sep-18 Mar-19 Sep-19
I/O P&I
Australian mortgage delinquencies (%)Australian I/O loan portfolio ($bn)
02468101214
0
50
100
150
200
250
Sep-
17N
ov-1
7Ja
n-18
Mar
-18
May
-18
Jul-1
8Se
p-18
Nov
-18
Jan-
19M
ar-1
9M
ay-1
9Ju
l-19
Sep-
19
I/O performing loans balance (lhs)
I/O 90+ day delinquencies balance (rhs)
11 7 3
2519
9
13
8
5
49
34
17
<=60% 60%<=80% >80%Dynamic LVR bands (%)
>$250k
$100k - $250k
<$100k
Applicant gross income bands
I/O lending by dynamic LVR3 and income band (%)
• 73% weighted average LVR of interest only loans at origination1
• 62% of customers ahead of repayments (including offset accounts)2
• Offset account balances attached to interest only loans represent 40% of offset account balances
• 90+ day delinquencies 77bps (compared to P&I portfolio 90bps)
• Annualised loss rate (net of insurance claims) 5bps (1H19: 3bps). Increase in 2H19 mainly due to portfolio contraction
Scheduled I/O term expiry4 (% of total I/O loans)
2022
17
8 8
18
7
0<1 Yr 1<2 Yrs 2<3 Yrs 3<4 Yrs 4<5 Yrs 5<10 Yrs 10 Yrs+

Westpac Group Debt Investor Presentation I November 2019
Australian investment property portfolio 40
1 Weighted average LVR calculation takes into account size of outstanding balances. 2 Average LVR of new loans is on rolling 6 month window. 3 Includes RAMS in 1H19 and 2H19. Excludes RAMS in 2H18. Dynamic LVR is the loan-to-value ratio taking into account the current loan balance, changes in security value, offset account balances and other loan adjustments. Property valuation source Australian Property Monitors. 4 Includes amortisation. Calculated at account level where split loans represent more than one account. 5 Customer loans ahead on payments exclude equity/line of credit products as there are no scheduled principal payments.
Investment property lending (IPL) portfolio Sep-18 Mar-19 Sep-19
Weighted averages1
LVR of IPL loans at origination (%) 73 73 72
LVR of new IPL loans in the period2 (%) 70 71 70
Dynamic LVR3 of IPL loans (%) 56 59 60
Average loan size4 ($’000) 321 321 322
Customers ahead on repaymentsincluding offset accounts5 (%) 58 58 59
90+ day delinquencies (bps) 57 68 73
Annualised loss rate (net of insurance claims) (bps) 3 3 4
0
10
20
30
40
50
0<=6
0
60<=
70
70<=
75
75<=
80
80<=
85
85<=
90
90<=
95
95<=
97 97+
Owner occupied IPL
05
1015202530
<=50
50<=
75
75<=
100
100<
=125
125<
=150
150<
=200
200<
=500
500<
=1m
1m+
Owner occupied IPL
Investment property portfolio by number of properties per customer (%)
62
26
7 2
1 11
2
3
4
5
6+
Chart does not add to 100 due to rounding
Mortgage portfolio by gross income band (%) Mortgage portfolio by LVR at origination (%)% %

Australian mortgage deep dive
Westpac Group Debt Investor Presentation I November 2019
1 Portfolio comprised of residential mortgages, excluding RAMS, and business mortgages originated via a separate platform such as construction loans and loans to SMSFs. 2 Dynamic LVR is the loan-to-value ratio taking into account the current loan balance, changes in security value, offset account balances and other loan adjustments. Property valuation source Australian Property Monitors. 3 Based on a specific Rocket Repay rate offered during the period. Westpac Rocket Repay Home Loan exclusive of discounts assuming loan amount above $250,000. 4 Source, Westpac Economics, CoreLogic. All dwellings Australia - average 8 major capital cities. Prices to September 2019.
Australian mortgage lending1 by origination date, dynamic LVR2 and income bands (%)
41
217 2
34
145
11
4
1
66
25
9
<60 60-80 >80
38
6 2
33
73
7
1
79
146
<60 60-80 >80
10 11 5
19 23
12
87
4
37 41
22
<60 60-80 >80
% of portfolio at 30 September 2019 16 22 62
Westpac SVR3 (%) (excl. discounts) 7.86 6.89 – 5.70 5.38 – 4.83
Westpac interest rate buffer (%) 1.80 1.80 2.25 (2.50 effective Jul 2019)
Westpac interest rate floor (%) 6.80 6.80 7.25 (5.35 effective Sep 2019)
House price changes4 At least +27% +12% to +36% (8%) to +12%
<2011 2011-14 2015+
Dynamic LVR2 bands (%)
>$250k
$100k - $250k
<$100k
Gross income bands
Year of originationChart may not add due to rounding
Lenders mortgage insurance arrangements
Westpac Group Debt Investor Presentation I November 2019
1 Since 18 May 2015 WLMI has underwritten all mortgage insurance, where required, on Westpac originated mortgages. The in-force portfolio of loans includes mortgage insurance provided by external providers. 2 Prudential Capital Requirement (PCR) calculated in accordance with APRA standards. 3 Insured coverage is net of quota share. 4 Low doc loans no longer sold. Refers to arrangements in place for legacy products. 5 No WLMI coverage if the loan goes to 90+ arrears in the first twelve months and insurance via WLMI ceases once the loans is 8 years from origination (unless in a securitised pool). 6 Loss ratio is claims over the total earned premium plus exchange commission. 7 LMI gross written premium includes loans >90% LVR reinsured with Arch Reinsurance Limited. 2H19 gross written premium includes $56m from the arrangement (1H19: $52m and 2H18: $61m)
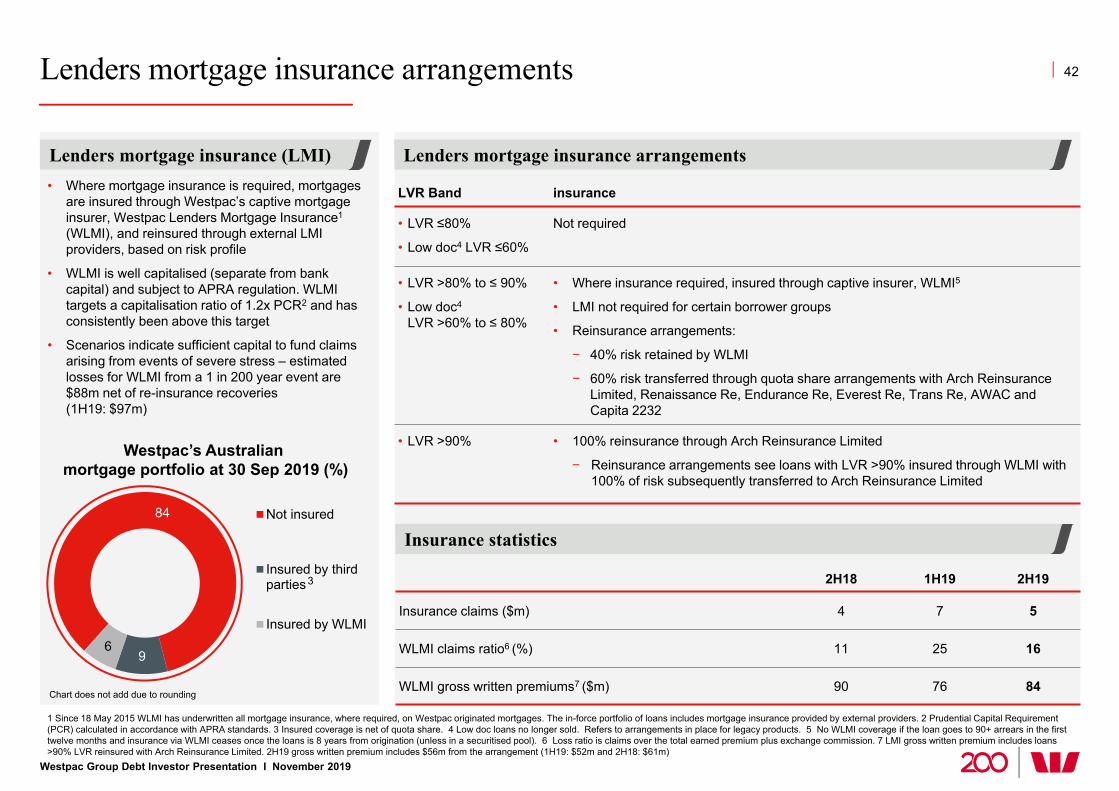
Lenders mortgage insurance arrangementsLenders mortgage insurance (LMI)
42
LVR Band insurance
• LVR ≤80%
• Low doc4 LVR ≤60%
Not required
• LVR >80% to ≤ 90%
• Low doc4
LVR >60% to ≤ 80%
• Where insurance required, insured through captive insurer, WLMI5
• LMI not required for certain borrower groups
• Reinsurance arrangements:
− 40% risk retained by WLMI
− 60% risk transferred through quota share arrangements with Arch Reinsurance Limited, Renaissance Re, Endurance Re, Everest Re, Trans Re, AWAC and Capita 2232
• LVR >90% • 100% reinsurance through Arch Reinsurance Limited
− Reinsurance arrangements see loans with LVR >90% insured through WLMI with 100% of risk subsequently transferred to Arch Reinsurance Limited
2H18 1H19 2H19
Insurance claims ($m) 4 7 5
WLMI claims ratio6 (%) 11 25 16
WLMI gross written premiums7 ($m) 90 76 84
Insurance statistics
• Where mortgage insurance is required, mortgages are insured through Westpac’s captive mortgage insurer, Westpac Lenders Mortgage Insurance1
(WLMI), and reinsured through external LMI providers, based on risk profile
• WLMI is well capitalised (separate from bank capital) and subject to APRA regulation. WLMI targets a capitalisation ratio of 1.2x PCR2 and has consistently been above this target
• Scenarios indicate sufficient capital to fund claims arising from events of severe stress – estimated losses for WLMI from a 1 in 200 year event are $88m net of re-insurance recoveries (1H19: $97m)
84
96
Not insured
Insured by thirdparties
Insured by WLMI
Westpac’s Australianmortgage portfolio at 30 Sep 2019 (%)
3
Chart does not add due to rounding
Mortgage portfolio stress testing outcomes
Westpac Group Debt Investor Presentation I November 2019
1 Assumes 50% of LMI claims will be rejected in a stressed scenario. 2 Represents 1H19 actual losses of $51m annualised. 3 Stressed loss rates are calculated as a percentage of average exposure at default (EAD).
43
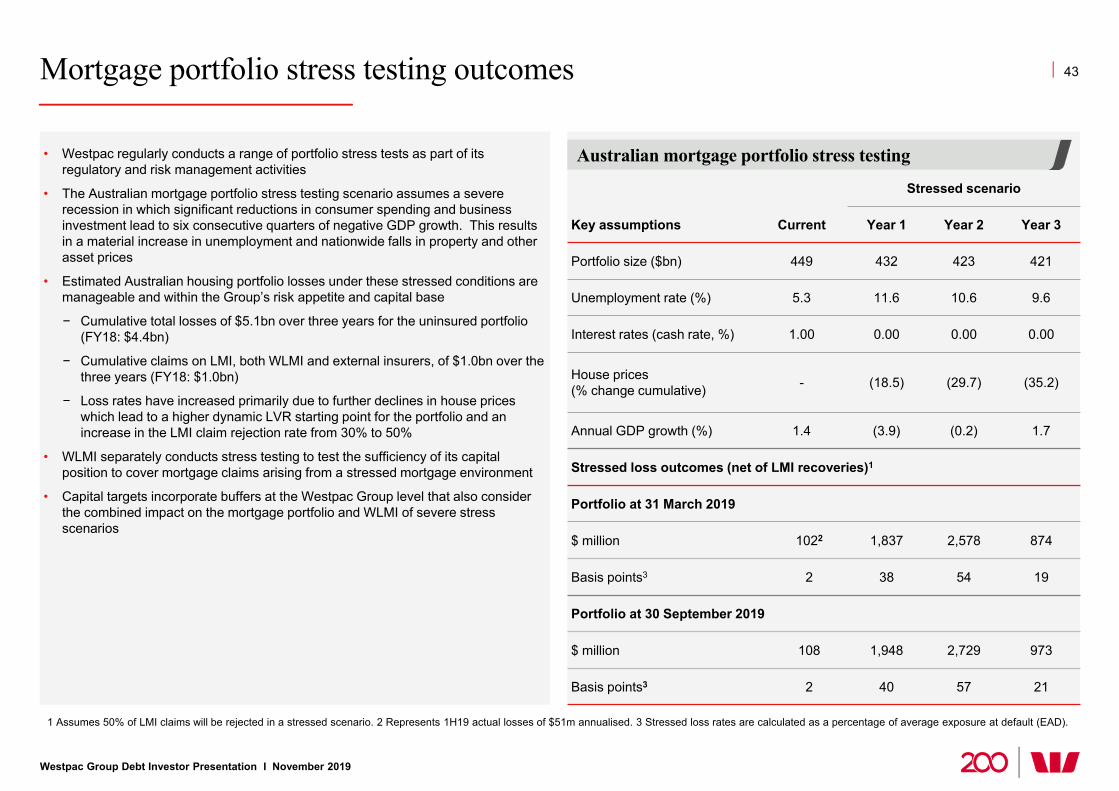
Stressed scenario
Key assumptions Current Year 1 Year 2 Year 3
Portfolio size ($bn) 449 432 423 421
Unemployment rate (%) 5.3 11.6 10.6 9.6
Interest rates (cash rate, %) 1.00 0.00 0.00 0.00
House prices (% change cumulative) - (18.5) (29.7) (35.2)
Annual GDP growth (%) 1.4 (3.9) (0.2) 1.7
Stressed loss outcomes (net of LMI recoveries)1
Portfolio at 31 March 2019
$ million 1022 1,837 2,578 874
Basis points3 2 38 54 19
Portfolio at 30 September 2019
$ million 108 1,948 2,729 973
Basis points3 2 40 57 21
• Westpac regularly conducts a range of portfolio stress tests as part of its regulatory and risk management activities
• The Australian mortgage portfolio stress testing scenario assumes a severe recession in which significant reductions in consumer spending and business investment lead to six consecutive quarters of negative GDP growth. This results in a material increase in unemployment and nationwide falls in property and other asset prices
• Estimated Australian housing portfolio losses under these stressed conditions are manageable and within the Group’s risk appetite and capital base
− Cumulative total losses of $5.1bn over three years for the uninsured portfolio (FY18: $4.4bn)
− Cumulative claims on LMI, both WLMI and external insurers, of $1.0bn over the three years (FY18: $1.0bn)
− Loss rates have increased primarily due to further declines in house prices which lead to a higher dynamic LVR starting point for the portfolio and an increase in the LMI claim rejection rate from 30% to 50%
• WLMI separately conducts stress testing to test the sufficiency of its capital position to cover mortgage claims arising from a stressed mortgage environment
• Capital targets incorporate buffers at the Westpac Group level that also consider the combined impact on the mortgage portfolio and WLMI of severe stress scenarios
Australian mortgage portfolio stress testing

Westpac Group Debt Investor Presentation I November 2019
Funding and liquidity metrics
1 Includes long term wholesale funding with a residual maturity less than or equal to 1 year. 2 Equity excludes FX translation, Available-for-Sale securities and Cash Flow Hedging Reserves. 3 LCR is calculated as the percentage ratio of stock of HQLA and CLF over the total net cash outflows in a modelled 30 day defined stressed scenario. Calculated on a spot basis. HQLA includes HQLA as defined in APS 210, RBNZ eligible liquids, less RBA open repos funding end of day ESA balances with the RBA. Committed Liquidity Facility or CLF is made available to Australian Authorised Deposit-taking Institutions by the RBA that, subject to qualifying conditions, can be accessed to meet LCR requirements under APS210 – Liquidity. Other flows include credit and liquidity facilities, collateral outflows and inflows from customers. 4 Other includes derivatives and other assets. 5 Other loans includes off balance sheet exposures and residential mortgages >35% risk weight.
44
63 63
5
8 8
1
1 1
10
12 12
4
4 520
7 7165 5
Sep-08 Sep-18 Sep-19
Wholesale Onshore <1yr
Wholesale Offshore <1yr
Wholesale Onshore >1yr
Wholesale Offshore >1yr
Securitisation
Equity
Customer deposits
44
Funding composition by residual maturity (%)
Net stable funding ratio (NSFR) at 30 September 2019 ($bn)
Available Stable Funding Required Stable Funding
606.8544.0
Capital
Retail & SME
deposits
Corporate & Institutional
deposits
Wholesale funding and
other liabilities
Residential mortgages ≤35% risk
weight
Other loans5
Liquids and other4
31 March 2019 30 September 2019Customer deposits High Quality Liquid AssetsWholesale funding Committed Liquidity FacilityOther flows
NSFR
31 Mar 2019 113%
30 Sep 2019 112%
2
1
1
Bars may not add to 100 due to rounding
97.0
133.7113.4
143.9
Net cash outflows Liquid assets Net cash outflows Liquid assets
Liquidity coverage ratio (LCR)3 ($bn and %)
LCR 138% LCR 127%

Economics
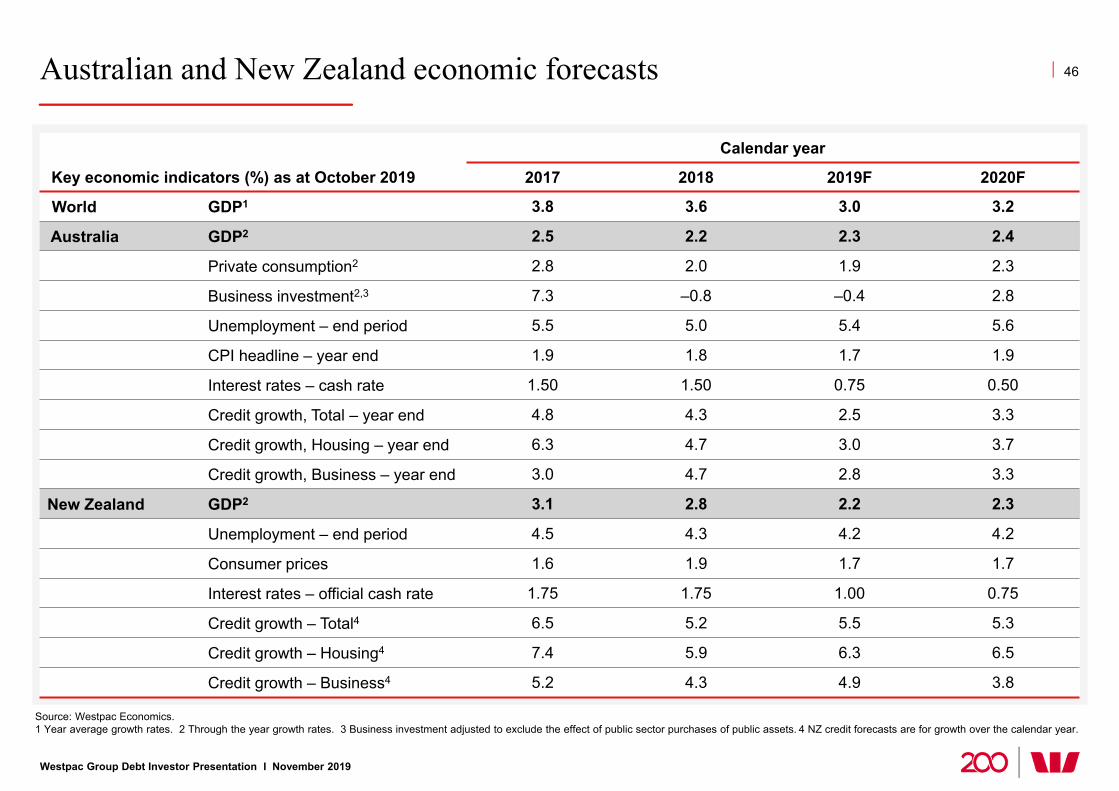
Westpac Group Debt Investor Presentation I November 2019
Australian and New Zealand economic forecasts 46
Calendar year
Key economic indicators (%) as at October 2019 2017 2018 2019F 2020F
World GDP1 3.8 3.6 3.0 3.2
Australia GDP2 2.5 2.2 2.3 2.4
Private consumption2 2.8 2.0 1.9 2.3
Business investment2,3 7.3 –0.8 –0.4 2.8
Unemployment – end period 5.5 5.0 5.4 5.6
CPI headline – year end 1.9 1.8 1.7 1.9
Interest rates – cash rate 1.50 1.50 0.75 0.50
Credit growth, Total – year end 4.8 4.3 2.5 3.3
Credit growth, Housing – year end 6.3 4.7 3.0 3.7
Credit growth, Business – year end 3.0 4.7 2.8 3.3
New Zealand GDP2 3.1 2.8 2.2 2.3
Unemployment – end period 4.5 4.3 4.2 4.2
Consumer prices 1.6 1.9 1.7 1.7
Interest rates – official cash rate 1.75 1.75 1.00 0.75
Credit growth – Total4 6.5 5.2 5.5 5.3
Credit growth – Housing4 7.4 5.9 6.3 6.5
Credit growth – Business4 5.2 4.3 4.9 3.8
Source: Westpac Economics. 1 Year average growth rates. 2 Through the year growth rates. 3 Business investment adjusted to exclude the effect of public sector purchases of public assets. 4 NZ credit forecasts are for growth over the calendar year.
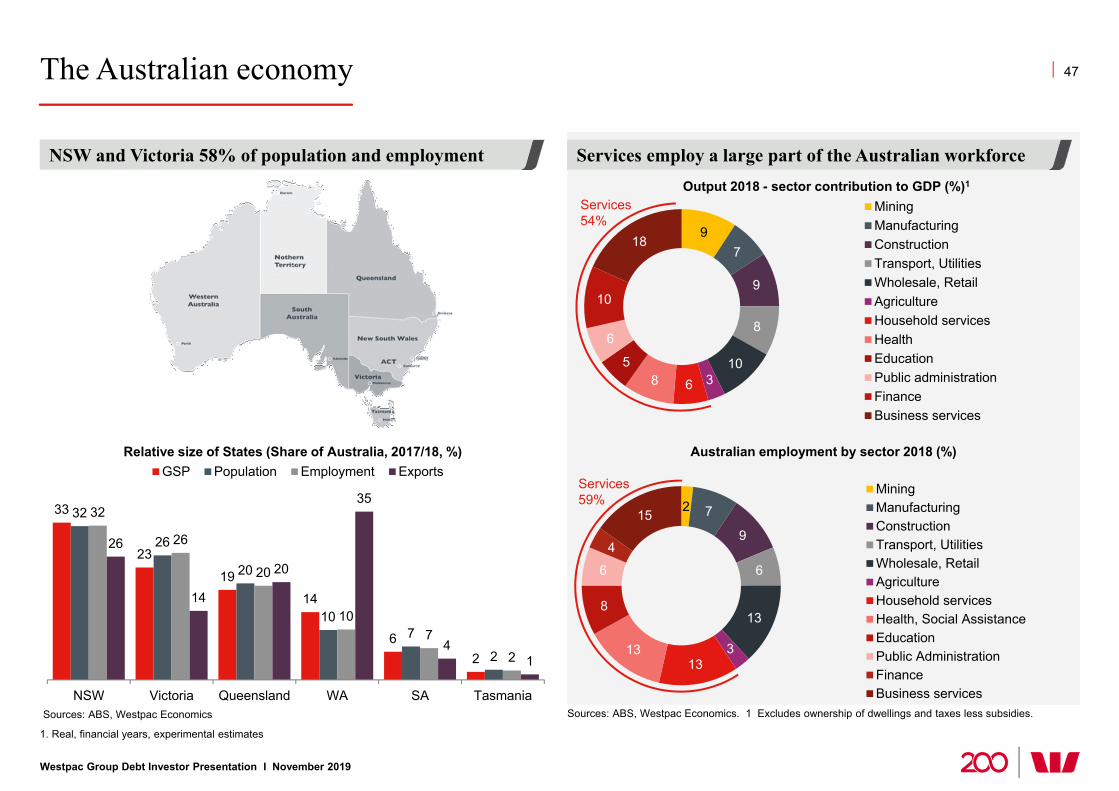
The Australian economy
33
23
19
14
62
32
26
20
107
2
32
26
20
107
2
26
14
20
35
41
NSW Victoria Queensland WA SA Tasmania
GSP Population Employment Exports
1. Real, financial years, experimental estimates
Sources: ABS, Westpac Economics
NSW and Victoria 58% of population and employment
Relative size of States (Share of Australia, 2017/18, %)
Sources: ABS, Westpac Economics. 1 Excludes ownership of dwellings and taxes less subsidies.
97
9
8
10368
5
6
10
18
MiningManufacturingConstructionTransport, UtilitiesWholesale, RetailAgricultureHousehold servicesHealthEducationPublic administrationFinanceBusiness services
Output 2018 - sector contribution to GDP (%)1
Services 54%
2 7
9
6
13
313
13
8
6
4
15
MiningManufacturingConstructionTransport, UtilitiesWholesale, RetailAgricultureHousehold servicesHealth, Social AssistanceEducationPublic AdministrationFinanceBusiness services
Australian employment by sector 2018 (%)
Services 59%
Services employ a large part of the Australian workforce
Westpac Group Debt Investor Presentation I November 2019
47
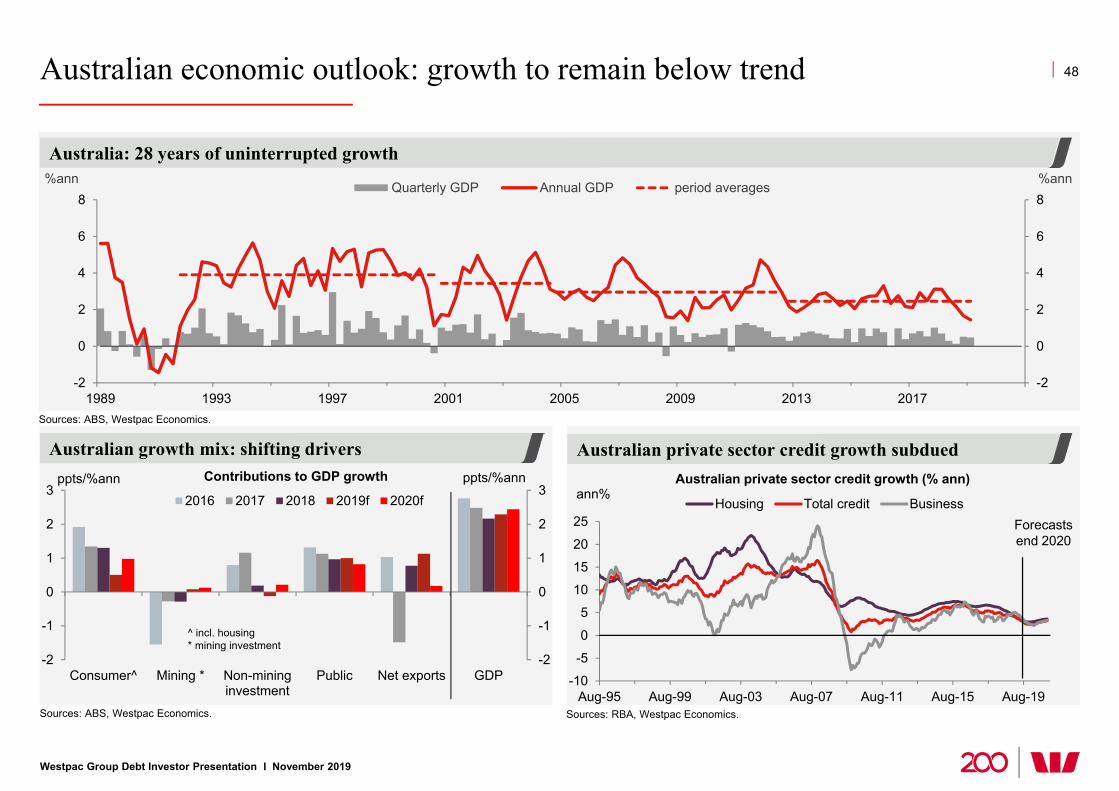
Australian economic outlook: growth to remain below trend
Westpac Group Debt Investor Presentation I November 2019
48
Sources: ABS, Westpac Economics.
-2
-1
0
1
2
3
-2
-1
0
1
2
3
Consumer^ Mining * Non-mininginvestment
Public Net exports GDP
ppts/%annppts/%ann2016 2017 2018 2019f 2020f
Contributions to GDP growth
Australian growth mix: shifting drivers Australian private sector credit growth subdued
Australia: 28 years of uninterrupted growth
^ incl. housing * mining investment
Sources: ABS, Westpac Economics.
-2
0
2
4
6
8
-2
0
2
4
6
8
1989 1993 1997 2001 2005 2009 2013 2017
%ann%annQuarterly GDP Annual GDP period averages
Sources: RBA, Westpac Economics.
ann%Australian private sector credit growth (% ann)
-10
-5
0
5
10
15
20
25
Aug-95 Aug-99 Aug-03 Aug-07 Aug-11 Aug-15 Aug-19
Housing Total credit BusinessForecastsend 2020

Ongoing weakness centred on consumer and housing construction
Westpac Group Debt Investor Presentation I November 2019
49
Australian wage inflation remains low
Sources: ABS, Westpac Economics.
Australian wage inflation (% ann)
0
1
2
3
4
5
6
7
8
Jun-99 Jun-01 Jun-03 Jun-05 Jun-07 Jun-09 Jun-11 Jun-13 Jun-15 Jun-17 Jun-19
%yrAus private sector wages
Mining industry wages
Household savings ratio: poised to rise
Sources: ABS, Westpac Economics
Sources: Melbourne Institute, Westpac Economics.
60
70
80
90
100
110
120
130
140
60
70
80
90
100
110
120
130
140
Oct-99 Oct-04 Oct-09 Oct-14 Oct-19
indexindexWestpac-MI Consumer Sentiment Index'family finances vs 12mths ago'
-3
0
3
6
9
12
-3
0
3
6
9
12
Jun-91 Jun-95 Jun-99 Jun-03 Jun-07 Jun-11 Jun-15 Jun-19
% income% income
F’casts
Consumer sentiment remains weak
Dwelling approvals down from 2016 highs
Sources: ABS, RBA, Westpac Economics.
Dwelling approvals (‘000 month, annualised)
80
120
160
200
240
80
120
160
200
240
Aug-99 Aug-03 Aug-07 Aug-11 Aug-15 Aug-19
Trend SAPrivate approvals
RBA easing cycles

Some offset from infrastructure, Government spending and population growth
Westpac Group Debt Investor Presentation I November 2019
Household incomes: one off policy supportInfrastructure pipeline ($bn, rolling annual)
Exports
50
Sources: ABS, Westpac Economics
0
20
40
60
80
100
120
140
160
0
20
40
60
80
100
120
140
160
Jun-99 Jun-03 Jun-07 Jun-11 Jun-15 Jun-19
$bn$bn
Work doneCommencementsWork Pipeline
Sources: ABS, Westpac Economics
810121416182022242628
Aug-12 Aug-14 Aug-16 Aug-18
Resources
Non-resources
$bn/mth
0
10
20
30
40
50
60
Mar-98 Mar-08 Mar-18
Resources (54%)
Non resources(46%)
$bn/qtrExport volumes Export earnings
Population growthPopulation growth 2008-2018 average (% ann)
1.601.42
1.281.16
1.090.72
0.720.49
0.24
0.0 0.5 1.0 1.5 2.0
AustraliaNZ
DevelopingWorld
CanadaUSUK
DevelopedEU
Source: IMF, Westpac Economics
Sources: ABS, Westpac Economics.
0123456789
0123456789
Jun-11 Jun-13 Jun-15 Jun-17 Jun-19
%ann%ann household disposable incomewithout tax cutswithout tax cuts or interest rate cuts
F’casts
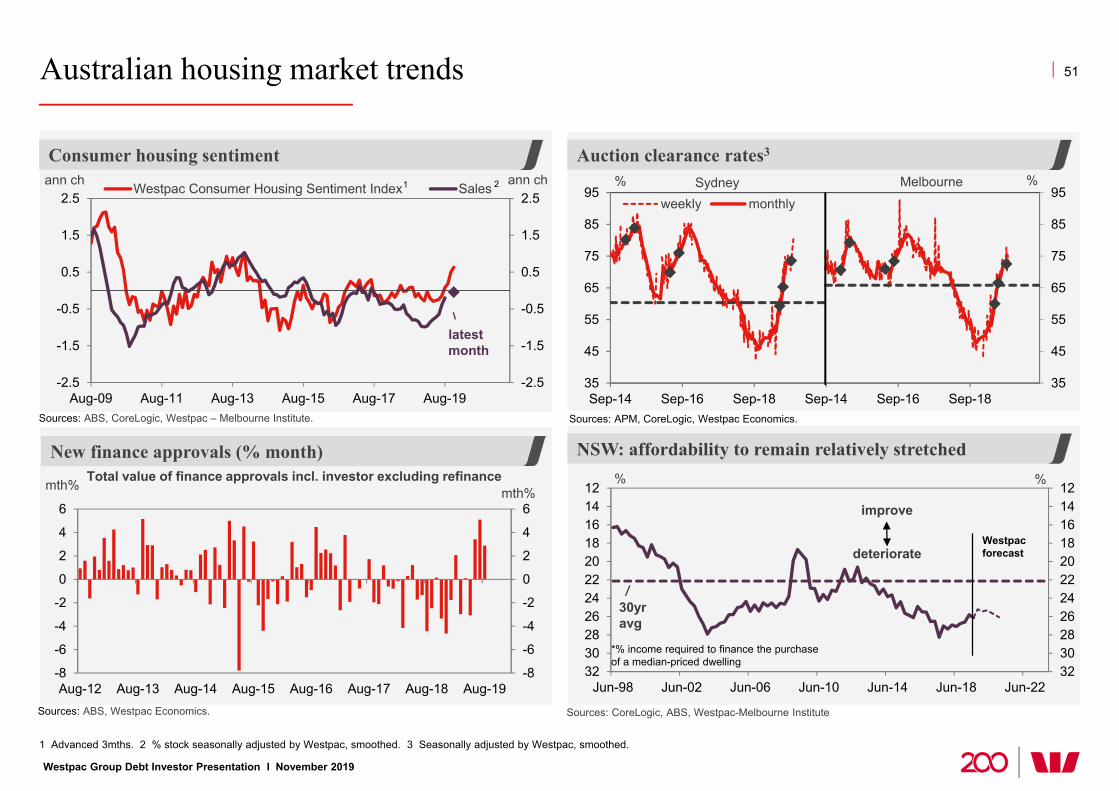
Australian housing market trends
Westpac Group Debt Investor Presentation I November 2019
51
Consumer housing sentiment
Sources: ABS, CoreLogic, Westpac – Melbourne Institute.
Auction clearance rates3
1 Advanced 3mths. 2 % stock seasonally adjusted by Westpac, smoothed. 3 Seasonally adjusted by Westpac, smoothed.
-2.5
-1.5
-0.5
0.5
1.5
2.5
-2.5
-1.5
-0.5
0.5
1.5
2.5
Aug-09 Aug-11 Aug-13 Aug-15 Aug-17 Aug-19
ann chann ch Westpac Consumer Housing Sentiment Index Sales
latest month
Sources: APM, CoreLogic, Westpac Economics.
35
45
55
65
75
85
95
35
45
55
65
75
85
95
Sep-14 Sep-16 Sep-18 Sep-14 Sep-16 Sep-18
%%
weekly monthlySydney Melbourne
New finance approvals (% month)
Sources: ABS, Westpac Economics.
-8
-6
-4
-2
0
2
4
6
-8
-6
-4
-2
0
2
4
6
Aug-12 Aug-13 Aug-14 Aug-15 Aug-16 Aug-17 Aug-18 Aug-19
mth%mth% Total value of finance approvals incl. investor excluding refinance
1 2
NSW: affordability to remain relatively stretched
1214161820222426283032
1214161820222426283032
Jun-98 Jun-02 Jun-06 Jun-10 Jun-14 Jun-18 Jun-22
%%
Sources: CoreLogic, ABS, Westpac-Melbourne Institute
*% income required to finance the purchaseof a median-priced dwelling
30yr avg
deteriorate
improve
Westpac forecast
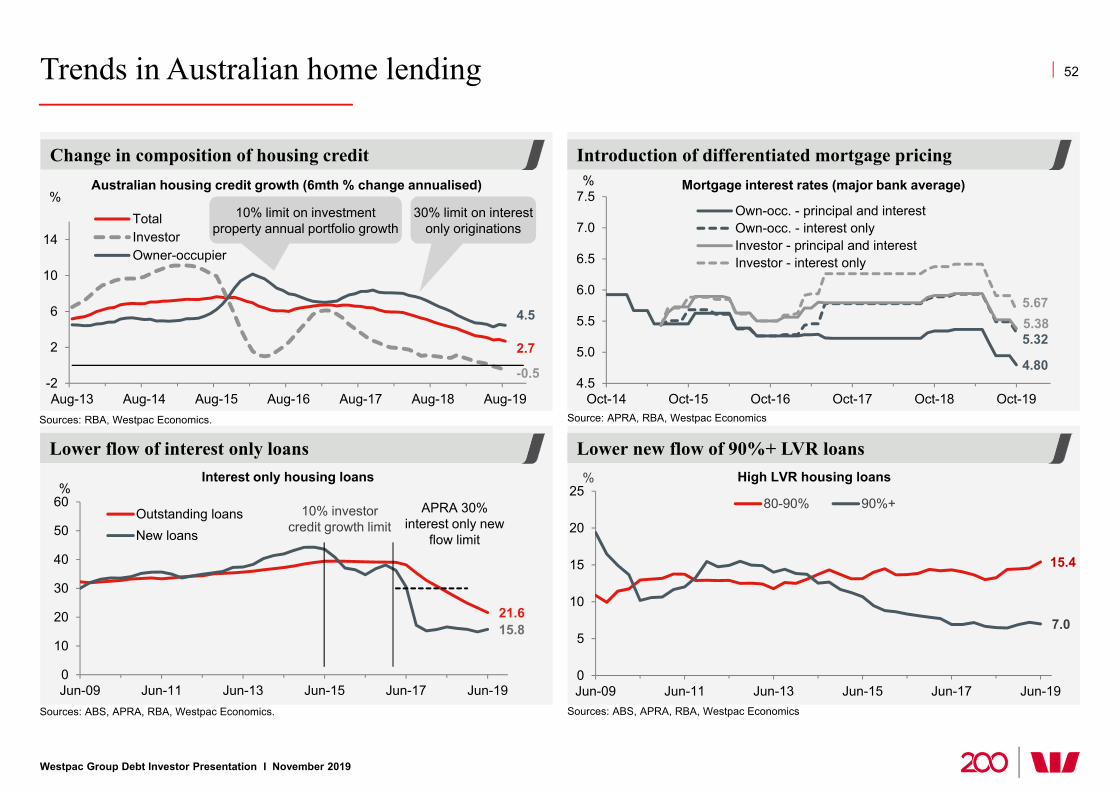
Trends in Australian home lending
Westpac Group Debt Investor Presentation I November 2019
Lower new flow of 90%+ LVR loans
Change in composition of housing credit
Lower flow of interest only loans
52
Sources: RBA, Westpac Economics.
Sources: ABS, APRA, RBA, Westpac Economics. Sources: ABS, APRA, RBA, Westpac Economics
Source: APRA, RBA, Westpac Economics
High LVR housing loans
4.80
5.325.385.67
4.5
5.0
5.5
6.0
6.5
7.0
7.5
Oct-14 Oct-15 Oct-16 Oct-17 Oct-18 Oct-19
%
Own-occ. - principal and interestOwn-occ. - interest onlyInvestor - principal and interestInvestor - interest only
Mortgage interest rates (major bank average)
21.615.8
0
10
20
30
40
50
60
Jun-09 Jun-11 Jun-13 Jun-15 Jun-17 Jun-19
%
Outstanding loansNew loans
10% investor credit growth limit
APRA 30% interest only new
flow limit
15.4
7.0
0
5
10
15
20
25
Jun-09 Jun-11 Jun-13 Jun-15 Jun-17 Jun-19
%
80-90% 90%+
Interest only housing loans
Introduction of differentiated mortgage pricing
2.7
-0.5
4.5
-2
2
6
10
14
Aug-13 Aug-14 Aug-15 Aug-16 Aug-17 Aug-18 Aug-19
TotalInvestorOwner-occupier
Australian housing credit growth (6mth % change annualised)%
10% limit on investment property annual portfolio growth
30% limit on interest only originations

Australian household balance sheets
Westpac Group Debt Investor Presentation I November 2019
Higher income households have increased borrowings
Australian household net wealth
53
Australian household debt to income ratio
Sources: ABS, RBA, Westpac Economics.
Sources: ABS, RBA, Westpac Economics.
0
200
400
600
800
1000
1200
1400
Jun-84 Jun-89 Jun-94 Jun-99 Jun-04 Jun-09 Jun-14 Jun-190
200
400
600
800
1000
1200% %Total assets
Total liabilitiesTotal net worth
% Annual household disposable income
Australian household debt-to-income ratios by income quintile (%)
0
50
100
150
200
250
1st 2nd 3rd 4th 5th
2002 2006 2010 2014
%
Sources: ABS, RBA, Westpac Economics
Australian households debt to income ratio (%)
-40-20
020406080
100120140160180200
Jun-89 Jun-94 Jun-99 Jun-04 Jun-09 Jun-14 Jun-19
Total (gross) debtTotal debt net of offset accountsTotal debt net of all depositsTrend since Jun-07
Forecastsend 2020
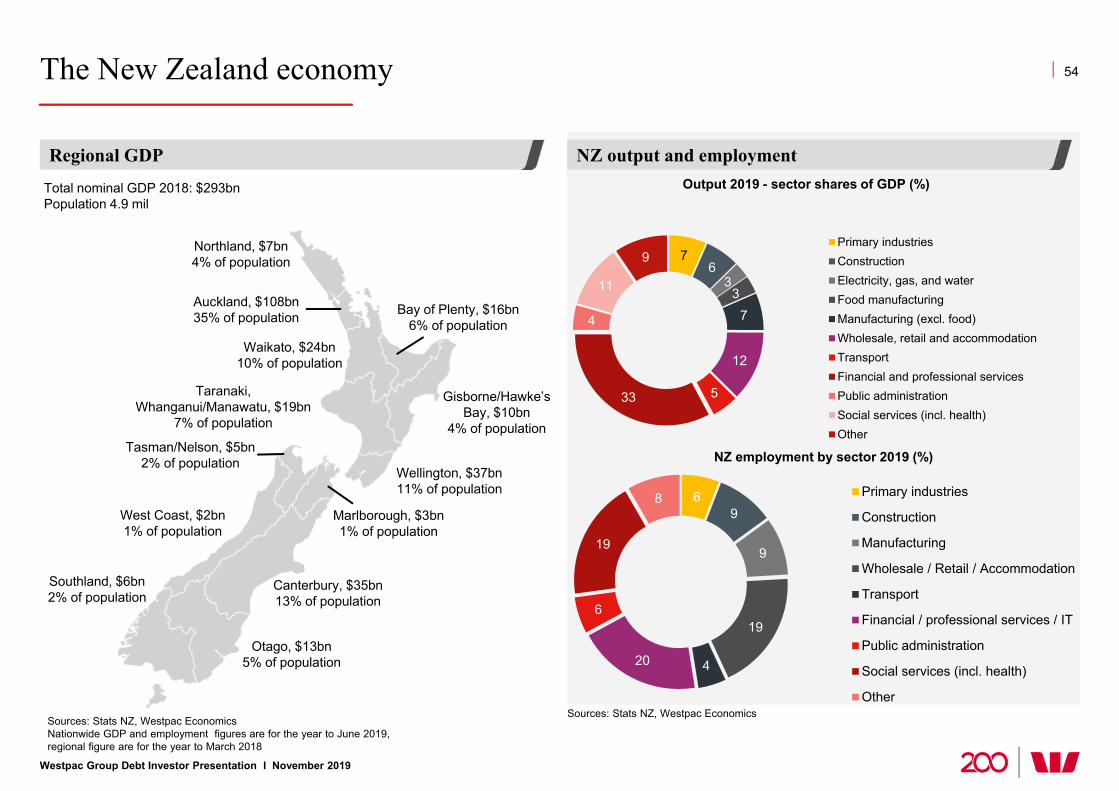
The New Zealand economy
Sources: Stats NZ, Westpac EconomicsNationwide GDP and employment figures are for the year to June 2019, regional figure are for the year to March 2018
Regional GDP
Sources: Stats NZ, Westpac Economics
Output 2019 - sector shares of GDP (%)
NZ employment by sector 2019 (%)
NZ output and employment
Northland, $7bn4% of population
Auckland, $108bn35% of population
Waikato, $24bn10% of population
Taranaki, Whanganui/Manawatu, $19bn
7% of population
Wellington, $37bn11% of population
Bay of Plenty, $16bn6% of population
Gisborne/Hawke’s Bay, $10bn
4% of population
Southland, $6bn2% of population
Otago, $13bn5% of population
Canterbury, $35bn13% of population
West Coast, $2bn1% of population
Tasman/Nelson, $5bn2% of population
Marlborough, $3bn1% of population
Total nominal GDP 2018: $293bnPopulation 4.9 mil
76
33
7
12
533
4
11
9Primary industriesConstructionElectricity, gas, and waterFood manufacturingManufacturing (excl. food)Wholesale, retail and accommodationTransportFinancial and professional servicesPublic administrationSocial services (incl. health)Other
69
9
19
420
6
19
8 Primary industries
Construction
Manufacturing
Wholesale / Retail / Accommodation
Transport
Financial / professional services / IT
Public administration
Social services (incl. health)
Other
Westpac Group Debt Investor Presentation I November 2019
54
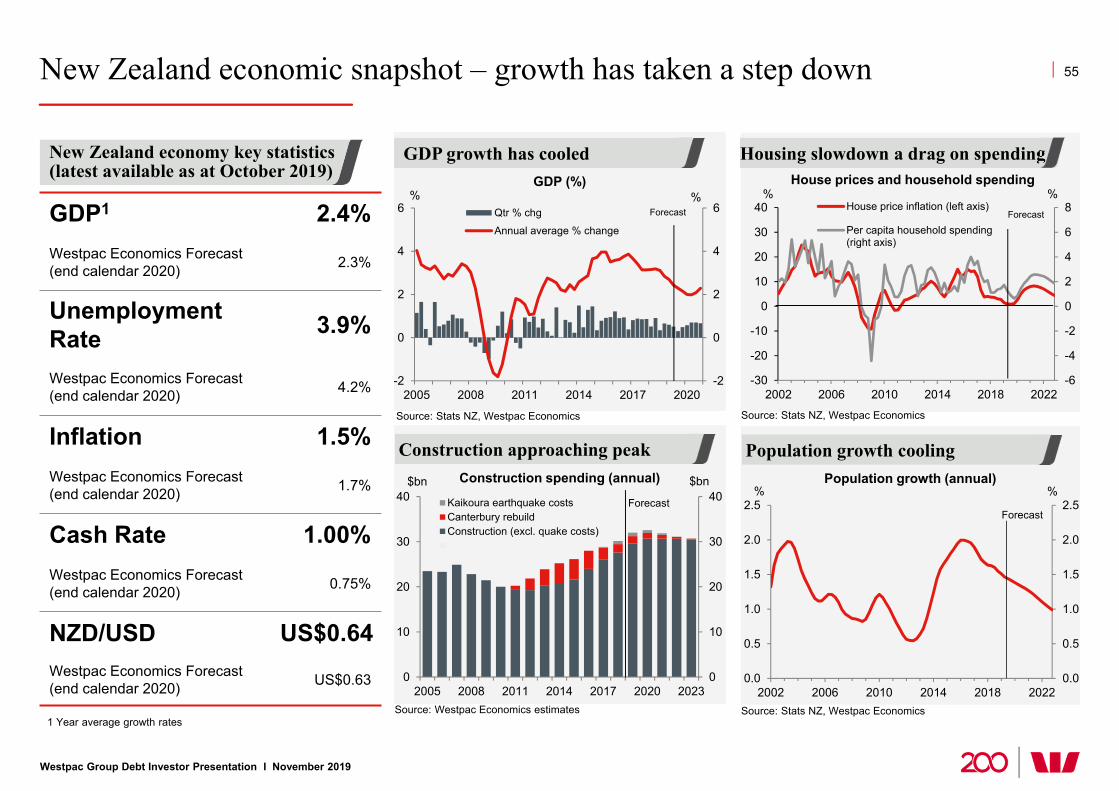
New Zealand economic snapshot – growth has taken a step down
New Zealand economy key statistics (latest available as at October 2019)
GDP1 2.4%Westpac Economics Forecast (end calendar 2020) 2.3%
Unemployment Rate 3.9%
Westpac Economics Forecast (end calendar 2020) 4.2%
Inflation 1.5%Westpac Economics Forecast (end calendar 2020) 1.7%
Cash Rate 1.00%Westpac Economics Forecast (end calendar 2020) 0.75%
NZD/USD US$0.64Westpac Economics Forecast (end calendar 2020) US$0.63 0
10
20
30
40
0
10
20
30
40
2005 2008 2011 2014 2017 2020 2023
$bn$bn
Kaikoura earthquake costsCanterbury rebuildConstruction (excl. quake costs)
Construction spending (annual)
Source: Westpac Economics estimates Source: Stats NZ, Westpac Economics
Population growth (annual)
0.0
0.5
1.0
1.5
2.0
2.5
0.0
0.5
1.0
1.5
2.0
2.5
2002 2006 2010 2014 2018 2022
%%
Population growth coolingConstruction approaching peak
ForecastForecast
GDP growth has cooled
-2
0
2
4
6
-2
0
2
4
6
2005 2008 2011 2014 2017 2020
Qtr % chg
Annual average % change
Forecast
GDP (%)% %
Housing slowdown a drag on spending
-6
-4
-2
0
2
4
6
8
-30
-20
-10
0
10
20
30
40
2002 2006 2010 2014 2018 2022
House price inflation (left axis)
Per capita household spending(right axis)
% %Forecast
Source: Stats NZ, Westpac Economics Source: Stats NZ, Westpac Economics
House prices and household spending
1 Year average growth rates
Westpac Group Debt Investor Presentation I November 2019
55
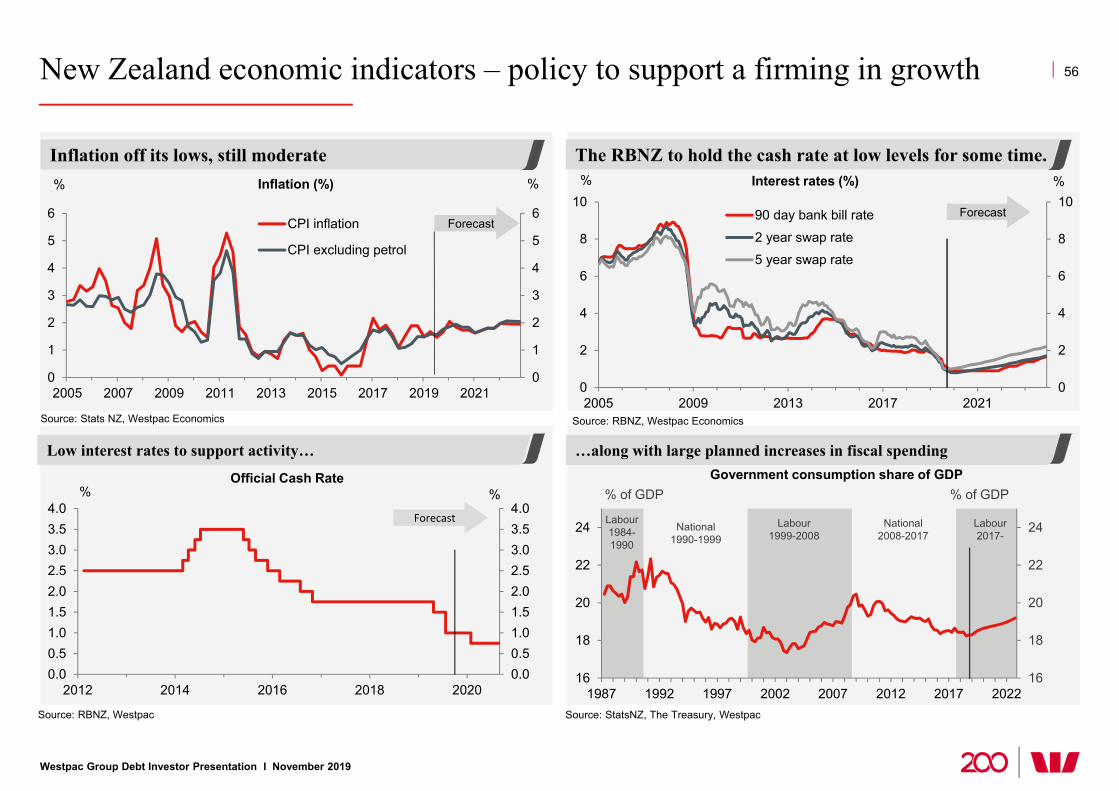
New Zealand economic indicators – policy to support a firming in growth
Westpac Group Debt Investor Presentation I November 2019
56
The RBNZ to hold the cash rate at low levels for some time.Inflation off its lows, still moderate
0
1
2
3
4
5
6
0
1
2
3
4
5
6
2005 2007 2009 2011 2013 2015 2017 2019 2021
%%
CPI inflation
CPI excluding petrol
0
2
4
6
8
10
0
2
4
6
8
10
2005 2009 2013 2017 2021
%%
90 day bank bill rate
2 year swap rate
5 year swap rate
Inflation (%)
Source: Stats NZ, Westpac Economics Source: RBNZ, Westpac Economics
ForecastForecast
Interest rates (%)
…along with large planned increases in fiscal spendingLow interest rates to support activity…Government consumption share of GDP
Source: RBNZ, Westpac Source: StatsNZ, The Treasury, Westpac
16
18
20
22
24
16
18
20
22
24
1987 1992 1997 2002 2007 2012 2017 2022
% of GDP % of GDP
National1990-1999
National2008-2017
Labour2017-
Labour1999-2008
Labour1984-1990
Official Cash Rate
0.00.51.01.52.02.53.03.54.0
0.00.51.01.52.02.53.03.54.0
2012 2014 2016 2018 2020
% %
Forecast

0.00.51.01.52.02.53.03.54.04.5
0
1
2
3
4
5
6
7
2005 2007 2009 2011 2013 2015 2017 2019
%yr%
Unemployment rate (left axis)
Labour Cost Index (right axis)
New Zealand economic indicators
Westpac Group Debt Investor Presentation I November 2019
57
Labour market has tightened Export prices remain favourable
050100150200250300350400450
050
100150200250300350400450
2006 2008 2010 2012 2014 2016 2018
Dairy Forestry Meat,skins & wool
Index Index
Source: ANZ, Westpac Economics
NZ export commodity price index (world prices)Unemployment rate and wage growth (%)
Source: Stats NZ, Westpac Economics
Labour market has tightened Export prices still firm
-15
-10
-5
0
5
10
15
20
-15
-10
-5
0
5
10
15
20
2008 2010 2012 2014 2016 2018 2020
Forecast
New Zealand house prices by region (index)
…but low mortgage rates starting to drive a pick upEarlier policy changes dampened housing demand…
Source: REINZ Sources: QVNZ, Westpac Economics
New Zealand house prices (nationwide, %)
80
100
120
140
160
180
200
220
80
100
120
140
160
180
200
220
Jan-08 Jan-10 Jan-12 Jan-14 Jan-16 Jan-18
NZ ex Auckland andCanterburyAuckland
Canterbury
Inde
x =
100
in 2
008
Index = 100 in 2008

Appendices
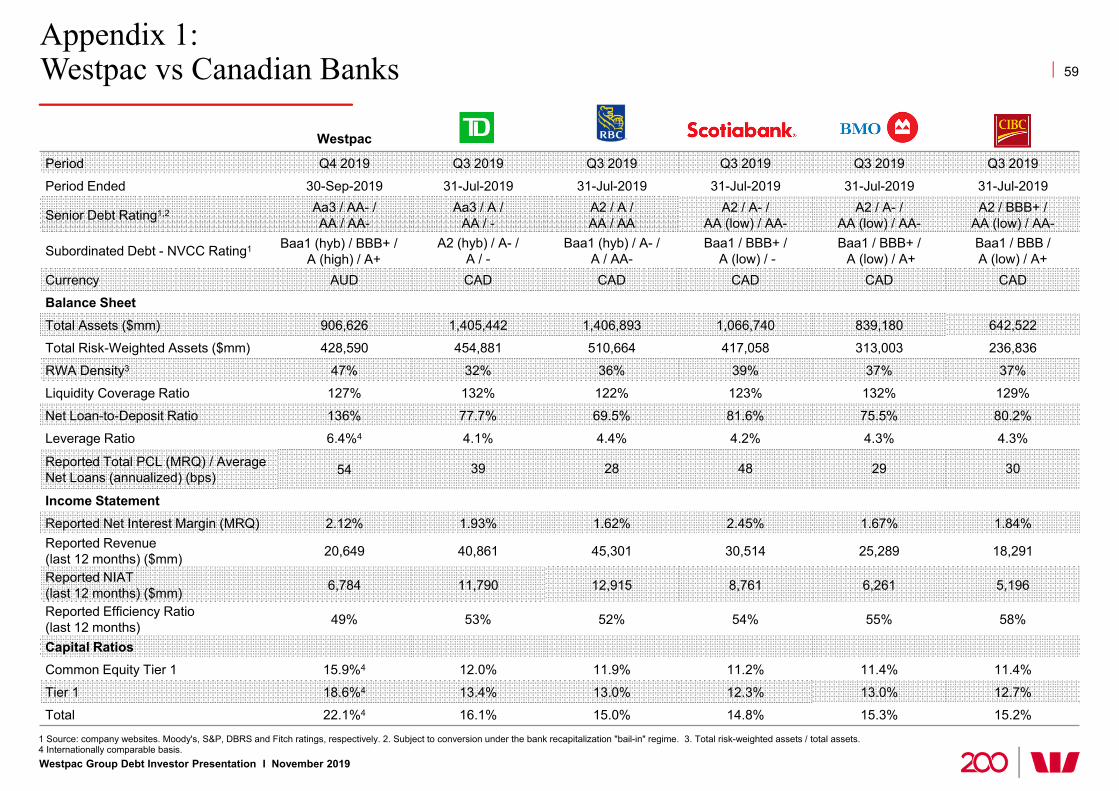
Appendix 1:Westpac vs Canadian Banks
Westpac
Period Q4 2019 Q3 2019 Q3 2019 Q3 2019 Q3 2019 Q3 2019
Period Ended 30-Sep-2019 31-Jul-2019 31-Jul-2019 31-Jul-2019 31-Jul-2019 31-Jul-2019
Senior Debt Rating1,2 Aa3 / AA- /AA / AA-
Aa3 / A /AA / -
A2 / A /AA / AA
A2 / A- /AA (low) / AA-
A2 / A- /AA (low) / AA-
A2 / BBB+ /AA (low) / AA-
Subordinated Debt - NVCC Rating1 Baa1 (hyb) / BBB+ / A (high) / A+
A2 (hyb) / A- / A / -
Baa1 (hyb) / A- / A / AA-
Baa1 / BBB+ /A (low) / -
Baa1 / BBB+ /A (low) / A+
Baa1 / BBB / A (low) / A+
Currency AUD CAD CAD CAD CAD CAD
Balance SheetTotal Assets ($mm) 906,626 1,405,442 1,406,893 1,066,740 839,180 642,522
Total Risk-Weighted Assets ($mm) 428,590 454,881 510,664 417,058 313,003 236,836
RWA Density3 47% 32% 36% 39% 37% 37%
Liquidity Coverage Ratio 127% 132% 122% 123% 132% 129%
Net Loan-to-Deposit Ratio 136% 77.7% 69.5% 81.6% 75.5% 80.2%
Leverage Ratio 6.4%4 4.1% 4.4% 4.2% 4.3% 4.3%
Reported Total PCL (MRQ) / Average Net Loans (annualized) (bps) 54 39 28 48 29 30
Income StatementReported Net Interest Margin (MRQ) 2.12% 1.93% 1.62% 2.45% 1.67% 1.84%Reported Revenue (last 12 months) ($mm) 20,649 40,861 45,301 30,514 25,289 18,291
Reported NIAT (last 12 months) ($mm) 6,784 11,790 12,915 8,761 6,261 5,196
Reported Efficiency Ratio (last 12 months) 49% 53% 52% 54% 55% 58%
Capital RatiosCommon Equity Tier 1 15.9%4 12.0% 11.9% 11.2% 11.4% 11.4%
Tier 1 18.6%4 13.4% 13.0% 12.3% 13.0% 12.7%
Total 22.1%4 16.1% 15.0% 14.8% 15.3% 15.2%
1 Source: company websites. Moody's, S&P, DBRS and Fitch ratings, respectively. 2. Subject to conversion under the bank recapitalization "bail-in" regime. 3. Total risk-weighted assets / total assets. 4 Internationally comparable basis.Westpac Group Debt Investor Presentation I November 2019
59

Appendix 2:Internationally comparable capital ratio reconciliation
1 Methodology aligns with the APRA study titled “International capital comparison study", dated 13 July 2015.
Westpac Group Debt Investor Presentation I November 2019
60
(%)
Westpac’s CET1 capital ratio (APRA basis) 10.7
Equity investments Balances below prescribed threshold are risk weighted, compared to a 100% CET1 deduction under APRA’s requirements 0.4
Deferred tax assets Balances below prescribed threshold are risk weighted, compared to a 100% CET1 deduction under APRA’s requirements 0.5
Interest rate risk in the banking book (IRRBB) APRA requires capital to be held for IRRBB. The BCBS does not have a Pillar 1 capital requirement for IRRBB 0.0
Residential mortgages Loss given default (LGD) of 15%, compared to the 20% LGD floor under APRA’s requirements. APRA also applies a correlation factor for mortgages higher than the 15% factor prescribed in the Basel rules 1.9
Unsecured non-retail exposures LGD of 45%, compared to the 60% or higher LGD under APRA’s requirements 0.7
Non-retail undrawn commitments Credit conversion factor of 75%, compared to 100% under APRA’s requirements 0.5
Specialised lendingUse of internal-ratings based (IRB) probabilities of default (PD) and LGDs for income producing real estate and project finance exposures, reduced by application of a scaling factor of 1.06. APRA applies higher risk weights under a supervisory slotting approach, but does not require the application of the scaling factors
0.7
Currency conversion threshold Increase in the A$ equivalent concessional threshold level for small business retail and small to medium enterprise corporate exposures 0.2
Capitalised expenses APRA requires these items to be deducted from CET1. The BCBS only requires exposures classified as intangible assets under relevant accounting standards to be deducted from CET1 0.3
Internationally comparable CET1 capital ratio 15.9
Internationally comparable Tier 1 capital ratio 18.6
Internationally comparable total regulatory capital ratio 22.1
APRA’s Basel III capital requirements are more conservative than those of the Basel Committee on Banking Supervision (BCBS), leading to lower reported capital ratios by Australian banks. In July 2015, APRA published a study that compared the major banks’ capital ratios against a set of international peers1.
The following details the adjustments from this study and how Westpac’s APRA Basel III CET1 capital ratio aligns to an internationally comparable ratio

Appendix 3:Internationally comparable CET1 and leverage ratios
Westpac Group Debt Investor Presentation I November 2019
61
1. Peer group comprises listed commercial banks with assets in excess of A$700bn and which have disclosed fully implemented Basel III ratios or provided sufficient disclosure to estimate. Based on company reports/ presentations. Ratios at 30 June 2019, except for NAB which is at 31 March 2019, ANZ and Westpac which are at 30 September 2019, and Bank of Montreal, Scotiabank, Royal Bank of Canada and Toronto Dominion are at 31 July 2019. Assumes Basel III capital reforms fully implemented. Leverage ratio is on a transitional basis. Where accrued expected dividends have been deducted and disclosed, these have been added back for comparability. US banks are excluded from leverage ratio analysis due to business model differences, for example from loans sold to US Government sponsored enterprises. NAB has not disclosed an internationally comparable leverage ratio since September 2017.
Common equity Tier 1 ratio (%)1
Leverage ratio (%)1
Nor
inch
ukin
Ban
k
Dan
ske
Bank
RB
S
AN
Z
CB
A
Sum
itom
o M
itsui
Wes
tpac
15.
9%
Rab
oban
k
Nor
dea
BP
CE
ING
Gro
up
Lloy
ds
NA
B
HS
BC
Chi
na C
onst
ruct
ion
Ban
k
Bar
clay
s
Stan
dard
Cha
rtere
d
Inte
sa S
anpa
olo
Deu
tsch
e Ba
nk
Com
mer
zban
k
ICB
C
Mits
ubis
hi U
FJ
Cre
dit S
uiss
e
Miz
uho
FG
Soci
ete
Gen
eral
e
JPM
orga
n C
hase
BNP
Parib
as
Citi
grou
p
Uni
cred
it
Toro
nto
Dom
inio
n B
ank
Wel
ls F
argo
Roy
al B
ank
of C
anad
a
Cre
dit A
gric
ole
SA
BB
VA
Ban
k of
Am
eric
a
Sant
ande
r
Nat
ixis
Chi
na M
erch
ants
Ban
k
Ban
k of
Mon
treal
0%
5%
10%
15%
20%
Chi
na C
onst
ruct
ion
Ban
k
ICB
C
Ban
k of
Chi
na
BB
VA
Agr
icul
tura
l Ban
k of
Chi
na
Bank
of C
omm
unic
atio
ns
CB
A
Chi
na M
erch
ants
Ban
k
Wes
tpac
6.4
%
AN
Z
Inte
sa S
anpa
olo
Rab
oban
k
Nor
inch
ukin
Ban
k
RB
S
HS
BC
Cre
dit S
uiss
e
Stan
dard
Cha
rtere
d
Nor
dea
Uni
cred
it
BP
CE
Sant
ande
r
Lloy
ds
Mits
ubis
hi U
FJ
Sum
itom
o M
itsui
Bar
clay
s
Com
mer
zban
k
Dan
ske
Bank
ING
Gro
up
Cre
dit A
gric
ole
SA
Soci
ete
Gen
eral
e
Roy
al B
ank
of C
anad
a
Ban
k of
Mon
treal
Miz
uho
FG
Scot
iaba
nk
BNP
Parib
as
Deu
tsch
e Ba
nk
0%
2%
4%
6%
8%

Appendix 4:Expected timetable on various regulatory changes1
1 Regulatory change timeline based on APRA’s paper “Revisions to the capital framework for authorised deposit-taking institutions” (published 12 June 2019).
62
Westpac Group Debt Investor Presentation I November 2019
2022First half 2020 2021Second half
2020Second half
2019
Standardised approach to credit risk Consult, additional quantitative impact study Finalise Implementation
Advanced approach to credit risk Consult, additional quantitative impact study Finalise Implementation
Operational risk Consult and finalise Implementation
Leverage ratio Finalise Implementation
Measurement of capital Consult Finalise Implementation
Capital floor Consult Finalise Implementation
Interest-rate risk in the banking book Consult Finalise Implementation
Level 1 equity exposures Consult and finalise Implementation
RBNZ capital framework Finalise Implementation date and transition under consultation
Related party exposures Finalise Implementation
Loss absorbing capacity1st phase announced
+3ppts of RWA as Tier 2
Further consultation on 2nd phase 2024 Implementation
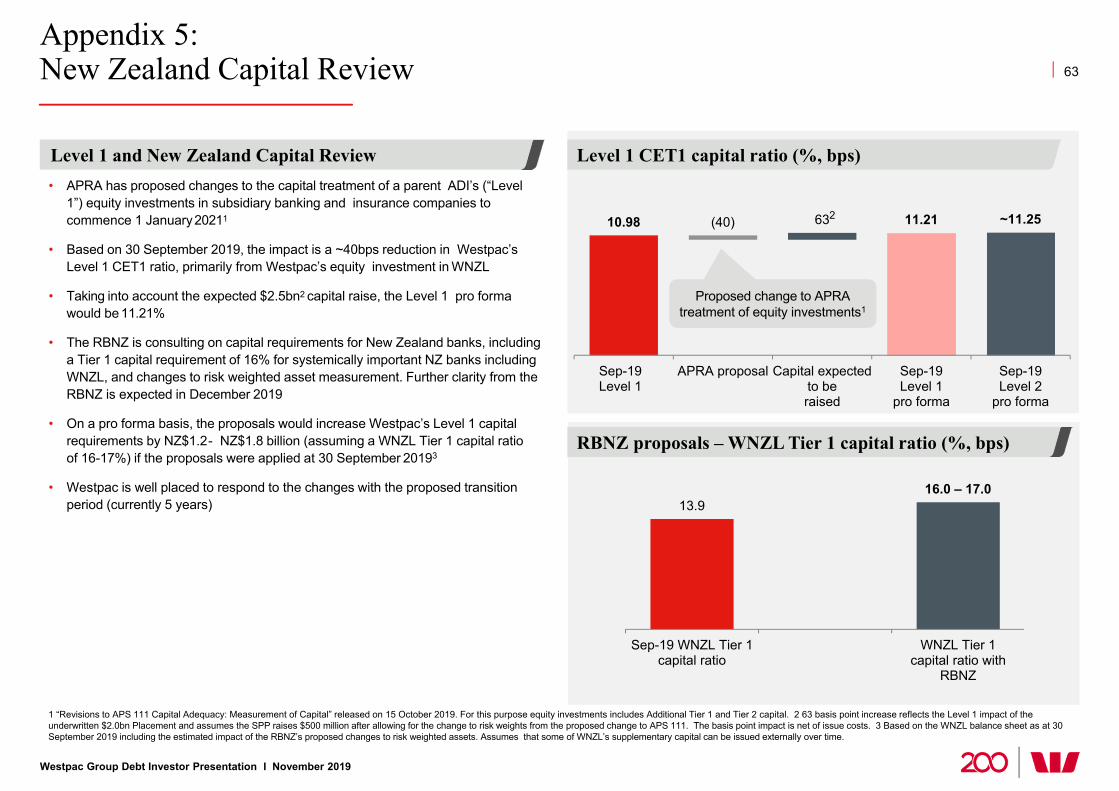
Appendix 5:New Zealand Capital Review
Westpac Group Debt Investor Presentation I November 2019
Level 1 CET1 capital ratio (%, bps)
63
Level 1 and New Zealand Capital Review
RBNZ proposals – WNZL Tier 1 capital ratio (%, bps)
10.98 63 11.21 ~11.25(40)
Sep-19Level 1
APRA proposal Capital expectedto beraised
Sep-19Level 1
pro forma
Sep-19Level 2
pro forma
2
Proposed change to APRA treatment of equity investments1
13.916.0 – 17.0
Sep-19 WNZL Tier 1capital ratio
WNZL Tier 1capital ratio with
RBNZ
• APRA has proposed changes to the capital treatment of a parent ADI’s (“Level 1”) equity investments in subsidiary banking and insurance companies to commence 1 January20211
• Based on 30 September 2019, the impact is a ~40bps reduction in Westpac’s Level 1 CET1 ratio, primarily from Westpac’s equity investment in WNZL
• Taking into account the expected $2.5bn2 capital raise, the Level 1 pro forma would be 11.21%
• The RBNZ is consulting on capital requirements for New Zealand banks, including a Tier 1 capital requirement of 16% for systemically important NZ banks including WNZL, and changes to risk weighted asset measurement. Further clarity from the RBNZ is expected in December 2019
• On a pro forma basis, the proposals would increase Westpac’s Level 1 capital requirements by NZ$1.2- NZ$1.8 billion (assuming a WNZL Tier 1 capital ratio of 16-17%) if the proposals were applied at 30 September 20193
• Westpac is well placed to respond to the changes with the proposed transition period (currently 5 years)
1 “Revisions to APS 111 Capital Adequacy: Measurement of Capital” released on 15 October 2019. For this purpose equity investments includes Additional Tier 1 and Tier 2 capital. 2 63 basis point increase reflects the Level 1 impact of the underwritten $2.0bn Placement and assumes the SPP raises $500 million after allowing for the change to risk weights from the proposed change to APS 111. The basis point impact is net of issue costs. 3 Based on the WNZL balance sheet as at 30 September 2019 including the estimated impact of the RBNZ’s proposed changes to risk weighted assets. Assumes that some of WNZL’s supplementary capital can be issued externally over time.
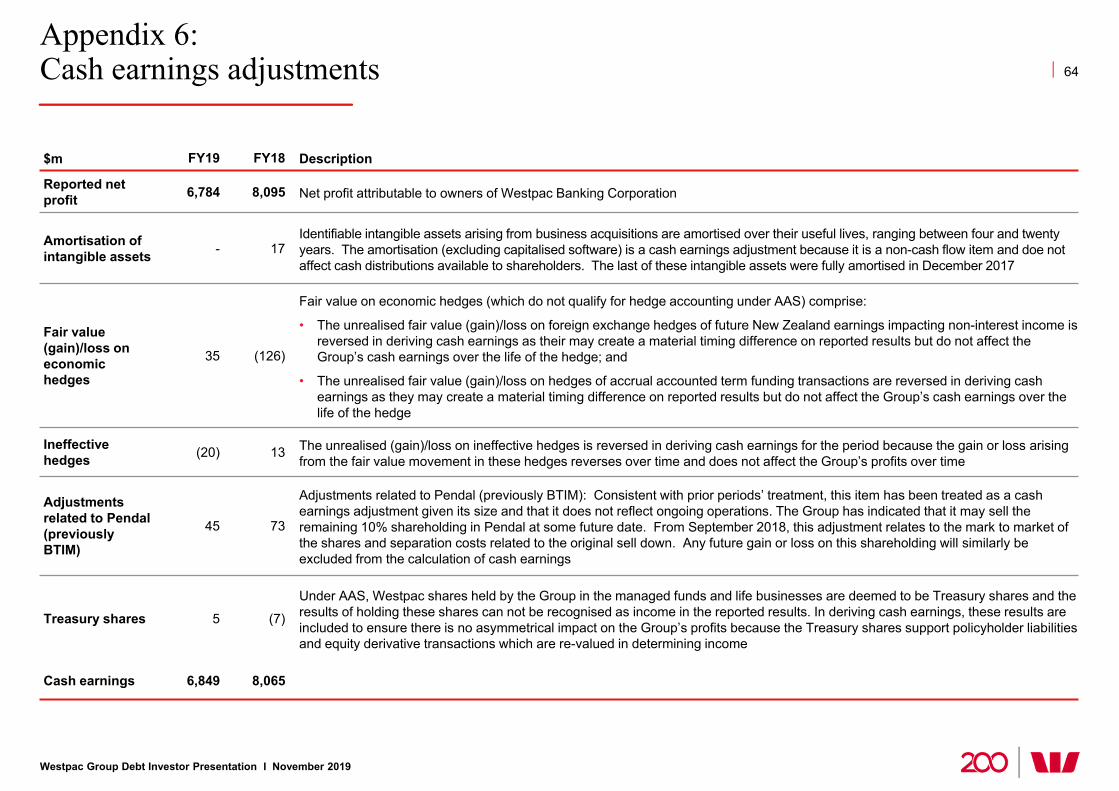
Appendix 6: Cash earnings adjustments
$m FY19 FY18 Description
Reported net profit 6,784 8,095 Net profit attributable to owners of Westpac Banking Corporation
Amortisation of intangible assets - 17
Identifiable intangible assets arising from business acquisitions are amortised over their useful lives, ranging between four and twenty years. The amortisation (excluding capitalised software) is a cash earnings adjustment because it is a non-cash flow item and doe not affect cash distributions available to shareholders. The last of these intangible assets were fully amortised in December 2017
Fair value (gain)/loss on economic hedges
35 (126)
Fair value on economic hedges (which do not qualify for hedge accounting under AAS) comprise:
• The unrealised fair value (gain)/loss on foreign exchange hedges of future New Zealand earnings impacting non-interest income isreversed in deriving cash earnings as their may create a material timing difference on reported results but do not affect theGroup’s cash earnings over the life of the hedge; and
• The unrealised fair value (gain)/loss on hedges of accrual accounted term funding transactions are reversed in deriving cash earnings as they may create a material timing difference on reported results but do not affect the Group’s cash earnings over the life of the hedge
Ineffective hedges (20) 13 The unrealised (gain)/loss on ineffective hedges is reversed in deriving cash earnings for the period because the gain or loss arising
from the fair value movement in these hedges reverses over time and does not affect the Group’s profits over time
Adjustments related to Pendal (previously BTIM)
45 73
Adjustments related to Pendal (previously BTIM): Consistent with prior periods’ treatment, this item has been treated as a cashearnings adjustment given its size and that it does not reflect ongoing operations. The Group has indicated that it may sell theremaining 10% shareholding in Pendal at some future date. From September 2018, this adjustment relates to the mark to market ofthe shares and separation costs related to the original sell down. Any future gain or loss on this shareholding will similarly be excluded from the calculation of cash earnings
Treasury shares 5 (7)
Under AAS, Westpac shares held by the Group in the managed funds and life businesses are deemed to be Treasury shares and theresults of holding these shares can not be recognised as income in the reported results. In deriving cash earnings, these results are included to ensure there is no asymmetrical impact on the Group’s profits because the Treasury shares support policyholder liabilities and equity derivative transactions which are re-valued in determining income
Cash earnings 6,849 8,065
Westpac Group Debt Investor Presentation I November 2019
64
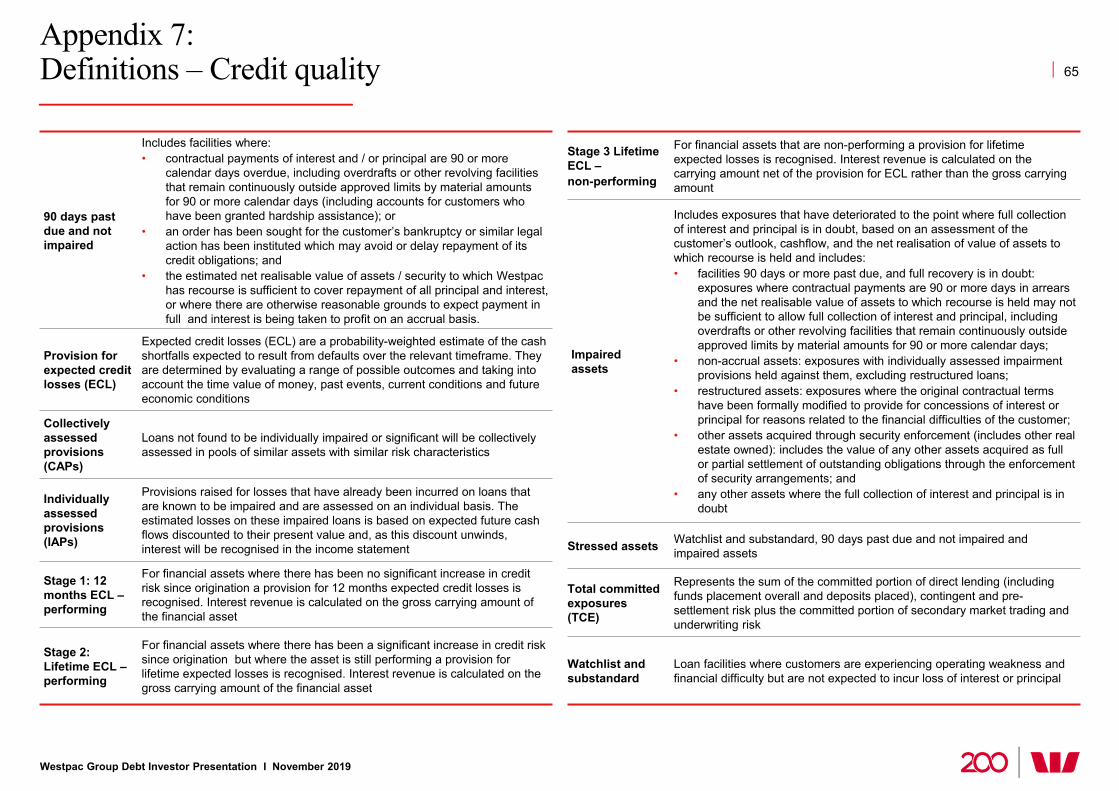
Appendix 7: Definitions – Credit quality
Westpac Group Debt Investor Presentation I November 2019
65
Stage 3 Lifetime ECL –non-performing
For financial assets that are non-performing a provision for lifetime expected losses is recognised. Interest revenue is calculated on the carrying amount net of the provision for ECL rather than the gross carrying amount
Impaired assets
Includes exposures that have deteriorated to the point where full collection of interest and principal is in doubt, based on an assessment of the customer’s outlook, cashflow, and the net realisation of value of assets to which recourse is held and includes:• facilities 90 days or more past due, and full recovery is in doubt:
exposures where contractual payments are 90 or more days in arrears and the net realisable value of assets to which recourse is held may not be sufficient to allow full collection of interest and principal, including overdrafts or other revolving facilities that remain continuously outside approved limits by material amounts for 90 or more calendar days;
• non-accrual assets: exposures with individually assessed impairment provisions held against them, excluding restructured loans;
• restructured assets: exposures where the original contractual terms have been formally modified to provide for concessions of interest or principal for reasons related to the financial difficulties of the customer;
• other assets acquired through security enforcement (includes other real estate owned): includes the value of any other assets acquired as full or partial settlement of outstanding obligations through the enforcement of security arrangements; and
• any other assets where the full collection of interest and principal is in doubt
Stressed assets Watchlist and substandard, 90 days past due and not impaired and impaired assets
Total committed exposures (TCE)
Represents the sum of the committed portion of direct lending (including funds placement overall and deposits placed), contingent and pre-settlement risk plus the committed portion of secondary market trading and underwriting risk
Watchlist and substandard
Loan facilities where customers are experiencing operating weakness and financial difficulty but are not expected to incur loss of interest or principal
90 days past due and not impaired
Includes facilities where:• contractual payments of interest and / or principal are 90 or more
calendar days overdue, including overdrafts or other revolving facilities that remain continuously outside approved limits by material amounts for 90 or more calendar days (including accounts for customers who have been granted hardship assistance); or
• an order has been sought for the customer’s bankruptcy or similar legal action has been instituted which may avoid or delay repayment of its credit obligations; and
• the estimated net realisable value of assets / security to which Westpac has recourse is sufficient to cover repayment of all principal and interest, or where there are otherwise reasonable grounds to expect payment in full and interest is being taken to profit on an accrual basis.
Provision for expected credit losses (ECL)
Expected credit losses (ECL) are a probability-weighted estimate of the cash shortfalls expected to result from defaults over the relevant timeframe. They are determined by evaluating a range of possible outcomes and taking into account the time value of money, past events, current conditions and future economic conditions
Collectively assessed provisions (CAPs)
Loans not found to be individually impaired or significant will be collectively assessed in pools of similar assets with similar risk characteristics
Individually assessed provisions (IAPs)
Provisions raised for losses that have already been incurred on loans that are known to be impaired and are assessed on an individual basis. The estimated losses on these impaired loans is based on expected future cash flows discounted to their present value and, as this discount unwinds, interest will be recognised in the income statement
Stage 1: 12 months ECL –performing
For financial assets where there has been no significant increase in credit risk since origination a provision for 12 months expected credit losses is recognised. Interest revenue is calculated on the gross carrying amount of the financial asset
Stage 2: Lifetime ECL –performing
For financial assets where there has been a significant increase in credit risk since origination but where the asset is still performing a provision for lifetime expected losses is recognised. Interest revenue is calculated on the gross carrying amount of the financial asset
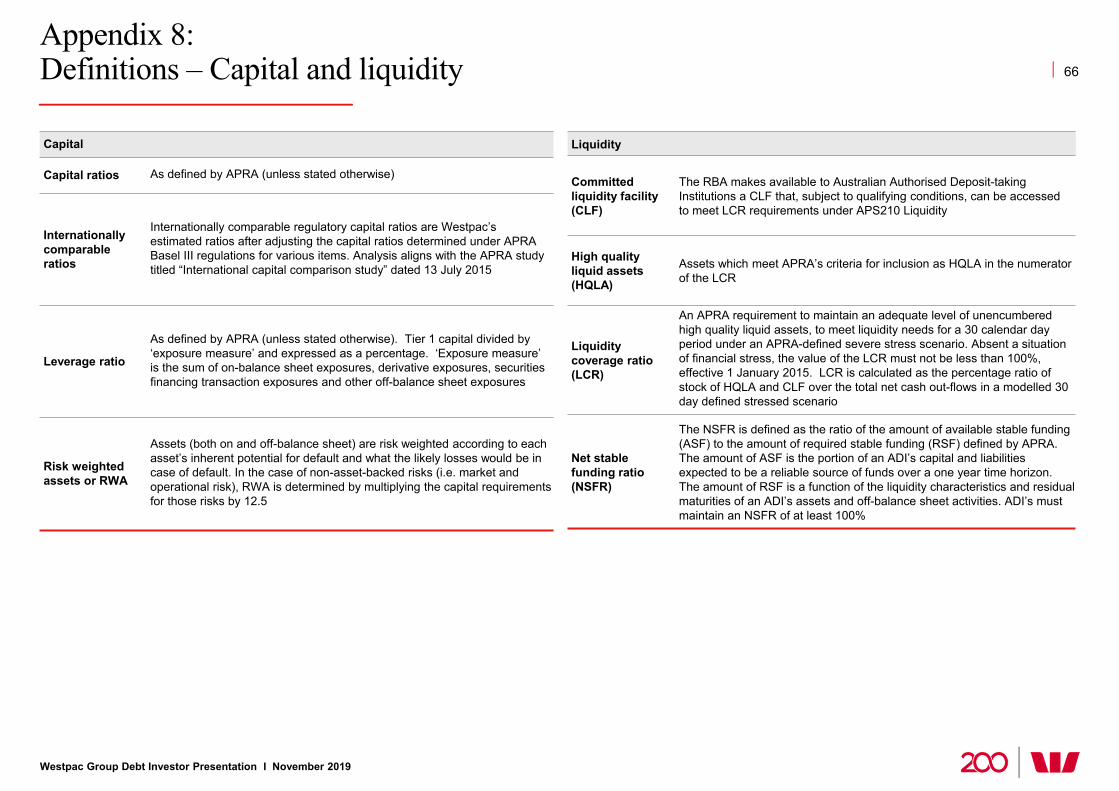
Appendix 8: Definitions – Capital and liquidity
Westpac Group Debt Investor Presentation I November 2019
66
Capital
Capital ratios As defined by APRA (unless stated otherwise)
Internationally comparable ratios
Internationally comparable regulatory capital ratios are Westpac’s estimated ratios after adjusting the capital ratios determined under APRA Basel III regulations for various items. Analysis aligns with the APRA study titled “International capital comparison study” dated 13 July 2015
Leverage ratio
As defined by APRA (unless stated otherwise). Tier 1 capital divided by ‘exposure measure’ and expressed as a percentage. ‘Exposure measure’ is the sum of on-balance sheet exposures, derivative exposures, securities financing transaction exposures and other off-balance sheet exposures
Risk weighted assets or RWA
Assets (both on and off-balance sheet) are risk weighted according to each asset’s inherent potential for default and what the likely losses would be in case of default. In the case of non-asset-backed risks (i.e. market and operational risk), RWA is determined by multiplying the capital requirements for those risks by 12.5
Liquidity
Committed liquidity facility (CLF)
The RBA makes available to Australian Authorised Deposit-taking Institutions a CLF that, subject to qualifying conditions, can be accessed to meet LCR requirements under APS210 Liquidity
High quality liquid assets (HQLA)
Assets which meet APRA’s criteria for inclusion as HQLA in the numerator of the LCR
Liquidity coverage ratio (LCR)
An APRA requirement to maintain an adequate level of unencumbered high quality liquid assets, to meet liquidity needs for a 30 calendar day period under an APRA-defined severe stress scenario. Absent a situation of financial stress, the value of the LCR must not be less than 100%, effective 1 January 2015. LCR is calculated as the percentage ratio of stock of HQLA and CLF over the total net cash out-flows in a modelled 30 day defined stressed scenario
Net stable funding ratio (NSFR)
The NSFR is defined as the ratio of the amount of available stable funding (ASF) to the amount of required stable funding (RSF) defined by APRA. The amount of ASF is the portion of an ADI’s capital and liabilities expected to be a reliable source of funds over a one year time horizon. The amount of RSF is a function of the liquidity characteristics and residual maturities of an ADI’s assets and off-balance sheet activities. ADI’s must maintain an NSFR of at least 100%
More information | www.westpac.com.au/investorcentre
Curt ZuberTreasurer, Westpac Banking Corporation
+61 2 8253 4230 [email protected]
Lucy CarrollSenior Associate, Global Funding
+61 2 8253 4314 [email protected]
Joanne DawsonDeputy Treasurer, Westpac Banking Corporation
+61 2 8204 2777 [email protected]
Nicholas CooperSenior Associate, Global Funding
+61 2 8253 4314 [email protected]
X-+
67
Contact our Global Funding team
Alexander BischoffExecutive Director, Global Funding
+61 2 8253 4314 [email protected]
Jacqueline BoddyDirector, Debt Investor Relations
+61 2 8253 3133 [email protected]
Westpac Group Debt Investor Presentation I November 2019