WESTERN UNION COd1lge852tjjqow.cloudfront.net/CIK-0001365135/5cefb9e0... · · 2015-03-23(Exact...
108
WESTERN UNION CO FORM 8-K (Current report filing) Filed 06/20/08 for the Period Ending 06/20/08 Address 12500 EAST BELFORD AVENUE ENGLEWOOD, CO 80112 Telephone (720) 332-3361 CIK 0001365135 Symbol WU SIC Code 7389 - Business Services, Not Elsewhere Classified Industry Business Services Sector Services Fiscal Year 12/31 http://www.edgar-online.com © Copyright 2015, EDGAR Online, Inc. All Rights Reserved. Distribution and use of this document restricted under EDGAR Online, Inc. Terms of Use.
Transcript of WESTERN UNION COd1lge852tjjqow.cloudfront.net/CIK-0001365135/5cefb9e0... · · 2015-03-23(Exact...

WESTERN UNION CO
FORM 8-K(Current report filing)
Filed 06/20/08 for the Period Ending 06/20/08
Address 12500 EAST BELFORD AVENUE
ENGLEWOOD, CO 80112Telephone (720) 332-3361
CIK 0001365135Symbol WU
SIC Code 7389 - Business Services, Not Elsewhere ClassifiedIndustry Business Services
Sector ServicesFiscal Year 12/31
http://www.edgar-online.com© Copyright 2015, EDGAR Online, Inc. All Rights Reserved.
Distribution and use of this document restricted under EDGAR Online, Inc. Terms of Use.

UNITED STATES
SECURITIES AND EXCHANGE COMMISSION
Washington, D.C. 20549
FORM 8-K
CURRENT REPORT
Pursuant to Section 13 or 15(d) of The Securities Exchange Act of 1934
Date of Report (Date of earliest event reported) : June 20, 2008
THE WESTERN UNION COMPANY (Exact name of registrant as specified in its charter)
Registrant’s telephone number, including area code: (866) 405-5012
N/A (Former name or former address, if changed since last report)
Check the appropriate box below if the Form 8-K filing is intended to simultaneously satisfy the filing obligation of the registrant under any of the following provisions:
Delaware 001-32903 20-4531180 (State or other jurisdiction
of incorporation) (Commission File Number)
(IRS Employer
Identification No.)
12500 East Belford Avenue Englewood, Colorado 80112
(Address of principal executive offices) (Zip Code)
� Written communications pursuant to Rule 425 under the Securities Act (17 CFR 230.425)
� Soliciting material pursuant to Rule 14a-12 under the Exchange Act (17 CFR 240.14a-12)
� Pre-commencement communications pursuant to Rule 14d-2(b) under the Exchange Act (17 CFR 240.14d-2(b))
� Pre-commencement communications pursuant to Rule 13e-4(c) under the Exchange Act (17 CFR 240.13e-4(c))

Item 7.01. Regulation FD Disclosure
The Western Union Company (the “Company”) will hold a meeting with investors today, June 20, 2008, at 9:00 a.m. Eastern Time in New York. The Company issued a press release on June 20, 2008 relating to such meeting. The press release is included as Exhibit 99.1 hereto. During the meeting, Christina A. Gold, President and Chief Executive Officer, Scott T. Scheirman, Executive Vice President and Chief Financial Officer, and other members of the Company’s management team will provide the presentation included as Exhibit 99.2 hereto relating to the Company’s long-term strategy to deliver value to shareholders. Information regarding access to the meeting by telephone and webcast can be found in the press release issued by the Company on May 20, 2008.
Also in the June 20, 2008 press release, the Company announced that the Board of Directors has authorized the purchase of an additional $1 billion of Western Union common stock through December 31, 2009.
The information furnished under this Item 7.01, including Exhibit 99.1 and 99.2 attached hereto, shall not be deemed to be “filed” for purposes of Section 18 of the Securities Exchange Act of 1934, as amended, or otherwise subject to the liabilities of that section, nor shall it be deemed incorporated by reference in any filing under the Securities Act of 1933, as amended, or the Securities Exchange Act of 1934, as amended, except as shall be expressly stated by specific reference in such filing.
Item 9.01. Financial Statements and Exhibits
The following is a list of the Exhibits furnished herewith.
2
Exhibit Number Description of Exhibit 99.1 Press Release issued by the Company on June 20, 2008.
99.2 Presentation of the Company dated June 20, 2008.

SIGNATURES
Pursuant to the requirements of the Securities Exchange Act of 1934, the Registrant has duly caused this report to be signed on its behalf by the undersigned hereunto duly authorized.
3
Dated: June 20, 2008 THE WESTERN UNION COMPANY
By: /s/ Sarah J. Kilgore Sarah J. Kilgore Assistant Secretary

EXHIBIT INDEX
4
Exhibit No. Description 99.1 Press release of The Western Union Company dated June 20, 2008.
99.2 Presentation of The Western Union Company dated June 20, 2008.

Exhibit 99.1
Western Union Raises Long-Term EPS Growth Objective to 15% to 18% Remains Confident in 2008 Outlook
Announces an Additional $1 Billion for Share Repurchases
New York, June 20, 2008 – Western Union (NYSE:WU) will hold a meeting with investors today in New York, where management will discuss its long-term strategy to deliver value to shareholders. The company raised its long-term EPS growth objective to 15% to 18%, up from 12% to 14%, and reaffirmed its long-term revenue growth objective of 10% to 12%, excluding acquisitions. Western Union also announced that its Board of Directors authorized an additional $1 billion for share repurchases.
The company also said that it expects to deliver financial results for 2008 that will likely be at the higher end of both its revenue growth guidance of 9% to 11% and non-GAAP EPS guidance of $1.25 to $1.29. On a GAAP basis, including $0.07 per share of expenses related to 2008 restructuring activities, the company expects to deliver EPS in the range of $1.18 to $1.22.
“Our decision to raise the long-term EPS objective comes from our confidence that we are successfully executing on Western Union’s strategy that positions us extremely well in the huge and growing global money transfer marketplace,” said Chief Executive Officer Christina Gold.
Regarding the future, Gold will review the four pillars of Western Union’s core strategy to foster significant long-term growth:
The company had previously expected GAAP EPS in the range of $1.19 to $1.23, which included $69 million (or $0.06 per share) of restructuring expenses. The updated range of $1.18 to $1.22 now includes $79 million (or $0.07 per share) of restructuring expenses. The additional $10 million of restructuring expense is related to the company’s decision in June to close its San Francisco facility. The company expects to save approximately $10 million in 2008 and approximately $35 million annually thereafter as a result of this year’s restructuring activities.
“Improving profitability, a lower tax rate and our stock repurchase program are keys to delivering our long-term EPS growth objective,” said Scott Scheirman, Western Union’s executive vice president and chief financial officer. “We’ll accomplish our core
1
Contacts:
Media Investors Eric Jackson Gary Kohn +1-720-332-2001(office) +1-720-332-8276 +1-303-330-2639(mobile) [email protected] [email protected]
• accelerate profitable growth in existing consumer-to-consumer business • globalize consumer-to-business segment • innovate to provide new products and services and • improve profitability by leveraging scale, reducing costs and effectively utilizing capital

initiative of margin expansion through cost savings achieved by leveraging our global scale, reducing distribution expenses, streamlining operating expenses and optimizing our investments across the globe. We remain committed to returning cash to shareholders through stock buybacks and dividends. To date, we have repurchased approximately 62 million shares for $1.3 billion at an average price of $21.48 and have $1.7 billion remaining for additional repurchases.”
Restructuring Expenses
Restructuring expenses include expenses related to severance, outplacement and other employee related benefits; facility closure and migration of IT infrastructure; other expenses related to relocation of various operations to existing company facilities and third party providers, including hiring, training, relocation, travel, and professional fees; and increased security costs at the facilities being closed. Also, included in the facility closure expenses are non-cash expenses related to fixed asset and leasehold improvement write-offs and acceleration of depreciation and amortization.
Non-GAAP Measures
Western Union’s management presents 2008 earnings per share guidance excluding 2008 restructuring expenses which is a non-GAAP measure, because management believes it provides more meaningful information.
Reconciliations of non-GAAP to comparable GAAP measures are available in the accompanying schedules and in the “Investor Relations” section of the company’s web site at www.westernunion.com.
Analyst Meeting Webcast
A replay of the webcast is available at www.westernunion.com under the “Investor Relations” tab. Please note: All statements made by Western Union officers at this meeting are the property of Western Union and subject to copyright protection. Other than the replay, Western Union has not authorized, and disclaims responsibility for, any recording, replay or distribution of any transcription of this call.
Safe Harbor Compliance Statement for Forward-Looking Statements
This press release contains certain statements that are forward-looking within the meaning of the Private Securities Litigation Reform Act of 1995. These statements are not guarantees of future performance and involve certain risks, uncertainties and assumptions that are difficult to predict. Actual outcomes and results may differ materially from those expressed in, or implied by, our forward-looking statements. Words such as “expects,” “intends,” “anticipates,” “believes,” “estimates,” “guides,” “provides guidance” and other similar expressions or future or conditional verbs such as “will,” “should,” “would” and “could” are intended to identify such forward-looking statements. Readers of this press release by The Western Union Company (the “Company,” “Western Union,” “we,” “our” or “us”) should not rely solely on the forward-looking statements and should consider all uncertainties and risks discussed under “Risk Factors” included within the Annual Report on Form 10-K for the year ended December 31, 2007. The statements are only as of the date they are made, and the Company undertakes no obligation to update any forward-looking statement.
Possible events or factors that could cause results or performance to differ materially from those expressed in our forward-looking statements include the following: changes in general economic conditions and economic conditions in the geographic regions and
2

industries in which we operate; changes in immigration laws, patterns and other factors related to immigrants; technological changes, particularly with respect to e-commerce; the failure by us, our agents or subagents to comply with our business and technology standards and contract requirements or applicable laws and regulations, especially laws designed to prevent money laundering and terrorist financing; our ability to attract and retain qualified key employees and to successfully manage our workforce; changes in foreign exchange rates, including the impact of the regulation of foreign exchange spreads on money transfers; adverse movements and volatility in debt and equity capital markets; political conditions and related actions by the United States and abroad which may adversely affect our businesses and economic conditions as a whole; failure to maintain sufficient amount or types of regulatory capital to meet the changing requirements of our various regulators worldwide; continued growth in the money transfer market and other markets in which we operate at rates approximating recent levels; implementation of agent contracts according to schedule; our ability to maintain our agent network and biller relationships under terms consistent with those currently in place; interruptions of United States government relations with countries in which we have or are implementing material agent contracts; deterioration in consumers’ and clients’ confidence in our business, or in money transfer providers generally; successfully managing credit and fraud risks presented by our agents and consumers; adverse rating actions by credit rating agencies; liabilities and unanticipated developments resulting from litigation and regulatory investigations and similar matters, including costs, expenses, settlements and judgments; changes in United States or foreign laws, rules and regulations including the Internal Revenue Code, and governmental or judicial interpretations thereof; our ability to favorably resolve tax matters with the Internal Revenue Service and other tax jurisdictions; changes in industry standards affecting our business; changes in accounting standards, rules and interpretations; competing effectively in the money transfer industry with respect to global and niche or corridor money transfer providers, banks and other nonbank money transfer services providers, including telecommunications providers, card associations and card-based payments providers; our ability to grow our core businesses; our ability to develop and introduce new products, services and enhancements, and gain market acceptance of such products; our ability to protect our brands and our other intellectual property rights; successfully managing the potential both for patent protection and patent liability in the context of a rapidly developing legal framework for intellectual property protection; any material breach of security of or interruptions in any of our systems; mergers, acquisitions and integration of acquired businesses and technologies into our company and the realization of anticipated synergies from these acquisitions; adverse consequences from our spin-off from First Data Corporation, including resolution of certain ongoing matters; decisions to downsize, sell or close units, or to transition operating activities from one location to another or to third parties, particularly transitions from the United States to other countries; decisions to change the business mix; cessation of various services provided to us by third-party vendors; catastrophic events; and management’s ability to identify and manage these and other risks.
About Western Union
The Western Union Company (NYSE: WU) is a leader in global money transfer services. Together with its affiliates, Orlandi Valuta and Vigo, Western Union provides consumers with fast, reliable and convenient ways to send and receive money around the world, as well as send payments and purchase money orders. It operates through a network of more than 345,000 Agent locations in over 200 countries and territories. Famous for its pioneering telegraph services, the original Western Union dates back to 1851. For more information, visit www.westernunion.com.
WU-G, WU-F
3

THE WESTERN UNION COMPANY RECONCILIATION OF NON-GAAP MEASURES
(unaudited)
Western Union’s management has presented 2008 earnings per share guidance, excluding restructuring and related expenses. Western Union’s management believes this non-GAAP measure provides meaningful supplemental information regarding our operating results to assist management, investors, analysts, and others in understanding our financial results and to better analyze trends in our underlying business, because it provides consistency and comparability to prior periods.
A non-GAAP financial measure should not be considered in isolation or as a substitute for the most comparable GAAP financial measure. A non-GAAP financial measure reflects an additional way of viewing aspects of our operations that, when viewed with our GAAP results and the reconciliation to the corresponding GAAP financial measure, provide a more complete understanding of our business. Users of the financial statements are encouraged to review our financial statements and publicly-filed reports in their entirety and not to rely on any single financial measure. A reconciliation of the non-GAAP measure to the most directly comparable GAAP financial measure is included below.
EPS Guidance
4
Range
2008 EPS Guidance GAAP basis $ 1.18 $ 1.22
Adjustment: Estimated restructuring and related expenses, net of income tax benefit (a) 0.07 0.07
Adjusted 2008 EPS Guidance, excluding estimated restructuring and related expenses $ 1.25 $ 1.29
(a) Projected 2008 restructuring and related expenses of $79 million relate to severance, outplacement and other employee related benefits; facility closure and migration of our IT
infrastructure; other expenses related to relocation of various operations to existing Company facilities and third party providers, including hiring, training, relocation, travel, and professional fees; and increased security costs at the facilities being closed. Also, included in the facility closure expenses are non-cash expenses related to fixed asset and leasehold improvement write-offs and acceleration of depreciation and amortization. For purposes of calculating the “Adjusted 2008 EPS guidance, excluding estimated restructuring and related expenses,” the EPS impact of $0.07 is net of an estimated income tax benefit of $30 million.
1
2008 Investor ’s Meeting June 20, 2008
Exhibit 99.2

2
Gary Kohn Vice President Investor Relations

3
Safe Harbor Safe Harbor This presentation contains certain statements that are forward-looking within the meaning of the Private Securities Litigation Reform Act of 1995. These statements are not guarantees of future performance and involve certain risks, uncertainties and assumptions that are difficult to predict. Actual outcomes and results may differ materially from those expressed in, or implied by, our forward-looking statements. Words such as “expects,” “intends,” “anticipates,” “believes,” “estimates,” “guides,” “provides guidance” and other similar expressions or future or conditional verbs such as “will,” “should,” “would” and “could” are intended to identify such forward-looking statements. Readers of this presentation by The Western Union Company (the “Company,” “Western Union,” “we,”“our” or “us”) should not rely solely on the forward-looking statements and should consider all uncertainties and risks discussed under “Risk Factors” included within the Annual Report on Form 10-K for the year ended December 31, 2007. The statements are only as of the date they are made, and the Company undertakes no obligation to update any forward-looking statement.
Possible events or factors that could cause results or performance to differ materially from those expressed in our forward-looking statements include the following: changes in general economic conditions and economic conditions in the geographic regions and industries in which we operate; changes in immigration laws, patterns and other factors related to immigrants; technological changes, particularly with respect to e-commerce; the failure by us, our agents or subagents to comply with our business and technology standards and contract requirements or applicable laws and regulations, especially laws designed to prevent money laundering and terrorist financing; our ability to attract and retain qualified key employees and to successfully manage our workforce; changes in foreign exchange rates, including the impact of the regulation of foreign exchange spreads on money transfers; adverse movements and volatility in debt and equity capital markets; political conditions and related actions by the United States and abroad which may adversely affect our businesses and economic conditions as a whole; failure to maintain sufficient amount or types of regulatory capital to meet the changing requirements of our various regulators worldwide; continued growth in the money transfer market and other markets in which we operate at rates approximating recent levels; implementation of agent contracts according to schedule; our ability to maintain our agent network and biller relationships under terms consistent or improved with those currently in place; interruptions of United States government relations with countries in which we have or are implementing material agent contracts; deterioration in consumers’ and clients’ confidence in our business, or in money transfer providers generally; successfully managing credit and fraud risks presented by our agents and consumers; adverse rating actions by credit rating agencies; liabilities and unanticipated developments resulting from litigation and regulatory investigations and similar matters, including costs, expenses, settlements and judgments; changes in United States or foreign laws, rules and regulations including the Internal Revenue Code, and governmental or judicial interpretations thereof; our ability to favorably resolve tax matters with the Internal Revenue Service and other tax jurisdictions; changes in industry standards affecting our business; changes in accounting standards, rules and interpretations; competing effectively in the money transfer industry with respect to global and niche or corridor money transfer providers, banks and other nonbank money transfer services providers, including telecommunications providers, card associations and card-based payments providers; our ability to grow our core businesses; our ability to develop and introduce new products, services and enhancements, and gain market acceptance of such products; our ability to protect our brands and our other intellectual property rights; successfully managing the potential both for patent protection and patent liability in the context of a rapidly developing legal framework for intellectual property protection; any material breach of security of or interruptions in any of our systems; mergers, acquisitions and integration of acquired businesses and technologies into our company and the realization of anticipated synergies from these acquisitions; adverse consequences from our spin-off from First Data Corporation, including resolution of certain ongoing matters; decisions to downsize, sell or close units, or to transition operating activities from one location to another or to third parties, particularly transitions from the United States to other countries; decisions to change the business mix; cessation of various services provided to us by third-party vendors; catastrophic events; and management’s ability to identify and manage these and other risks.
4
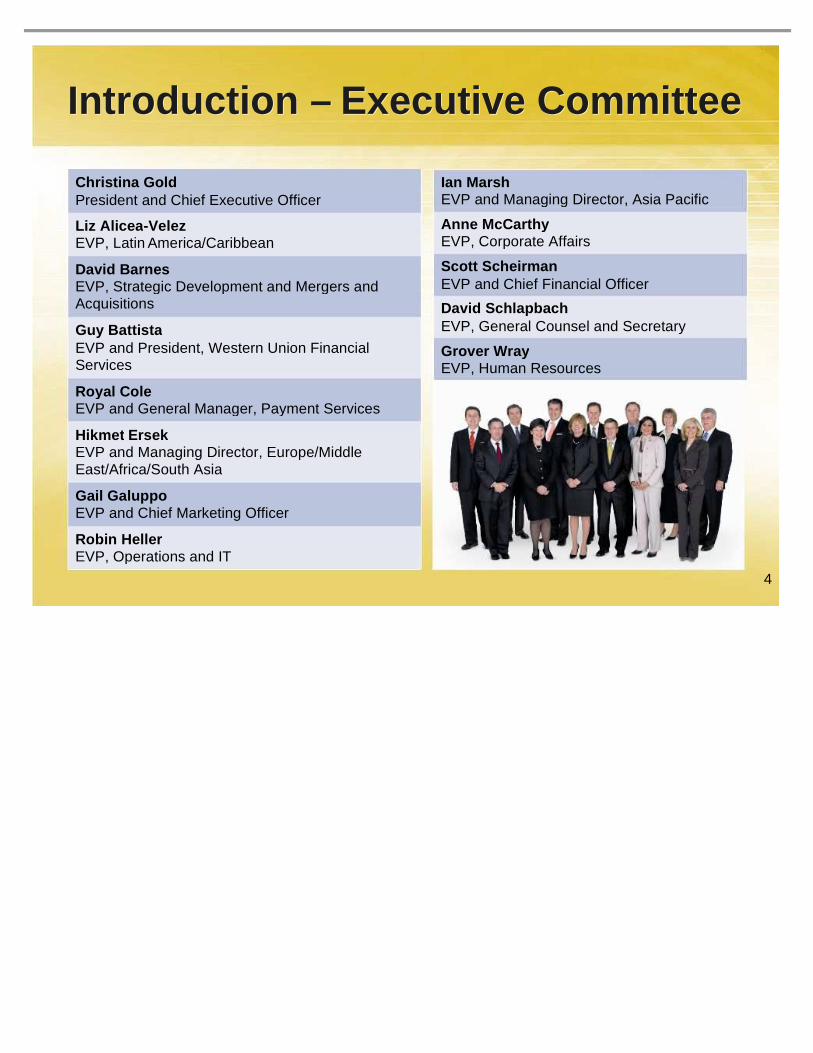
Introduction – Executive Committee Introduction – Executive Committee
Gail Galuppo EVP and Chief Marketing Officer
Robin Heller EVP, Operations and IT
Hikmet Ersek EVP and Managing Director, Europe/Middle East/Africa/South Asia
Royal Cole EVP and General Manager, Payment Services
Guy Battista EVP and President, Western Union Financial Services
David Barnes EVP, Strategic Development and Mergers and Acquisitions
Liz Alicea -Velez EVP, Latin America/Caribbean
Christina Gold President and Chief Executive Officer
Scott Scheirman EVP and Chief Financial Officer
Grover Wray EVP, Human Resources
David Schlapbach EVP, General Counsel and Secretary
Anne McCarthy EVP, Corporate Affairs
Ian Marsh EVP and Managing Director, Asia Pacific

5
Regional Vice Presidents Regional Vice Presidents
• Patricia Riingen Philippines & Indo China
• Andrew Ong North Asia
• Anil Kapur South Asia
• Odilon Almeida South America
• J.C. Farah Middle East, Pakistan & Afghanistan

6
Christina Gold President & CEO
7
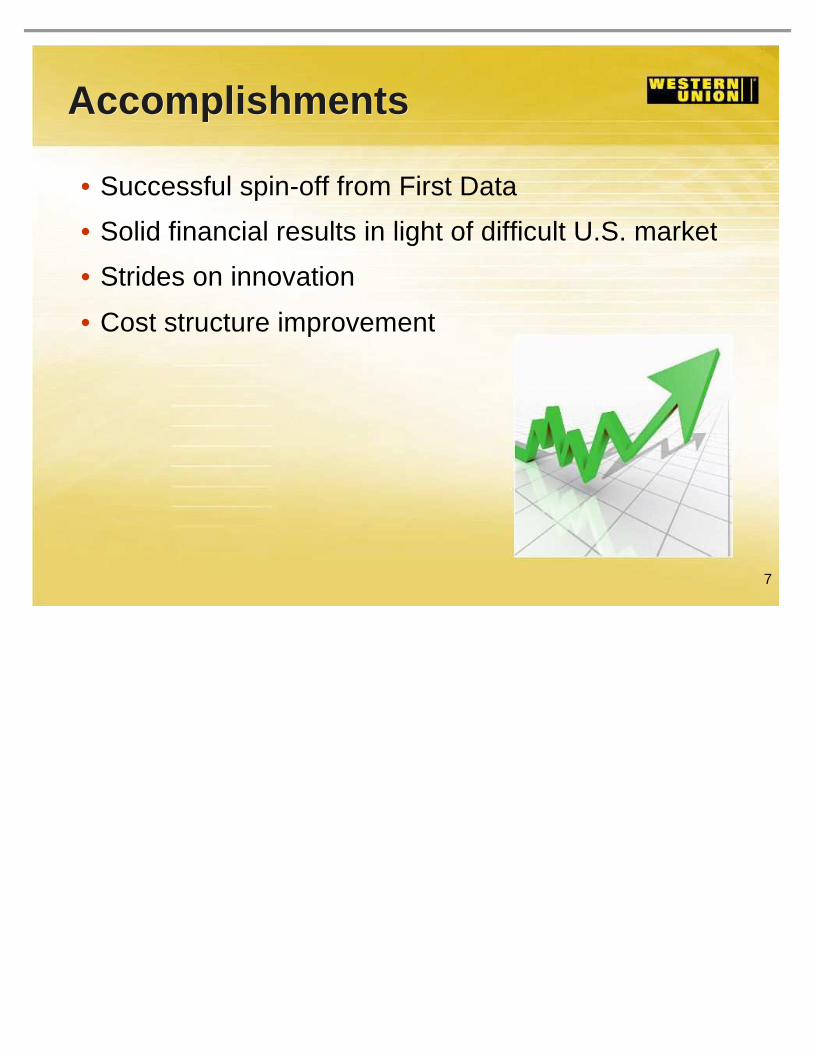
Accomplishments Accomplishments
• Successful spin-off from First Data
• Solid financial results in light of difficult U.S. market
• Strides on innovation
• Cost structure improvement

8
Accomplishments Accomplishments
• Stabilized domestic C2C business
• Future growth in U.S. from – Investing in brand awareness
– Customer acquisition
– Gold Card
– Vigo domestic and mobile money transfers
– westernunion.com
• Outpacing market in Mexico – Positive revenue growth in 2008

9
Worldwide Opportunity Worldwide Opportunity
Existing worldwide boundaries are clearly fading, creating greater
economic opportunities

10
Leading the Global Money Transfer Marketplace Leading the Global Money Transfer Marketplace • 345,000 agent locations
• Well-known brand
• Globally diverse revenue stream
• Scalable infrastructure
• Industry-leading compliance capabilities
• Solid financial position
Long -term EPS growth objective: 15% -18%

11
4 Improve profitability by leveraging scale,
reducing costs and effectively utilizing capital
Western Union Strategy Western Union Strategy
4 key pillars for long -term growth
1 Accelerate profitable
growth in the global cash money transfer business 2
Expand and globalize the C2B
payments business
3 Innovate new products and services for our
target customers
12
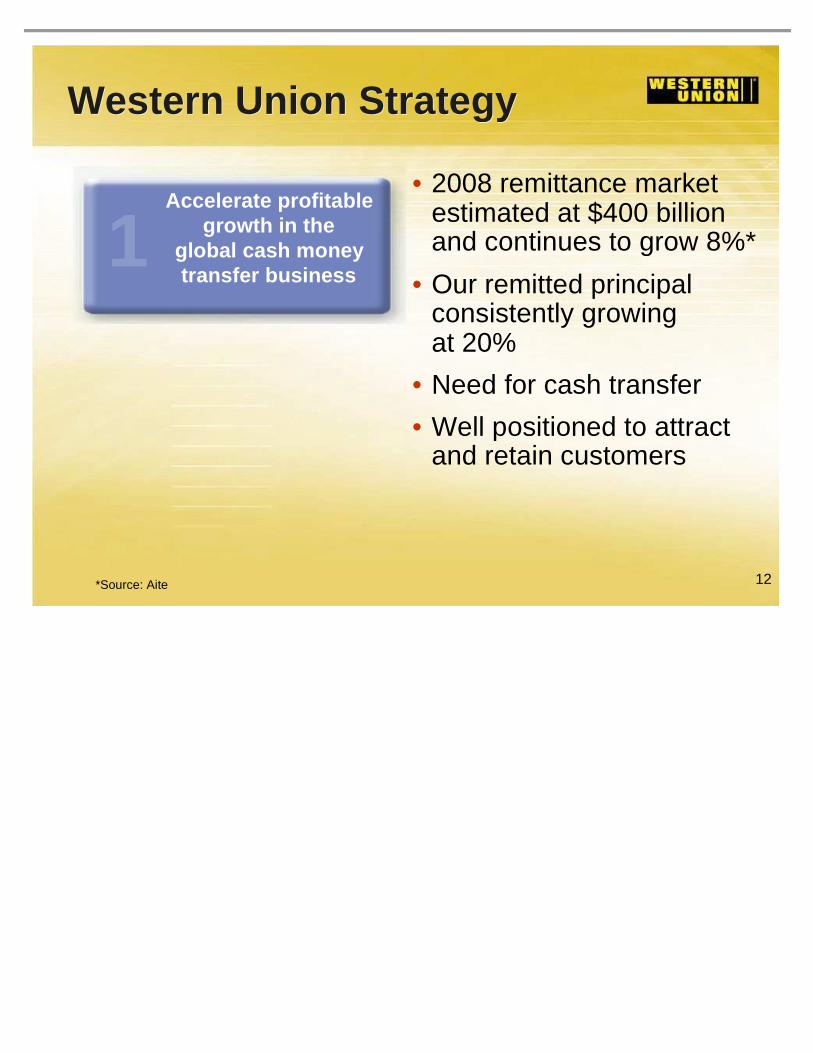
Western Union Strategy Western Union Strategy
• 2008 remittance market estimated at $400 billion and continues to grow 8%*
• Our remitted principal consistently growing at 20%
• Need for cash transfer
• Well positioned to attract and retain customers
1 Accelerate profitable
growth in the global cash money transfer business
*Source: Aite
13
Western Union Strategy Western Union Strategy
• Global migration trends are becoming more diverse
• Complex regulatory environment
• Customers’ needs are expanding
• Growing our core business means adapting to an evolving money transfer industry
14
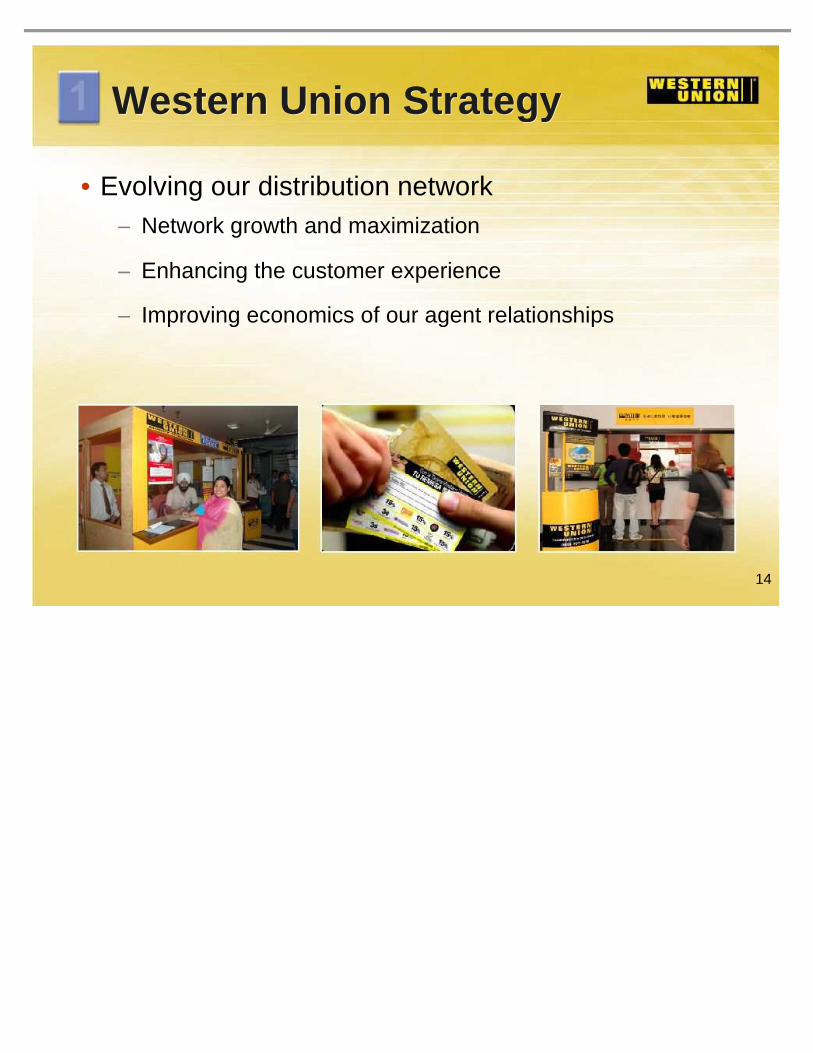
• Evolving our distribution network – Network growth and maximization
– Enhancing the customer experience
– Improving economics of our agent relationships
Western Union Strategy Western Union Strategy
15
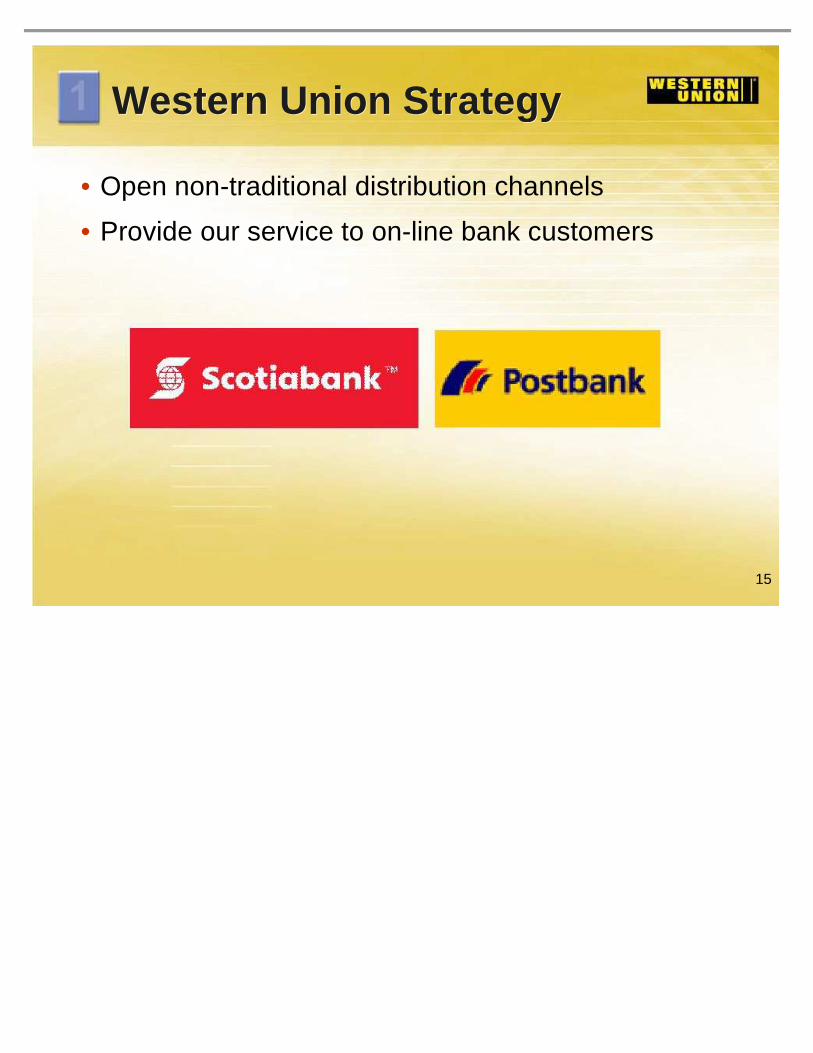
• Open non-traditional distribution channels
• Provide our service to on-line bank customers
Western Union Strategy Western Union Strategy

16
• Expansion of our Vigo Brand – Differentiated product offering
– More competitive to broader range of consumers
– Build out “send side” throughout Western Europe
Western Union Strategy Western Union Strategy

17
• Consistent brand messaging – Building on the essence of our brand
Western Union Strategy Western Union Strategy
18
Western Union Strategy Western Union Strategy
• One of the biggest long-term opportunities
• Primarily only in two countries today
• Goal is to double Payments revenue
• Growth to be organic and from acquisitions
2 Expand
and globalize the C2B payments business

19
• Real-time, bill payment posting
• Immediate bill payment through existing on-line banking platforms
• Potential to reach new customers
Western Union Strategy Western Union Strategy

20
• Enabling convenient payment options
Western Union Strategy Western Union Strategy

21
• Expansion beyond traditional U.S. core – Build on successful Pago Fácil acquisition
– Match our resources to needs of consumers and billers
Western Union Strategy Western Union Strategy

22
• Introduce Vigo bill payment offerings
• Extend Vigo brand to new C2B customer
• Vigo can sit “side-by-side”with competitors
Western Union Strategy Western Union Strategy

23
Western Union Strategy Western Union Strategy
• Dedicated resources to capture the opportunity
• Well positioned to identify industry trends
• Leading innovation
• Attract new customers and sell more to existing customers
3 Innovate new products and services for our
target customers

24
• Mobile money transfer
• Conducting active market tests
Western Union Strategy Western Union Strategy

25
• Micro lending – Example: PrimeCredit in Hong Kong
Western Union Strategy Western Union Strategy

26
Western Union Strategy Western Union Strategy
• Expand margins and improve profitability
• Leverage scale
• Reduce expenses
4 Improve profitability by leveraging scale,
reducing costs and effectively utilizing capital

27
• Efforts to expand margins
– Operating center closings and relocations
– Renegotiating agent commissions
• Relationship stability with “win/win” agreements
Western Union Strategy Western Union Strategy

28
2002
• South America was a $200M revenue business – Predominantly inbound from the U.S.
– No meaningful bill payment revenue
Case Study – South America Case Study – South America

29
2002
• South America was a $200M revenue business – Predominantly inbound from the U.S.
– No meaningful bill payment revenue
2007
• Doubled revenue since 2002
Case Study – South America Case Study – South America

30
Case Study – South America Case Study – South America
• Inbound revenue from the U.S. grew modestly
• Inbound revenue from countries other than the U.S. doubled
– Location additions
– Targeted South American marketing campaigns

31
• South America outbound revenue doubled
• Intra-country money transfer revenue up 20x
Case Study – South America Case Study – South America
32
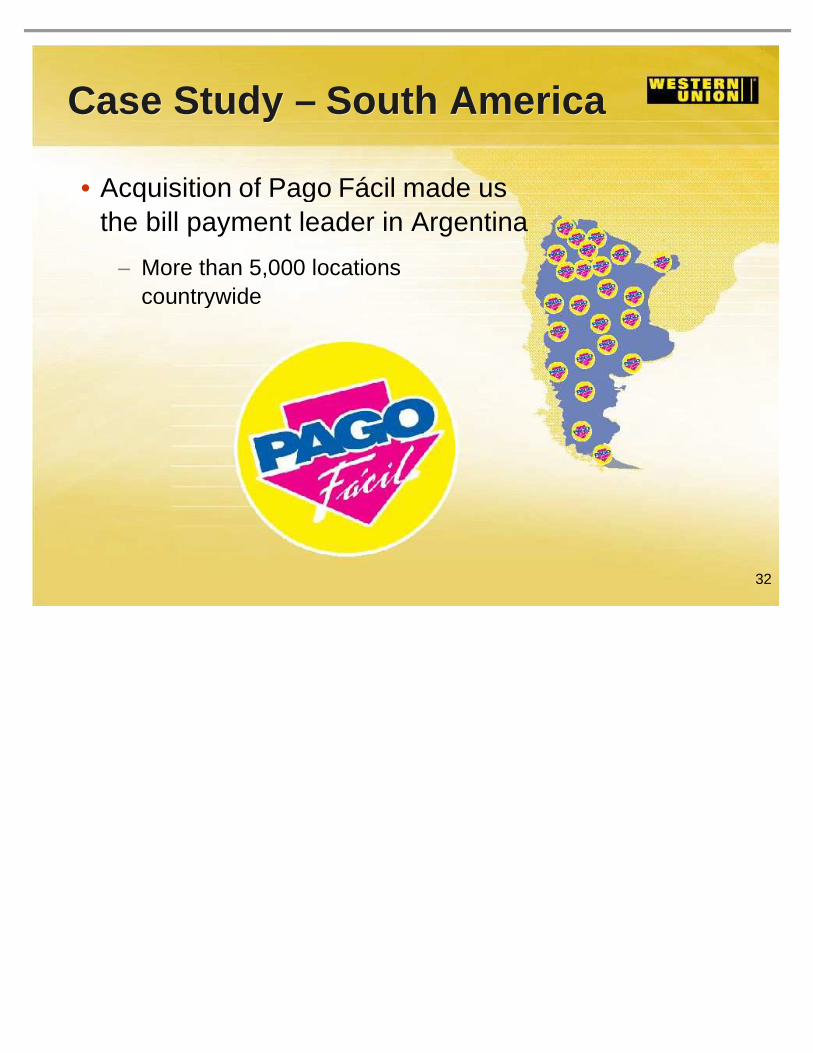
Case Study – South America Case Study – South America
• Acquisition of Pago Fácil made us the bill payment leader in Argentina
– More than 5,000 locations countrywide

33
Case Study – South America Case Study – South America
Today
• Operating margin improved 500 basis points
• South America is a diversified $400M inbound, outbound, intra and bill payment marketplace
• First quarter 2008 revenue grew 21%

34
Summary Summary
• Execution of our growth strategy will result in business that is…
– Larger
– Diversified
– Profitable
– Customer focused

35
Hikmet Ersek Executive Vice President
& Managing Director
Europe, Middle East, Africa, South Asia
36
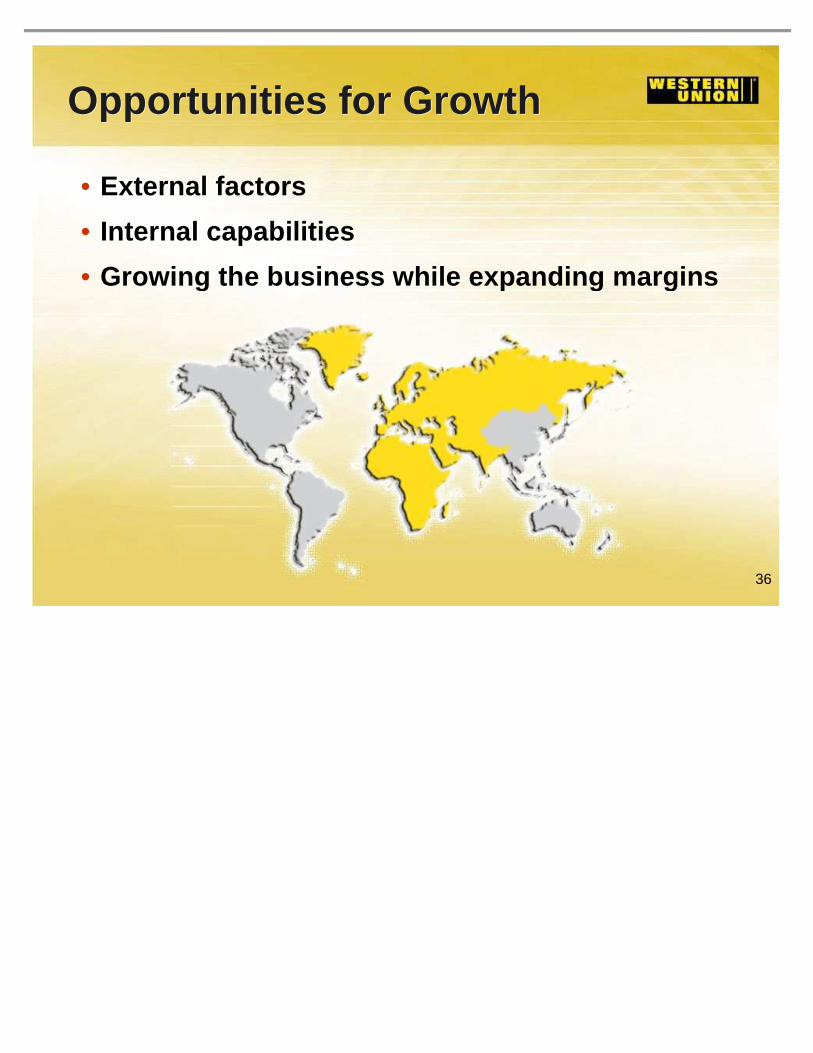
• External factors
• Internal capabilities
• Growing the business while expanding margins
Opportunities for Growth Opportunities for Growth

37
Opportunities for Growth Opportunities for Growth
External factors
• Remittances more stable than private capital flows*
• Favorable migration patterns and economic trends
• Cash is needed at both ends of the transaction
*Source: Migration Policy Institute
38
Opportunities for Growth Opportunities for Growth
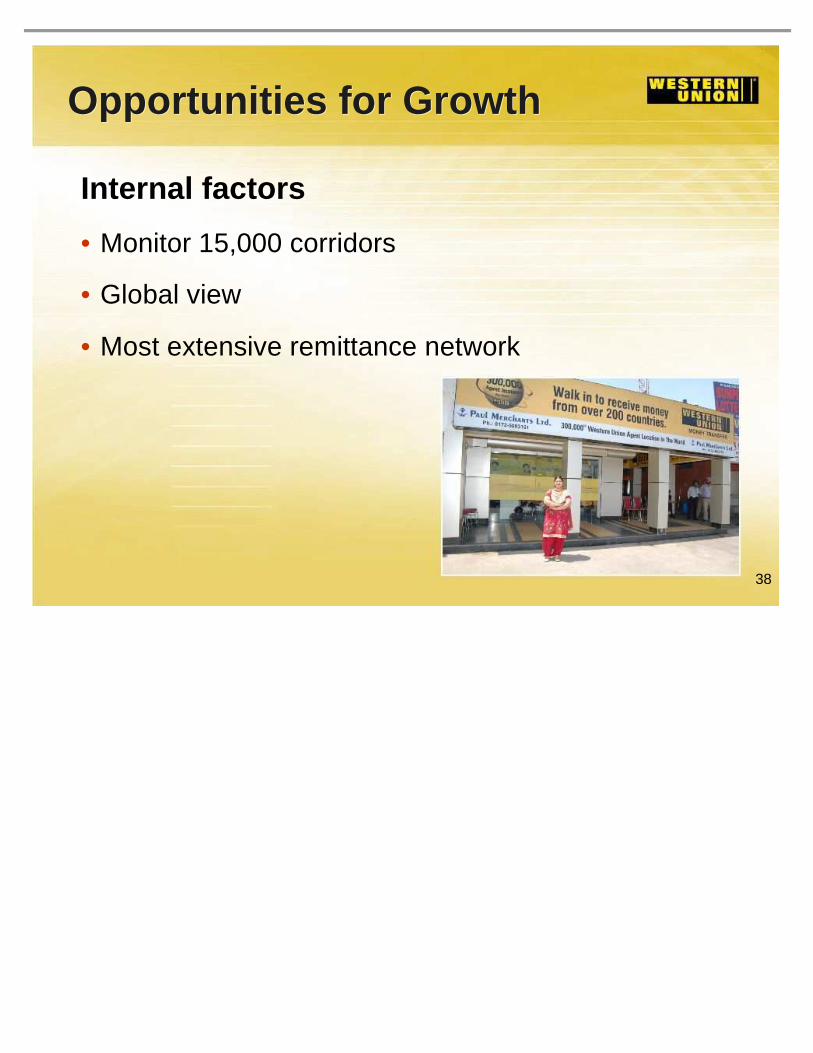
Internal factors
• Monitor 15,000 corridors
• Global view
• Most extensive remittance network

39
Opportunities for Growth Opportunities for Growth
Growing the business while expanding margins
• Our proven formula for growth – Recognizing money transfer corridors
– Building agent network
– Invest to raise brand awareness
• C2C is our fastest-growing business
• More than half of our total revenue today non-U.S. originated and grew 23% in 2007

40
Opportunities for Growth Opportunities for Growth
Growing the business while expanding margins
• Outbound growth – By offering services to individuals who have relocated to
new markets with strengthening economies
• Russia

41
Opportunities for Growth Opportunities for Growth
Growing the business while expanding margins
• Intra growth
• Alternative distribution channels
• westernunion.com

42
Opportunities for Growth Opportunities for Growth
Growing the business while expanding margins
• Vigo test in Italy – Attracts new customer
– “Side-by-side” offering with competitors
• Expansion plans for Europe

43
Opportunities for Growth Opportunities for Growth
Growing the business while expanding margins
• Agent commission rates – Lower rates for new agents
– Renegotiate rates with existing agents
– “Win / Win” agreements

44
Opportunities for Growth Opportunities for Growth
Case Study – Philippines, India and China (PIC)
• Represents a $70B market*
• Approximately 20% of global remittances
• 2002-2007 revenue CAGR of 47%
• Margins expanded to 24% in 2007 from 2% in 2002
• 85,000 agent locations
• High brand awareness
*Source: World Bank
45
Opportunities for Growth Opportunities for Growth
Case Study
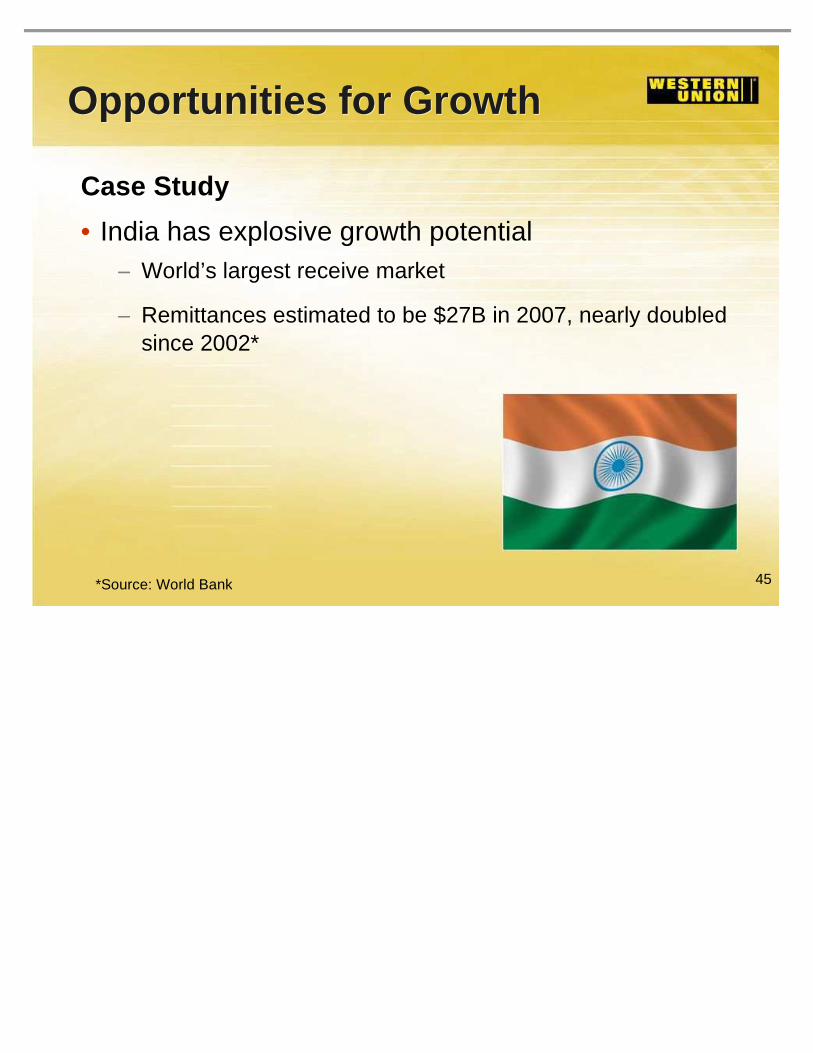
• India has explosive growth potential – World’s largest receive market
– Remittances estimated to be $27B in 2007, nearly doubled since 2002*
*Source: World Bank

46
Opportunities for Growth Opportunities for Growth
Case Study
• Western Union is positioned to be the growth leader in India
– More than 50,000 agent locations
– 80% brand awareness
– 50 employees working in 8 offices
– Innovation potential - mobile

47
Opportunities for Growth Opportunities for Growth
India has robust growth potential
• From 2002-2007, revenue grew at a compound annual rate of 46%
• Operating margin widened to 25% in 2007, up from 11% in 2002

48
Accelerate profitable growth in C2C
Aligning Our Resources Aligning Our Resources
• Western Union brand
• Extensive network
• Innovation
• Expertise

49
Royal Cole Executive Vice President & General Manager
Payment Services
50
C2B – Payments Business C2B – Payments Business
• Overview
– Represents $720M revenue (15% of our total revenue)
– Revenue primarily from U.S. and Argentina
– Goal is to double C2B revenue in the next 5 years
• Organic growth
• Acquisitions

51
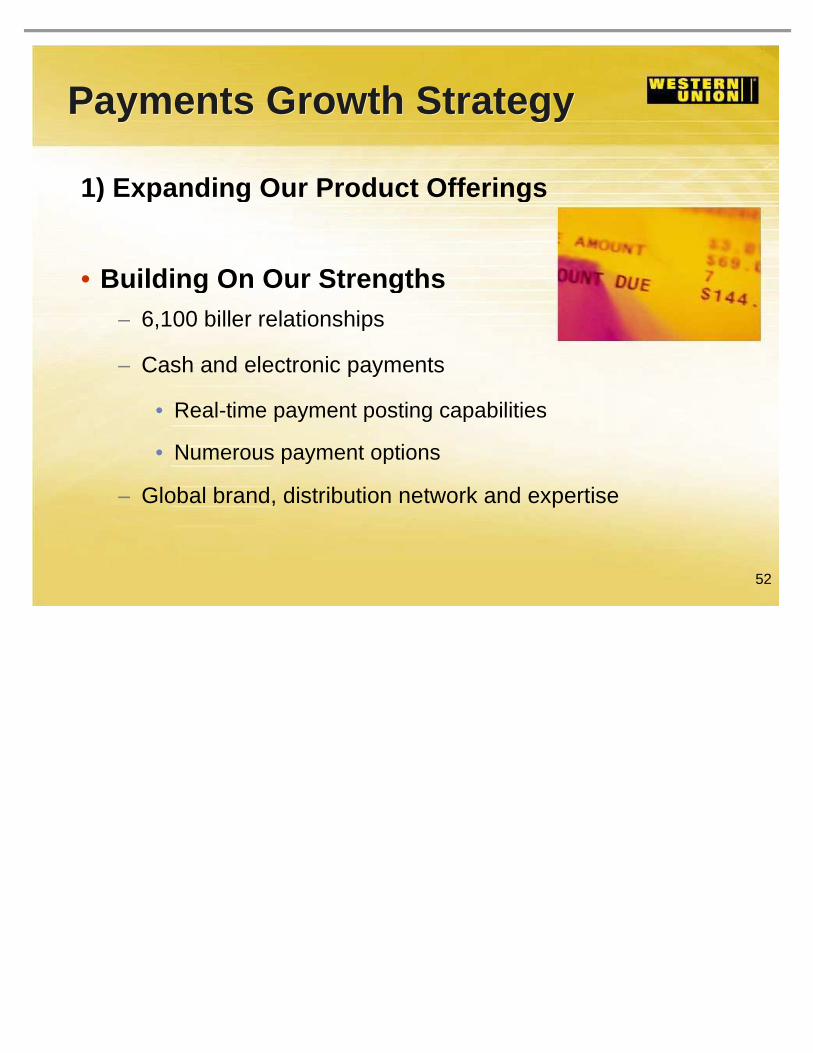
Payments Growth Strategy Payments Growth Strategy
1) Expanding Our Product Offerings
– Using our core assets to meet the evolving consumer and client demands
2) Active Global Expansion
52
Payments Growth Strategy Payments Growth Strategy
1) Expanding Our Product Offerings
• Building On Our Strengths – 6,100 biller relationships
– Cash and electronic payments
• Real-time payment posting capabilities
• Numerous payment options
– Global brand, distribution network and expertise
53
Payments Growth Strategy Payments Growth Strategy
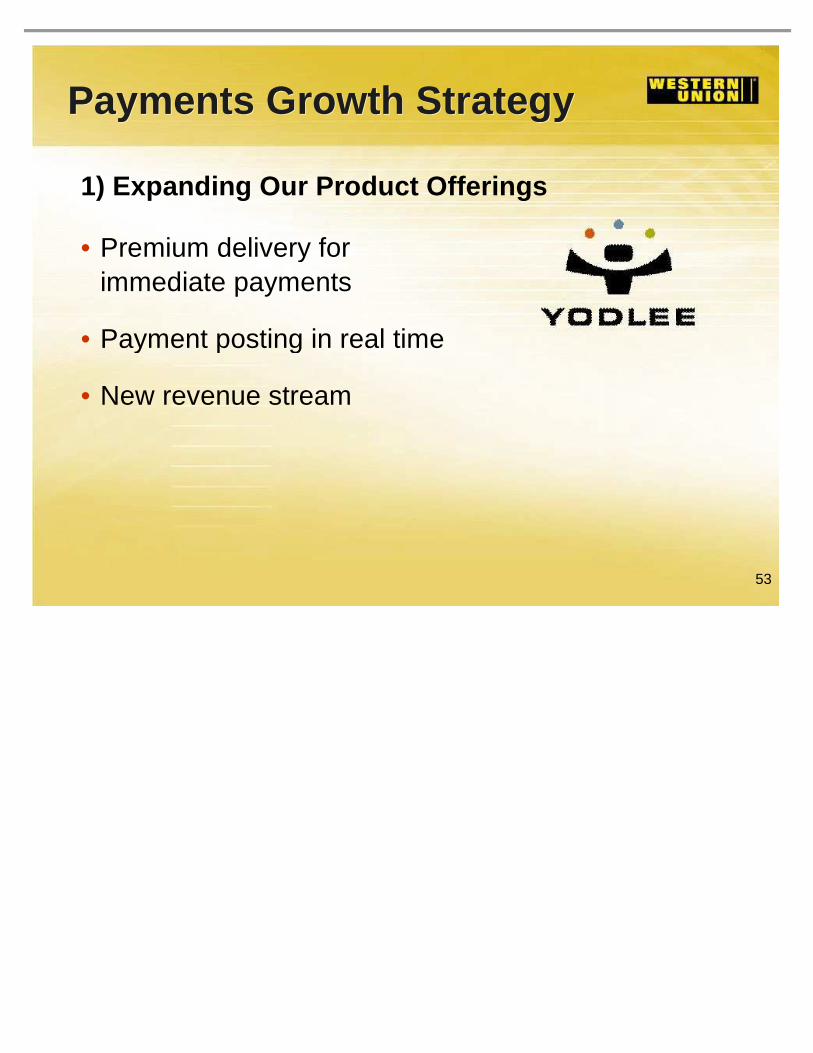
1) Expanding Our Product Offerings
• Premium delivery for immediate payments
• Payment posting in real time
• New revenue stream
54
Payments Growth Strategy Payments Growth Strategy
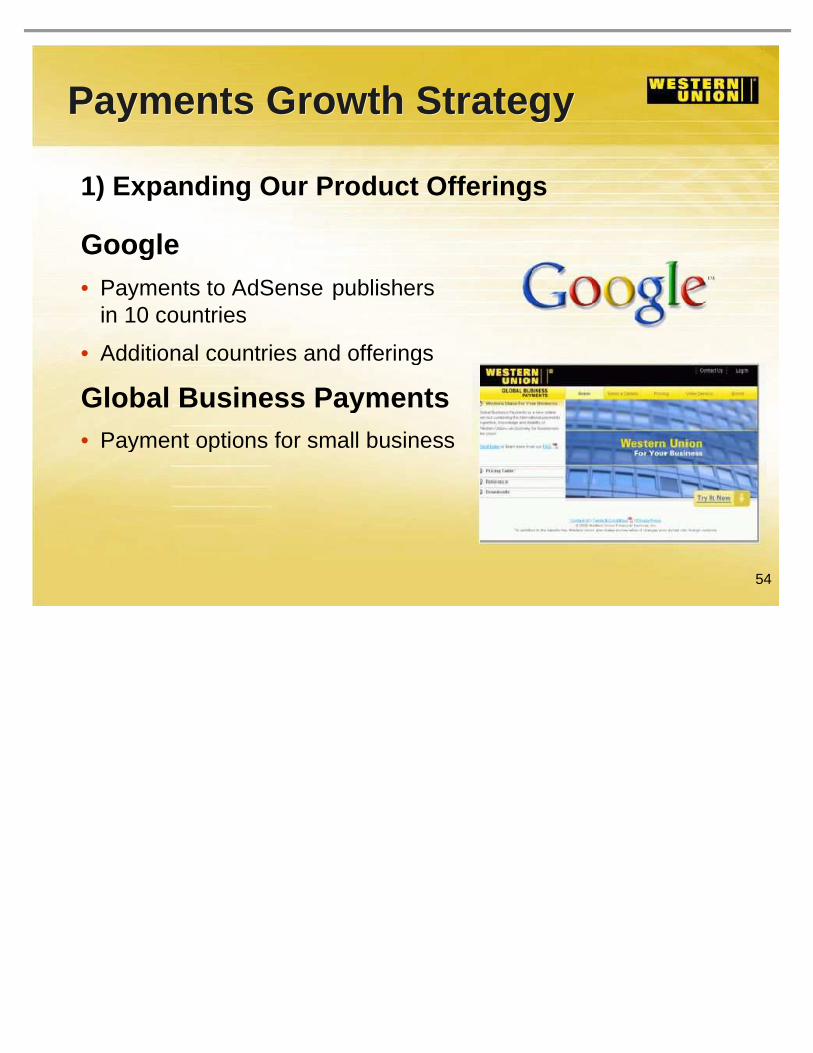
1) Expanding Our Product Offerings
Google • Payments to AdSense publishers
in 10 countries
• Additional countries and offerings
Global Business Payments • Payment options for small business

55
Payments Growth Strategy Payments Growth Strategy
1) Expanding Our Product Offerings
Vigo
• Cross-sell opportunity by making bill payment service available to Vigo customers
• Will also be available in competitive locations

56
Payments Growth Strategy Payments Growth Strategy
2) Active Global Expansion
• Global reach
• Agent network
• Operating platform
We have a competitive edge

57
Payments Growth Strategy Payments Growth Strategy
2) Active Global Expansion
Pago Fácil • Largest processor of public services
cash payments in Argentina
• Connects 1,800 billers to more than 8 million users per month
• More than 5,000 locations
• Bill payment revenue is 1.5 times C2C

58
Payments Growth Strategy Payments Growth Strategy
2) Active Global Expansion
• Brand, network, infrastructure and experience
– Peru in third quarter
– Panama to follow
– Brazil opportunity
– Pursuing opportunities in Europe, South Asia and Asia Pacific

59
Summary Summary
Payments Growth Plan is Ambitious and Realistic
• Leverage our unique capabilities
• Expand globally
• Evolve our products
Expand and globalize C2B payments business

60
Gail Galuppo Executive Vice President &
Chief Marketing Officer

61
Our Brand is Our Most Powerful Asset Our Brand is Our Most Powerful Asset A trusted brand for more than 150 years
People around the world have an emotional connection to the brand

62
Our Brand Our Brand
Affinity
Trust
Knowledge

63
Our Brand Our Brand
Western Union is a financial lifeline …

64
Our Brand Our Brand
• Top-of-mind awareness exceeds 80% in many markets
• Emotional commitment builds loyalty
• Customer loyalty drives long-term growth

65
Our Rich Data is a Competitive Advantage Our Rich Data is a Competitive Advantage
Gold Card and Loyalty Programs • Customers save time and money
• Efficient customer service
• Customer satisfaction
• Valuable database

66
New Brand Campaign New Brand Campaign
Coming Q4 2008

67
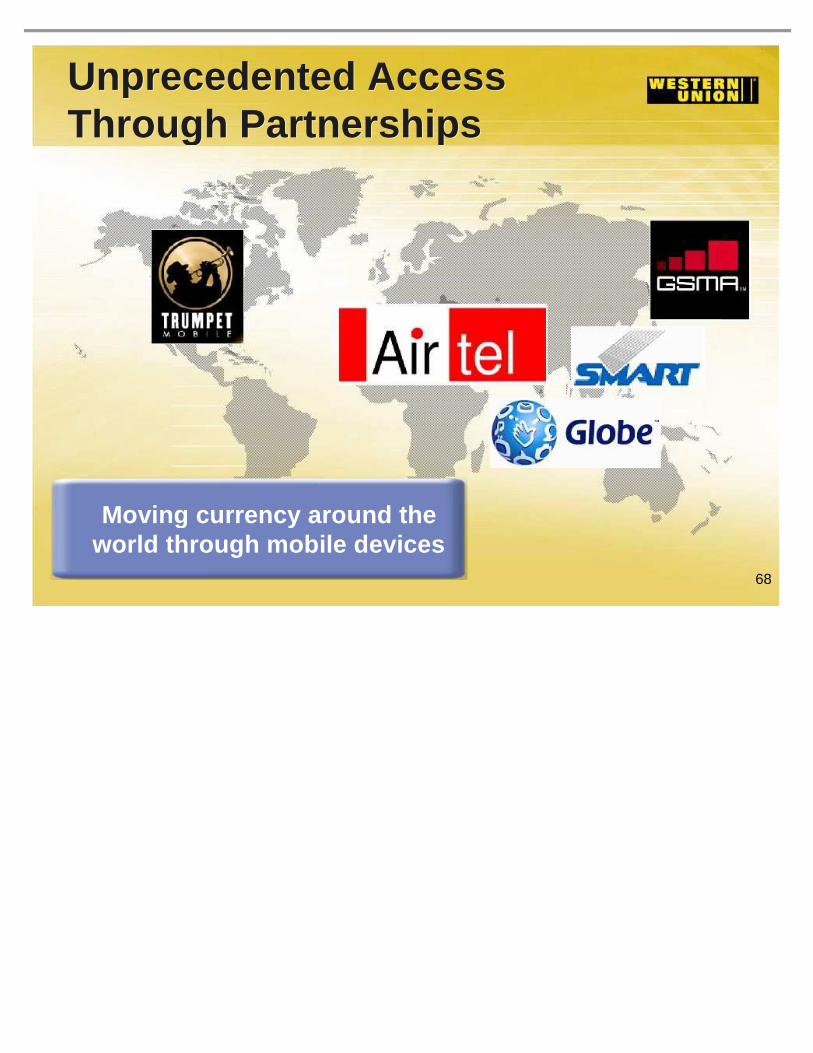
Mobile Money Transfer Addresses Customer Needs Mobile Money Transfer Addresses Customer Needs
• The mobile phone is the ideal device to move cash quickly…
– 3.3 billion people have cell phones*
– New channel, new customers
*Source: Wireless Intelligence
68
Unprecedented Access Through Partnerships Unprecedented Access Through Partnerships
Moving currency around the world through mobile devices

69
Summary Summary
• Strong brand
• Loyal customers
• Innovation pipeline
70
Scott Scheirman Executive Vice President & Chief Financial Officer

71
Long -Term Financial Drivers Long -Term Financial Drivers
• Strong revenue growth performance
• Solid margins today and opportunities to expand
• Large cash balances, solid credit ratings, ample liquidity
• Superior cash flow for growth and shareholder return
Creating long -term shareholder value

72
$2.7
Strong Revenue Growth Performance Strong Revenue Growth Performance
• Huge market opportunity
• Proven strategies
• Powerful brand
• Unmatched distribution network
Positioned well for global growth
2002 2007
12% CAGR
In Billions $4.9

73
Operating Income Margin Challenges Operating Income Margin Challenges
• Business mix shift – C2C geographic shift
– C2B product shift
• Acquisitions
• Public company expenses
Implemented initiatives to expand margins

74
Operating Income Margin Expansion Initiatives Operating Income Margin Expansion Initiatives
• Leverage global scale
• Reduce distribution costs
• Reduce operating expenses
• Optimize global investments
Long -term objective: margin expansion
2009 up to 50 basis points expansion

75
Leverage Global Scale Leverage Global Scale
• Global infrastructure established – Invested ahead of growth
– Scale we can leverage
– Generating margin expansion
• Leveraging Vigo worldwide – International expansion
– Expand product offerings
Global scale provides margin expansion opportunities

76
Reduce Distribution Costs Reduce Distribution Costs
• Leverage brand to reduce distribution costs
• Sign new agents at more favorable commission rates
Minimize impact of C2C geographic mix shift

77
Reduce Operating Expenses Reduce Operating Expenses
• Expense reduction programs in place
– Approximately $35 million in annual savings
• Continue expense reduction programs
• Long-term operating structure and expense objectives
Continue programs to reduce operating
expenses
78
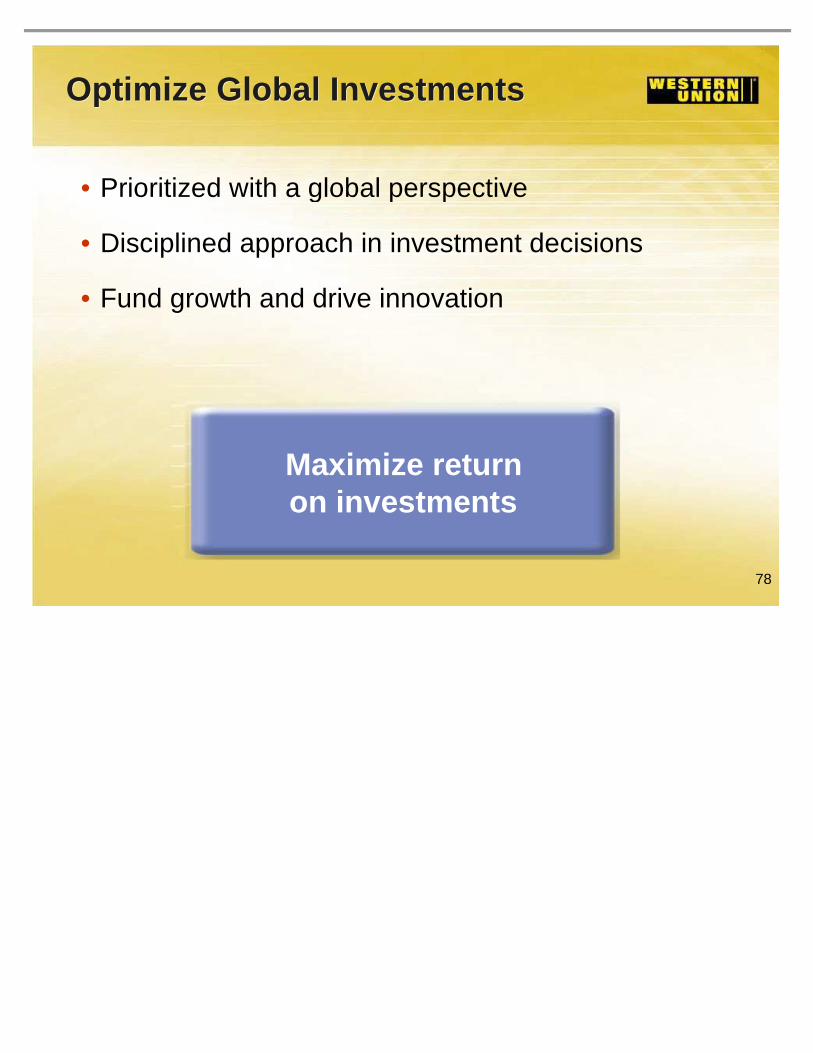
Optimize Global Investments Optimize Global Investments
• Prioritized with a global perspective
• Disciplined approach in investment decisions
• Fund growth and drive innovation
Maximize return on investments

79
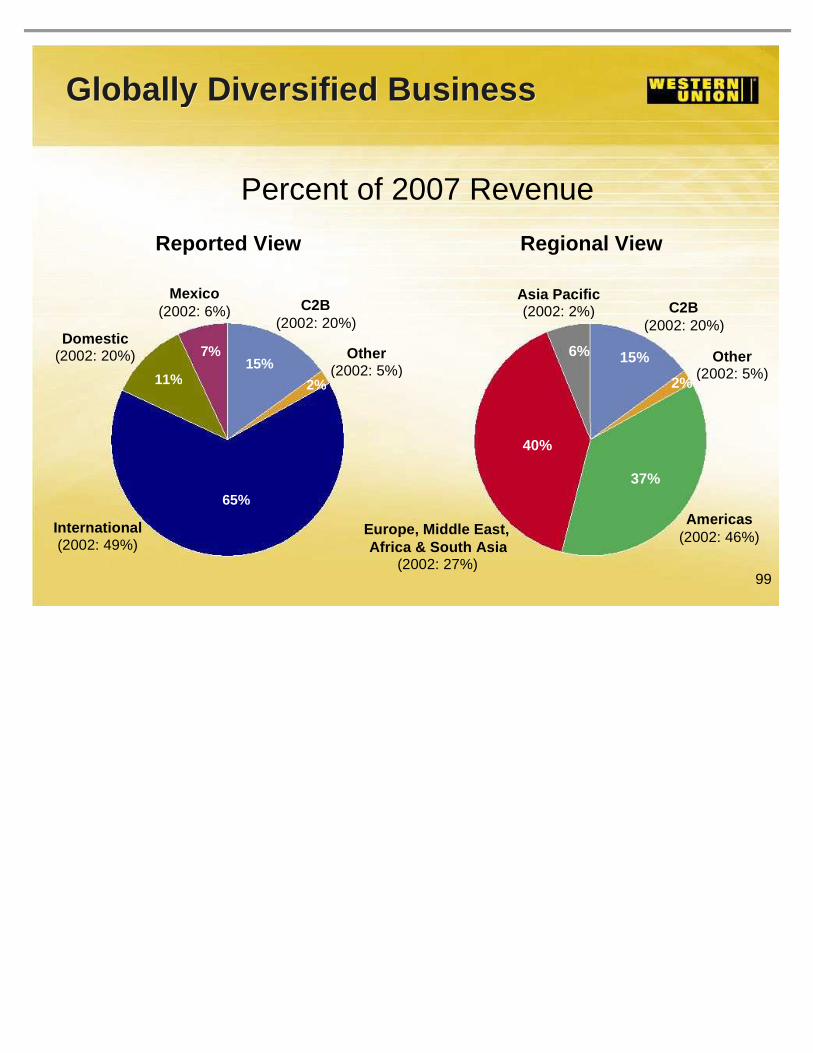
Reported View
65%
11% 15%
2%
7%
Globally Diversified Business Globally Diversified Business
Percent of 2007 Revenue
International
Mexico C2B
Other Domestic
Regional View
6%
2%
15%
40%
37%
Americas
Asia Pacific C2B
Other
Europe, Middle East, Africa & South Asia

80
Consumer -to -Consumer Consumer -to -Consumer
• Strong revenue growth driven by international business
• Margin impacted by business mix, Vigo and public company expenses
• Objective is to expand margins annually
$4,093
$2,075
2002 2007
15% CAGR
Revenue in Millions
26% 27%
2002 2007
Operating Income Margin

81
Americas Americas
• Challenging immigration and economic environment
• Vigo acquisition drove revenue growth at lower margins
• Objective is to improve revenue and margin trends
$1,792
$1,273
2002 2007
7% CAGR
28%
33%
2002 2007
Revenue in Millions
Operating Income Margin

82
Europe, Middle East, Africa, South Asia Europe, Middle East, Africa, South Asia
• Strong revenue growth driven by distribution and corridor expansion
• Leveraging scale and brand
• Objective is to expand margins
$750
2002 2007
22% CAGR
26%
19%
2002 2007
Revenue in Millions
Operating Income Margin
$1,986

83
Asia Pacific Asia Pacific
• Strong revenue growth driven by network and corridor expansion
• Invest ahead of growth in brand and operations
• Leveraging scale and brand
• Objective is to replicate EMEA / SA margin expansion
$315
$53
2002 2007
43% CAGR
20%
1%
2002 2007
Revenue in Millions
Operating Income Margin

84
Regional View Key Takeaways Regional View Key Takeaways
• Geographically balanced business
• Improving international margins
• Investing ahead of growth
– Margin expands as business scales
85
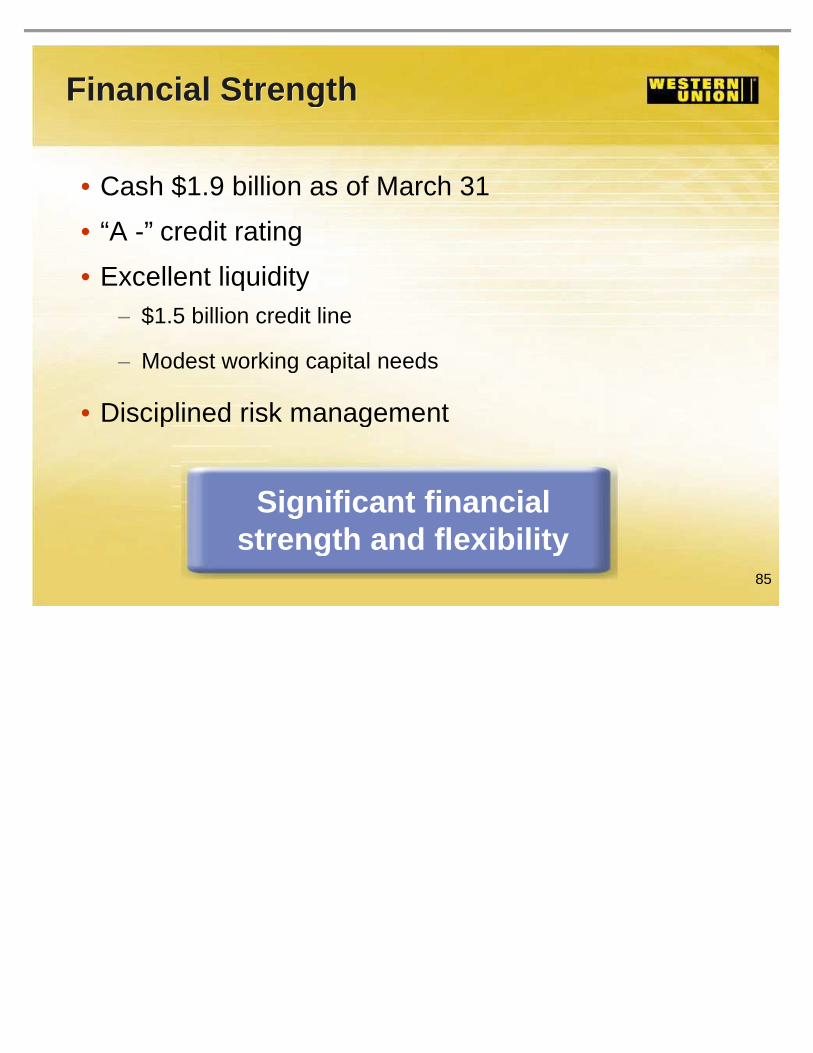
Financial Strength Financial Strength
• Cash $1.9 billion as of March 31
• “A -” credit rating
• Excellent liquidity – $1.5 billion credit line
– Modest working capital needs
• Disciplined risk management
Significant financial strength and flexibility
86
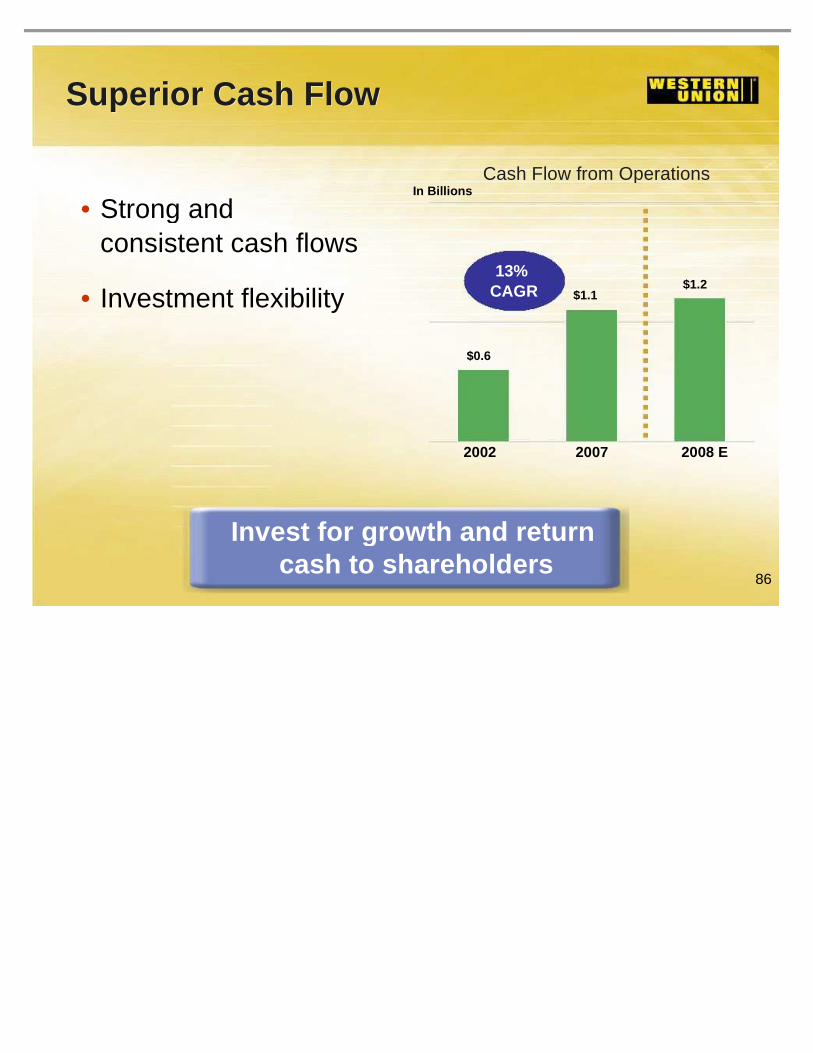
Invest for growth and return cash to shareholders
Superior Cash Flow Superior Cash Flow
• Strong and consistent cash flows
• Investment flexibility $1.2
$0.6
$1.1
2002 2007
In Billions
2008 E
13% CAGR
Cash Flow from Operations

87
Tax Rate Reduction Tax Rate Reduction
• International tax rates are significantly below the U.S. rate of 38%
• More international profit means lower overall tax rate
Expected lower tax rate = real cash benefit
29%
34%
30%
2003 2007 2008 E
Effective Tax Rate

88
Cash Priorities Cash Priorities
• Invest in business – Expected 2008 Cap Ex less than $200 million
• Acquire companies – Use cash flows and cash on balance sheet
• Return value to shareholders – Stock buyback
– Dividends
Fund growth + return value to shareholders

89
Return Value to Shareholders Return Value to Shareholders
• $1.3 billion repurchased since becoming public
• Board authorized additional $1 billion stock buyback
• $1.7 billion available for stock buyback
Objective in 2008 and 2009: return > 100% of net income to shareholders
2007 2008 E 2009 E
88%
> 100%
> 100%
Stock Buyback and Cash Dividends as a Percent of Net Income

90
2008 Financial Guidance 2008 Financial Guidance
• Revenue growth 9% to 11%
• Non-GAAP EPS $1.25 to $1.29 – Excluding $0.07 of restructuring expenses
and including $0.01 in cost savings
• GAAP EPS: $1.18 to $1.22 – Includes $80 million in restructuring expenses
Likely to be closer to the higher end of guidance
See appendix for a reconciliation of non-GAAP to GAAP measures.

91
Summary Summary
• Robust revenue growth performance
• Financial strength
• Superior cash flow
• Commitment to expand margin
Creating long -term shareholder value

92
2008 Investor ’s Meeting June 20, 2008

93
Right Company, Right Time Right Company, Right Time
• Execution of our growth strategy will drive long-term results
• Continue our leadership position and drive financial objectives
• Long-term financial objectives – Revenue growth of 10% to 12%
– EPS growth of 15% to 18%

94
Leading the Global Money Transfer Marketplace Leading the Global Money Transfer Marketplace • 345,000 agent locations
• Well-known brand
• Globally diverse revenue stream
• Scalable infrastructure
• Industry-leading compliance capabilities
• Solid financial position
Long -term EPS growth objective: 15% -18%

95
Appendix June 20, 2008

96
The financial information for the periods presented prior to September 29, 2006 are presented on a combined basis and represent those entities that were ultimately transferred to The Western Union Company ("Western Union") as part of its spin-off from First Data Corporation ("First Data") and does not reflect what our consolidated financial position, results of operations or cash flows would have been as a stand-alone company during the periods presented. These historical statements of income prior to September 29, 2006 include expense allocations for certain corporate functions historically provided to Western Union by First Data, including treasury, tax, accounting and reporting, mergers and acquisitions, risk management, legal, internal audit, procurement, human resources, investor relations and information technology. If possible, these allocations were made on a specific identification basis. Otherwise, the expenses related to services provided to Western Union by First Data were allocated to Western Union based on the relative percentages, as compared to First Data’s other businesses, of headcount or other appropriate methods depending on the nature of each item of cost to be allocated. The costs historically allocated to us by First Data for these services it has provided us were lower than the costs we incurred to obtain these services following the spin-off.
Presentation Presentation

97
Reconciliation of Non -GAAP Measures Reconciliation of Non -GAAP Measures
Western Union's management has presented 2008 earnings per share guidance, excluding restructuring and related expenses. Western Union's management believes this non-GAAP measure provides meaningful supplemental information regarding our operating results to assist management, investors, analysts, and others in understanding our financial results and to better analyze trends in our underlying business, because it provides consistency and comparability to prior periods.
A non-GAAP financial measure should not be considered in isolation or as a substitute for the most comparable GAAP financial measure. A non-GAAP financial measure reflects an additional way of viewing aspects of our operations that, when viewed with our GAAP results and the reconciliation to the corresponding GAAP financial measure, provide a more complete understanding of our business. Users of the financial statements are encouraged to review our financial statements and publicly-filed reports in their entirety and not to rely on any single financial measure. A reconciliation of the non-GAAP measure to the most directly comparable GAAP financial measure is included on the following slide:

98
Reconciliation of Non -GAAP Measures (continued)
Reconciliation of Non -GAAP Measures (continued)
(a) Projected 2008 restructuring and related expenses of $79 million relate to severance, outplacement and other employee related benefits; facility closure and migration of our IT infrastructure; other expenses related to relocation of various operations to existing Company facilities and third party providers, including hiring, training, relocation, travel, and professional fees; and increased security costs at the facilities being closed. Also, included in the facility closure expenses are non-cash expenses related to fixed asset and leasehold improvement write-offs and acceleration of depreciation and amortization. For purposes of calculating the "Adjusted 2008 EPS guidance, excluding estimated restructuring and related expenses," the EPS impact of $0.07 is net of an estimated income tax benefit of $30 million.
$ 1.29 $ 1.25 Adjusted 2008 EPS Guidance, excluding estimated restructuring and related expenses
0.07 0.07 Estimated restructuring and related expenses, net of income tax benefit (a)
Adjustment:
$ 1.22 $ 1.18 2008 EPS Guidance GAAP basis
Range
EPS Guidance
99
Reported View Regional View
6%
2%
15%
40%
37% 65%
11% 15%
2%
7%
Globally Diversified Business Globally Diversified Business
Percent of 2007 Revenue
International (2002: 49%)
Mexico (2002: 6%) C2B
(2002: 20%)
Other (2002: 5%)
Domestic (2002: 20%)
Americas (2002: 46%)
Asia Pacific (2002: 2%) C2B
(2002: 20%)
Other (2002: 5%)
Europe, Middle East, Africa & South Asia
(2002: 27%)