Western Regional Cool Season Legume Evaluation Trials
71
Western Regional Cool Season Legume Evaluation Trials & Nurseries Prepared by Grain Legume Genetics and Physiology Research Unit U.S. Department of Agriculture Agricultural Research Service and Department of Crop and Soil Sciences Washington State University Pullman, WA 99164-6434
Transcript of Western Regional Cool Season Legume Evaluation Trials

Western Regional Cool Season Legume Evaluation Trials &
Nurseries
Prepared by Grain Legume Genetics and Physiology Research Unit
U.S. Department of Agriculture Agricultural Research Service
and
Department of Crop and Soil Sciences
Washington State University Pullman, WA 99164-6434
i
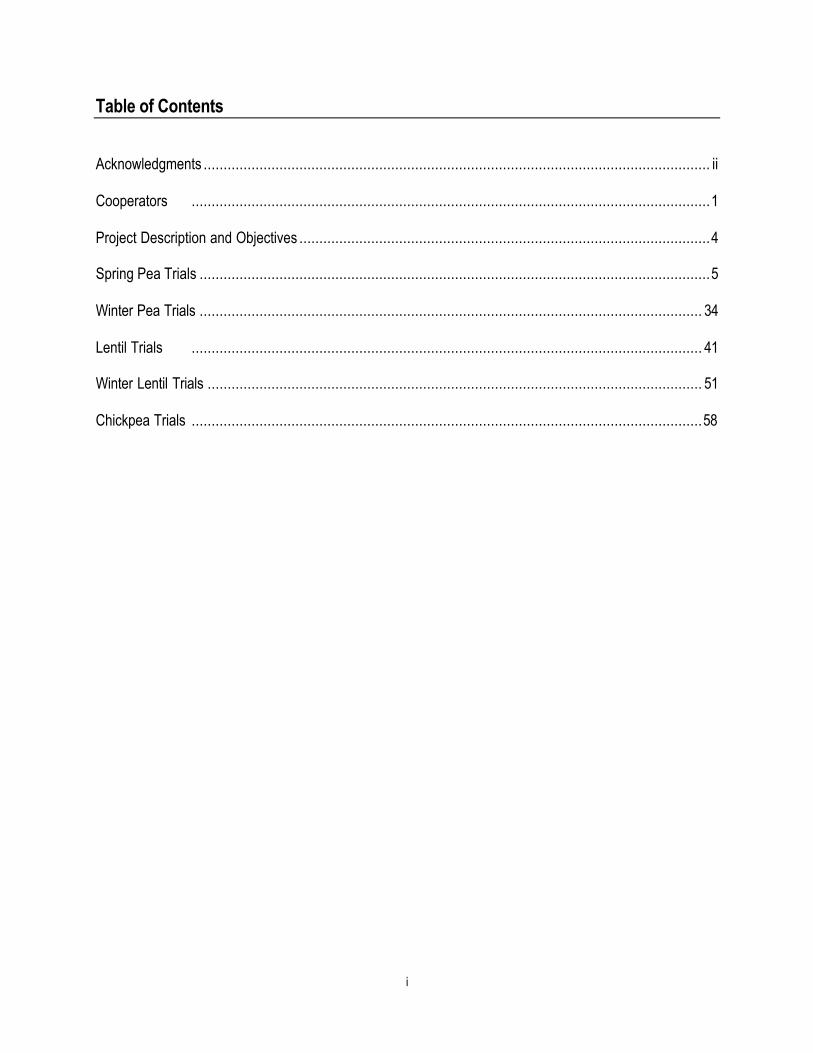
Table of Contents
Acknowledgments ............................................................................................................................... ii
Cooperators ..................................................................................................................................1
Project Description and Objectives .......................................................................................................4
Spring Pea Trials ................................................................................................................................5
Winter Pea Trials .............................................................................................................................. 34
Lentil Trials ................................................................................................................................ 41
Winter Lentil Trials ............................................................................................................................ 51
Chickpea Trials ................................................................................................................................58

ii
Acknowledgements We would like to acknowledge contributions of the Cool Season Food Legume Program to the Grain Legume Variety Development program.
1
Cooperators University of Idaho Stephen Guy Department of Plant & Soil Sciences Entomology Moscow, ID 83843-2339 (208) 885-6744 [email protected] Ying Wu Department of Plant & Soil Sciences Entomology Moscow, ID 83843-2339 (208) 885-5965 [email protected] Montana State University Chengci Chen Central Agricultural Research Center HC90 Box 20 Mocassin, MT 59462 (406) 423-5421 [email protected] Jeff Holmes Department of Land Resources & Environmental Sciences PO Box 173120 Bozeman, MT 59717-3120 (406) 994-5119 [email protected] Duane Johnson Northwestern Agricultural Research Center 4570 Mt. 35 Kalispell, MT 59901 (406) 755-4303 [email protected]
Perry Miller Department of Land Resources & Environmental Sciences PO Box 173120 Bozeman, MT 59717-3120 (406) 994-5431 [email protected] Karnes Neill Central Agricultural Research Center HC90 Box 20 Mocassin, MT 59462 (406) 423-5421 [email protected] Louise Strang Northwestern Agricultural Research Center 4570 Mt. 35 Kalispell, MT 59901 (406) 755-4303 [email protected] Dave Wichman Central Agricultural Research Center HC90 Box 20 Mocassin, MT 59462 (406) 423-5421 [email protected] University of Nebraska David Baltensperger High Plains Ag Laboratory 3257 Rd 109 Sidney, NE 69162 (308) 632-1261 [email protected] Glen Frickel High Plains Ag Laboratory 3257 Rd 109 Sidney, NE 69162 (308) 632-3918 [email protected]

2
North Dakota State University Erik Ericksmoen Hettinger Research & Extension Center 102 Hwy 12 W, PO Box 1377 Hettinger, ND 58639 (701) 567-4323 [email protected] Mark Halvorson North Central Research & Extension Center 5400 Highway 83 S Minot, ND 58701-7645 (701) 857-7677 [email protected] Randy Mehlhof (701) 256-2582 [email protected] Neil Riveland Williston Research Extension Center 14120 Hwy 2 Williston, ND 58801 (701) 774-4315 [email protected] Blaine Schatz Carrington Research Extension Center 663 Hwy 281 N, PO Box 219 Carrington, ND 58421 (701) 652-2951 [email protected] Steve Zwinger Carrington Research Extension Center 663 Hwy 281 N, PO Box 219 Carrington, ND 58421 (701) 652-2951 [email protected]
Oregon State University Chris Humphreys Columbia Basin Ag Research Center 48037 Tubbs Ranch Rd Pendleton, OR 97801 541-278-4351 [email protected] Stephen Machado Columbia Basin Ag Research Center 48037 Tubbs Ranch Rd Pendleton, OR 97801 (541) 278-4416 [email protected] Brian Tuck Wasco County Extension Office 400 E Scenic Dr, Ste 2.278 The Dalles, OR 97058 (541) 296-5496 [email protected] South Dakota State University John Rickertsen West River Agricultural Center 1905 Plaza Blv Rapid City, SD 57702-9302 (605) 394-2236 [email protected] USDA, Agricultural Research Service Chris Hoagland USDA-ARS-GLGP 303 Johnson Hall Pullman, WA 99164-6434 (509) 335-8737 [email protected] Fred Muehlbauer USDA-ARS-GLGP 303 Johnson Hall Pullman, WA 99164-6434 (509) 335-9521 [email protected]
3
Kevin McPhee USDA-ARS-GLGP 303 Johnson Hall Pullman, WA 99164-6434 (509) 335-9522 [email protected] Rick Short USDA-ARS-GLGP 303 Johnson Hall Pullman, WA 99164-6434 (509) 335-8737 [email protected] Washington State University Dennis Tonks 303 6th Street Davenport, WA 99122 (509) 725-4171 [email protected] University of Wyoming Jim Krall Research & Extension Center Rt. 1, Box 374 Torrington, WY 82240 (307) 532-7194 [email protected] Abdel Mesbah Agricultural Research Station 747 Road 9 Powell, WY 82435 (307) 754-2223 [email protected] Jerry Nachtman Research & Extension Center Rt. 1, Box 374 Torrington, WY 82240 (307) 532-7126 [email protected]
4
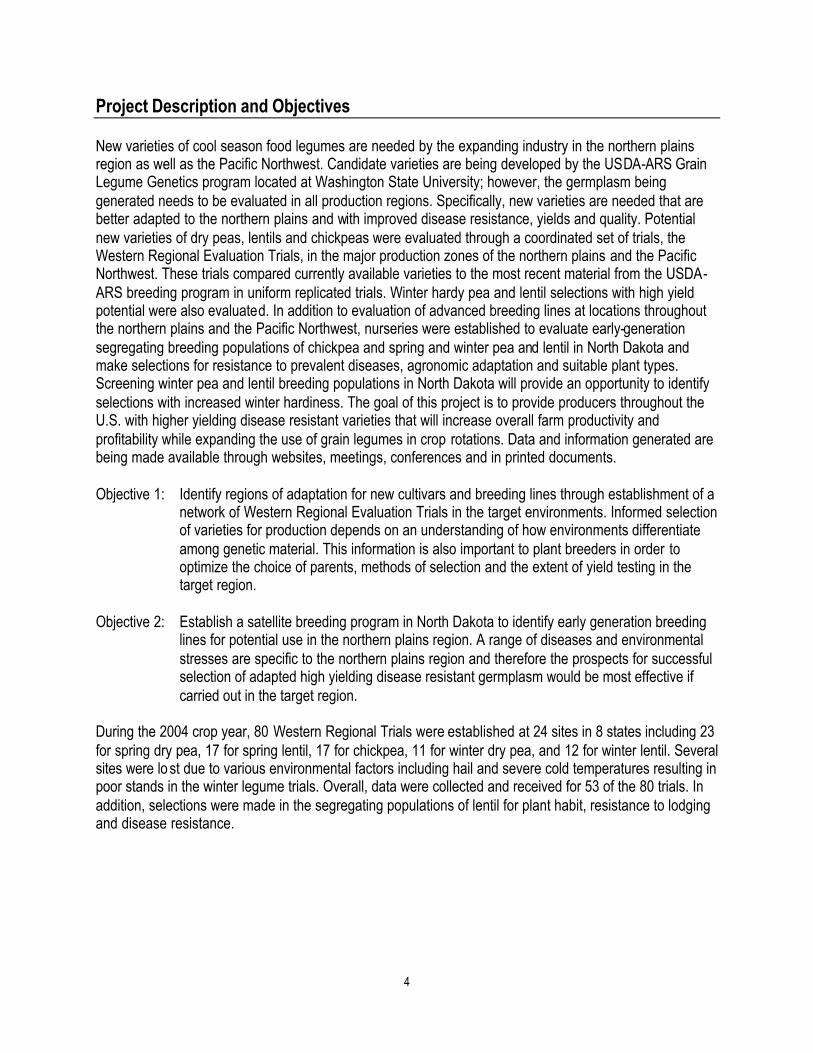
Project Description and Objectives New varieties of cool season food legumes are needed by the expanding industry in the northern plains region as well as the Pacific Northwest. Candidate varieties are being developed by the USDA-ARS Grain Legume Genetics program located at Washington State University; however, the germplasm being generated needs to be evaluated in all production regions. Specifically, new varieties are needed that are better adapted to the northern plains and with improved disease resistance, yields and quality. Potential new varieties of dry peas, lentils and chickpeas were evaluated through a coordinated set of trials, the Western Regional Evaluation Trials, in the major production zones of the northern plains and the Pacific Northwest. These trials compared currently available varieties to the most recent material from the USDA-ARS breeding program in uniform replicated trials. Winter hardy pea and lentil selections with high yield potential were also evaluated. In addition to evaluation of advanced breeding lines at locations throughout the northern plains and the Pacific Northwest, nurseries were established to evaluate early-generation segregating breeding populations of chickpea and spring and winter pea and lentil in North Dakota and make selections for resistance to prevalent diseases, agronomic adaptation and suitable plant types. Screening winter pea and lentil breeding populations in North Dakota will provide an opportunity to identify selections with increased winter hardiness. The goal of this project is to provide producers throughout the U.S. with higher yielding disease resistant varieties that will increase overall farm productivity and profitability while expanding the use of grain legumes in crop rotations. Data and information generated are being made available through websites, meetings, conferences and in printed documents. Objective 1: Identify regions of adaptation for new cultivars and breeding lines through establishment of a
network of Western Regional Evaluation Trials in the target environments. Informed selection of varieties for production depends on an understanding of how environments differentiate among genetic material. This information is also important to plant breeders in order to optimize the choice of parents, methods of selection and the extent of yield testing in the target region.
Objective 2: Establish a satellite breeding program in North Dakota to identify early generation breeding
lines for potential use in the northern plains region. A range of diseases and environmental stresses are specific to the northern plains region and therefore the prospects for successful selection of adapted high yielding disease resistant germplasm would be most effective if carried out in the target region.
During the 2004 crop year, 80 Western Regional Trials were established at 24 sites in 8 states including 23 for spring dry pea, 17 for spring lentil, 17 for chickpea, 11 for winter dry pea, and 12 for winter lentil. Several sites were lo st due to various environmental factors including hail and severe cold temperatures resulting in poor stands in the winter legume trials. Overall, data were collected and received for 53 of the 80 trials. In addition, selections were made in the segregating populations of lentil for plant habit, resistance to lodging and disease resistance.

5
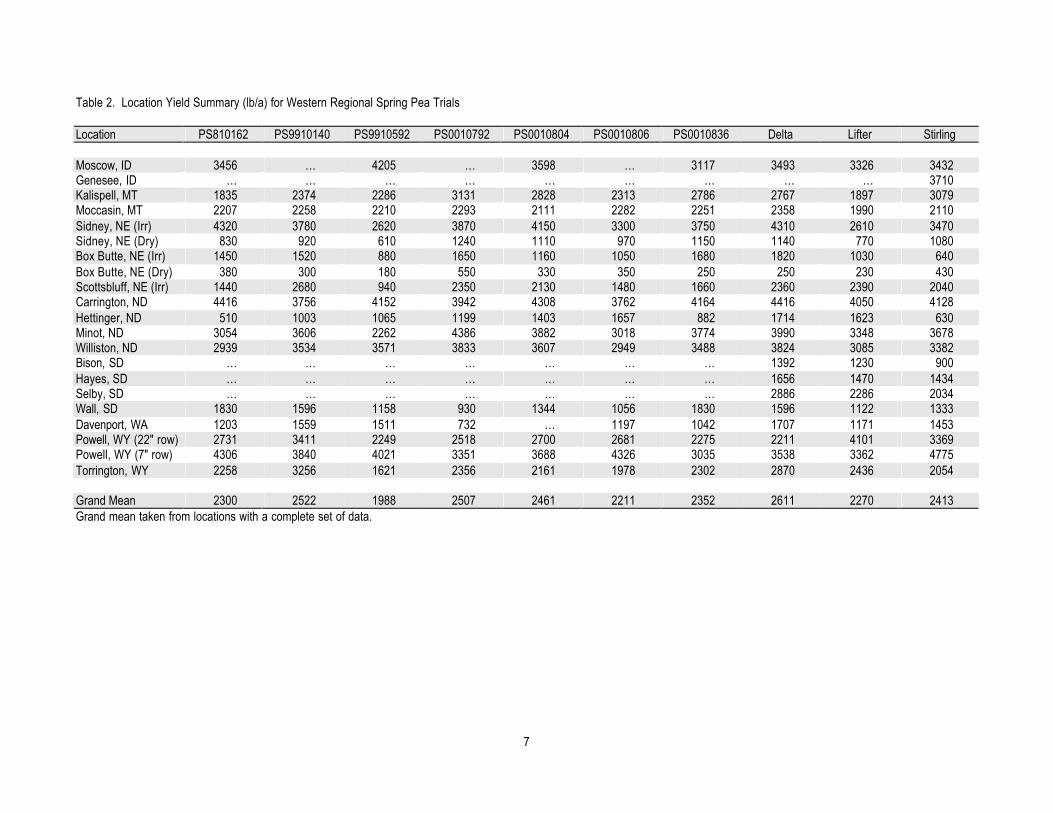
Spring Pea Trials Ten spring pea entries in the Western Regional Yield Trial were evaluated at 19 locations across seven states in 2004 (Table 1). The entries comprised three checks and seven breeding lines including four green and three yellow cotyledon types. The checks were ‘Lifter’ (green), ‘Stirling’ (green) and ‘Delta’ (yellow). The trials were conducted primarily under dryland conditions; however, three trials in Nebraska and one in Wyoming were irrigated. Information regarding experimental design, location and specific observations for some of the locations are included below. Overall means are presented for each entry based only on those locations including all entries (Table 2). Average yield for the checks was 2431 lb/a and Delta (2611 lb/a) was the highest yielding line across the trials. Stirling, a recently released upright green cotyledon variety, produced an average yield of 2413 lb/a. The highest yielding breeding lines were PS9910140 (yellow) (2522 lb/a) followed by PS0010792 (green) (2507 lb/a) and PS0010804 (green) (2461 lb/a). Nebraska Grain pea trials were planted at five locations. Irrigated and dryland trials were planted southwest of Hemingford in Box Butte county. An irrigated trial was planted at Scottsbluff, and irrigated and dryland trials were planted near Sidney. Weeds were a problem in the irrigated Box Butte and Scottsbluff trials. Extreme drought reduced yields considerably at the Box Butte dryland location. A few timely rains produced fair yields at the Sidney dryland location in spite of severe drought. Cool June weather was beneficial to all locations. (Glen Frickel) South Dakota The Selby site had some problems with root disease and was highly variable, so results from that location should not be used for yield comparisons. The Wall location suffer from heavy rains, hail and wind just before harvest. There was a lot of shatter especially on the early varieties, I think easily 15 Bu/A was left on the ground. The other two locations, like most of western South Dakota were dry again this summer, which probably was the biggest factor limiting yield. (John Rickertsen) Wyoming Ten lines of dry peas were grown at the Powell Research and Extension Center (elevation: 4400 ft.) in northwestern Wyoming. The soil type was a Garland clay loam (fine, mixed, mesic typic Haplargid, 40% sand, 24% silt, and 36% clay) with 1.2% organic matter and pH 7.2. Dry pea seeds were planted in rows spaced 22 or 7 inches apart. Plots were established under furrow irrigation and all lines were arranged in a randomized complete block design with four replications (Abdel Mesbah)

6
Table 1. Summary of Locations Participating in the 2004 Spring Pea Western Regional Yield Trial Nurseries Location Contact Conditions No. Sent Data Returned Data Lost
Idaho Moscow Stephen Guy, Ying Wu Dryland ü ü - NezPerce Stephen Guy, Ying Wu Dryland ü - ü Genesee Stephen Guy, Ying Wu Dryland – No-till ü ü -
Montana Kalispell Louise Strang, Duane Johnson Dryland ü ü - Moccasin Chengci Chen, Karnes Neill Dryland ü ü -
Nebraska Box Butte David Baltensperger, Glenn Frickel Dryland ü ü - Sidney David Baltensperger, Glenn Frickel Dryland ü ü - Box Butte David Baltensperger, Glenn Frickel Irrigated ü ü - Scottsbluff David Baltensperger, Glenn Frickel Irrigated ü ü - Sidney David Baltensperger, Glenn Frickel Irrigated ü ü -
North Dakota Carrington Blaine Schatz, Steve Zwinger Dryalnd ü ü - Hettinger Eric Eriksmoen Dryland ü ü - Minot Mark Halvorson Dryland ü ü - Williston Neil Riveland Dryland ü ü -
South Dakota Bison John Rickertson Dryland ü ü - Hayes John Rickertson Dryland ü ü - Selby John Rickertson Dryland ü ü - Wall John Rickertson Dryland ü ü -
Washington Davenport Dennis Tonks Dryland ü ü -
Wyoming Powell Abdel Mesbah Dryland üü üü - Torrington Jim Krall, Jerry Nachtman Dryland ü - ü Torrington Jim Krall, Jerry Nachtman Irrigated ü ü - Grand Totals 23 21 2
7
Table 2. Location Yield Summary (lb/a) for Western Regional Spring Pea Trials Location PS810162 PS9910140 PS9910592 PS0010792 PS0010804 PS0010806 PS0010836 Delta Lifter Stirling Moscow, ID 3456 … 4205 … 3598 … 3117 3493 3326 3432 Genesee, ID … … … … … … … … … 3710 Kalispell, MT 1835 2374 2286 3131 2828 2313 2786 2767 1897 3079 Moccasin, MT 2207 2258 2210 2293 2111 2282 2251 2358 1990 2110 Sidney, NE (Irr) 4320 3780 2620 3870 4150 3300 3750 4310 2610 3470 Sidney, NE (Dry) 830 920 610 1240 1110 970 1150 1140 770 1080 Box Butte, NE (Irr) 1450 1520 880 1650 1160 1050 1680 1820 1030 640 Box Butte, NE (Dry) 380 300 180 550 330 350 250 250 230 430 Scottsbluff, NE (Irr) 1440 2680 940 2350 2130 1480 1660 2360 2390 2040 Carrington, ND 4416 3756 4152 3942 4308 3762 4164 4416 4050 4128 Hettinger, ND 510 1003 1065 1199 1403 1657 882 1714 1623 630 Minot, ND 3054 3606 2262 4386 3882 3018 3774 3990 3348 3678 Williston, ND 2939 3534 3571 3833 3607 2949 3488 3824 3085 3382 Bison, SD … … … … … … … 1392 1230 900 Hayes, SD … … … … … … … 1656 1470 1434 Selby, SD … … … … … … … 2886 2286 2034 Wall, SD 1830 1596 1158 930 1344 1056 1830 1596 1122 1333 Davenport, WA 1203 1559 1511 732 … 1197 1042 1707 1171 1453 Powell, WY (22" row) 2731 3411 2249 2518 2700 2681 2275 2211 4101 3369 Powell, WY (7" row) 4306 3840 4021 3351 3688 4326 3035 3538 3362 4775 Torrington, WY 2258 3256 1621 2356 2161 1978 2302 2870 2436 2054 Grand Mean 2300 2522 1988 2507 2461 2211 2352 2611 2270 2413 Grand mean taken from locations with a complete set of data.

8
Table 3. Green Dry Pea Variety Performance Results at Moscow, ID - 2004 Data from Stephen Guy and Ying Wu, University of Idaho Variety or Selection Seed Yield Seed Weight Vine Length Canopy Height
lb/acre g/100 inches inches Ariel 3356 19.3 29 29 Bluebird 3307 26.2 23 22 Camry 3063 25.5 20 20 Columbian 3322 20.0 42 16 Cooper 3902 27.9 31 31 Cruiser 3056 20.7 32 32 Journey 3319 16.7 47 17 Lifter 3326 21.4 32 14 Karita 3436 26.7 30 30 K 2 3444 21.6 30 30 Monarch 3288 21.2 26 26 Nitouche 3338 25.6 32 32 Pacifica 3251 22.1 32 27 Stirling 3432 21.1 26 26 Stratus 3665 26.4 23 23 Supra 2917 34.1 25 25 Toledo 2650 25.6 29 29 Ceb 1090 3587 27.7 32 32 PS 810162 3456 23.6 28 26 PS9910592 4205 20.8 28 18 PS0010804 3598 24.4 27 27 Pro 011-3172 3130 22.7 32 32 AP-18 3364 21.9 31 31 Average 3366 23.6 30 26 LSD (0.10) 597 1.1 1 5 CV (%) 15 3.8 9 15
9
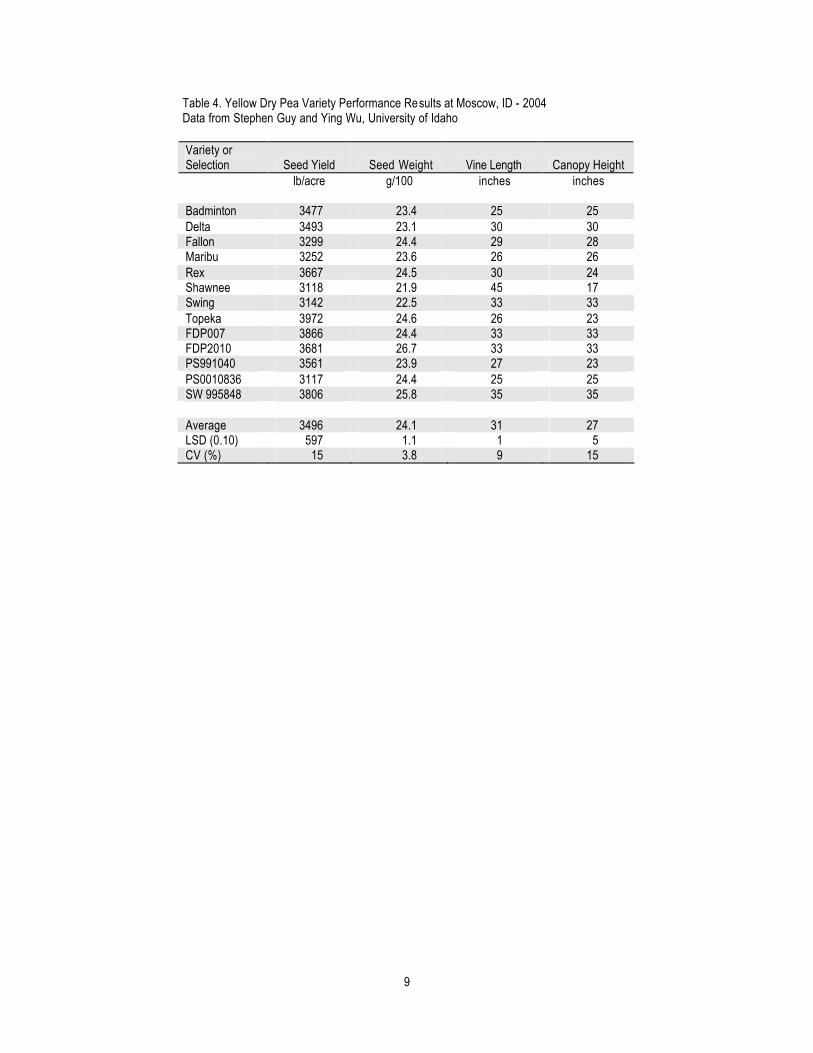
Table 4. Yellow Dry Pea Variety Performance Results at Moscow, ID - 2004 Data from Stephen Guy and Ying Wu, University of Idaho Variety or Selection Seed Yield Seed Weight Vine Length Canopy Height
lb/acre g/100 inches inches Badminton 3477 23.4 25 25 Delta 3493 23.1 30 30 Fallon 3299 24.4 29 28 Maribu 3252 23.6 26 26 Rex 3667 24.5 30 24 Shawnee 3118 21.9 45 17 Swing 3142 22.5 33 33 Topeka 3972 24.6 26 23 FDP007 3866 24.4 33 33 FDP2010 3681 26.7 33 33 PS991040 3561 23.9 27 23 PS0010836 3117 24.4 25 25 SW 995848 3806 25.8 35 35 Average 3496 24.1 31 27 LSD (0.10) 597 1.1 1 5 CV (%) 15 3.8 9 15
10
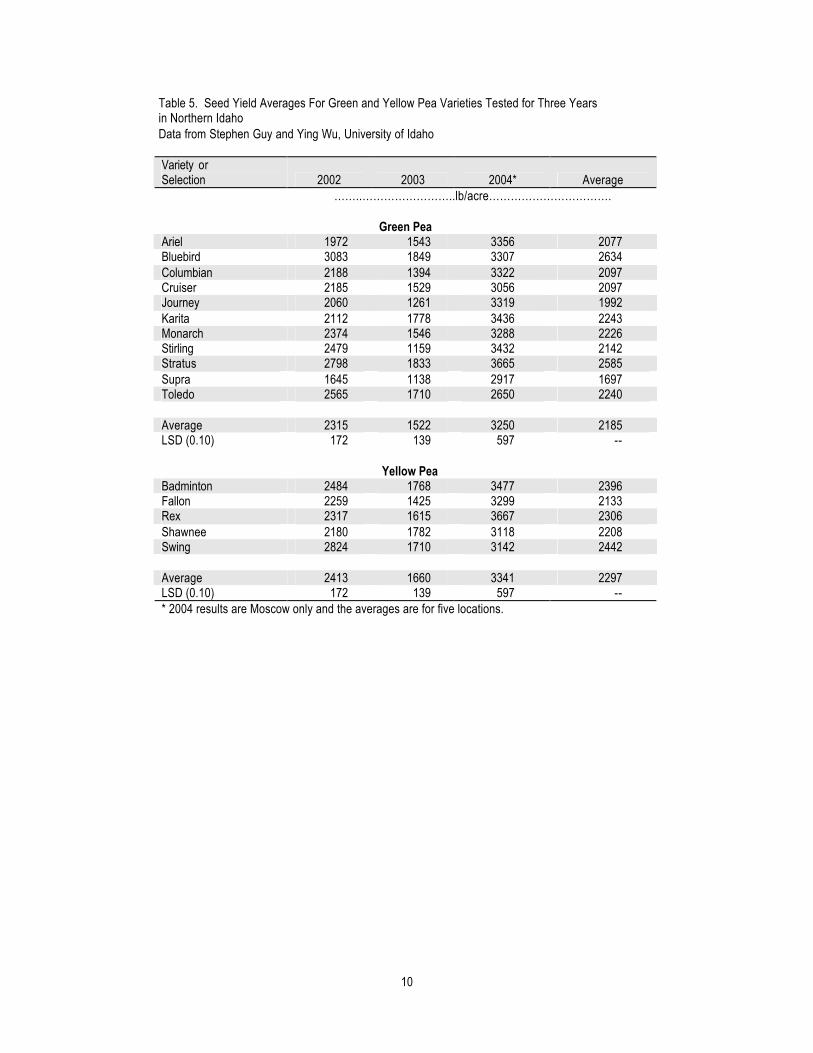
Table 5. Seed Yield Averages For Green and Yellow Pea Varieties Tested for Three Years in Northern Idaho Data from Stephen Guy and Ying Wu, University of Idaho Variety or Selection 2002 2003 2004* Average ……..……………………..lb/acre…………………………….
Green Pea
Ariel 1972 1543 3356 2077 Bluebird 3083 1849 3307 2634 Columbian 2188 1394 3322 2097 Cruiser 2185 1529 3056 2097 Journey 2060 1261 3319 1992 Karita 2112 1778 3436 2243 Monarch 2374 1546 3288 2226 Stirling 2479 1159 3432 2142 Stratus 2798 1833 3665 2585 Supra 1645 1138 2917 1697 Toledo 2565 1710 2650 2240 Average 2315 1522 3250 2185 LSD (0.10) 172 139 597 --
Yellow Pea Badminton 2484 1768 3477 2396 Fallon 2259 1425 3299 2133 Rex 2317 1615 3667 2306 Shawnee 2180 1782 3118 2208 Swing 2824 1710 3142 2442 Average 2413 1660 3341 2297 LSD (0.10) 172 139 597 -- * 2004 results are Moscow only and the averages are for five locations.

11
Table 6. No-Till Dry Pea Variety Performance Results at Genesee, ID – 2004 Data from Stephen Guy and Ying Wu, University of Idaho Variety or Selection
Seed Yield
Seed Weight Vine Length Canopy Height
Erect Index
lb/acre g/100 inches inches 0.0-1.0 Ariel 3326 19.0 37 20 0.5 Bluebird 3637 24.1 30 21 0.7 Camry 3782 21.9 30 21 0.7 Columbian 2845 17.5 60 17 0.3 Cruiser 3322 19.9 36 21 0.6 Joel 3296 21.8 54 20 0.4 Karita 3178 24.7 35 29 0.8 K 2 3350 20.4 38 25 0.7 Monarch 3668 19.8 33 18 0.5 Stirling 3710 19.8 35 16 0.5 Stratus 3537 21.7 36 16 0.4 Supra 2906 31.5 36 17 0.5 Toledo 3452 24.7 38 27 0.7 Badminton 3990 23.1 33 16 0.5 Fallon 3771 25.8 38 15 0.4 Maribu 3611 23.3 35 18 0.5 Rex 3932 22.1 41 19 0.5 Shawnee 3120 22.0 46 16 0.3 Swing 3824 21.5 34 24 0.7 Topeka 3833 20.9 33 16 0.5 Average 3505 22.3 38 20 0.5 LSD (0.10) 337 1.9 6 3 -- CV (%) 8 7.1 13 14 --
12
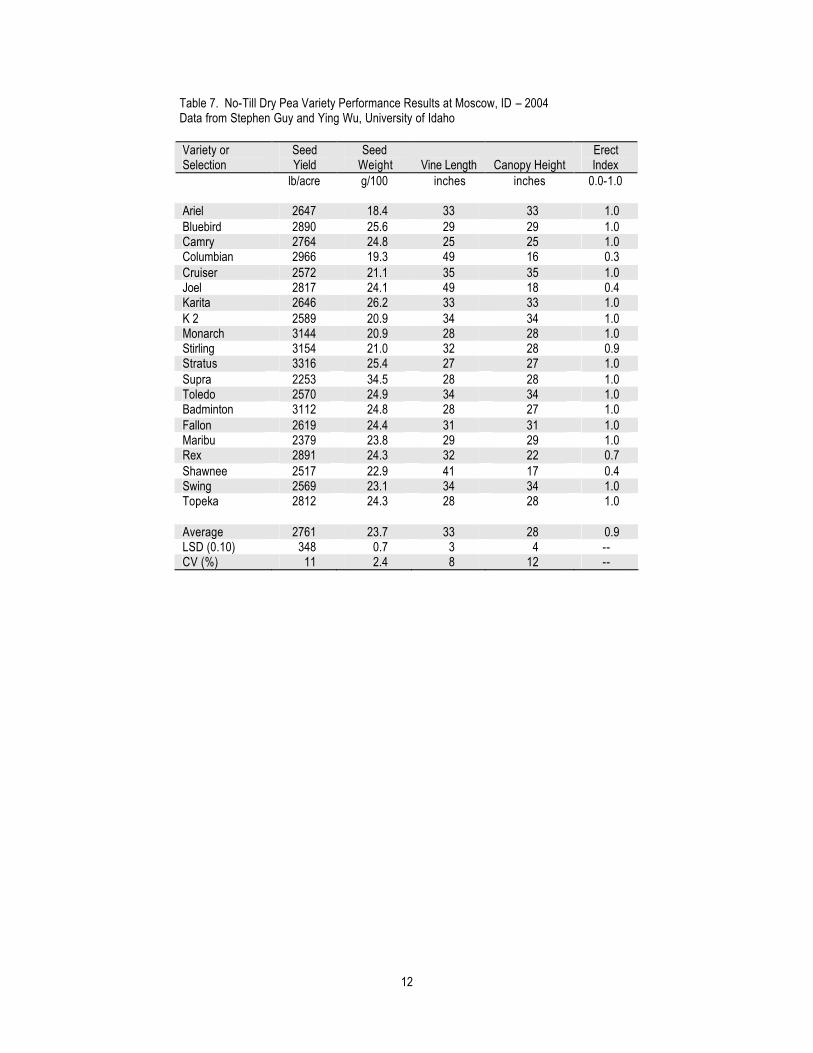
Table 7. No-Till Dry Pea Variety Performance Results at Moscow, ID – 2004 Data from Stephen Guy and Ying Wu, University of Idaho Variety or Selection
Seed Yield
Seed Weight Vine Length Canopy Height
Erect Index
lb/acre g/100 inches inches 0.0-1.0 Ariel 2647 18.4 33 33 1.0 Bluebird 2890 25.6 29 29 1.0 Camry 2764 24.8 25 25 1.0 Columbian 2966 19.3 49 16 0.3 Cruiser 2572 21.1 35 35 1.0 Joel 2817 24.1 49 18 0.4 Karita 2646 26.2 33 33 1.0 K 2 2589 20.9 34 34 1.0 Monarch 3144 20.9 28 28 1.0 Stirling 3154 21.0 32 28 0.9 Stratus 3316 25.4 27 27 1.0 Supra 2253 34.5 28 28 1.0 Toledo 2570 24.9 34 34 1.0 Badminton 3112 24.8 28 27 1.0 Fallon 2619 24.4 31 31 1.0 Maribu 2379 23.8 29 29 1.0 Rex 2891 24.3 32 22 0.7 Shawnee 2517 22.9 41 17 0.4 Swing 2569 23.1 34 34 1.0 Topeka 2812 24.3 28 28 1.0 Average 2761 23.7 33 28 0.9 LSD (0.10) 348 0.7 3 4 -- CV (%) 11 2.4 8 12 --
13
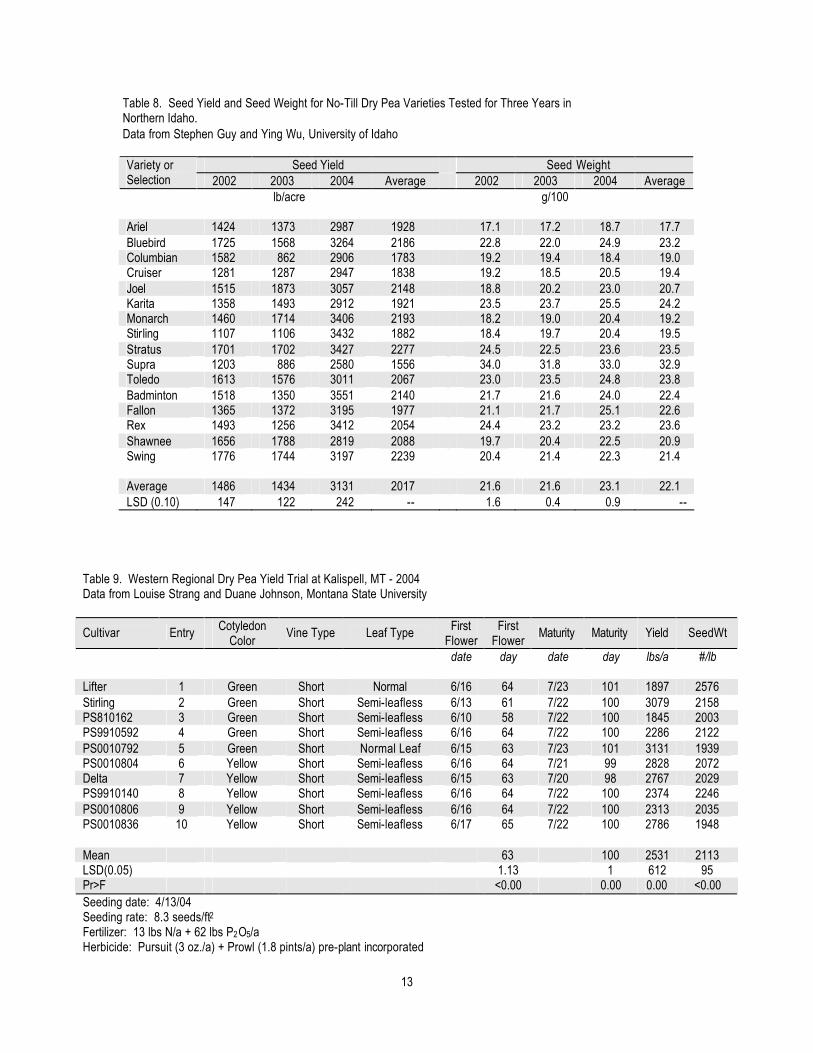
Table 8. Seed Yield and Seed Weight for No-Till Dry Pea Varieties Tested for Three Years in Northern Idaho. Data from Stephen Guy and Ying Wu, University of Idaho
Seed Yield Seed Weight Variety or Selection 2002 2003 2004 Average 2002 2003 2004 Average lb/acre g/100 Ariel 1424 1373 2987 1928 17.1 17.2 18.7 17.7 Bluebird 1725 1568 3264 2186 22.8 22.0 24.9 23.2 Columbian 1582 862 2906 1783 19.2 19.4 18.4 19.0 Cruiser 1281 1287 2947 1838 19.2 18.5 20.5 19.4 Joel 1515 1873 3057 2148 18.8 20.2 23.0 20.7 Karita 1358 1493 2912 1921 23.5 23.7 25.5 24.2 Monarch 1460 1714 3406 2193 18.2 19.0 20.4 19.2 Stirling 1107 1106 3432 1882 18.4 19.7 20.4 19.5 Stratus 1701 1702 3427 2277 24.5 22.5 23.6 23.5 Supra 1203 886 2580 1556 34.0 31.8 33.0 32.9 Toledo 1613 1576 3011 2067 23.0 23.5 24.8 23.8 Badminton 1518 1350 3551 2140 21.7 21.6 24.0 22.4 Fallon 1365 1372 3195 1977 21.1 21.7 25.1 22.6 Rex 1493 1256 3412 2054 24.4 23.2 23.2 23.6 Shawnee 1656 1788 2819 2088 19.7 20.4 22.5 20.9 Swing 1776 1744 3197 2239 20.4 21.4 22.3 21.4 Average 1486 1434 3131 2017 21.6 21.6 23.1 22.1 LSD (0.10) 147 122 242 -- 1.6 0.4 0.9 --
Table 9. Western Regional Dry Pea Yield Trial at Kalispell, MT - 2004 Data from Louise Strang and Duane Johnson, Montana State University
Cultivar Entry Cotyledon Color
Vine Type Leaf Type First Flower
First Flower
Maturity Maturity Yield SeedWt
date day date day lbs/a #/lb Lifter 1 Green Short Normal 6/16 64 7/23 101 1897 2576 Stirling 2 Green Short Semi-leafless 6/13 61 7/22 100 3079 2158 PS810162 3 Green Short Semi-leafless 6/10 58 7/22 100 1845 2003 PS9910592 4 Green Short Semi-leafless 6/16 64 7/22 100 2286 2122 PS0010792 5 Green Short Normal Leaf 6/15 63 7/23 101 3131 1939 PS0010804 6 Yellow Short Semi-leafless 6/16 64 7/21 99 2828 2072 Delta 7 Yellow Short Semi-leafless 6/15 63 7/20 98 2767 2029 PS9910140 8 Yellow Short Semi-leafless 6/16 64 7/22 100 2374 2246 PS0010806 9 Yellow Short Semi-leafless 6/16 64 7/22 100 2313 2035 PS0010836 10 Yellow Short Semi-leafless 6/17 65 7/22 100 2786 1948 Mean 63 100 2531 2113 LSD(0.05) 1.13 1 612 95 Pr>F <0.00 0.00 0.00 <0.00 Seeding date: 4/13/04 Seeding rate: 8.3 seeds/ft2 Fertilizer: 13 lbs N/a + 62 lbs P2O5/a Herbicide: Pursuit (3 oz./a) + Prowl (1.8 pints/a) pre-plant incorporated
14
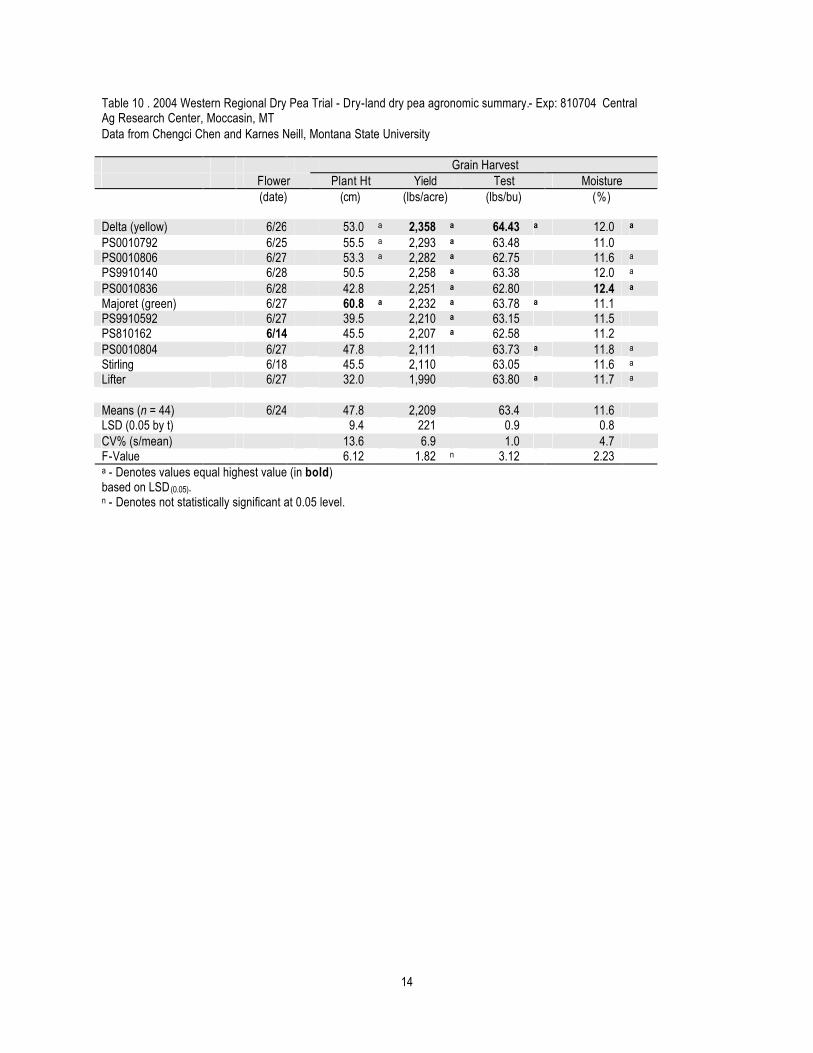
Table 10 . 2004 Western Regional Dry Pea Trial - Dry-land dry pea agronomic summary.- Exp: 810704 Central Ag Research Center, Moccasin, MT Data from Chengci Chen and Karnes Neill, Montana State University Grain Harvest Flower Plant Ht Yield Test Moisture (date) (cm) (lbs/acre) (lbs/bu) (%)
Delta (yellow) 6/26 53.0 a 2,358 a 64.43 a 12.0 a PS0010792 6/25 55.5 a 2,293 a 63.48 11.0 PS0010806 6/27 53.3 a 2,282 a 62.75 11.6 a PS9910140 6/28 50.5 2,258 a 63.38 12.0 a PS0010836 6/28 42.8 2,251 a 62.80 12.4 a Majoret (green) 6/27 60.8 a 2,232 a 63.78 a 11.1 PS9910592 6/27 39.5 2,210 a 63.15 11.5 PS810162 6/14 45.5 2,207 a 62.58 11.2 PS0010804 6/27 47.8 2,111 63.73 a 11.8 a Stirling 6/18 45.5 2,110 63.05 11.6 a Lifter 6/27 32.0 1,990 63.80 a 11.7 a Means (n = 44) 6/24 47.8 2,209 63.4 11.6 LSD (0.05 by t) 9.4 221 0.9 0.8 CV% (s/mean) 13.6 6.9 1.0 4.7 F-Value 6.12 1.82 n 3.12 2.23 a - Denotes values equal highest value (in bold) based on LSD (0.05). n - Denotes not statistically significant at 0.05 level.
15
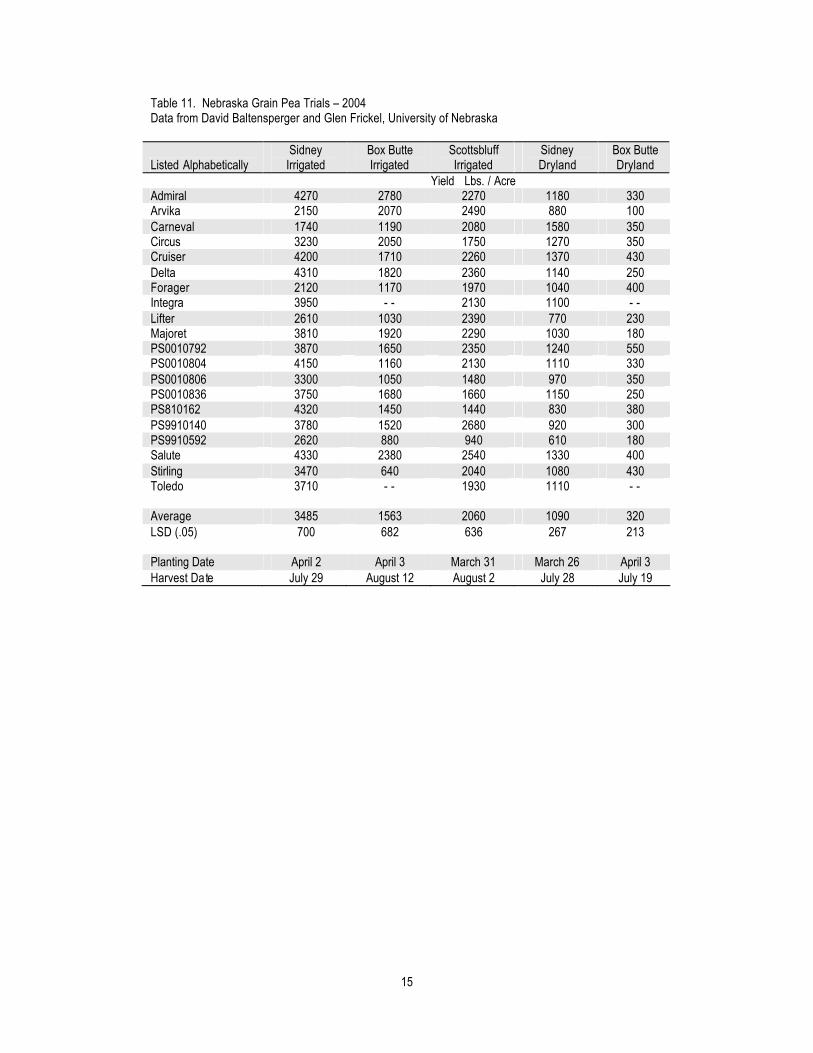
Table 11. Nebraska Grain Pea Trials – 2004 Data from David Baltensperger and Glen Frickel, University of Nebraska
Listed Alphabetically Sidney
Irrigated Box Butte Irrigated
Scottsbluff Irrigated
Sidney Dryland
Box Butte Dryland
Yield Lbs. / Acre Admiral 4270 2780 2270 1180 330 Arvika 2150 2070 2490 880 100 Carneval 1740 1190 2080 1580 350 Circus 3230 2050 1750 1270 350 Cruiser 4200 1710 2260 1370 430 Delta 4310 1820 2360 1140 250 Forager 2120 1170 1970 1040 400 Integra 3950 - - 2130 1100 - - Lifter 2610 1030 2390 770 230 Majoret 3810 1920 2290 1030 180 PS0010792 3870 1650 2350 1240 550 PS0010804 4150 1160 2130 1110 330 PS0010806 3300 1050 1480 970 350 PS0010836 3750 1680 1660 1150 250 PS810162 4320 1450 1440 830 380 PS9910140 3780 1520 2680 920 300 PS9910592 2620 880 940 610 180 Salute 4330 2380 2540 1330 400 Stirling 3470 640 2040 1080 430 Toledo 3710 - - 1930 1110 - - Average 3485 1563 2060 1090 320 LSD (.05) 700 682 636 267 213 Planting Date April 2 April 3 March 31 March 26 April 3 Harvest Date July 29 August 12 August 2 July 28 July 19

16
Table 12. NDSU Carrington Research Extension Center Western Regional Field Pea Nursery (0497), 2004 Data from Blaine Schatz and Steve Zwinger, North Dakota State University
Obs Variety Emerged
Plant Stand Days to Bloom Bloom Duration
Days to PM
Vine Length
Canopy Ht at Harvest
Height Index
Lodging at PM
Harvest Ease
Seeds/ Pound
1000 KWT Test Weight Seed Yield
ft-2 cm cm % 0-9 0-9 gms lbs/bu bu/ac
1 PS0010792 6.9 54.0 22.7 95.7 70 32 46 6.0 6.7 1685 270 64.7 65.7 2 PS0010804 7.5 55.3 17.3 93.0 72 23 32 5.7 8.7 1775 256 64.9 71.8 3 PS0010806 5.9 55.7 25.0 96.3 73 27 37 5.3 6.7 1523 299 64.0 62.7 4 PS0010836 6.0 55.7 17.7 94.3 70 26 37 4.7 7.7 1568 290 64.3 69.4 5 PS510718 8.3 56.0 25.7 99.7 74 28 39 6.3 7.3 2047 222 65.2 67.5 6 PS610152 6.5 51.3 24.0 94.7 70 29 42 5.0 6.7 2079 219 64.8 68.8 7 PS810162 6.5 49.7 22.7 90.3 65 28 43 5.0 7.0 2065 221 64.0 63.5 8 PS960007 7.3 55.3 18.3 91.0 72 33 46 4.7 6.7 1753 259 65.0 73.6 9 PS9910140 6.9 56.0 24.3 94.7 61 24 40 7.3 9.0 1761 260 63.9 62.6
10 PS9910592 6.3 55.0 21.7 93.3 67 17 25 7.7 9.0 2299 198 64.4 69.2
MEAN 6.8 54.4 21.9 94.3 69.4 26.7 38.6 5.8 7.5 1838 252 64.5 67.1 C.V.% 9.6 1.2 9.9 1.9 8.5 14.8 18.2 11.1 11.5 7.1 7.1 1.0 8.4 LSD.05 1.1 1.1 3.7 3.0 NS 6.8 12.0 1.1 1.5 229 32 NS NS LSD.01 1.5 1.5 5.1 4.2 NS 9.3 NS 1.6 2.1 319 44 NS NS #REPS 3 3 3 3 3 3 3 3 3 3 3 3 3 Planting Date = May 6; Harvest Date = September 2 ; Previous Crop = Durum Harvest Ease scores; 0 = all plants upright ~ very easy harvest, to 9 = all plants flat ~ very difficulty to harvest direct. Harvest Index; Plant height at time of harvest relative to plant height at end of bloom. ** PS510718 = Lifter , PS610152 = Stirling , PS960007 = Delta.
17
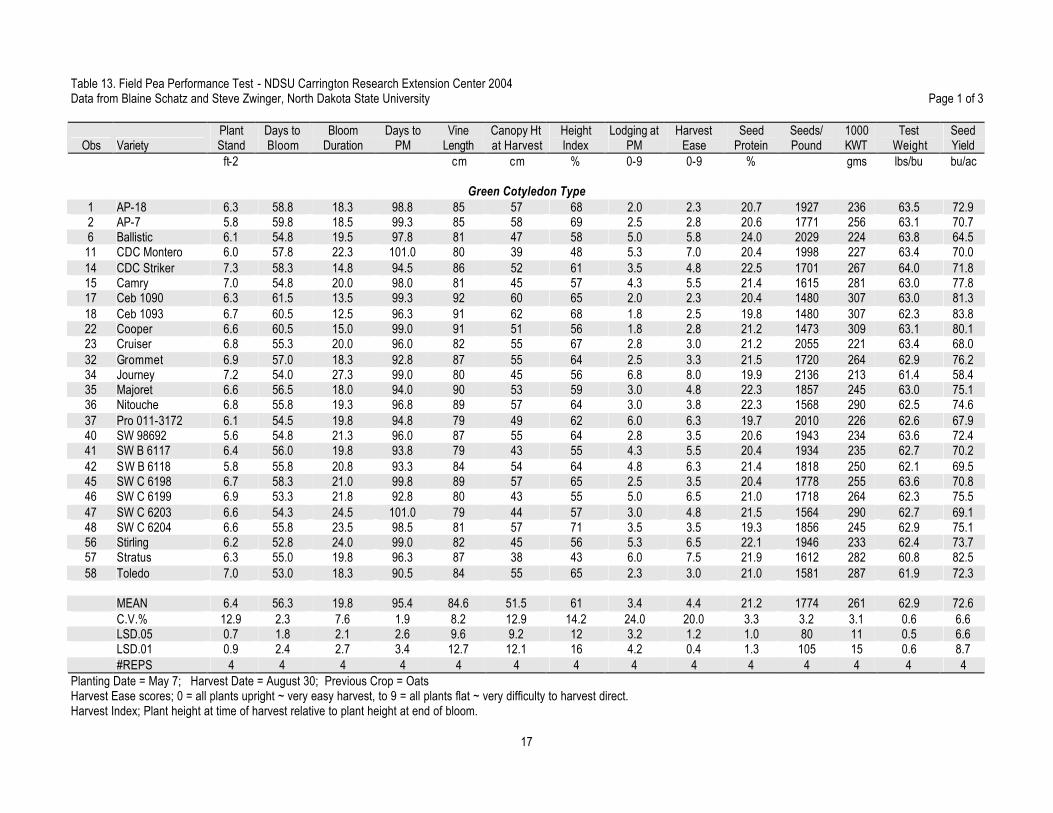
Table 13. Field Pea Performance Test - NDSU Carrington Research Extension Center 2004 Data from Blaine Schatz and Steve Zwinger, North Dakota State University Page 1 of 3
Obs Variety Plant Stand
Days to Bloom
Bloom Duration
Days to PM
Vine Length
Canopy Ht at Harvest
Height Index
Lodging at PM
Harvest Ease
Seed Protein
Seeds/ Pound
1000 KWT
Test Weight
Seed Yield
ft-2 cm cm % 0-9 0-9 % gms lbs/bu bu/ac
Green Cotyledon Type 1 AP-18 6.3 58.8 18.3 98.8 85 57 68 2.0 2.3 20.7 1927 236 63.5 72.9 2 AP-7 5.8 59.8 18.5 99.3 85 58 69 2.5 2.8 20.6 1771 256 63.1 70.7 6 Ballistic 6.1 54.8 19.5 97.8 81 47 58 5.0 5.8 24.0 2029 224 63.8 64.5
11 CDC Montero 6.0 57.8 22.3 101.0 80 39 48 5.3 7.0 20.4 1998 227 63.4 70.0 14 CDC Striker 7.3 58.3 14.8 94.5 86 52 61 3.5 4.8 22.5 1701 267 64.0 71.8 15 Camry 7.0 54.8 20.0 98.0 81 45 57 4.3 5.5 21.4 1615 281 63.0 77.8 17 Ceb 1090 6.3 61.5 13.5 99.3 92 60 65 2.0 2.3 20.4 1480 307 63.0 81.3 18 Ceb 1093 6.7 60.5 12.5 96.3 91 62 68 1.8 2.5 19.8 1480 307 62.3 83.8 22 Cooper 6.6 60.5 15.0 99.0 91 51 56 1.8 2.8 21.2 1473 309 63.1 80.1 23 Cruiser 6.8 55.3 20.0 96.0 82 55 67 2.8 3.0 21.2 2055 221 63.4 68.0 32 Grommet 6.9 57.0 18.3 92.8 87 55 64 2.5 3.3 21.5 1720 264 62.9 76.2 34 Journey 7.2 54.0 27.3 99.0 80 45 56 6.8 8.0 19.9 2136 213 61.4 58.4 35 Majoret 6.6 56.5 18.0 94.0 90 53 59 3.0 4.8 22.3 1857 245 63.0 75.1 36 Nitouche 6.8 55.8 19.3 96.8 89 57 64 3.0 3.8 22.3 1568 290 62.5 74.6 37 Pro 011-3172 6.1 54.5 19.8 94.8 79 49 62 6.0 6.3 19.7 2010 226 62.6 67.9 40 SW 98692 5.6 54.8 21.3 96.0 87 55 64 2.8 3.5 20.6 1943 234 63.6 72.4 41 SW B 6117 6.4 56.0 19.8 93.8 79 43 55 4.3 5.5 20.4 1934 235 62.7 70.2 42 SW B 6118 5.8 55.8 20.8 93.3 84 54 64 4.8 6.3 21.4 1818 250 62.1 69.5 45 SW C 6198 6.7 58.3 21.0 99.8 89 57 65 2.5 3.5 20.4 1778 255 63.6 70.8 46 SW C 6199 6.9 53.3 21.8 92.8 80 43 55 5.0 6.5 21.0 1718 264 62.3 75.5 47 SW C 6203 6.6 54.3 24.5 101.0 79 44 57 3.0 4.8 21.5 1564 290 62.7 69.1 48 SW C 6204 6.6 55.8 23.5 98.5 81 57 71 3.5 3.5 19.3 1856 245 62.9 75.1 56 Stirling 6.2 52.8 24.0 99.0 82 45 56 5.3 6.5 22.1 1946 233 62.4 73.7 57 Stratus 6.3 55.0 19.8 96.3 87 38 43 6.0 7.5 21.9 1612 282 60.8 82.5 58 Toledo 7.0 53.0 18.3 90.5 84 55 65 2.3 3.0 21.0 1581 287 61.9 72.3
MEAN 6.4 56.3 19.8 95.4 84.6 51.5 61 3.4 4.4 21.2 1774 261 62.9 72.6 C.V.% 12.9 2.3 7.6 1.9 8.2 12.9 14.2 24.0 20.0 3.3 3.2 3.1 0.6 6.6 LSD.05 0.7 1.8 2.1 2.6 9.6 9.2 12 3.2 1.2 1.0 80 11 0.5 6.6 LSD.01 0.9 2.4 2.7 3.4 12.7 12.1 16 4.2 0.4 1.3 105 15 0.6 8.7 #REPS 4 4 4 4 4 4 4 4 4 4 4 4 4 4
Planting Date = May 7; Harvest Date = August 30; Previous Crop = Oats Harvest Ease scores; 0 = all plants upright ~ very easy harvest, to 9 = all plants flat ~ very difficulty to harvest direct. Harvest Index; Plant height at time of harvest relative to plant height at end of bloom.
18
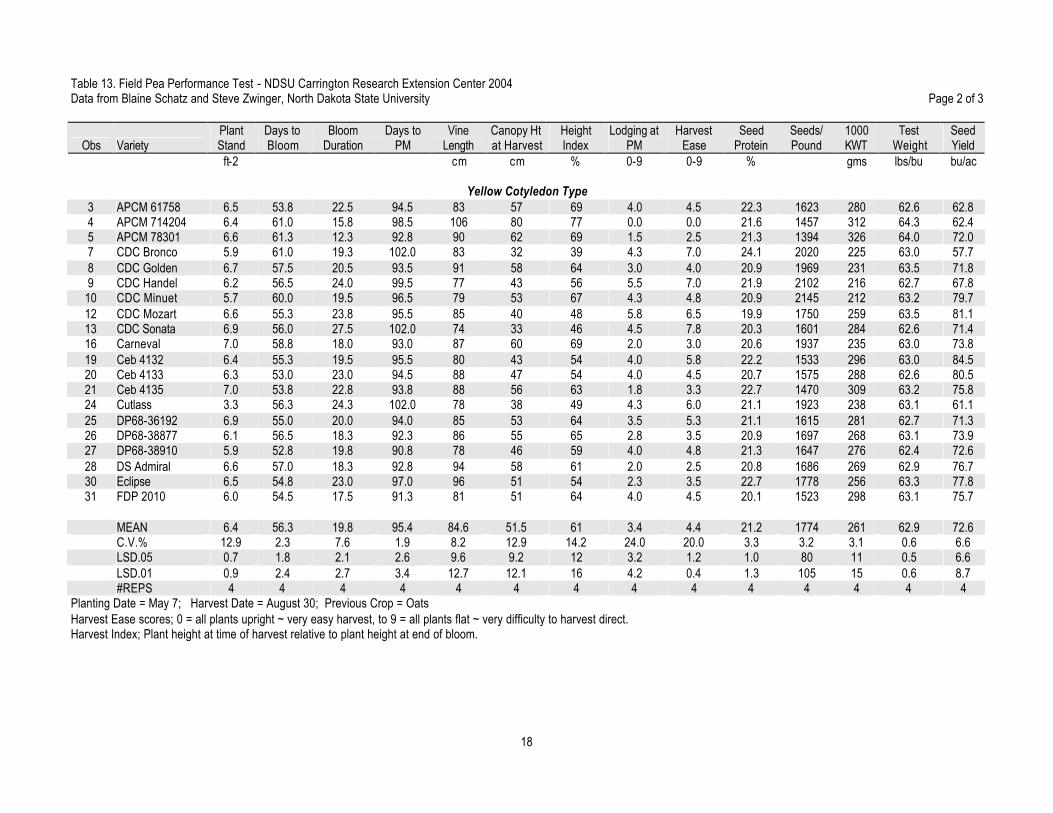
Table 13. Field Pea Performance Test - NDSU Carrington Research Extension Center 2004 Data from Blaine Schatz and Steve Zwinger, North Dakota State University Page 2 of 3
Obs Variety Plant Stand
Days to Bloom
Bloom Duration
Days to PM
Vine Length
Canopy Ht at Harvest
Height Index
Lodging at PM
Harvest Ease
Seed Protein
Seeds/ Pound
1000 KWT
Test Weight
Seed Yield
ft-2 cm cm % 0-9 0-9 % gms lbs/bu bu/ac
Yellow Cotyledon Type 3 APCM 61758 6.5 53.8 22.5 94.5 83 57 69 4.0 4.5 22.3 1623 280 62.6 62.8 4 APCM 714204 6.4 61.0 15.8 98.5 106 80 77 0.0 0.0 21.6 1457 312 64.3 62.4 5 APCM 78301 6.6 61.3 12.3 92.8 90 62 69 1.5 2.5 21.3 1394 326 64.0 72.0 7 CDC Bronco 5.9 61.0 19.3 102.0 83 32 39 4.3 7.0 24.1 2020 225 63.0 57.7 8 CDC Golden 6.7 57.5 20.5 93.5 91 58 64 3.0 4.0 20.9 1969 231 63.5 71.8 9 CDC Handel 6.2 56.5 24.0 99.5 77 43 56 5.5 7.0 21.9 2102 216 62.7 67.8
10 CDC Minuet 5.7 60.0 19.5 96.5 79 53 67 4.3 4.8 20.9 2145 212 63.2 79.7 12 CDC Mozart 6.6 55.3 23.8 95.5 85 40 48 5.8 6.5 19.9 1750 259 63.5 81.1 13 CDC Sonata 6.9 56.0 27.5 102.0 74 33 46 4.5 7.8 20.3 1601 284 62.6 71.4 16 Carneval 7.0 58.8 18.0 93.0 87 60 69 2.0 3.0 20.6 1937 235 63.0 73.8 19 Ceb 4132 6.4 55.3 19.5 95.5 80 43 54 4.0 5.8 22.2 1533 296 63.0 84.5 20 Ceb 4133 6.3 53.0 23.0 94.5 88 47 54 4.0 4.5 20.7 1575 288 62.6 80.5 21 Ceb 4135 7.0 53.8 22.8 93.8 88 56 63 1.8 3.3 22.7 1470 309 63.2 75.8 24 Cutlass 3.3 56.3 24.3 102.0 78 38 49 4.3 6.0 21.1 1923 238 63.1 61.1 25 DP68-36192 6.9 55.0 20.0 94.0 85 53 64 3.5 5.3 21.1 1615 281 62.7 71.3 26 DP68-38877 6.1 56.5 18.3 92.3 86 55 65 2.8 3.5 20.9 1697 268 63.1 73.9 27 DP68-38910 5.9 52.8 19.8 90.8 78 46 59 4.0 4.8 21.3 1647 276 62.4 72.6 28 DS Admiral 6.6 57.0 18.3 92.8 94 58 61 2.0 2.5 20.8 1686 269 62.9 76.7 30 Eclipse 6.5 54.8 23.0 97.0 96 51 54 2.3 3.5 22.7 1778 256 63.3 77.8 31 FDP 2010 6.0 54.5 17.5 91.3 81 51 64 4.0 4.5 20.1 1523 298 63.1 75.7
MEAN 6.4 56.3 19.8 95.4 84.6 51.5 61 3.4 4.4 21.2 1774 261 62.9 72.6 C.V.% 12.9 2.3 7.6 1.9 8.2 12.9 14.2 24.0 20.0 3.3 3.2 3.1 0.6 6.6 LSD.05 0.7 1.8 2.1 2.6 9.6 9.2 12 3.2 1.2 1.0 80 11 0.5 6.6 LSD.01 0.9 2.4 2.7 3.4 12.7 12.1 16 4.2 0.4 1.3 105 15 0.6 8.7 #REPS 4 4 4 4 4 4 4 4 4 4 4 4 4 4
Planting Date = May 7; Harvest Date = August 30; Previous Crop = Oats Harvest Ease scores; 0 = all plants upright ~ very easy harvest, to 9 = all plants flat ~ very difficulty to harvest direct. Harvest Index; Plant height at time of harvest relative to plant height at end of bloom.
19
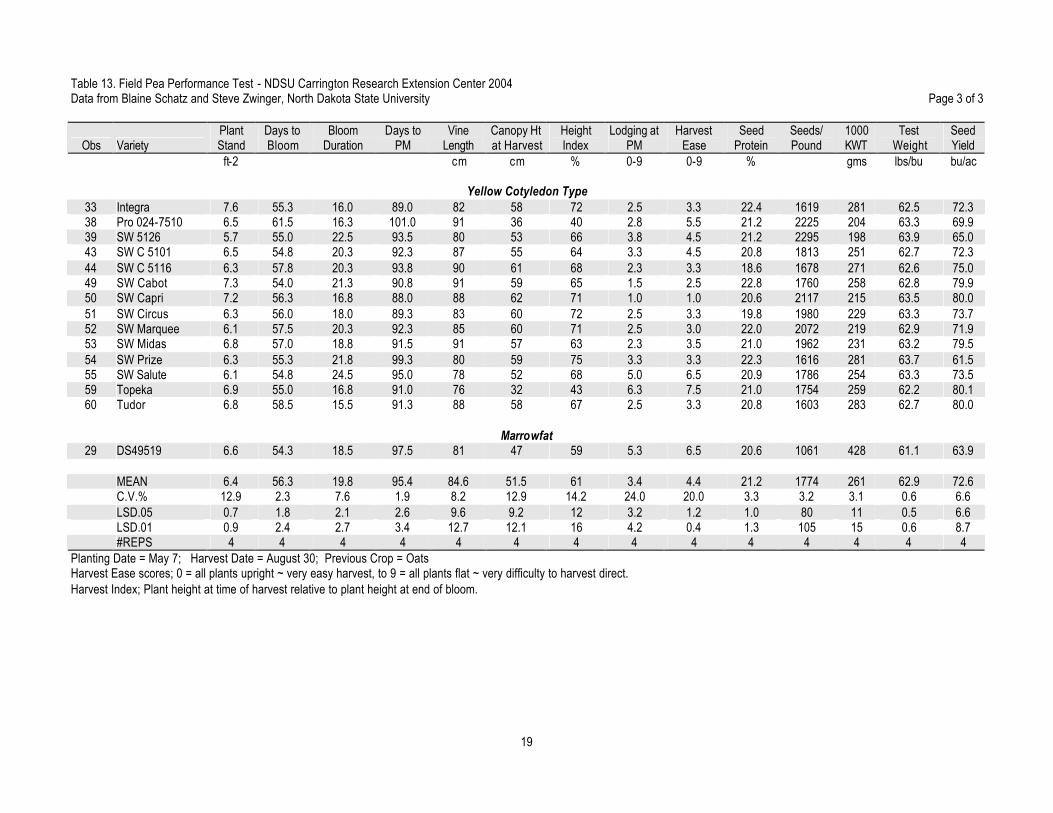
Table 13. Field Pea Performance Test - NDSU Carrington Research Extension Center 2004 Data from Blaine Schatz and Steve Zwinger, North Dakota State University Page 3 of 3
Obs Variety Plant Stand
Days to Bloom
Bloom Duration
Days to PM
Vine Length
Canopy Ht at Harvest
Height Index
Lodging at PM
Harvest Ease
Seed Protein
Seeds/ Pound
1000 KWT
Test Weight
Seed Yield
ft-2 cm cm % 0-9 0-9 % gms lbs/bu bu/ac
Yellow Cotyledon Type 33 Integra 7.6 55.3 16.0 89.0 82 58 72 2.5 3.3 22.4 1619 281 62.5 72.3 38 Pro 024-7510 6.5 61.5 16.3 101.0 91 36 40 2.8 5.5 21.2 2225 204 63.3 69.9 39 SW 5126 5.7 55.0 22.5 93.5 80 53 66 3.8 4.5 21.2 2295 198 63.9 65.0 43 SW C 5101 6.5 54.8 20.3 92.3 87 55 64 3.3 4.5 20.8 1813 251 62.7 72.3 44 SW C 5116 6.3 57.8 20.3 93.8 90 61 68 2.3 3.3 18.6 1678 271 62.6 75.0 49 SW Cabot 7.3 54.0 21.3 90.8 91 59 65 1.5 2.5 22.8 1760 258 62.8 79.9 50 SW Capri 7.2 56.3 16.8 88.0 88 62 71 1.0 1.0 20.6 2117 215 63.5 80.0 51 SW Circus 6.3 56.0 18.0 89.3 83 60 72 2.5 3.3 19.8 1980 229 63.3 73.7 52 SW Marquee 6.1 57.5 20.3 92.3 85 60 71 2.5 3.0 22.0 2072 219 62.9 71.9 53 SW Midas 6.8 57.0 18.8 91.5 91 57 63 2.3 3.5 21.0 1962 231 63.2 79.5 54 SW Prize 6.3 55.3 21.8 99.3 80 59 75 3.3 3.3 22.3 1616 281 63.7 61.5 55 SW Salute 6.1 54.8 24.5 95.0 78 52 68 5.0 6.5 20.9 1786 254 63.3 73.5 59 Topeka 6.9 55.0 16.8 91.0 76 32 43 6.3 7.5 21.0 1754 259 62.2 80.1 60 Tudor 6.8 58.5 15.5 91.3 88 58 67 2.5 3.3 20.8 1603 283 62.7 80.0
Marrowfat
29 DS49519 6.6 54.3 18.5 97.5 81 47 59 5.3 6.5 20.6 1061 428 61.1 63.9 MEAN 6.4 56.3 19.8 95.4 84.6 51.5 61 3.4 4.4 21.2 1774 261 62.9 72.6 C.V.% 12.9 2.3 7.6 1.9 8.2 12.9 14.2 24.0 20.0 3.3 3.2 3.1 0.6 6.6 LSD.05 0.7 1.8 2.1 2.6 9.6 9.2 12 3.2 1.2 1.0 80 11 0.5 6.6 LSD.01 0.9 2.4 2.7 3.4 12.7 12.1 16 4.2 0.4 1.3 105 15 0.6 8.7 #REPS 4 4 4 4 4 4 4 4 4 4 4 4 4 4
Planting Date = May 7; Harvest Date = August 30; Previous Crop = Oats Harvest Ease scores; 0 = all plants upright ~ very easy harvest, to 9 = all plants flat ~ very difficulty to harvest direct. Harvest Index; Plant height at time of harvest relative to plant height at end of bloom.

20
Table 14. Field Pea : Preliminary Yield Trial NDSU Carrington Research Extension Center 2004 Data from Blaine Schatz and Steve Zwinger, North Dakota State University
Obs Variety Emerged
Plant Stand Days to Bloom
Bloom Duration
Days to PM
Vine Length
Canopy Ht at Harvest
Height Index
Lodging at PM
Harvest Ease
Seed Protein
Seeds/ Pound
1000 KWT
Test Weight
Seed Yield
ft-2 cm cm % 0-9 0-9 % gms lbs/bu bu/ac
1 Delta 7.3 55.7 17.7 89.0 77 36 47 3.7 6.7 24.5 1676 271 62.6 59.0 2 Integra 6.7 53.3 19.0 88.3 81 57 71 1.7 2.7 22.1 1530 297 62.4 64.4 3 PS0010792 6.4 53.3 22.0 94.3 73 39 54 5.7 7.3 23.4 1539 296 62.7 62.6 4 PS0010803 6.8 55.3 17.0 92.0 75 37 49 4.7 7.3 19.8 1707 266 61.9 57.4 5 PS0010836 7.5 56.3 16.7 90.3 66 37 56 4.0 7.3 22.4 1468 309 62.6 57.4 6 PS0010902 6.3 54.0 22.7 92.3 85 40 49 5.3 7.3 23.3 1656 274 62.0 59.4 7 PS0010971 6.5 56.0 17.0 92.0 77 37 48 4.3 7.0 20.6 1630 279 62.5 57.2 8 PS0010993 7.8 56.3 16.3 89.7 79 41 53 2.3 6.3 22.2 1600 284 61.9 62.7 9 PS0110060 5.5 56.7 20.3 94.3 71 33 47 6.3 8.7 20.5 1852 245 61.4 50.3
10 PS01102958 7.5 55.7 19.3 91.7 72 38 53 5.7 8.7 21.9 1614 281 62.3 62.2 11 PS01103430 5.2 61.7 20.3 95.7 71 33 47 6.3 8.0 21.5 1511 301 63.1 51.8 12 PS0110663 3.1 56.3 24.0 95.3 84 50 60 5.0 6.7 22.1 1597 284 63.1 45.7 13 PS0110671 4.8 55.0 18.0 90.3 73 33 46 5.7 9.0 22.2 1741 261 61.5 56.4 14 PS0110745 6.3 54.7 17.7 89.3 69 34 50 4.3 8.0 21.2 1874 242 62.2 51.5 15 PS0110762 5.3 55.0 21.7 92.0 73 41 57 5.3 7.0 22.7 1748 260 62.6 54.2 16 PS0110767 5.5 54.3 18.3 91.7 69 40 59 4.3 7.7 21.8 1682 270 62.6 52.8 17 PS0110827 4.6 56.3 22.0 94.0 87 54 61 2.7 4.3 22.7 1659 274 62.8 54.7 18 PS99102238 6.8 58.0 20.3 91.7 81 50 62 2.0 4.0 21.2 1841 248 62.1 61.2 19 Stirling 6.9 52.3 20.3 90.3 71 42 60 3.7 6.7 22.5 1830 252 62.2 59.0 20 Toledo 6.7 53.0 18.7 90.3 71 41 58 3.3 6.0 22.7 1671 273 61.7 55.9
MEAN 6.2 55.5 19.5 91.7 75.2 40.8 54.4 4.3 6.8 22.1 1672 273 62.3 56.7 C.V.% 12.0 2.6 10.5 2.1 9.2 12.8 14.8 22.2 16.1 4.0 5.3 5.0 0.8 9.8 LSD.05 1.2 2.4 3.4 3.2 11 9 13.4 1.6 1.4 1.5 147 23 0.8 9.2 LSD.01 1.6 3.2 4.5 4.3 NS 12 NS 2.1 1.9 2 197 30 1.1 NS #REPS 3 3 3 3 3 3 3 3 3 3 3 3 3 3 Planting Date = May 6; Harvest Date = September 3 ; Previous Crop = Durum Harvest Ease scores; 0 = al l plants upright ~ very easy harvest, to 9 = all plants flat ~ very difficulty to harvest direct. Harvest Index; Plant height at time of harvest relative to plant height at end of bloom.
21
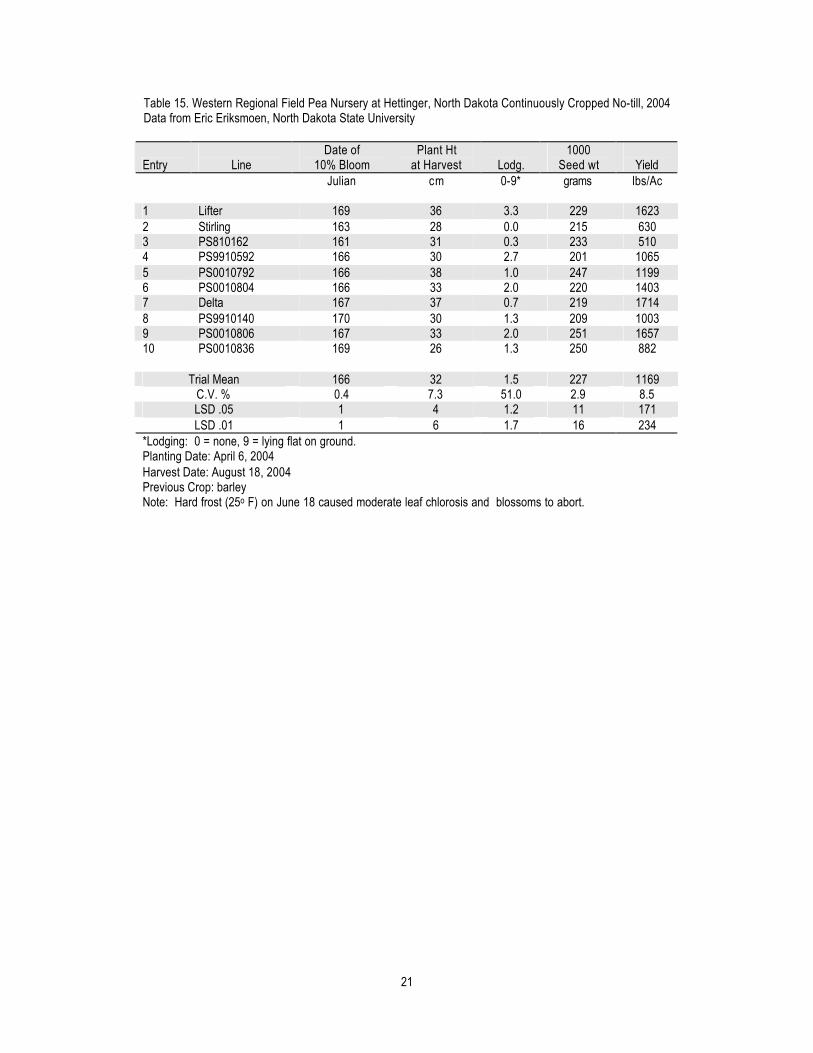
Table 15. Western Regional Field Pea Nursery at Hettinger, North Dakota Continuously Cropped No-till, 2004 Data from Eric Eriksmoen, North Dakota State University
Entry
Line Date of
10% Bloom Plant Ht
at Harvest
Lodg. 1000
Seed wt
Yield Julian cm 0-9* grams lbs/Ac
1 Lifter 169 36 3.3 229 1623 2 Stirling 163 28 0.0 215 630 3 PS810162 161 31 0.3 233 510 4 PS9910592 166 30 2.7 201 1065 5 PS0010792 166 38 1.0 247 1199 6 PS0010804 166 33 2.0 220 1403 7 Delta 167 37 0.7 219 1714 8 PS9910140 170 30 1.3 209 1003 9 PS0010806 167 33 2.0 251 1657 10 PS0010836 169 26 1.3 250 882
Trial Mean 166 32 1.5 227 1169
C.V. % 0.4 7.3 51.0 2.9 8.5 LSD .05 1 4 1.2 11 171 LSD .01 1 6 1.7 16 234
*Lodging: 0 = none, 9 = lying flat on ground. Planting Date: April 6, 2004 Harvest Date: August 18, 2004 Previous Crop: barley Note: Hard frost (25o F) on June 18 caused moderate leaf chlorosis and blossoms to abort.
22
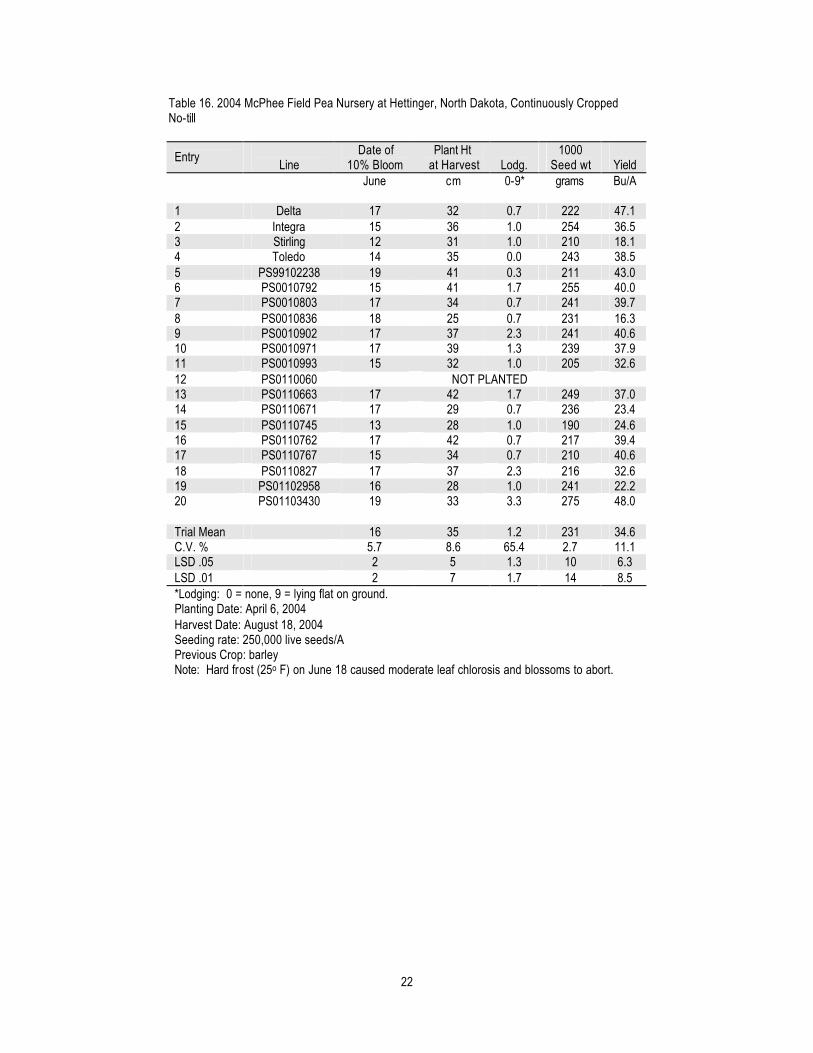
Table 16. 2004 McPhee Field Pea Nursery at Hettinger, North Dakota, Continuously Cropped No-till
Entry Line
Date of 10% Bloom
Plant Ht at Harvest
Lodg.
1000 Seed wt
Yield
June cm 0-9* grams Bu/A 1 Delta 17 32 0.7 222 47.1 2 Integra 15 36 1.0 254 36.5 3 Stirling 12 31 1.0 210 18.1 4 Toledo 14 35 0.0 243 38.5 5 PS99102238 19 41 0.3 211 43.0 6 PS0010792 15 41 1.7 255 40.0 7 PS0010803 17 34 0.7 241 39.7 8 PS0010836 18 25 0.7 231 16.3 9 PS0010902 17 37 2.3 241 40.6 10 PS0010971 17 39 1.3 239 37.9 11 PS0010993 15 32 1.0 205 32.6 12 PS0110060 NOT PLANTED 13 PS0110663 17 42 1.7 249 37.0 14 PS0110671 17 29 0.7 236 23.4 15 PS0110745 13 28 1.0 190 24.6 16 PS0110762 17 42 0.7 217 39.4 17 PS0110767 15 34 0.7 210 40.6 18 PS0110827 17 37 2.3 216 32.6 19 PS01102958 16 28 1.0 241 22.2 20 PS01103430 19 33 3.3 275 48.0 Trial Mean 16 35 1.2 231 34.6 C.V. % 5.7 8.6 65.4 2.7 11.1 LSD .05 2 5 1.3 10 6.3 LSD .01 2 7 1.7 14 8.5 *Lodging: 0 = none, 9 = lying flat on ground. Planting Date: April 6, 2004 Harvest Date: August 18, 2004 Seeding rate: 250,000 live seeds/A Previous Crop: barley Note: Hard frost (25o F) on June 18 caused moderate leaf chlorosis and blossoms to abort.

23
Table 17. North Central Research Extension Center Dry Pea Variety Trial Western Regional at Minot, 2004 Data from Mark Halvorson, North Dakota State University
Seed Yield
Variety
Days to
Bloom Bloom
Duration Days to Maturity
Ht to 1st Pod
# of Nodes to 1st Pod
# of Repro. Nodes
# of Pods/
Peduncle Plant
Ht
Canopy Ht at
Harvest Ht
Index Lodge Protein Seed
Weight Test
Weight 2002 2003 2004 2 Year 3 Year in in in % 0-9 % g/1000 lb/bu ---------------bu/A---------------- Lifter 64 20.5 109 10.9 4.9 7.4 1.5 25.1 12.4 50.0 7.8 23.6 216.0 63.5 -- -- 55.8 -- -- Stirling 62 21.0 105 6.4 3.5 7.1 1.1 18.7 20.2 111.7 1.0 20.2 220.4 64.8 -- 65.5 61.3 63.4 -- PS810162 61 21.3 105 8.2 4.6 5.5 1.1 18.6 19.9 109.4 0.5 21.0 236.2 64.0 -- 61.1 50.9 56.0 -- PS9910592 64 20.5 106 8.9 5.0 3.4 1.3 16.8 8.3 50.2 9.0 19.4 195.6 63.8 -- 49.9 37.7 43.8 -- PS0010792 62 21.0 107 11.1 6.0 5.3 1.4 21.4 19.1 90.3 4.4 21.5 265.8 64.3 -- -- 73.1 -- -- PS0010804 64 20.5 105 9.3 6.3 5.5 1.3 19.0 16.4 88.3 4.0 17.2 240.1 64.6 -- -- 64.7 -- -- Delta 64 21.0 104 13.5 7.3 3.5 1.8 18.8 23.9 127.8 0.0 20.6 247.0 64.7 -- -- 66.5 -- -- PS9910140 64 20.5 106 11.2 4.9 5.9 1.6 21.3 11.0 51.8 8.0 19.4 243.5 63.0 -- 65.7 60.1 62.9 -- PS0010806 64 20.8 108 11.7 5.6 7.9 1.6 25.6 13.9 54.4 6.8 21.6 280.2 63.4 -- -- 50.3 -- -- PS0010836 64 20.8 106 11.3 5.9 3.4 1.4 16.1 19.9 125.1 1.0 21.2 268.4 63.5 -- -- 62.9 -- -- LSD 5% 1 NS 2 3.24 1.3 1.9 NS 3.4 2.7 21.2 1.4 1.9 8.8 0.5 -- 4.0 10.4 -- -- C.V.% 0.6 2.6 1.3 21.8 16.5 24.3 30.5 11.7 11.5 17.0 22.9 6.5 1.6 0.6 -- 4.5 12.3 -- -- Mean 63 20.8 106 10.25 5.4 5.5 1.4 20.1 16.5 85.9 4.2 20.6 241.3 64.0 -- 61.3 58.3 -- -- Lodging score based on scale 0-9 (0=upright, 9=flat) Hail Damage on June 6, 2004

24
Table 18. North Central Research Extension Center—Minot, Dry Pea Variety Trial—McPhee Advanced Lines
Seed Yield
Variety
Days to
Bloom Bloom
Duration
HT to
1st Pod
HT to
1st Flow
# of Nodes
to 1st
Pod
# of Pods/
Peduncle Plant
Ht
Canopy Ht at
Harvest Ht
Index Lodge Seed
Weight Test
Weight Protein 2002 2003 2004 2
Year 3
Year in in in in % 0-9 g/1000 lb/bu % -----------------bu/A------------------ Delta 60 25.0 9.7 7.8 4.2 1.5 18.5 24.2 130.2 0.7 250.2 64.4 20.4 -- 71.5 74.1 72.8 -- Integra 59 25.3 10.7 7.2 6.5 1.7 24.3 23.5 97.2 0.0 267.9 63.1 20.2 -- 62.0 62.0 62.0 -- Stirling 58 26.0 8.0 5.5 4.5 1.2 17.0 20.9 131.2 0.0 214.2 64.8 19.9 -- -- 68.4 -- -- Toledo 59 26.0 10.1 6.3 7.5 1.0 23.2 23.1 99.9 0.0 272.0 62.1 20.5 -- 56.1 56.5 56.3 -- PS99102238 63 25.0 13.1 7.0 4.3 1.5 21.3 27.2 129.2 0.7 223.6 253.7 19.2 -- 52.3 68.6 60.4 -- PS0010792 59 26.0 9.7 5.7 4.8 1.2 18.7 19.1 104.0 4.7 271.9 63.6 20.7 -- 63.3 63.1 63.2 -- PS0010803 60 25.0 9.9 6.0 6.7 1.0 21.1 16.5 87.0 3.0 252.7 63.7 18.4 -- 65.0 60.7 62.8 -- PS0010836 59 25.7 6.8 3.3 6.0 1.0 14.9 18.1 123.8 3.0 272.1 62.5 21.9 -- 59.1 60.8 60.0 -- PS0010902 59 26.3 9.4 6.2 4.8 1.5 17.9 20.1 112.8 3.3 251.8 63.5 21.9 -- 57.6 54.8 56.2 -- PS0010971 60 24.7 11.9 7.8 7.3 1.0 26.8 20.1 75.0 3.0 259.6 64.3 19.0 -- 60.4 52.9 56.6 -- PS0010993 60 24.7 8.4 6.2 4.2 1.5 17.7 21.7 123.4 0.7 240.2 64.1 18.9 -- 65.6 63.3 64.4 -- PS0110060 60 25.0 9.8 6.8 5.3 1.2 22.5 20.2 92.6 6.0 242.2 63.3 16.8 -- -- 54.8 -- -- PS0110663 60 25.7 11.0 6.0 5.7 1.2 23.2 21.3 91.7 4.7 267.2 63.4 20.9 -- -- 33.5 -- -- PS0110671 60 24.7 9.8 6.7 6.3 1.3 22.5 21.8 96.8 1.7 248.7 63.0 21.6 -- -- 57.6 -- -- PS0110745 59 25.7 8.6 6.2 6.5 1.0 18.3 19.8 110.3 1.3 222.0 64.0 19.2 -- 62.1 53.0 57.5 -- PS0110762 59 25.7 10.6 5.3 7.3 1.0 23.0 22.3 97.7 0.7 239.1 63.4 20.8 -- -- 59.5 -- -- PS0110767 59 25.3 10.6 5.3 6.2 1.8 21.5 22.9 108.4 0.0 238.1 64.5 19.6 -- -- 54.6 -- -- PS0110827 60 25.0 12.9 5.8 5.2 1.7 22.5 24.5 108.7 3.0 239.9 63.4 20.6 -- -- 51.9 -- -- PS01102958 60 25.0 8.7 7.0 4.2 1.5 16.2 19.3 128.0 2.0 253.1 63.7 19.5 -- 62.9 67.2 65.1 -- PS011103430 62 26.0 9.9 5.5 7.0 1.8 24.5 10.5 43.8 8.3 259.3 63.3 19.3 -- -- 55.9 -- -- LSD 5% 1 NS 2.9 2.1 NS 0.5 5.4 3.1 33.4 2.8 7.8 NS 1.7 -- 592 11.4 -- -- C.V.% 1.3 2.8 17.7 20.1 30.1 23.9 15.7 9.1 19.4 72.3 1.9 100.9 5.0 -- 10.0 11.7 -- -- Mean 60 25.4 10.0 6.2 5.7 1.3 20.8 20.9 104.6 2.3 249.3 73.1 20.0 -- 3580 58.6 -- -- Lodging score based on scale 0-9 (0=upright, 9=flat) Hail Damage on June 6, 2004

25
Table19. Western Field Pea Variety Evaluation - Williston Research Extension Center, 2004 Data from Neil Riveland, North Dakota State University
Canopy Seed
Cultivar
Days to
Bloom Bloom
Duration Height Height Test
Weight Seed
Protein Harvest
Ease Yield Yield cms inches gms % 0-9* bus/a lbs/a
Lifter 66.0 20.8 40.8 16.0 62.8 20.7 8.3 51.42 3084.9 Stirling 61.0 22.8 49.0 19.3 64.8 18.9 2.5 56.37 3381.9 PS810162 60.0 20.0 45.5 17.9 63.8 20.8 2.5 48.99 2939.3 PS9910592 64.0 22.8 45.8 18.0 64.7 17.8 4.8 59.51 3570.5 PS0010792 62.5 19.0 60.3 23.7 65.4 19.5 1.5 63.89 3833.3 PS0010804 65.5 18.8 56.3 22.1 65.0 14.4 1.3 60.12 3607.3 Delta 65.3 17.8 59.3 23.3 65.6 18.6 .0 63.73 3824.0 PS9910140 65.5 21.3 58.5 23.0 64.4 16.6 3.5 58.90 3534.1 PS0010806 63.8 23.5 49.0 19.3 63.7 19.9 4.8 49.16 2949.6 PS0010836 65.8 19.8 47.3 18.6 63.5 19.1 2.8 58.14 3488.1 High Mean 66.0 23.5 60.3 23.7 65.6 20.8 8.3 63.89 3833.3 Low Mean 60.0 17.8 40.8 16.0 62.8 14.4 .0 48.99 2939.3 Exp Mean 63.9 20.6 51.2 20.1 64.4 18.6 3.2 57.02 3421.3 C.V. % 1.1 5.0 13.1 13.1 .7 6.2 34.2 5.30 5.3 LSD 5% 1.0 1.5 9.7 3.8 1.0 2.6 1.6 4.38 263.0 LSD 1% 1.4 2.0 13.1 5.2 1.4 3.7 2.1 5.92 355.3 # of Reps 4 4 4 4 2 2 4 4 4 F-TRT 35.2 13.7 4.2 4.2 9.1 5.8 18.3 13.19 13.2 * - Harvest Ease scores; 0-9 0 = all plants upright to 9 = all plants flat Location of the WREC: Latitude 48 8'; Longitude 103 44'W; Elevation 2105 ft. Planted: April 22 on Fallow. Applied Fertilizer in lbs/a: 0N:0P2O5:0K: Soil Test to two feet in lbs/a: 123N:20P:315K:50S 1.8 OM pH-5.4 Soil Type: Williams-Bowbells Loam Harvested: August 5 Harvested Area: 56 ft2 Protein not available at this time. Protein percentages reported on a oven dry moisture basis. Trifluralin at 0.9 lbs/a ai PPI gave exellent weed control.

26
Table 20. Pea Variety -Williston Research Extension Center – 2004 Data from Neil Riveland, North Dakota State University
Canopy Cultivar
Days to Bloom
Bloom Duration Height Height
Test Weight
1000 Kwt
Seeds/ Pound
Seed Protein
Harvest Ease
Seed Yield
cms inches lbs/b gms % 0-9* bus/a
Yellow Cotyledon Type CDC Mozart 63.3 22.2 58.0 22.8 65.6 224.9 2017 16.8 4.0 61.92 Carneval 66.8 17.0 62.5 24.6 65.3 221.8 2046 16.8 0.8 55.33 DS Admiral 66.0 14.5 63.0 24.8 64.6 255.6 1776 18.4 0.3 54.43 SW Marquee 65.3 16.7 71.0 28.0 64.9 212.7 2133 18.8 1.5 53.46 SW Salute 65.8 18.0 67.5 26.6 64.9 236.4 1921 15.1 0.8 57.59 Eclipse 65.0 19.7 65.8 25.9 65.2 241.2 1881 18.4 2.5 50.42 CDC Handel 66.0 20.2 52.8 20.8 64.8 207.9 2182 17.0 2.5 55.67 CDC Minuet 68.3 17.7 71.0 28.0 64.5 188.7 2405 17.7 2.3 61.55 CDC Bronco 68.3 18.0 64.8 25.5 64.5 200.3 2265 20.0 2.5 53.69 CDC Golden 66.8 17.2 69.3 27.3 65.1 217.8 2086 19.2 1.3 54.31 CDC Sonata 63.3 25.5 61.3 24.1 63.8 248.8 1823 19.4 4.3 61.02 Cutlass 65.0 23.2 61.5 24.2 64.5 227.7 1993 17.8 4.3 42.55
Green Cotylydon Type Majoret 66.0 17.5 57.5 22.6 66.5 228.2 1988 17.7 1.3 52.27 Cruiser 64.8 16.5 65.5 25.8 66.1 223.7 2029 19.0 0.8 49.93 Nitouche 63.8 17.0 72.0 28.3 64.9 301.1 1509 18.3 0.8 53.39 Stirling 61.0 20.5 49.5 19.5 64.7 223.9 2026 19.0 3.5 52.84 Toledo 62.3 19.2 59.8 23.5 63.4 299.5 1517 21.0 2.0 45.12 CDC Montero 66.5 16.0 60.8 23.9 65.6 220.7 2056 17.6 3.5 53.47 CDC Striker 67.0 15.5 61.5 24.2 65.8 236.2 1920 19.7 1.5 51.64 Scuba 63.5 19.5 60.3 23.7 64.1 225.6 2011 17.8 3.5 47.07 High Mean 68.3 14.5 72.0 28.3 66.5 301.1 2405 21.0 4.3 61.92 Low Mean 61.0 25.5 49.5 19.5 63.4 188.7 1509 15.1 0.3 42.55 Exp Mean 65.2 18.6 62.8 24.7 64.9 232.1 1979 18.3 2.2 53.38 C.V. % 1.0 11.0 13.3 13.3 1.0 2.2 2 5.0 70.1 7.34 LSD 5% .9 2.9 11.8 4.6 1.4 10.7 66 1.9 2.2 5.55 LSD 1% 1.3 3.8 NS NS NS 14.6 91 2.6 2.9 7.38 # of Reps 4 4 4 4 2 2 2 2 4 4 F-TRT 33.3 7.2 2.0 2.0 2.6 60.1 91 4.2 2.9 6.55 * Harvest Ease scores; 0-9 0 = all plants upright to 9 = all plants flat Location of the WREC: Latitude 48 8'; Longitude 103 44'W; Elevation 2105 ft. Planted: April 22 on Fallow. Applied Fertilizer in lbs/a: 0N:0P2O5:0K: Soil Test to two feet in lbs/a: 123N:20P:315K:50S 1.8 OM pH-5.4 Soil Type: Williams-Bowbells Loam Harvested: August 5 Harvested Area: 56 ft2 Protein percentages reported on a oven dry moisture basis. Trifluralin at 0.9 lbs/a ai PPI gave exellent weed control.
27
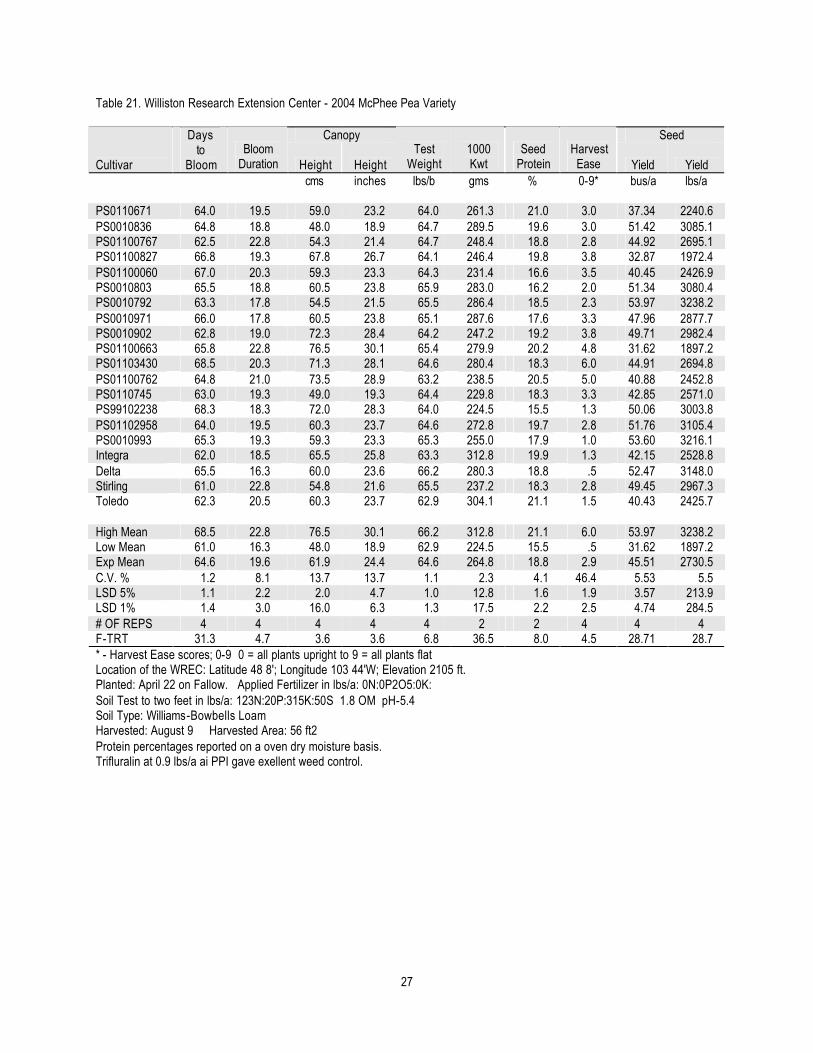
Table 21. Williston Research Extension Center - 2004 McPhee Pea Variety
Canopy Seed
Cultivar
Days to
Bloom Bloom
Duration Height Height Test
Weight 1000 Kwt
Seed Protein
Harvest Ease Yield Yield
cms inches lbs/b gms % 0-9* bus/a lbs/a PS0110671 64.0 19.5 59.0 23.2 64.0 261.3 21.0 3.0 37.34 2240.6 PS0010836 64.8 18.8 48.0 18.9 64.7 289.5 19.6 3.0 51.42 3085.1 PS01100767 62.5 22.8 54.3 21.4 64.7 248.4 18.8 2.8 44.92 2695.1 PS01100827 66.8 19.3 67.8 26.7 64.1 246.4 19.8 3.8 32.87 1972.4 PS01100060 67.0 20.3 59.3 23.3 64.3 231.4 16.6 3.5 40.45 2426.9 PS0010803 65.5 18.8 60.5 23.8 65.9 283.0 16.2 2.0 51.34 3080.4 PS0010792 63.3 17.8 54.5 21.5 65.5 286.4 18.5 2.3 53.97 3238.2 PS0010971 66.0 17.8 60.5 23.8 65.1 287.6 17.6 3.3 47.96 2877.7 PS0010902 62.8 19.0 72.3 28.4 64.2 247.2 19.2 3.8 49.71 2982.4 PS01100663 65.8 22.8 76.5 30.1 65.4 279.9 20.2 4.8 31.62 1897.2 PS01103430 68.5 20.3 71.3 28.1 64.6 280.4 18.3 6.0 44.91 2694.8 PS01100762 64.8 21.0 73.5 28.9 63.2 238.5 20.5 5.0 40.88 2452.8 PS0110745 63.0 19.3 49.0 19.3 64.4 229.8 18.3 3.3 42.85 2571.0 PS99102238 68.3 18.3 72.0 28.3 64.0 224.5 15.5 1.3 50.06 3003.8 PS01102958 64.0 19.5 60.3 23.7 64.6 272.8 19.7 2.8 51.76 3105.4 PS0010993 65.3 19.3 59.3 23.3 65.3 255.0 17.9 1.0 53.60 3216.1 Integra 62.0 18.5 65.5 25.8 63.3 312.8 19.9 1.3 42.15 2528.8 Delta 65.5 16.3 60.0 23.6 66.2 280.3 18.8 .5 52.47 3148.0 Stirling 61.0 22.8 54.8 21.6 65.5 237.2 18.3 2.8 49.45 2967.3 Toledo 62.3 20.5 60.3 23.7 62.9 304.1 21.1 1.5 40.43 2425.7 High Mean 68.5 22.8 76.5 30.1 66.2 312.8 21.1 6.0 53.97 3238.2 Low Mean 61.0 16.3 48.0 18.9 62.9 224.5 15.5 .5 31.62 1897.2 Exp Mean 64.6 19.6 61.9 24.4 64.6 264.8 18.8 2.9 45.51 2730.5 C.V. % 1.2 8.1 13.7 13.7 1.1 2.3 4.1 46.4 5.53 5.5 LSD 5% 1.1 2.2 2.0 4.7 1.0 12.8 1.6 1.9 3.57 213.9 LSD 1% 1.4 3.0 16.0 6.3 1.3 17.5 2.2 2.5 4.74 284.5 # OF REPS 4 4 4 4 4 2 2 4 4 4 F-TRT 31.3 4.7 3.6 3.6 6.8 36.5 8.0 4.5 28.71 28.7 * - Harvest Ease scores; 0-9 0 = all plants upright to 9 = all plants flat Location of the WREC: Latitude 48 8'; Longitude 103 44'W; Elevation 2105 ft. Planted: April 22 on Fallow. Applied Fertilizer in lbs/a: 0N:0P2O5:0K: Soil Test to two feet in lbs/a: 123N:20P:315K:50S 1.8 OM pH-5.4 Soil Type: Williams-Bowbells Loam Harvested: August 9 Harvested Area: 56 ft2 Protein percentages reported on a oven dry moisture basis. Trifluralin at 0.9 lbs/a ai PPI gave exellent weed control.
28
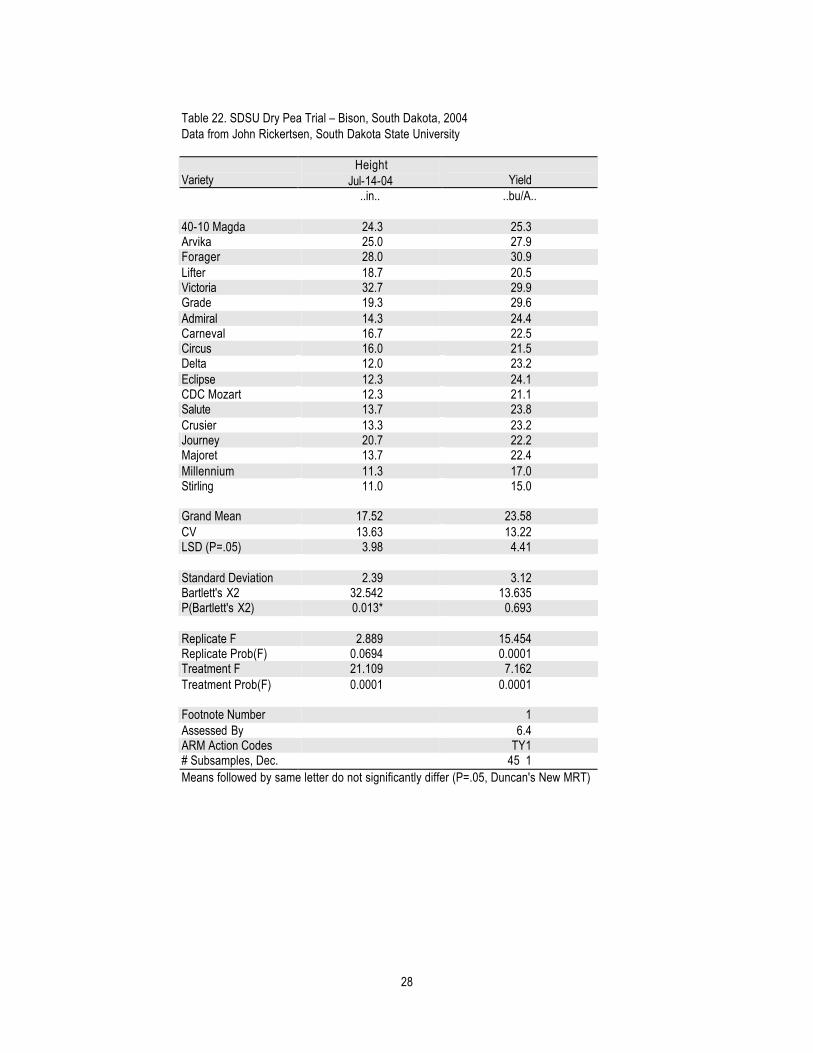
Table 22. SDSU Dry Pea Trial – Bison, South Dakota, 2004 Data from John Rickertsen, South Dakota State University
Variety Height
Jul-14-04 Yield ..in.. ..bu/A..
40-10 Magda 24.3 25.3 Arvika 25.0 27.9 Forager 28.0 30.9 Lifter 18.7 20.5 Victoria 32.7 29.9 Grade 19.3 29.6 Admiral 14.3 24.4 Carneval 16.7 22.5 Circus 16.0 21.5 Delta 12.0 23.2 Eclipse 12.3 24.1 CDC Mozart 12.3 21.1 Salute 13.7 23.8 Crusier 13.3 23.2 Journey 20.7 22.2 Majoret 13.7 22.4 Millennium 11.3 17.0 Stirling 11.0 15.0 Grand Mean 17.52 23.58 CV 13.63 13.22 LSD (P=.05) 3.98 4.41 Standard Deviation 2.39 3.12 Bartlett's X2 32.542 13.635 P(Bartlett's X2) 0.013* 0.693 Replicate F 2.889 15.454 Replicate Prob(F) 0.0694 0.0001 Treatment F 21.109 7.162 Treatment Prob(F) 0.0001 0.0001 Footnote Number 1 Assessed By 6.4 ARM Action Codes TY1 # Subsamples, Dec. 45 1 Means followed by same letter do not significantly differ (P=.05, Duncan's New MRT)

29
Table 23. SDSU Dry Pea Variety Trial – Hayes, South Dakota, 2004 Data from John Rickertsen, South Dakota State University
Variety Height
Jul-28-04 Lodging
Jul-28-04 Test Wt Yield Yield ..in.. 0-9 ..lb/bu.. ..bu/A.. ..kg/ha..
40-10 Magda 30.8 8.0 62.8 25.2 1697 Arvika 34.0 8.0 60.4 22.6 1523 Forager 31.3 8.0 62.1 30.1 2025 Lifter 21.0 8.0 61.6 24.5 1648 Victoria 30.8 8.0 62.7 25.8 1736 Grade 23.3 4.3 63.7 31.2 2098 Admiral 18.8 0.0 61.8 32.0 2155 Carneval 19.0 1.0 62.9 26.7 1793 Circus 16.0 1.0 63.3 25.6 1724 Delta 17.0 0.8 64.3 27.6 1859 Eclipse 18.8 0.3 63.6 28.6 1925 CDC Mozart 14.0 0.3 64.8 28.1 1890 Salute 19.5 0.8 63.5 32.5 2185 Crusier 19.3 1.8 62.6 26.6 1787 Journey 27.0 7.8 62.8 22.2 1495 Majoret 18.5 0.0 63.0 25.9 1744 Millennium 15.8 0.3 62.8 15.0 1010 Stirling 14.0 0.5 63.1 23.9 1605 Grand Mean 21.58 3.25 62.87 26.35 1772.24 CV 9.5 18.64 1.01 13.11 13.11 LSD (P=.05) 2.90 0.86 0.90 4.94 332.1 Standard Deviation 2.05 0.61 0.63 3.46 232.4 Bartlett's X2 31.569 10.419 17.559 30.199 30.2 P(Bartlett's X2) 0.017* 0.318 0.417 0.025* 0.025* Replicate F 0.604 2.068 1.386 4.372 4.372 Replicate Prob(F) 0.6157 0.1160 0.2575 0.0082 0.0083 Treatment F 38.698 137.564 10.081 5.691 5.691 Treatment Prob(F) 0.0001 0.0001 0.0001 0.0001 0.0001 ARM Action Codes T1 TY2 TY3 # Subsamples, Dec. 1 1 0 Means followed by same letter do not significantly differ (P=.05, Duncan's New MRT)

30
Table 24. SDSU Dry Pea Variety Trial – Selby, South Dakota, 2004 Data from John Rickertsen, South Dakota State University
Variety Height
Jul-12-04 Test Wt Yield ..in.. ..lb/bu.. ..bu/A..
40-10 Magda 51.0 63.10 30.7 Arvika 49.8 62.15 34.6 Forager 45.5 63.85 31.9 Lifter 29.0 63.85 38.1 Victoria 47.8 64.65 37.5 Grade 31.0 64.20 32.6 Admiral 32.8 65.36 51.1 Carneval 27.5 64.25 32.3 Circus 25.0 63.50 24.9 Delta 28.3 65.50 48.1 Eclipse 24.5 64.45 31.4 CDC Mozart 27.3 64.52 36.7 Salute 27.8 65.93 41.1 Crusier 27.5 63.77 28.9 Journey 44.3 63.47 34.1 Majoret 31.5 63.83 51.8 Millennium 25.0 64.43 31.4 Stirling 25.3 64.50 33.9 Grand Mean 33.36 64.18 36.16 CV 11.81 1.51 32.91 LSD (P=.05) 5.57 1.384 17.01 Standard Deviation 3.94 0.969 11.90 Bartlett's X2 17.569 21.415 19.76 P(Bartlett's X2) 0.417 0.208 0.287 Replicate F 5.448 1.272 2.632 Replicate Prob(F) 0.0025 0.2944 0.0601 Treatment F 23.183 3.387 1.586 Treatment Prob(F) 0.0001 0.0004 0.1042 ARM Action Codes TY1 # Subsamples, Dec. 1 Means followed by same letter do not significantly differ (P=.05, Duncan's New MRT)

31
Table 25. SDSU Dry Pea Variety Trial – Wall, South Dakota, 2004 Data from John Rickertsen, South Dakota State University
Variety Height
Jul-22-04 Lodging
Jul-22-04 Moisture Test Wt Yield Yield ..in.. 0-9 % ..lb/bu.. ..bu/A.. ..kg/ha..
40-10 Magda 36.0 8.5 10.27 61.55 26.3 1767.5 Arvika 34.0 7.8 10.77 62.13 27.9 1874.9 Forager 34.8 7.5 10.08 59.95 30.6 2060.4 Lifter 19.5 6.8 10.70 62.70 18.7 1259.7 Victoria 35.3 8.0 11.35 60.85 30.8 2070.2 Grande 23.8 4.8 11.18 60.98 25.4 1708.9 Adminral 21.8 0.3 10.30 61.28 25.1 1689.3 Carneval 22.0 0.3 14.2 957.0 Circus 18.5 0.3 10.50 61.05 21.1 1415.9 Delta 18.5 1.0 9.95 62.45 26.6 1787.0 Eclipse 17.3 0.3 10.07 60.30 24.8 1669.8 CDC Mozart 18.3 0.3 10.70 62.80 23.8 1601.4 Salute 20.0 0.5 10.33 62.10 21.6 1455.0 Crusier 20.0 0.5 10.45 61.00 21.6 1455.0 Journey 33.5 7.8 9.50 60.65 25.4 1708.9 Majoret 20.5 1.0 10.67 62.03 24.4 1640.5 Millennium 16.5 0.5 10.00 61.60 20.3 1367.1 Stirling 17.8 2.8 9.85 62.30 22.2 1494.0 Stratus 19.5 1.5 10.07 60.47 27.9 1874.9 PS810162 15.8 0.8 9.65 59.80 30.5 2050.6 PS9910592 19.5 7.0 9.90 61.20 19.3 1298.7 PS0010792 17.3 2.8 15.5 1044.8 PS0010804 16.8 1.5 9.93 61.40 22.4 1503.8 PS9910140 21.8 3.3 10.40 61.70 26.6 1787.0 PS0010806 18.0 2.5 17.6 1181.6 PS0010836 16.3 0.3 9.77 60.78 30.5 2050.6 Grand Mean 22.02 3.0 10.28 61.35 23.89 1606.7 CV 11.05 33.0 6.43 2.18 13.19 13.19 LSD (P=.05) 3.44 1.40 0.944 1.915 4.46 299.71 Standard Deviation 2.43 0.99 0.661 1.340 3.15 211.93 Bartlett's X2 31.18 38.418 55.888 13.745 34.813 34.813 P(Bartlett's X2) 0.183 0.031* 0.001* 0.798 0.092 0.092 Replicate F 1.536 1.020 3.807 0.401 1.314 1.314 Replicate Prob(F) 0.2121 0.3885 0.0160 0.7527 0.2763 0.2760 Treatment F 29.484 38.510 2.011 1.573 8.476 8.476 Treatment Prob(F) 0.0001 0.0001 0.0224 0.0961 0.0001 0.0001 ARM Action Codes TY1 TY2 # Subsamples, Dec. 1 1 Means followed by same letter do not significantly differ (P=.05, Duncan's New MRT)
32
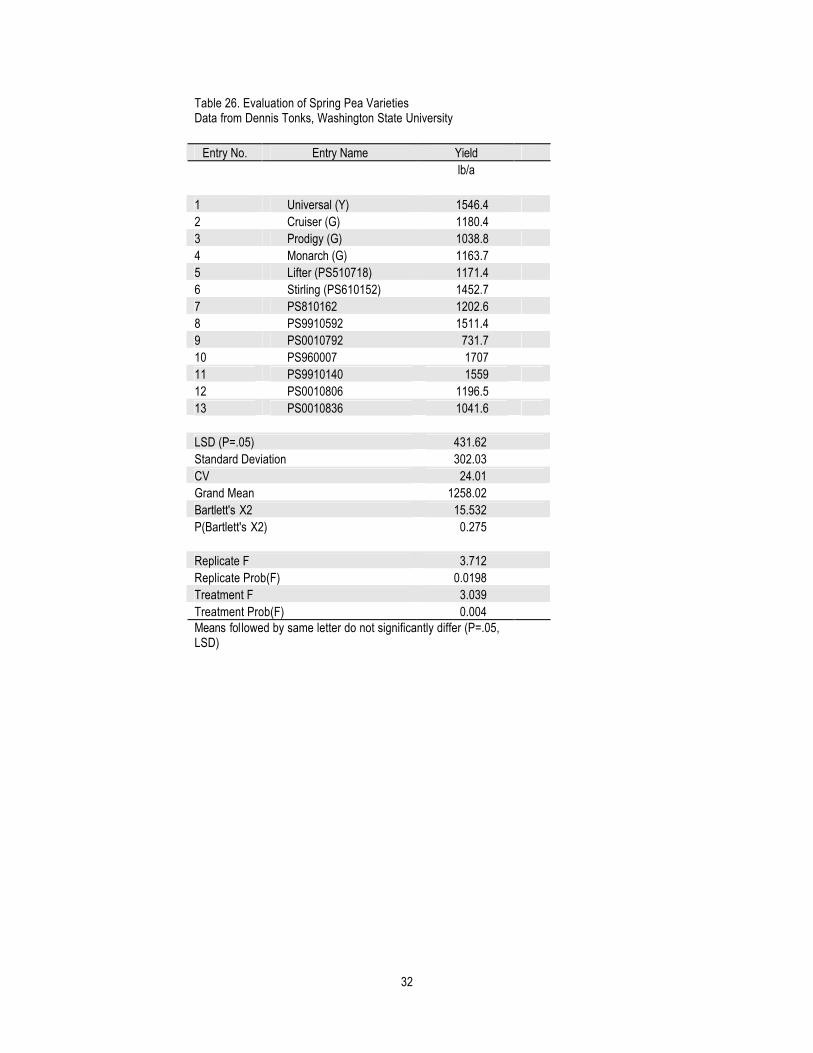
Table 26. Evaluation of Spring Pea Varieties Data from Dennis Tonks, Washington State University
Entry No. Entry Name Yield lb/a
1 Universal (Y) 1546.4 2 Cruiser (G) 1180.4 3 Prodigy (G) 1038.8 4 Monarch (G) 1163.7 5 Lifter (PS510718) 1171.4 6 Stirling (PS610152) 1452.7 7 PS810162 1202.6 8 PS9910592 1511.4 9 PS0010792 731.7 10 PS960007 1707 11 PS9910140 1559 12 PS0010806 1196.5 13 PS0010836 1041.6 LSD (P=.05) 431.62 Standard Deviation 302.03 CV 24.01 Grand Mean 1258.02 Bartlett's X2 15.532 P(Bartlett's X2) 0.275 Replicate F 3.712 Replicate Prob(F) 0.0198 Treatment F 3.039 Treatment Prob(F) 0.004 Means followed by same letter do not significantly differ (P=.05, LSD)

33
Table 27. Western Regional Dry Pea Yield Trial - Powell, WY, 2004 (0497) Data from Abdel Mesbah and Rob Smith, University of Wyoming
22-inch rows 7-inch rows
Entry Cultivar Accession No. Stand Yield Yield 103 plants/ac lbs/ac lbs/ac 1 Lifter PS510718 105.7 4101 3362 2 Stirling PS610152 104.5 3369 4775 3 PS810162 118.8 2731 4306 4 PS9910592 84.9 2249 4021 5 PS0010792 94.5 2518 3351 6 PS0010804 94.5 2700 3688 7 Delta PS960007 102.8 2211 3538 8 PS9910140 92.7 3411 3840 9 PS0010806 82.0 2681 4326 10 PS0010836 82.0 2275 3035 Mean 96.2 2825 3824 C.V.% 15.8 19.9 21.4 LSD (5%) 22.3 817 1680 Planting date: May 14, 2004 Harvest date: August 30,2004
Table 28. Irrigated Spring Dry Grain Pea Variety Evaluation – U-W Research and Extension Center, Torrington, WY 2004 Data from James Krall and Jerry Nachtman, University of Wyoming Entry Yield Bushel wt (lb/A) (lb/bu) PS9910140 3256 58.1 Delta 2870 59.4 Lifter 2436 59.3 PS0010792 2356 58.4 PS0010836 2302 57.9 PS810162 2258 58.4 PS0010804 2161 57.7 Stirling 2054 59.7 PS0010806 1978 58.2 PS9910592 1621 53.4 Average 2329 58.0 DRS 0.05 535 1.9

34
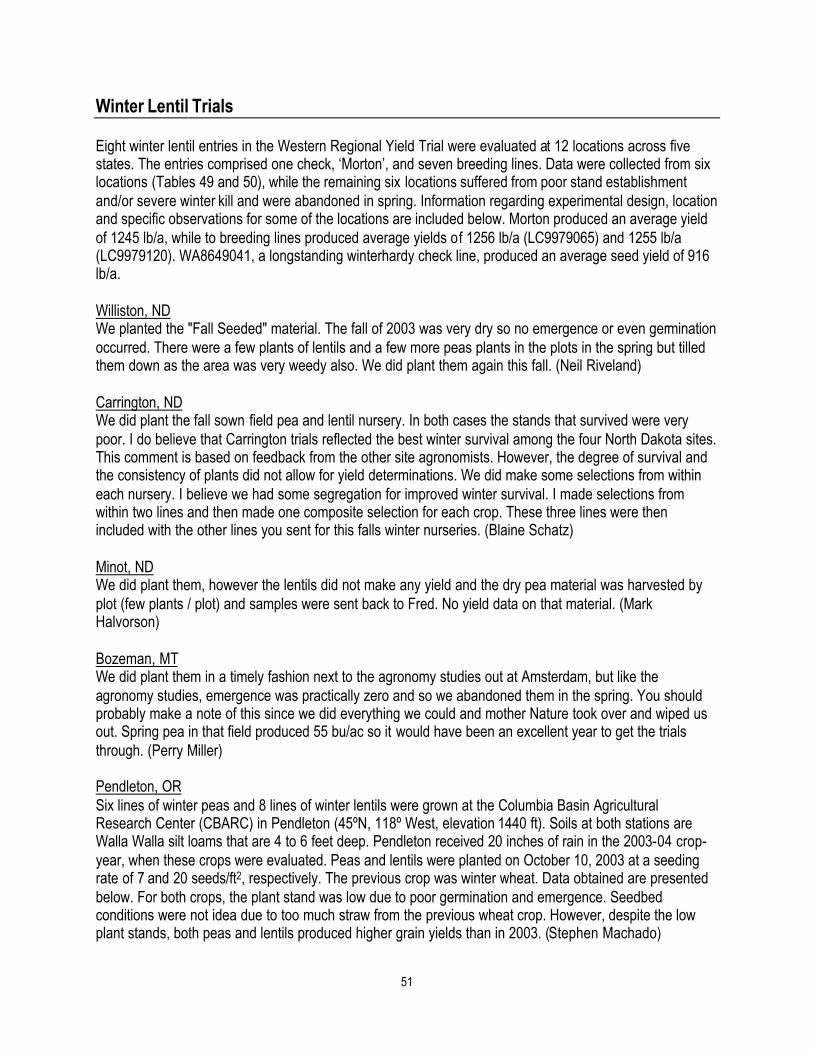
Winter Feed Pea Trials Eight winter feed pea entries were included in the Winter Feed Pea Western Regional Yield Trial and evaluated at 11 locations across five states. Data were collected from six locations, while the remaining five locations suffered from poor stand establishment and/or severe winter kill and were abandoned in spring. All eight entries represent the most advanced breeding lines from the USDA-ARS breeding program and included one green and seven yellow cotyeldon types. Breeding line PS9830F009 was recently released under the name ‘Specter’ and is the first white-flowered winter feed pea to be released from the program. Information regarding experimental design, location and specific observations for some of the locations are included below. Among the locations returning results for all eight lines the highest yielding line was PS9830S358 (2539 lb/a) followed by PS9830F011 (2271 lb/a). Specter produced an average yield of 1710 lb/a. Williston, ND We planted the "Fall Seeded" material. The fall of 2003 was very dry so no emergence or even germination occurred. There were a few plants of lentils and a few more pea plants in the plots in the spring but tilled them down as the area was very weedy also. We did plant them again this fall. (Neil Riveland) Carrington, ND We did plant the fall sown field pea and lentil nursery. In both cases the stands that survived were very poor. I do believe that Carrington trials reflected the best winter survival among the four North Dakota sites. This comment is based on feedback from the other site agronomists. However, the degree of survival and the consistency of plants did not allow for yield determinations. We did make some selections from within each nursery. I believe we had some segregation for improved winter survival. I made selections from within two lines and then made one composite selection for each crop. These three lines were then included with the other lines you sent for this falls winter nurseries. (Blaine Schatz) Minot, ND We did plant them, however the lentils did not make any yield and the dry pea material was harvested by plot (few plants / plot) and samples were sent back to Fred. No yield data on that material. (Mark Halvorson) Amsterdam, MT We did plant them in a timely fashion next to the agronomy studies out at Amsterdam but like the agronomy studies emergence was practically zero and so we abandoned them in the spring. You should probably make a note of this since we did everything we could and mother Nature took over and wiped us out. Spring pea in that field produced 55 bu/ac so it would have been an excellent year to get the trials through. (Perry Miller) Pierre, SD I lost the Wall peas to poor stands and winterkill. The Dakota Lakes (Pierre) site had a lot of variation, which can be seen by the high CV's.(John Rickertsen) Pendleton, OR Six lines of winter peas and 8 lines of winter lentils were grown at the Columbia Basin Agricultural Research Center (CBARC) in Pendleton (45ºN, 118º West, elevation 1440 ft). Soils at both stations are

35
Walla Walla silt loams that are 4 to 6 feet deep. Pendleton received 20 inches of rain in the 2003-04 crop-year, when these crops were evaluated. Peas and lentils were planted on October 10, 2003 at a seeding rate of 7 and 20 seeds/ft2, respectively. The previous crop was winter wheat. Data obtained are presented below. For both crops, the plant stand was low due to poor germination and emergence. Seedbed conditions were not idea due to too much straw from the previous wheat crop. However, despite the low plant stands, both peas and le ntils produced higher grain yields than in 2003. (Stephen Machado)
36
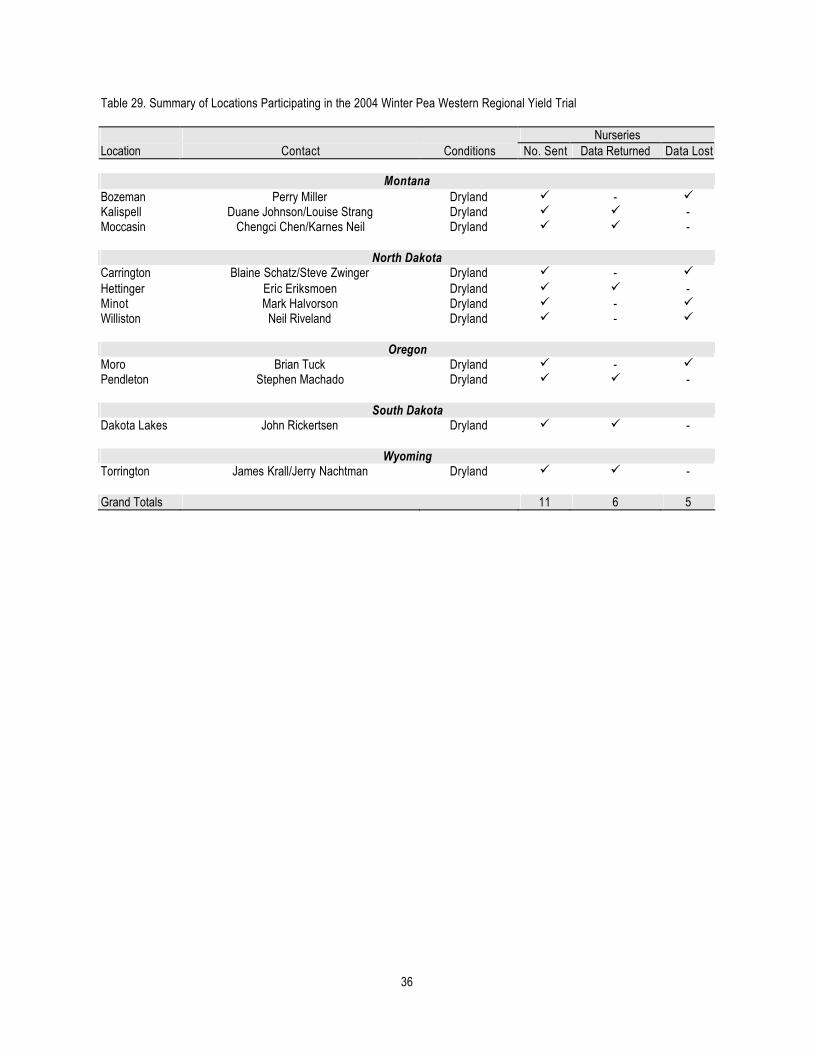
Table 29. Summary of Locations Participating in the 2004 Winter Pea Western Regional Yield Trial Nurseries Location Contact Conditions No. Sent Data Returned Data Lost
Montana Bozeman Perry Miller Dryland ü - ü Kalispell Duane Johnson/Louise Strang Dryland ü ü - Moccasin Chengci Chen/Karnes Neil Dryland ü ü -
North Dakota Carrington Blaine Schatz/Steve Zwinger Dryland ü - ü Hettinger Eric Eriksmoen Dryland ü ü - Minot Mark Halvorson Dryland ü - ü Williston Neil Riveland Dryland ü - ü
Oregon Moro Brian Tuck Dryland ü - ü Pendleton Stephen Machado Dryland ü ü -
South Dakota Dakota Lakes John Rickertsen Dryland ü ü -
Wyoming Torrington James Krall/Jerry Nachtman Dryland ü ü - Grand Totals 11 6 5

37
Table 30. Location Yield Summary (lb/a) for Western Regional Winter Peas
Location PS7530726 PS9430706 PS9630448 PS9830F009
(Specter) PS9830F010 PS9830F011 PS9830S358 PS9830S431 Kalispell, MT 1811 1256 1328 1618 1296 2070 2722 2503 Moccasin, MT 1802 1450 1533 1650 1405 2096 2366 1482 Pendleton, OR … … 2367 3137 2628 2459 2860 1902 Dakota Lakes, SD 2093 911 1851 1861 1887 2646 2529 1192 Torrington, WY … 2067 1740 2511 2203 3119 907 2190 Grand Mean 1902 1206 1571 1710 1529 2271 2539 1726 Grand mean taken from locations with a complete set of data.
38
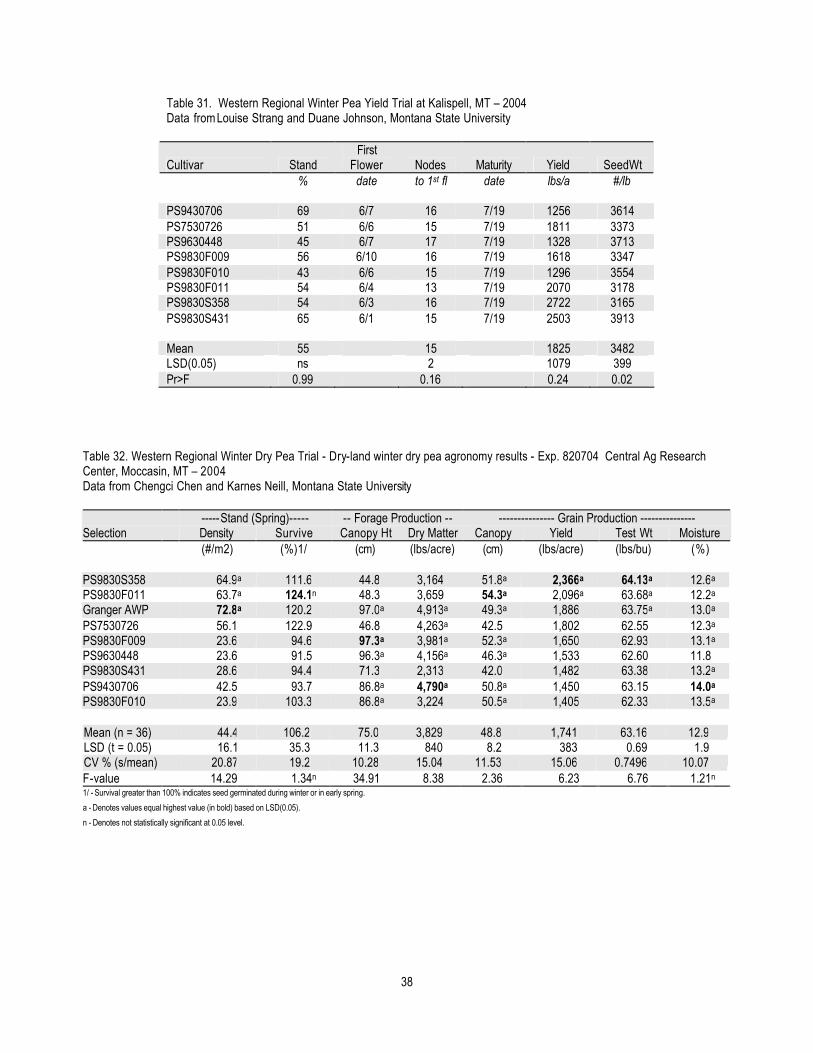
Table 31. Western Regional Winter Pea Yield Trial at Kalispell, MT – 2004 Data from Louise Strang and Duane Johnson, Montana State University
Cultivar Stand First
Flower Nodes Maturity Yield SeedWt % date to 1st fl date lbs/a #/lb PS9430706 69 6/7 16 7/19 1256 3614 PS7530726 51 6/6 15 7/19 1811 3373 PS9630448 45 6/7 17 7/19 1328 3713 PS9830F009 56 6/10 16 7/19 1618 3347 PS9830F010 43 6/6 15 7/19 1296 3554 PS9830F011 54 6/4 13 7/19 2070 3178 PS9830S358 54 6/3 16 7/19 2722 3165 PS9830S431 65 6/1 15 7/19 2503 3913 Mean 55 15 1825 3482 LSD(0.05) ns 2 1079 399 Pr>F 0.99 0.16 0.24 0.02
Table 32. Western Regional Winter Dry Pea Trial - Dry-land winter dry pea agronomy results - Exp. 820704 Central Ag Research Center, Moccasin, MT – 2004 Data from Chengci Chen and Karnes Neill, Montana State University -----Stand (Spring)----- -- Forage Production -- --------------- Grain Production --------------- Selection Density Survive Canopy Ht Dry Matter Canopy Yield Test Wt Moisture (#/m2) (%)1/ (cm) (lbs/acre) (cm) (lbs/acre) (lbs/bu) (%)
PS9830S358 64.9a 111.6 44.8 3,164 51.8a 2,366a 64.13a 12.6a PS9830F011 63.7a 124.1n 48.3 3,659 54.3a 2,096a 63.68a 12.2a Granger AWP 72.8a 120.2 97.0a 4,913a 49.3a 1,886 63.75a 13.0a PS7530726 56.1 122.9 46.8 4,263a 42.5 1,802 62.55 12.3a PS9830F009 23.6 94.6 97.3a 3,981a 52.3a 1,650 62.93 13.1a PS9630448 23.6 91.5 96.3a 4,156a 46.3a 1,533 62.60 11.8 PS9830S431 28.6 94.4 71.3 2,313 42.0 1,482 63.38 13.2a PS9430706 42.5 93.7 86.8a 4,790a 50.8a 1,450 63.15 14.0a PS9830F010 23.9 103.3 86.8a 3,224 50.5a 1,405 62.33 13.5a Mean (n = 36) 44.4 106.2 75.0 3,829 48.8 1,741 63.16 12.9 LSD (t = 0.05) 16.1 35.3 11.3 840 8.2 383 0.69 1.9 CV % (s/mean) 20.87 19.2 10.28 15.04 11.53 15.06 0.7496 10.07 F-value 14.29 1.34n 34.91 8.38 2.36 6.23 6.76 1.21n 1/ - Survival greater than 100% indicates seed germinated during winter or in early spring. a - Denotes values equal highest value (in bold) based on LSD(0.05). n - Denotes not statistically significant at 0.05 level.

39
Table 32. Winter Pea Evaluations at Hettinger, North Dakota Continuously Cropped No-till, 2004 Data from Eric Eriksmoen, North Dakota State University
Entry
Line Winter
Kill %
1 PS9430706 94 2 PS7530726 91 3 PS9630448 96 4 PS9830F009 97 5 PS9830F010 98 6 PS9830F011 98 7 PS9830S358 87 8 PS9830S431 96
Trial Mean 95 C.V. % 3.5 LSD .05 5 LSD .01 7 Planting Date: September 19, 2003 Notes: Trial was seeded into relatively heavy HRSW stubble. Good Fall moisture and excellent plant stands going into freeze up. Relatively good winter snow cover.
Table 34. Grain Yield and Height of Elite Winter Pea Lines Evaluated in 2003-04 Crop-Year at CBARC, Pendleton, Oregon. Data from Stephen Machado, Oregon State University Entry # Accession # Grain yield Plant height
(lb/a) (in)
1 PS9830F010 2628.0 52.0 2 PS9830S431 1902.4 42.8 3 PS9630448 2367.1 47.3 4 PS9830S358 2859.3 33.5 5 PS9830F011 2459.7 33.1 6 PS9830F009 3136.8 45.8
LSD0.05 - 1183 11.0
40
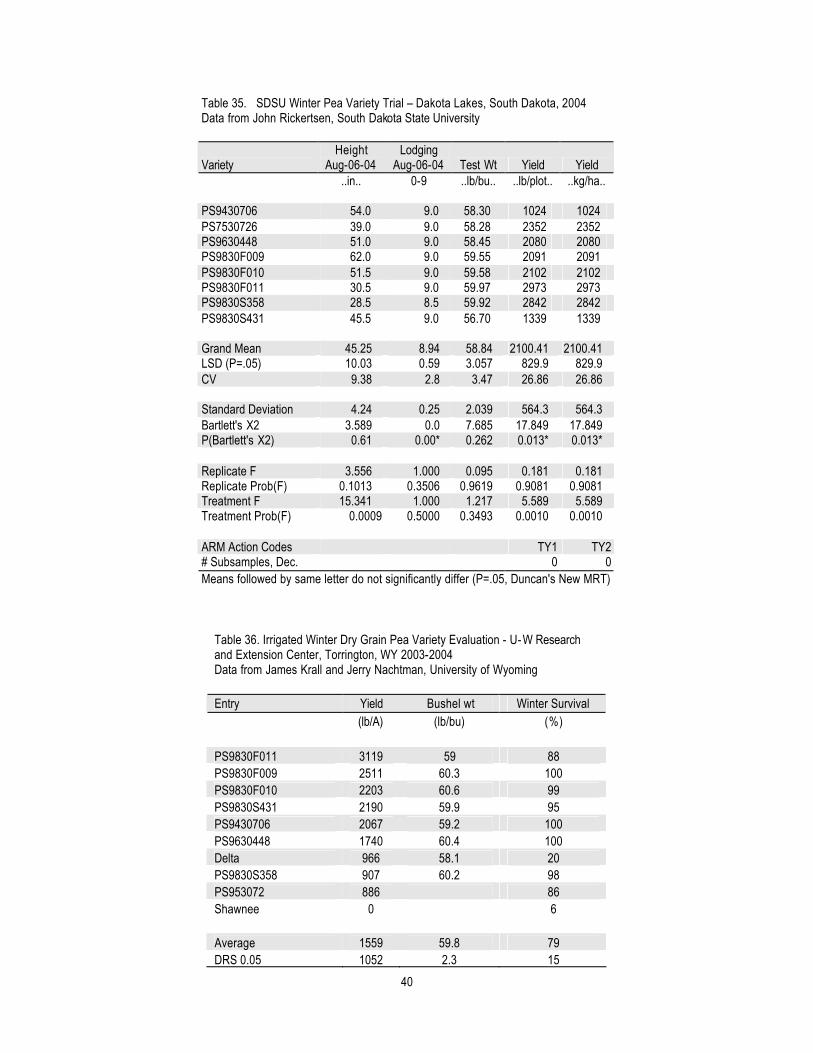
Table 35. SDSU Winter Pea Variety Trial – Dakota Lakes, South Dakota, 2004 Data from John Rickertsen, South Dakota State University
Variety Height
Aug-06-04 Lodging
Aug-06-04 Test Wt Yield Yield ..in.. 0-9 ..lb/bu.. ..lb/plot.. ..kg/ha..
PS9430706 54.0 9.0 58.30 1024 1024 PS7530726 39.0 9.0 58.28 2352 2352 PS9630448 51.0 9.0 58.45 2080 2080 PS9830F009 62.0 9.0 59.55 2091 2091 PS9830F010 51.5 9.0 59.58 2102 2102 PS9830F011 30.5 9.0 59.97 2973 2973 PS9830S358 28.5 8.5 59.92 2842 2842 PS9830S431 45.5 9.0 56.70 1339 1339 Grand Mean 45.25 8.94 58.84 2100.41 2100.41 LSD (P=.05) 10.03 0.59 3.057 829.9 829.9 CV 9.38 2.8 3.47 26.86 26.86 Standard Deviation 4.24 0.25 2.039 564.3 564.3 Bartlett's X2 3.589 0.0 7.685 17.849 17.849 P(Bartlett's X2) 0.61 0.00* 0.262 0.013* 0.013* Replicate F 3.556 1.000 0.095 0.181 0.181 Replicate Prob(F) 0.1013 0.3506 0.9619 0.9081 0.9081 Treatment F 15.341 1.000 1.217 5.589 5.589 Treatment Prob(F) 0.0009 0.5000 0.3493 0.0010 0.0010 ARM Action Codes TY1 TY2 # Subsamples, Dec. 0 0 Means followed by same letter do not significantly differ (P=.05, Duncan's New MRT)
Table 36. Irrigated Winter Dry Grain Pea Variety Evaluation - U-W Research and Extension Center, Torrington, WY 2003-2004 Data from James Krall and Jerry Nachtman, University of Wyoming Entry Yield Bushel wt Winter Survival (lb/A) (lb/bu) (%) PS9830F011 3119 59 88 PS9830F009 2511 60.3 100 PS9830F010 2203 60.6 99 PS9830S431 2190 59.9 95 PS9430706 2067 59.2 100 PS9630448 1740 60.4 100 Delta 966 58.1 20 PS9830S358 907 60.2 98 PS953072 886 86 Shawnee 0 6 Average 1559 59.8 79 DRS 0.05 1052 2.3 15
41
Lentil Trials Twelve spring lentil entries in the Western Regional Yield Trial were evaluated at 14 locations across five states (Table ). The entries comprised three checks, ‘Pennell’, ‘Merrit’ and ‘Castillion’, and nine breeding lines including three Laird, two each of Eston, Pardina and Turkish Red types. Information regarding experimental design, location and specific observations for some of the locations are included below. The highest yielding line was LC1602307E (1679 lb/a) and the checks produced average yields of 1410, 1390, and 1267 lb/a for Pennell, Merrit, and Castillion, respectively. LC860616L, a line proposed for release, produced average yield of 1285 lb/a. Overall, the large-seeded lines produced greater seed yield than the small-seeded lines. Powell, WY Seeds were planted on May 14. At flowering time, plants getting yellowish one after one. By the first week of August, most of the plants died. (Abdel Mesbah)

42
Table 37. Summary of Locations Participating in the 2004 Spring Lentil Western Regional Yield Trial Nurseries Location Contact Conditions No. Sent Data Returned Data Lost
Idaho Nez Perce Stephen Guy/Ying Wu Dryland ü - ü Moscow Stephen Guy/Ying Wu Dryland ü ü -
Montana Kalispell Duane Johnson/Louise Strange Dryland ü ü - Moccasin Chengci Chen/Karnes Neill Dryland ü ü -
Nebraska Box Butte David Balensperger/Glen Frickel Dryland ü - ü Sidney David Balensperger/Glen Frickel Dryalnd ü - ü Box Butte David Balensperger/Glen Frickel Irrigated ü - ü Scottsbluff David Balensperger/Glen Frickel Irrigated ü - ü Sidney David Balensperger/Glen Frickel Irrigated ü - ü
North Dakota Carrington Blaine Schatz/Steve Zwinger Dryland ü - ü Hettinger Eric Eriksmoen Dryland ü ü - Minot Mark Halvorson Dryland ü ü - Williston Meil Riveland Dryland ü ü -
Washington Walla Walla Fred Muehlbauer/Rick Short Dryland ü ü -
Wyoming Powell Abdel Mesbah Dryland ü - ü Torrington James Krall/Jerry Nachtman Dryland ü - ü Torrington James Krall/Jerry Nachtman Irrigated ü - ü Grand Totals 17 7 10

43
Table 38. Location Yield Summary (lb/a) for Western Regional Lentil Trials Location Pennell LC860359L LC860616L LC99602075L Merrit Castillion LC01600405T LC01602062T LC01602307E LC01602341E LC01601640P LC01602245P Moscow, ID 2060 1953 2709 2360 … 1964 … 2669 2251 2268 2457 … Kalispell, MT 566 754 587 496 720 617 854 761 777 840 860 701 Moccasin, MT 1315 1144 1147 1361 1461 1303 1466 1622 1748 1230 1580 1651 Carrington, ND 1835 … … … 2007 … … … … … … … Hettinger, ND 1289 1498 1417 1396 1534 1537 723 878 2249 903 384 791 Minot, ND 1743 1719 1320 1214 1187 1296 575 948 1764 640 282 434 Williston, ND 1529 1318 1242 1293 1381 1209 1144 1131 1352 1361 1254 1235 Walla Walla, WA 2016 2434 1996 1970 2055 1641 2154 2574 2185 1796 2290 2033 Grand Mean 1410 1478 1285 1288 1390 1267 1153 1319 1679 1128 1108 1141 Grand mean taken from locations with a complete set of data.

44
Table 39. Lentil Variety Performance Results at Moscow, ID - 2004 Data from Stephen Guy and Ying Wu, University of Idaho Variety or Selection Seed Yield Seed Weight Plant Height ----lb/acre---- ----g/100---- ----inches---- Brewer 2850 5.6 20 Castillion 1964 6.5 20 Crimson 2102 3.3 17 Eston 2471 3.1 19 Mason 2725 6.8 20 Merrit 2824 6.0 19 Pardina 2849 3.5 19 Pennell 2060 6.3 20 Richlea 2571 4.7 18 LC 860359L 1953 6.8 22 LC860616L 2709 7.3 19 LC 99602075L 2360 7.5 20 LC01602062T 2669 4.4 19 LC01602307E 2251 4.3 19 LC01602341E 2268 2.9 16 LC01601640P 2457 3.9 17 Average 2443 5.2 19 LSD (0.10) 270 0.4 1 CV (%) 17 5.6 10
Table 40. Seed Yield for Lentil Varieties Tested for Three Years In Northern Idaho Data from Stephen Guy and Ying Wu, University of Idaho Variety or Selection 2002 2003 2004 * Average …………………………..lb/acre………………………….. Brewer 1522 1285 2850 1693 Castillion 1390 1233 1964 1442 Crimson 1407 1074 2102 1413 Eston 1516 1229 2471 1592 Mason 1594 1297 2725 1701 Merrit 1557 1285 2824 1702 Pardina 1688 1426 2849 1815 Pennell 1590 1258 2060 1551 Richlea 1532 1426 2571 1697 Average 1533 1279 2491 1623 LSD (0.10) 100 180 270 -- * Moscow data only.
45
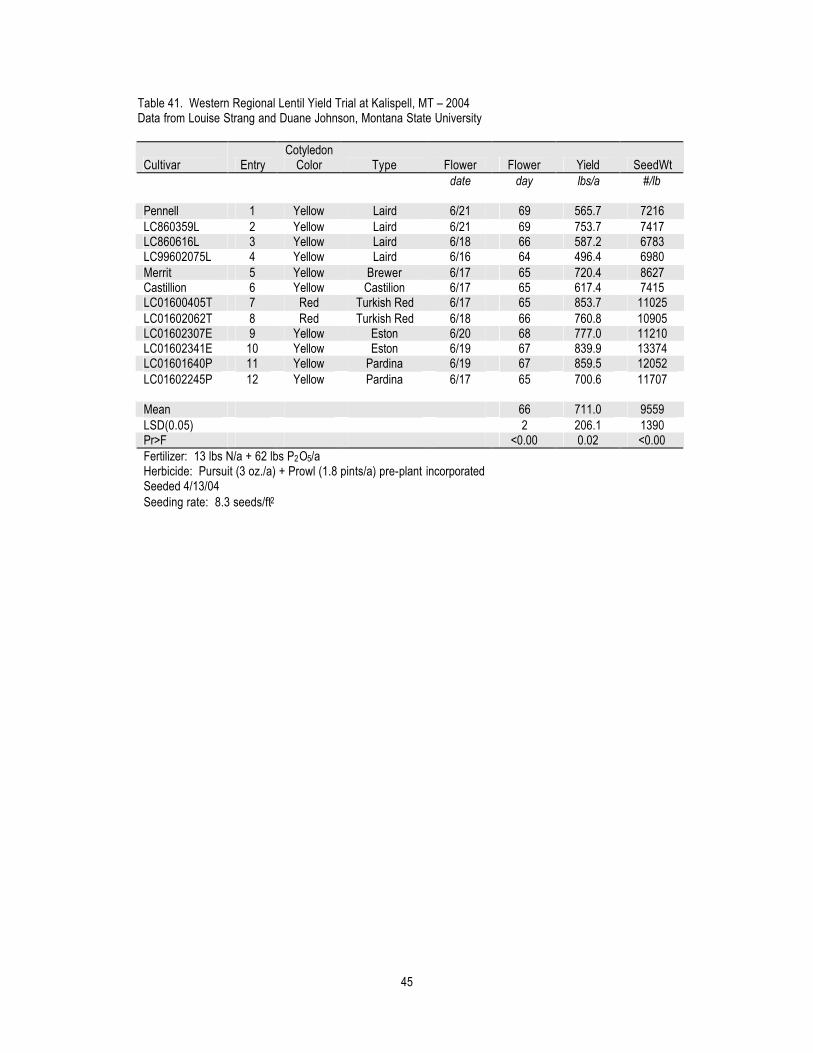
Table 41. Western Regional Lentil Yield Trial at Kalispell, MT – 2004 Data from Louise Strang and Duane Johnson, Montana State University
Cultivar Entry Cotyledon
Color Type Flower Flower Yield SeedWt date day lbs/a #/lb Pennell 1 Yellow Laird 6/21 69 565.7 7216 LC860359L 2 Yellow Laird 6/21 69 753.7 7417 LC860616L 3 Yellow Laird 6/18 66 587.2 6783 LC99602075L 4 Yellow Laird 6/16 64 496.4 6980 Merrit 5 Yellow Brewer 6/17 65 720.4 8627 Castillion 6 Yellow Castilion 6/17 65 617.4 7415 LC01600405T 7 Red Turkish Red 6/17 65 853.7 11025 LC01602062T 8 Red Turkish Red 6/18 66 760.8 10905 LC01602307E 9 Yellow Eston 6/20 68 777.0 11210 LC01602341E 10 Yellow Eston 6/19 67 839.9 13374 LC01601640P 11 Yellow Pardina 6/19 67 859.5 12052 LC01602245P 12 Yellow Pardina 6/17 65 700.6 11707 Mean 66 711.0 9559 LSD(0.05) 2 206.1 1390 Pr>F <0.00 0.02 <0.00 Fertilizer: 13 lbs N/a + 62 lbs P2O5/a Herbicide: Pursuit (3 oz./a) + Prowl (1.8 pints/a) pre-plant incorporated Seeded 4/13/04 Seeding rate: 8.3 seeds/ft2
46
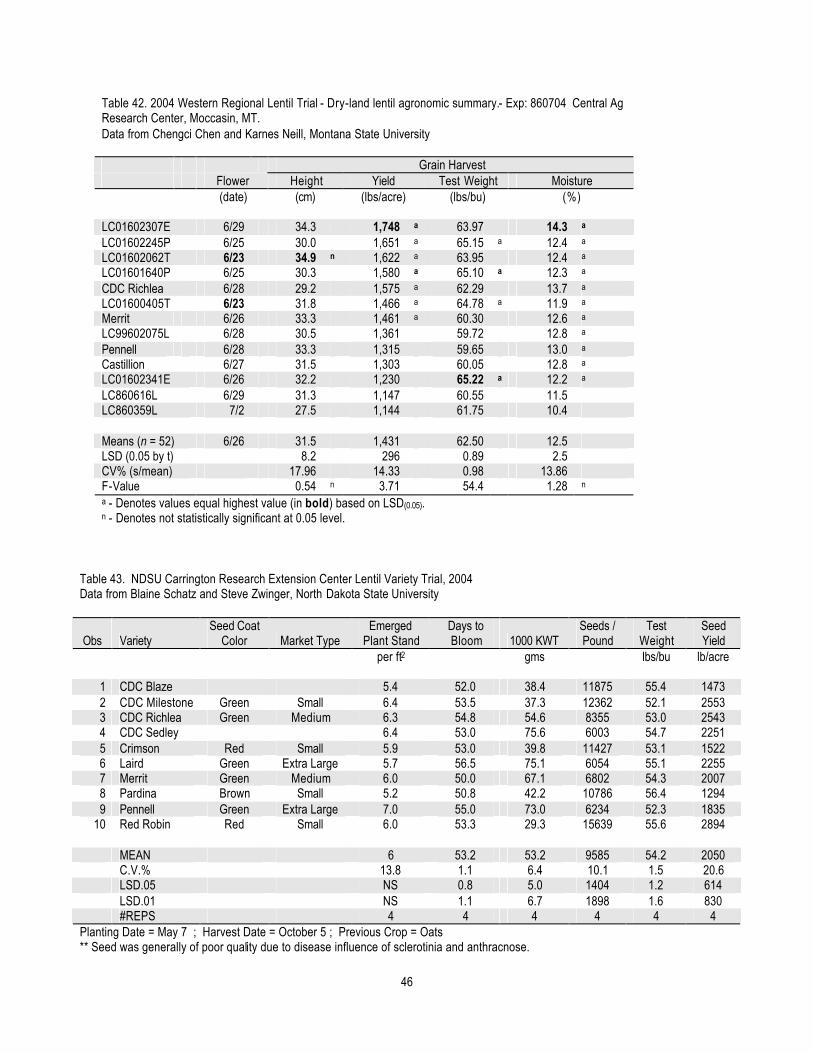
Table 42. 2004 Western Regional Lentil Trial - Dry-land lentil agronomic summary.- Exp: 860704 Central Ag Research Center, Moccasin, MT. Data from Chengci Chen and Karnes Neill, Montana State University Grain Harvest Flower Height Yield Test Weight Moisture (date) (cm) (lbs/acre) (lbs/bu) (%)
LC01602307E 6/29 34.3 1,748 a 63.97 14.3 a LC01602245P 6/25 30.0 1,651 a 65.15 a 12.4 a LC01602062T 6/23 34.9 n 1,622 a 63.95 12.4 a LC01601640P 6/25 30.3 1,580 a 65.10 a 12.3 a CDC Richlea 6/28 29.2 1,575 a 62.29 13.7 a LC01600405T 6/23 31.8 1,466 a 64.78 a 11.9 a Merrit 6/26 33.3 1,461 a 60.30 12.6 a LC99602075L 6/28 30.5 1,361 59.72 12.8 a Pennell 6/28 33.3 1,315 59.65 13.0 a Castillion 6/27 31.5 1,303 60.05 12.8 a LC01602341E 6/26 32.2 1,230 65.22 a 12.2 a LC860616L 6/29 31.3 1,147 60.55 11.5 LC860359L 7/2 27.5 1,144 61.75 10.4 Means (n = 52) 6/26 31.5 1,431 62.50 12.5 LSD (0.05 by t) 8.2 296 0.89 2.5 CV% (s/mean) 17.96 14.33 0.98 13.86 F-Value 0.54 n 3.71 54.4 1.28 n a - Denotes values equal highest value (in bold) based on LSD(0.05). n - Denotes not statistically significant at 0.05 level.
Table 43. NDSU Carrington Research Extension Center Lentil Variety Trial, 2004 Data from Blaine Schatz and Steve Zwinger, North Dakota State University
Obs Variety Seed Coat
Color Market Type Emerged
Plant Stand Days to Bloom 1000 KWT
Seeds / Pound
Test Weight
Seed Yield
per ft2 gms lbs/bu lb/acre
1 CDC Blaze 5.4 52.0 38.4 11875 55.4 1473 2 CDC Milestone Green Small 6.4 53.5 37.3 12362 52.1 2553 3 CDC Richlea Green Medium 6.3 54.8 54.6 8355 53.0 2543 4 CDC Sedley 6.4 53.0 75.6 6003 54.7 2251 5 Crimson Red Small 5.9 53.0 39.8 11427 53.1 1522 6 Laird Green Extra Large 5.7 56.5 75.1 6054 55.1 2255 7 Merrit Green Medium 6.0 50.0 67.1 6802 54.3 2007 8 Pardina Brown Small 5.2 50.8 42.2 10786 56.4 1294 9 Pennell Green Extra Large 7.0 55.0 73.0 6234 52.3 1835
10 Red Robin Red Small 6.0 53.3 29.3 15639 55.6 2894 MEAN 6 53.2 53.2 9585 54.2 2050
C.V.% 13.8 1.1 6.4 10.1 1.5 20.6 LSD.05 NS 0.8 5.0 1404 1.2 614 LSD.01 NS 1.1 6.7 1898 1.6 830 #REPS 4 4 4 4 4 4 Planting Date = May 7 ; Harvest Date = October 5 ; Previous Crop = Oats ** Seed was generally of poor quality due to disease influence of sclerotinia and anthracnose.

47
Table 44. Western Regional Lentil Nursery – Continuously Cropped - No-till, Hettinger, North Dakota, 2004 Data from Eric Eriksmoen, North Dakota State University Entry #
Cultivar
Days to Bloom
Plant Height
1000 Seed wt.
Test Weight
Seed Yield
cm grams Lbs/bu Lbs/Ac 1 Pennell 73 20 63.3 58.5 1289 2 LC860359L 74 26 60.0 60.0 1498 3 LC860616L 72 27 60.0 57.6 1417 4 LC99602075L 72 25 67.3 59.0 1396 5 Merrit 71 23 60.0 59.1 1534 6 Castillion 72 23 65.3 58.8 1537 7 LC01600405T 71 19 39.3 60.8 723 8 LC01602062T 72 18 40.0 61.6 878 9 LC01602307E 72 25 45.3 60.3 2249 10 LC01602341E 71 22 32.7 60.9 903 11 LC01601640P 71 16 38.0 -- 384 12 LC01602245P 72 19 36.7 -- 791
Trial Mean 72 22 50.7 59.3 1217 C.V. % 0.5 11.4 5.1 1.0 25.3 LSD .05 1 4 4.4 1.1 521 LSD .01 1 6 6.0 1.5 709 Planting Date: April 6, 2004, Harvest Date: August 10, 2004 Previous Crop: barley. Notes: The trial sustained hard frosts on May 13 (18o F), May 14 (16o F) and on June 18 (25o F). Growing season precip. (April – July) = 5.43 inches.
Table45. North Central Research Extension Center Western Regional Lentil Variety Trial at Minot, 2004 Data from Mark Halvorson, North Dakota State University
Seed Yield Variety
Days to Flower
Bloom Duration
Plant Height Lodge Shatter
Seed Weight
Test Weight 2002 2003 2004 2 Year 3 Year
in 0-9 0-9 g/1000 lb/bu ---------------- lb/A--------------- Pennell (LC460197L) 63 14 12 5.5 5.8 73.1 51.1 -- 1871 1743 1807 -- LC860359L 64 13 12 3.8 3.5 76.5 53.7 -- 1431 1719 1575 -- LC860616L 63 13 12 5.3 4.5 79.9 52.0 -- -- 1320 -- -- LC99602075L 63 13 11 6.5 5.0 82.5 51.5 -- 1121 1214 1167 -- Merrit (LC460266B) 63 14 13 6.3 6.3 65.6 52.8 -- 1598 1187 1393 -- Castillion (LC760209C) 63 13 13 5.8 6.0 77.0 52.6 -- 1562 1296 1429 -- LC01600405T 63 13 10 7.3 6.3 47.7 55.2 -- -- 575 -- -- LC01602062T 63 14 12 6.0 6.0 43.6 55.2 -- -- 948 -- -- LC01602307E 63 14 11 5.8 4.8 48.6 54.8 -- -- 1764 -- -- LC01602341E 64 13 9 6.0 5.0 36.1 52.4 -- -- 640 -- -- LC01601640P 64 13 9 6.8 5.0 43.0 -- -- -- 282 -- -- LC01602245P 64 13 9 7.5 4.5 42.9 58.5 -- -- 434 -- -- LSD 5% 0 NS 2 1.7 NS 7.5 2.0 -- 266 435 -- -- C.V.% 0.4 3.1 14.5 19.0 29.8 5.7 2.5 -- 13.4 27.5 -- -- Mean 63 13 11 6.0 5.2 59.7 53.6 -- 1365 1093 -- -- Lodging score based on scale 0-9 (0=upright, 9=flat) Shatter score based on scale 0-9 (0=no shatter) Hail on June 6 and August 25

48
Table 46. Western Lentil Yield Nursery - Williston Research Extension Center, 2004 Data from Neil Riveland, North Dakota State University
Canopy Cultivar Bloom Date Height Height
Test Weight
Seed Yield
1000 KWT Harvest
fr Plting cms inches lbs/b lbs/a gms Date Pennell 66.8 29.3 11.5 59.5 1527.1 73.0 Aug.17 LC860359L 67.8 31.3 12.3 61.9 1317.9 73.9 Aug.25 LC860616L 63.0 34.3 13.5 60.2 1242.2 79.8 Aug.25 LC99602075L 63.3 36.5 14.4 59.4 1293.3 81.1 Aug.25 Merrit 61.0 31.5 12.4 60.2 1381.0 66.2 Aug.25 Castillion 62.0 31.5 12.4 59.9 1209.2 76.7 Aug.25 LC01600405T 62.3 27.0 10.6 63.9 1144.2 45.1 Aug.17 LC01602062T 62.0 28.3 11.1 62.5 1131.2 46.1 Aug.17 LC01602307E 66.3 28.8 11.3 63.3 1352.4 49.0 Aug.25 LC01602341E 64.0 26.0 10.2 63.0 1361.2 35.2 Aug.17 LC01601640P 62.0 26.0 10.2 63.1 1254.2 45.4 Aug.17 LC01602245P 62.0 24.8 9.7 64.4 1234.6 42.2 Aug.17 High Mean 67.8 36.5 14.4 64.4 1527.1 81.1 Low Mean 61.0 24.8 9.7 59.4 1131.2 35.2 Exp Mean 63.5 29.6 11.6 61.8 1287.4 59.5 C.V. % 1.1 7.0 7.0 .5 11.8 3.0 LSD 5% 1.0 3.0 1.2 .6 218.1 3.9 LSD 1% 1.4 4.0 1.6 .9 NS 5.5 # of Reps 4 4 4 2 4 2 F-TRT 39.7 11.7 11.7 86.5 2.1 185.9 Location of the WREC: Latitude 48 8'; Longitude 103 44'W; Elevation 2105 ft. Planted: April 22 on Fallow. Applied Fertilizer in lbs/a:0N:0P2O5:0K:0SO4 Soil Test to two feet in lbs/a: 120N:23P:3315:50S 1.8 OM pH-5.4 Soil Type: Williams-Bowbells Loam Harvested: August 17 and 25 Harvested Area: 56 ft2 Trifluralin at 0.9 lbs/a ai PPI gave good weed control. Some hand weeding. Trial Design: RCBD Castillion had shattered 10% to !5% at harvest.
49
Table 47. Lentil Variety - Williston Research Extension Center, 2004 Data from Neil Riveland, North Dakota State University
Cultivar Flower
Date Plant
Height Plant
Height Test
Weight Seed Yield
Seed Yield
Seed Weight
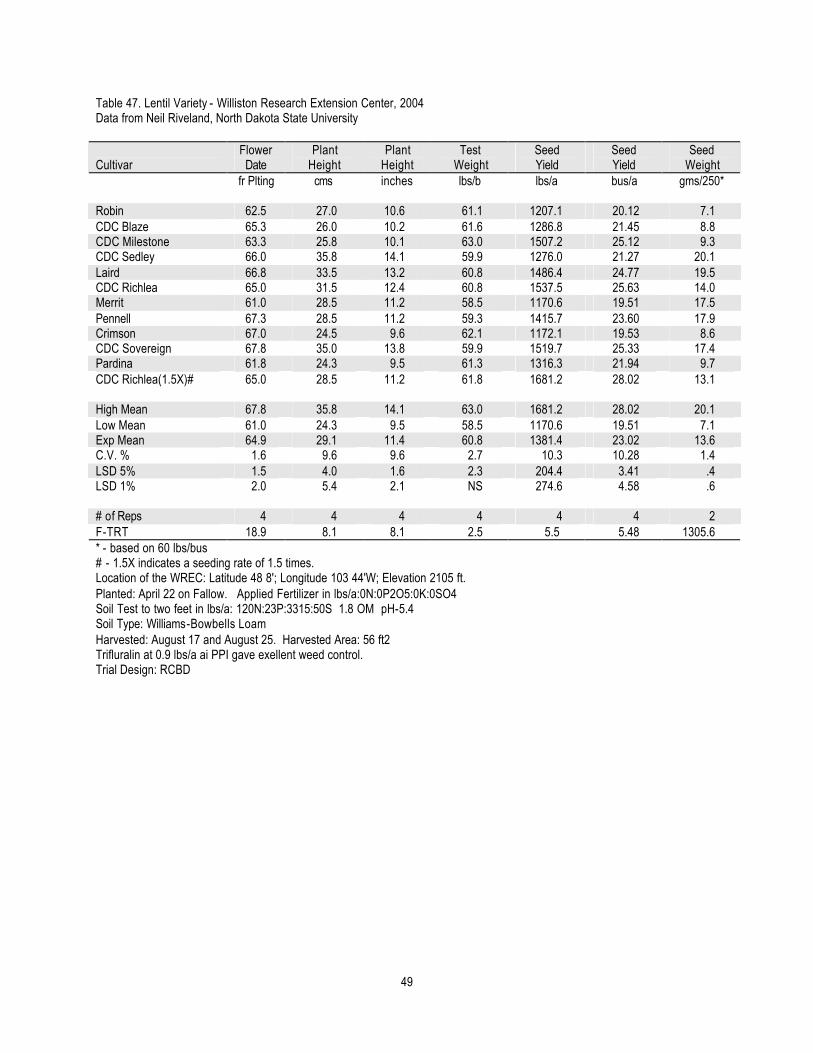
fr Plting cms inches lbs/b lbs/a bus/a gms/250* Robin 62.5 27.0 10.6 61.1 1207.1 20.12 7.1 CDC Blaze 65.3 26.0 10.2 61.6 1286.8 21.45 8.8 CDC Milestone 63.3 25.8 10.1 63.0 1507.2 25.12 9.3 CDC Sedley 66.0 35.8 14.1 59.9 1276.0 21.27 20.1 Laird 66.8 33.5 13.2 60.8 1486.4 24.77 19.5 CDC Richlea 65.0 31.5 12.4 60.8 1537.5 25.63 14.0 Merrit 61.0 28.5 11.2 58.5 1170.6 19.51 17.5 Pennell 67.3 28.5 11.2 59.3 1415.7 23.60 17.9 Crimson 67.0 24.5 9.6 62.1 1172.1 19.53 8.6 CDC Sovereign 67.8 35.0 13.8 59.9 1519.7 25.33 17.4 Pardina 61.8 24.3 9.5 61.3 1316.3 21.94 9.7 CDC Richlea(1.5X)# 65.0 28.5 11.2 61.8 1681.2 28.02 13.1 High Mean 67.8 35.8 14.1 63.0 1681.2 28.02 20.1 Low Mean 61.0 24.3 9.5 58.5 1170.6 19.51 7.1 Exp Mean 64.9 29.1 11.4 60.8 1381.4 23.02 13.6 C.V. % 1.6 9.6 9.6 2.7 10.3 10.28 1.4 LSD 5% 1.5 4.0 1.6 2.3 204.4 3.41 .4 LSD 1% 2.0 5.4 2.1 NS 274.6 4.58 .6 # of Reps 4 4 4 4 4 4 2 F-TRT 18.9 8.1 8.1 2.5 5.5 5.48 1305.6 * - based on 60 lbs/bus # - 1.5X indicates a seeding rate of 1.5 times. Location of the WREC: Latitude 48 8'; Longitude 103 44'W; Elevation 2105 ft. Planted: April 22 on Fallow. Applied Fertilizer in lbs/a:0N:0P2O5:0K:0SO4 Soil Test to two feet in lbs/a: 120N:23P:3315:50S 1.8 OM pH-5.4 Soil Type: Williams-Bowbells Loam Harvested: August 17 and August 25. Harvested Area: 56 ft2 Trifluralin at 0.9 lbs/a ai PPI gave exellent weed control. Trial Design: RCBD

50
Table 48. Western Regional Lentil Yield Trial, Walla Walla, WA, 2004 (0498) Data from USDA-ARS, Pullman Cultivar Origin Seed Yield ..kg/ha... LC01602062T X96L057 2892 LC860359L X93L035 2735 LC01601640P X93L018 2573 LC01602307E X98L047 2455 LC01600405T X96L063 2420 Merrit ……. 2309 LC01602245P X98L038 2284 Pennell ……. 2265 LC860616L X95L073 2243 LC99602075L X96L092 2213 LC01602341E X98L054 2018 Castillion X89L007 1844 Grand Mean 2354 C.V. (%) 12 LSD(α=0.05) 384 Planting date 3/31/04. Harvest date 7/26/04. Agronomic and yield data are means of three replications at Walla Walla, WA.
51
Winter Lentil Trials Eight winter lentil entries in the Western Regional Yield Trial were evaluated at 12 locations across five states. The entries comprised one check, ‘Morton’, and seven breeding lines. Data were collected from six locations (Tables 49 and 50), while the remaining six locations suffered from poor stand establishment and/or severe winter kill and were abandoned in spring. Information regarding experimental design, location and specific observations for some of the locations are included below. Morton produced an average yield of 1245 lb/a, while to breeding lines produced average yields of 1256 lb/a (LC9979065) and 1255 lb/a (LC9979120). WA8649041, a longstanding winterhardy check line, produced an average seed yield of 916 lb/a. Williston, ND We planted the "Fall Seeded" material. The fall of 2003 was very dry so no emergence or even germination occurred. There were a few plants of lentils and a few more peas plants in the plots in the spring but tilled them down as the area was very weedy also. We did plant them again this fall. (Neil Riveland) Carrington, ND We did plant the fall sown field pea and lentil nursery. In both cases the stands that survived were very poor. I do believe that Carrington trials reflected the best winter survival among the four North Dakota sites. This comment is based on feedback from the other site agronomists. However, the degree of survival and the consistency of plants did not allow for yield determinations. We did make some selections from within each nursery. I believe we had some segregation for improved winter survival. I made selections from within two lines and then made one composite selection for each crop. These three lines were then included with the other lines you sent for this falls winter nurseries. (Blaine Schatz) Minot, ND We did plant them, however the lentils did not make any yield and the dry pea material was harvested by plot (few plants / plot) and samples were sent back to Fred. No yield data on that material. (Mark Halvorson) Bozeman, MT We did plant them in a timely fashion next to the agronomy studies out at Amsterdam, but like the agronomy studies, emergence was practically zero and so we abandoned them in the spring. You should probably make a note of this since we did everything we could and mother Nature took over and wiped us out. Spring pea in that field produced 55 bu/ac so it would have been an excellent year to get the trials through. (Perry Miller) Pendleton, OR Six lines of winter peas and 8 lines of winter lentils were grown at the Columbia Basin Agricultural Research Center (CBARC) in Pendleton (45ºN, 118º West, elevation 1440 ft). Soils at both stations are Walla Walla silt loams that are 4 to 6 feet deep. Pendleton received 20 inches of rain in the 2003-04 crop-year, when these crops were evaluated. Peas and lentils were planted on October 10, 2003 at a seeding rate of 7 and 20 seeds/ft2, respectively. The previous crop was winter wheat. Data obtained are presented below. For both crops, the plant stand was low due to poor germination and emergence. Seedbed conditions were not idea due to too much straw from the previous wheat crop. However, despite the low plant stands, both peas and lentils produced higher grain yields than in 2003. (Stephen Machado)

52
Table 49. Summary of Locations Participating in the 2004 Winter Lentil Western Regional Yield Trial Nurseries Location Contact Conditions No. Sent Data Returned Data Lost
Montana Bozeman Perry Miller Dryland ü - ü Kalispell Duane Johnson/Louise Strange Dryland ü ü - Moccasin Chengci Chen/Karnes Neill Dryalnd ü ü -
North Dakota Carrington Blaine Schatz/Steve Zwinger Dryland ü - ü Hettinger Eric Eriksmoen Dryland ü ü - Minot Mark Halvorson Dryland ü - ü Williston Neil Riveland Dryland ü - ü
Oregon Moro Brian Tuck Dryland ü - ü Pendleton Stephen Machado Dryland ü ü -
South Dakota Dakota Lakes John Rickertsen Dryland ü ü - Wall John Rickertsen Dryland ü ü -
Wyoming Torrington James Krall/Jerry Nachtman Dryland ü - ü Grand Totals 12 6 6
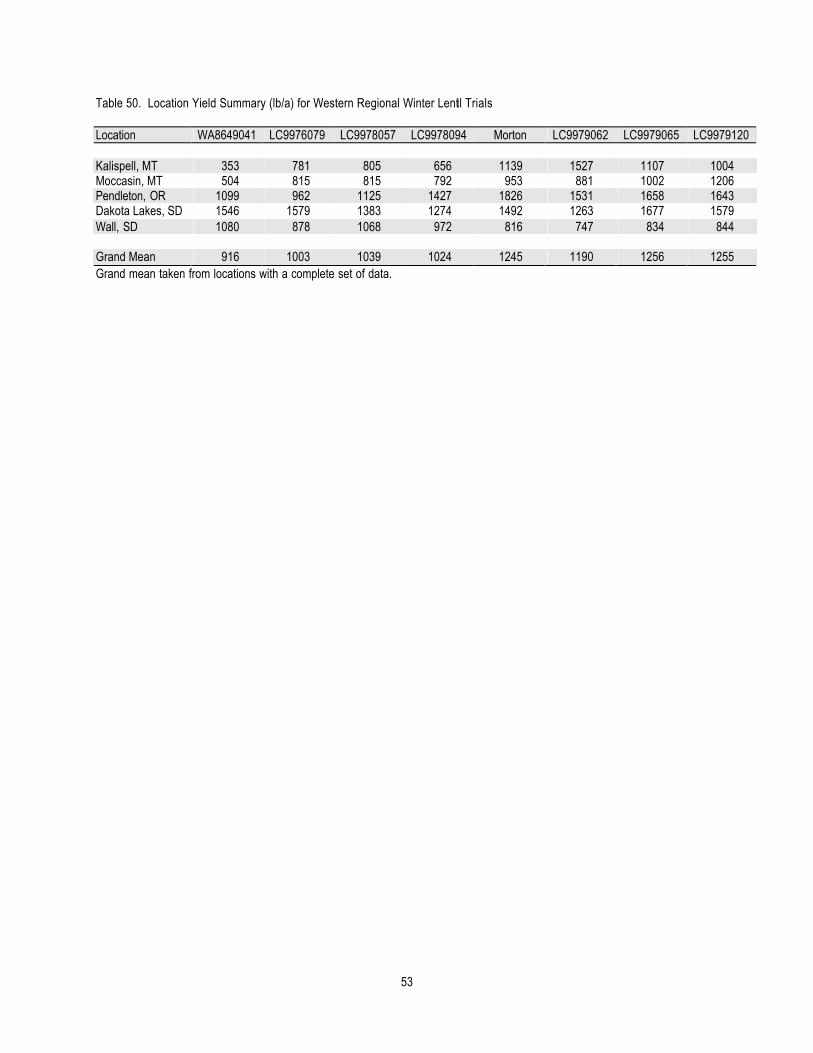
53
Table 50. Location Yield Summary (lb/a) for Western Regional Winter Lentil Trials Location WA8649041 LC9976079 LC9978057 LC9978094 Morton LC9979062 LC9979065 LC9979120 Kalispell, MT 353 781 805 656 1139 1527 1107 1004 Moccasin, MT 504 815 815 792 953 881 1002 1206 Pendleton, OR 1099 962 1125 1427 1826 1531 1658 1643 Dakota Lakes, SD 1546 1579 1383 1274 1492 1263 1677 1579 Wall, SD 1080 878 1068 972 816 747 834 844 Grand Mean 916 1003 1039 1024 1245 1190 1256 1255 Grand mean taken from locations with a complete set of data.

54
Table 51. Western Regional Winter Lentil Yield Trial at Kalispell, MT - 2004 Data from Louise Strang and Duane Johnson, Montana State University
Cultivar Spring Stand Flower Maturity Yield
Seed Size
% date date lbs/a #/lb WA8649041 88 6/1 7/21 353 18132 LC9976079 88 5/26 7/18 781 12671 LC9978057 90 5/26 7/18 805 12833 LC9978094 90 5/31 7/21 656 14055 LC9979010 89 5/31 7/19 1139 14024 LC9979062 76 5/26 7/20 1527 13993 LC9979065 79 6/1 7/20 1107 14578 LC9979120 88 5/31 7/20 1004 16998 Mean 86 922 14661 LSD(0.05) ns 333 1493 Pr>F 0.79 <0.00 <0.00 Seeded 9/24/03
Table 52. Western Regional Winter Lentil Trial - Dry-land winter lentil agronomy results- Exp: 840704. Central Ag. Research Center, Moccasin, MT – 2004 Data from Chengci Chen and Karnes Neill, Montana State University - Stand (Spring) - -Forage Production - ---------- Grain Production ---------- Selection Density Survival Canopy Dry Matter Canopy Yield Test Wt Moisture (#/m2) (%)1/ (cm) (lbs/acre) (cm) (lbs/acre) (lbs/bu) (%)
LC9979120 37.7 a 85.3a 27.3 2,008 31.5 1,206 a 65.45a 13.0 LC9979065 26.7 a 58.7 26.8 1,877 31.8 1,002 a 64.68 13.9a Morton 22.2 61.8 28.3 2,421 31.5 953 a 65.53a 13.2 LC9979062 21.7 64.1 31.8a 2,297 33.3a 881 64.7 13.7a LC9976079 18.6 53.2 29.0 2,847 32.8a 815 63.8 12.9 LC9978057 33.7 a 71.2a 25.9 1,264 29.0 815 64.81 13.9a LC9978094 37.5 a 88.5a 27.8 2,466 29.3 792 64.75 14.6a Toni (MSU release) 34.9 a 67.5 34.5a 4,129a 35.8a 545 63.83 14.2a WA8649041 33.4 a 78.2a 33.3a 3,398a 33.5a 504 64.25 12.8 Mean (n = 36) 29.6 69.8 29.7 3,523 32.0 835 64.64 13.56 LSD (0.05 by t) 15.3 18.7 3.0 965 3.3 254 0.4992 1.099 CV% (s/mean) 29.9 15.5 7.0 26.1 7.0 20.8 0.5 5.5 F-Value (8,23 df) 2.08 n 3.73n 8.95 6.65 3.60 6.25 12.92 2.94 1/ - Survival greater than 100% indicates seed germinated during winter or in early spring. a - Denotes values equal highest value (in bold) based on LSD(0.05). n - Denotes not statistically significant at 0.05 level.
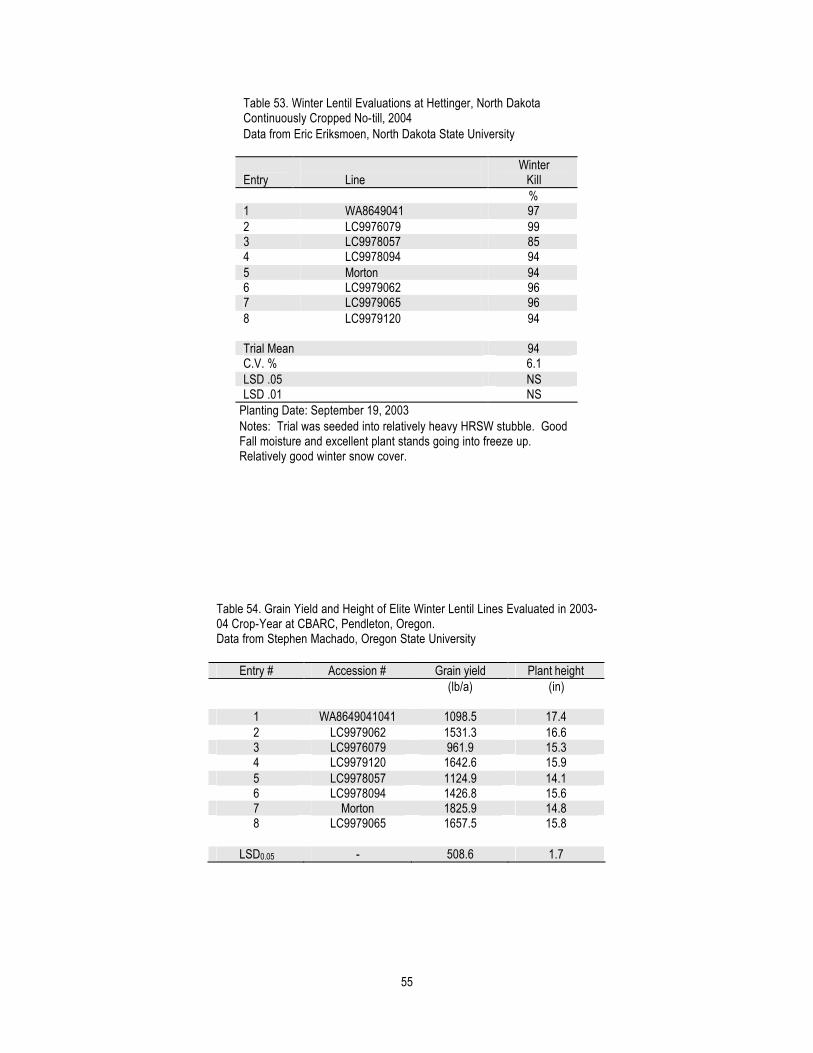
55
Table 53. Winter Lentil Evaluations at Hettinger, North Dakota Continuously Cropped No-till, 2004 Data from Eric Eriksmoen, North Dakota State University
Entry
Line Winter
Kill %
1 WA8649041 97 2 LC9976079 99 3 LC9978057 85 4 LC9978094 94 5 Morton 94 6 LC9979062 96 7 LC9979065 96 8 LC9979120 94 Trial Mean 94 C.V. % 6.1 LSD .05 NS LSD .01 NS
Planting Date: September 19, 2003 Notes: Trial was seeded into relatively heavy HRSW stubble. Good Fall moisture and excellent plant stands going into freeze up. Relatively good winter snow cover.
Table 54. Grain Yield and Height of Elite Winter Lentil Lines Evaluated in 2003-04 Crop-Year at CBARC, Pendleton, Oregon. Data from Stephen Machado, Oregon State University
Entry # Accession # Grain yield Plant height
(lb/a) (in)
1 WA8649041041 1098.5 17.4 2 LC9979062 1531.3 16.6 3 LC9976079 961.9 15.3 4 LC9979120 1642.6 15.9 5 LC9978057 1124.9 14.1 6 LC9978094 1426.8 15.6 7 Morton 1825.9 14.8 8 LC9979065 1657.5 15.8
LSD0.05 - 508.6 1.7
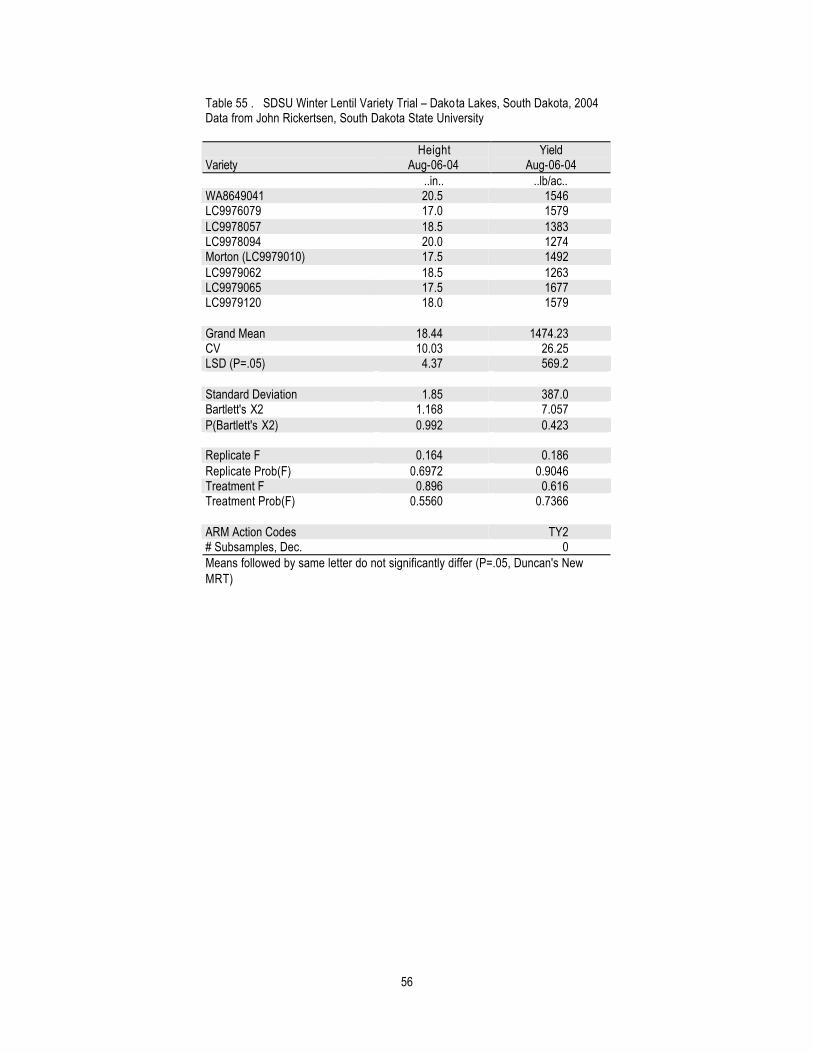
56
Table 55 . SDSU Winter Lentil Variety Trial – Dakota Lakes, South Dakota, 2004 Data from John Rickertsen, South Dakota State University
Variety Height
Aug-06-04 Yield
Aug-06-04 ..in.. ..lb/ac..
WA8649041 20.5 1546 LC9976079 17.0 1579 LC9978057 18.5 1383 LC9978094 20.0 1274 Morton (LC9979010) 17.5 1492 LC9979062 18.5 1263 LC9979065 17.5 1677 LC9979120 18.0 1579 Grand Mean 18.44 1474.23 CV 10.03 26.25 LSD (P=.05) 4.37 569.2 Standard Deviation 1.85 387.0 Bartlett's X2 1.168 7.057 P(Bartlett's X2) 0.992 0.423 Replicate F 0.164 0.186 Replicate Prob(F) 0.6972 0.9046 Treatment F 0.896 0.616 Treatment Prob(F) 0.5560 0.7366 ARM Action Codes TY2 # Subsamples, Dec. 0 Means followed by same letter do not significantly differ (P=.05, Duncan's New MRT)
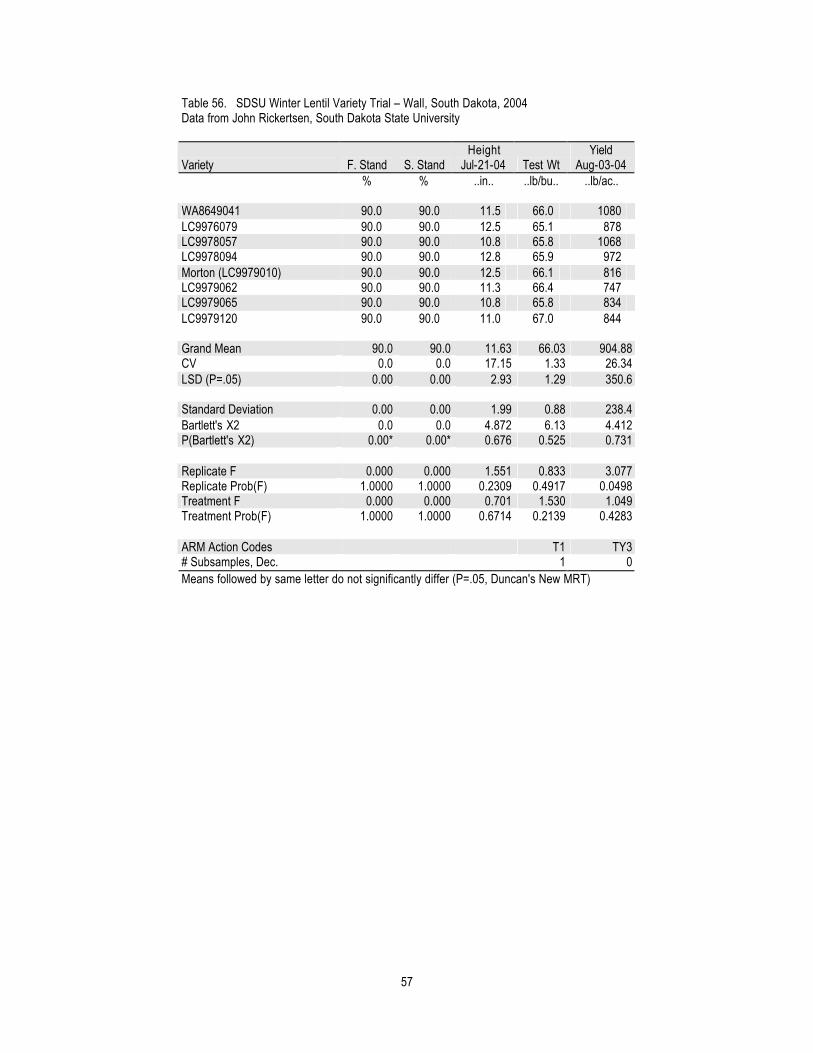
57
Table 56. SDSU Winter Lentil Variety Trial – Wall, South Dakota, 2004 Data from John Rickertsen, South Dakota State University
Variety F. Stand S. Stand Height
Jul-21-04 Test Wt Yield
Aug-03-04 % % ..in.. ..lb/bu.. ..lb/ac..
WA8649041 90.0 90.0 11.5 66.0 1080 LC9976079 90.0 90.0 12.5 65.1 878 LC9978057 90.0 90.0 10.8 65.8 1068 LC9978094 90.0 90.0 12.8 65.9 972 Morton (LC9979010) 90.0 90.0 12.5 66.1 816 LC9979062 90.0 90.0 11.3 66.4 747 LC9979065 90.0 90.0 10.8 65.8 834 LC9979120 90.0 90.0 11.0 67.0 844 Grand Mean 90.0 90.0 11.63 66.03 904.88 CV 0.0 0.0 17.15 1.33 26.34 LSD (P=.05) 0.00 0.00 2.93 1.29 350.6 Standard Deviation 0.00 0.00 1.99 0.88 238.4 Bartlett's X2 0.0 0.0 4.872 6.13 4.412 P(Bartlett's X2) 0.00* 0.00* 0.676 0.525 0.731 Replicate F 0.000 0.000 1.551 0.833 3.077 Replicate Prob(F) 1.0000 1.0000 0.2309 0.4917 0.0498 Treatment F 0.000 0.000 0.701 1.530 1.049 Treatment Prob(F) 1.0000 1.0000 0.6714 0.2139 0.4283 ARM Action Codes T1 TY3 # Subsamples, Dec. 1 0 Means followed by same letter do not significantly differ (P=.05, Duncan's New MRT)

58
Chickpea Trials Ten chickpea entries in the Western Regional Yield Trial were evaluated at 14 locations across six states. The entries comprised two checks, ‘Dwelley’ and ‘Sierra’, and seven breeding lines including four Café, three Spanish white and one desi type. The trials were conducted primarily under dryland conditions; however, three trials in NE and one in WY were irrigated. Information regarding experimental design, location and specific observations for some of the locations are included below. The two checks, Sierra and Dwelley, produced aveage seed yields of 1143 and 1306 lb/a, respectively. The highest yielding line in the trial was CA0090B3783C (1448 lb/a), a café type, and two breeding lines proposed for release, a café type, CA0090I604C and a Spanish white type, CA9890233W, produced average seed yields of 1083 and 921 lb/a, respectively. Nebraska Chickpea is another alternative crop that has worked in the Nebraska panhandle. Four trials were planted in 2004. Seed sources were local producers, the chickpea program at Washington State, and USDA Plant Introduction. Dryland and irrigated trials were planted on the Watson farm near Berea in Box Butte county, and also at the University of Nebraska High Plains Ag Lab near Sidney. The Sidney trials were destroyed by hail on July 29. At the Watson farm, the plots were planted on April 27. Both plots were direct seeded into corn stubble. The irrigated trial was fertilized with 25# P2O5. Spartan and Assure II were applied to both trials. The irrigated trial was treated with Headline fungicide. The dryland plot was harvested August 30, and the irrigated plot on September 20. Maturity was delayed by cool August weather, and damp conditions in September. (Glen Frickel) Wyoming Eight lines of chickpea were grown at the Powell Research and Extension Center (elevation: 4400 ft.) in northwestern Wyoming. The soil type was a Garland clay loam (fine, mixed, mesic typic Haplargid, 40% sand, 24% silt, and 36% clay) with 1.2% organic matter and pH 7.2. Chickpea seeds were only planted in rows spaced 22 inches apart. Plots were established under furrow irrigation and all lines were arranged in a randomized complete block design with four replications (Abdel Mesbah)
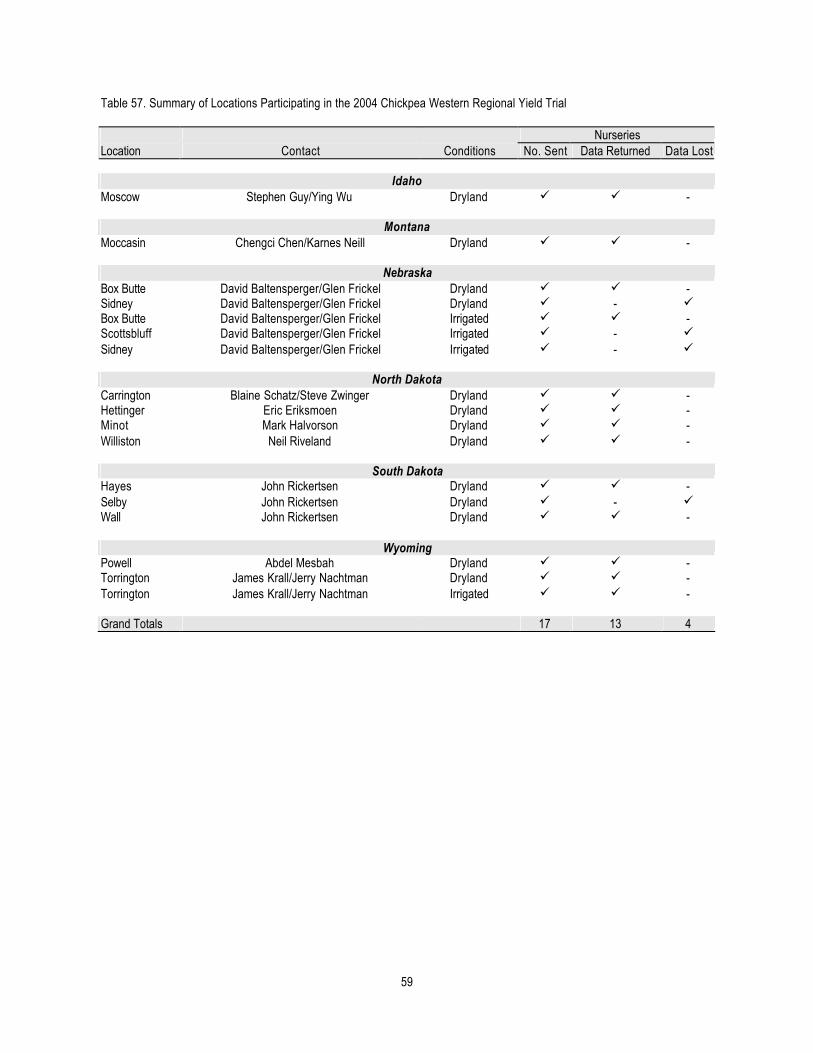
59
Table 57. Summary of Locations Participating in the 2004 Chickpea Western Regional Yield Trial Nurseries Location Contact Conditions No. Sent Data Returned Data Lost
Idaho Moscow Stephen Guy/Ying Wu Dryland ü ü -
Montana Moccasin Chengci Chen/Karnes Neill Dryland ü ü -
Nebraska Box Butte David Baltensperger/Glen Frickel Dryland ü ü - Sidney David Baltensperger/Glen Frickel Dryland ü - ü Box Butte David Baltensperger/Glen Frickel Irrigated ü ü - Scottsbluff David Baltensperger/Glen Frickel Irrigated ü - ü Sidney David Baltensperger/Glen Frickel Irrigated ü - ü
North Dakota Carrington Blaine Schatz/Steve Zwinger Dryland ü ü - Hettinger Eric Eriksmoen Dryland ü ü - Minot Mark Halvorson Dryland ü ü - Williston Neil Riveland Dryland ü ü -
South Dakota Hayes John Rickertsen Dryland ü ü - Selby John Rickertsen Dryland ü - ü Wall John Rickertsen Dryland ü ü -
Wyoming Powell Abdel Mesbah Dryland ü ü - Torrington James Krall/Jerry Nachtman Dryland ü ü - Torrington James Krall/Jerry Nachtman Irrigated ü ü - Grand Totals 17 13 4
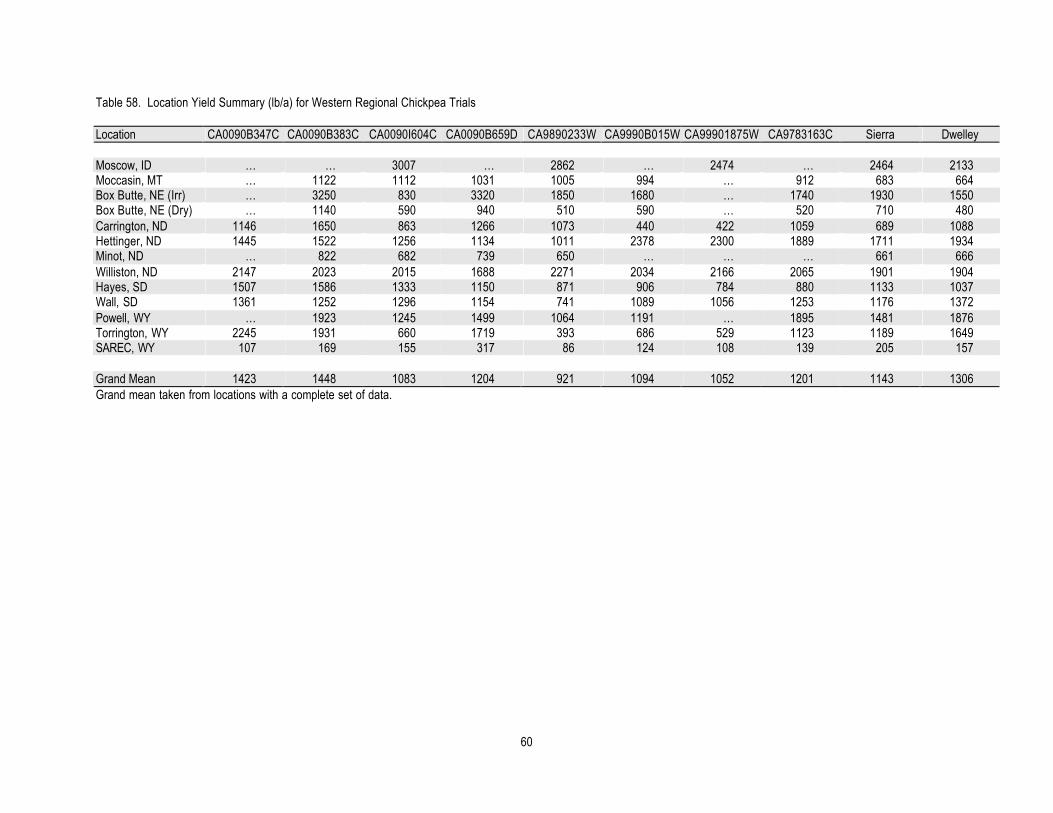
60
Table 58. Location Yield Summary (lb/a) for Western Regional Chickpea Trials Location CA0090B347C CA0090B383C CA0090I604C CA0090B659D CA9890233W CA9990B015W CA99901875W CA9783163C Sierra Dwelley Moscow, ID … … 3007 … 2862 … 2474 … 2464 2133 Moccasin, MT … 1122 1112 1031 1005 994 … 912 683 664 Box Butte, NE (Irr) … 3250 830 3320 1850 1680 … 1740 1930 1550 Box Butte, NE (Dry) … 1140 590 940 510 590 … 520 710 480 Carrington, ND 1146 1650 863 1266 1073 440 422 1059 689 1088 Hettinger, ND 1445 1522 1256 1134 1011 2378 2300 1889 1711 1934 Minot, ND … 822 682 739 650 … … … 661 666 Williston, ND 2147 2023 2015 1688 2271 2034 2166 2065 1901 1904 Hayes, SD 1507 1586 1333 1150 871 906 784 880 1133 1037 Wall, SD 1361 1252 1296 1154 741 1089 1056 1253 1176 1372 Powell, WY … 1923 1245 1499 1064 1191 … 1895 1481 1876 Torrington, WY 2245 1931 660 1719 393 686 529 1123 1189 1649 SAREC, WY 107 169 155 317 86 124 108 139 205 157 Grand Mean 1423 1448 1083 1204 921 1094 1052 1201 1143 1306 Grand mean taken from locations with a complete set of data.
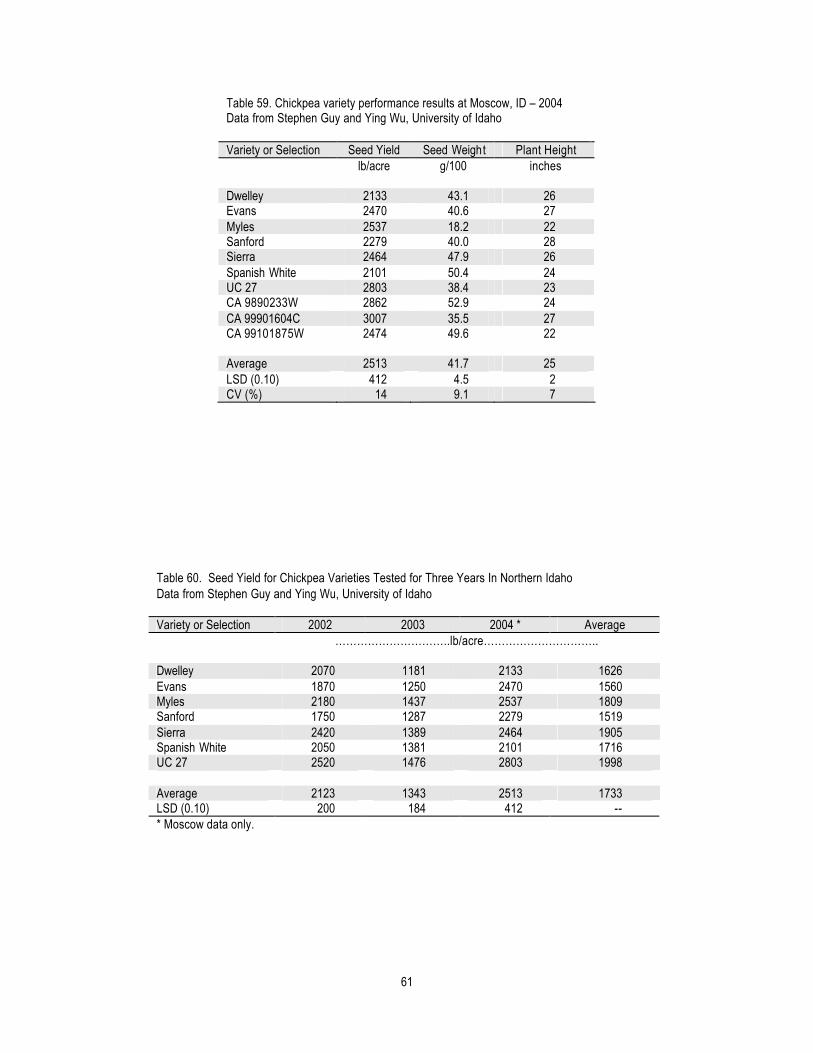
61
Table 59. Chickpea variety performance results at Moscow, ID – 2004 Data from Stephen Guy and Ying Wu, University of Idaho Variety or Selection Seed Yield Seed Weight Plant Height
lb/acre g/100 inches Dwelley 2133 43.1 26 Evans 2470 40.6 27 Myles 2537 18.2 22 Sanford 2279 40.0 28 Sierra 2464 47.9 26 Spanish White 2101 50.4 24 UC 27 2803 38.4 23 CA 9890233W 2862 52.9 24 CA 99901604C 3007 35.5 27 CA 99101875W 2474 49.6 22 Average 2513 41.7 25 LSD (0.10) 412 4.5 2 CV (%) 14 9.1 7
Table 60. Seed Yield for Chickpea Varieties Tested for Three Years In Northern Idaho Data from Stephen Guy and Ying Wu, University of Idaho Variety or Selection 2002 2003 2004 * Average …………………………..lb/acre………………………….. Dwelley 2070 1181 2133 1626 Evans 1870 1250 2470 1560 Myles 2180 1437 2537 1809 Sanford 1750 1287 2279 1519 Sierra 2420 1389 2464 1905 Spanish White 2050 1381 2101 1716 UC 27 2520 1476 2803 1998 Average 2123 1343 2513 1733 LSD (0.10) 200 184 412 -- * Moscow data only.
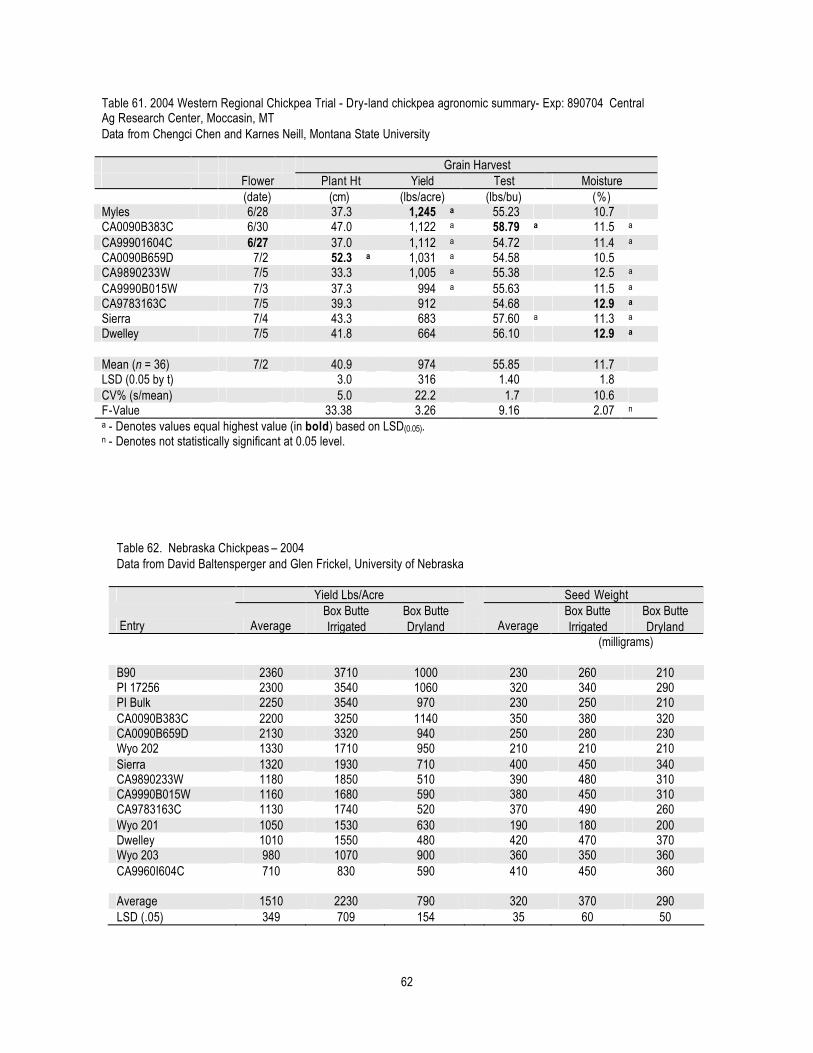
62
Table 61. 2004 Western Regional Chickpea Trial - Dry-land chickpea agronomic summary- Exp: 890704 Central Ag Research Center, Moccasin, MT Data from Chengci Chen and Karnes Neill, Montana State University Grain Harvest Flower Plant Ht Yield Test Moisture (date) (cm) (lbs/acre) (lbs/bu) (%) Myles 6/28 37.3 1,245 a 55.23 10.7 CA0090B383C 6/30 47.0 1,122 a 58.79 a 11.5 a CA99901604C 6/27 37.0 1,112 a 54.72 11.4 a CA0090B659D 7/2 52.3 a 1,031 a 54.58 10.5 CA9890233W 7/5 33.3 1,005 a 55.38 12.5 a CA9990B015W 7/3 37.3 994 a 55.63 11.5 a CA9783163C 7/5 39.3 912 54.68 12.9 a Sierra 7/4 43.3 683 57.60 a 11.3 a Dwelley 7/5 41.8 664 56.10 12.9 a Mean (n = 36) 7/2 40.9 974 55.85 11.7 LSD (0.05 by t) 3.0 316 1.40 1.8 CV% (s/mean) 5.0 22.2 1.7 10.6 F-Value 33.38 3.26 9.16 2.07 n a - Denotes values equal highest value (in bold) based on LSD(0.05). n - Denotes not statistically significant at 0.05 level.
Table 62. Nebraska Chickpeas – 2004 Data from David Baltensperger and Glen Frickel, University of Nebraska Yield Lbs/Acre Seed Weight
Entry Average Box Butte Irrigated
Box Butte Dryland Average
Box Butte Irrigated
Box Butte Dryland
(milligrams) B90 2360 3710 1000 230 260 210 PI 17256 2300 3540 1060 320 340 290 PI Bulk 2250 3540 970 230 250 210 CA0090B383C 2200 3250 1140 350 380 320 CA0090B659D 2130 3320 940 250 280 230 Wyo 202 1330 1710 950 210 210 210 Sierra 1320 1930 710 400 450 340 CA9890233W 1180 1850 510 390 480 310 CA9990B015W 1160 1680 590 380 450 310 CA9783163C 1130 1740 520 370 490 260 Wyo 201 1050 1530 630 190 180 200 Dwelley 1010 1550 480 420 470 370 Wyo 203 980 1070 900 360 350 360 CA9960I604C 710 830 590 410 450 360 Average 1510 2230 790 320 370 290 LSD (.05) 349 709 154 35 60 50

63
Table 63. NDSU Carrington Research Extension Center Western Regional Chickpea Nursery, 2004 Data from Blaine Schatz and Steve Zwinger, North Dakota State University
Obs Variety Market Class
Emerged Plant Stand
Days to Flower Pod Ht Plant Ht
1000 KWT
Seeds / Pound
Test Weight
Seed Yield
per ft2 inch inch gms lbs/bu lbs/ac
1 CA0090B347C Kabuli 3.0 53.0 12.9 24.9 316 1487 54.4 1146 2 CA0090B383C Kabuli 3.3 54.0 15.2 26.8 277 1686 52.4 1615 3 CA0090B659D Desi 3.3 54.0 14.2 26.8 251 1832 53.5 1266 4 Dwelly Kabuli 3.2 55.7 11.5 25.7 379 1215 53.8 1088 5 Sierra Kabuli 3.1 54.0 13.6 26.5 312 1472 53.1 689 6 CA9783163C Kabuli 3.8 57.0 12.3 24.4 333 1376 53.3 1059 7 CA9890233W Kabuli 3.3 56.0 12.6 26.8 359 1298 51.7 1073 8 CA99901604C Kabuli 3.5 56.0 11.8 26.5 356 1286 51.3 863 9 CA99901875W Kabuli 3.8 56.3 12.9 27.6 359 1269 51.0 422
10 CA9990B015W Kabuli 3.6 56.0 11.8 25.5 316 1446 50.6 440 MEAN 3.4 55.2 12.9 26.1 325 1441 52.6 939
C.V.% 15.2 1.2 16 10.9 12.9 13.9 3.1 24.5 LSD.05 NS 1 NS NS 62 297 NS NS LSD.01 NS 1.4 NS NS NS NS NS NS #REPS 4 4 4 4 4 4 4 4 Planting Date = May 17 ; Harvest Date = November 8 ; Previous Crop = Spring Wheat ** Seed yield attained was of low quality due to ascochyta and botrytis plant diseases.
Table 64. Western Regional Chickpea Nursery at Hettinger, North Dakota Continuously Cropped No-till, 2004 Data from Eric Eriksmoen, North Dakota State University Entry
Line
Date of 10% Bloom
Plant Ht at Harvest
Disease
Test Weight
1000 Seed wt
Yield
Julian cm 0-9* lbs/bu grams lbs/Ac 1 Dwelley 173 34 2.7 60.1 527 1934 2 Sierra 172 33 2.3 58.9 527 1711 3 CA9783163C 174 35 1.0 57.4 532 1889 4 CA99901604C 171 28 1.0 57.3 584 1256 5 CA0090B347C 171 29 4.7 60.3 452 1445 6 CA0090B383C 172 29 3.7 58.3 403 1522 7 CA9890233W 174 30 1.0 57.5 525 1011 8 CA99901875W 173 33 1.0 57.8 622 2300 9 CA9990B015W 174 27 1.0 58.2 561 2378 10 CA0090B659D 170 35 4.0 57.7 399 1134
Trial Mean 173 31 2.2 58.4 513 1658
C.V. % 0.6 9.8 30.3 1.1 13.0 9.6 LSD .05 1 5 1.2 1.1 115 273 LSD .01 2 NS 1.6 1.6 158 375
*Ascochyta disease rating on August 3: 0 = none, 9 = completely dead. Planting Date: April 6, 2004 Harvest Date: September 16, 2004 Previous Crop: barley Note: Hard frost (25o F) on June 18 during bloom and pod set.
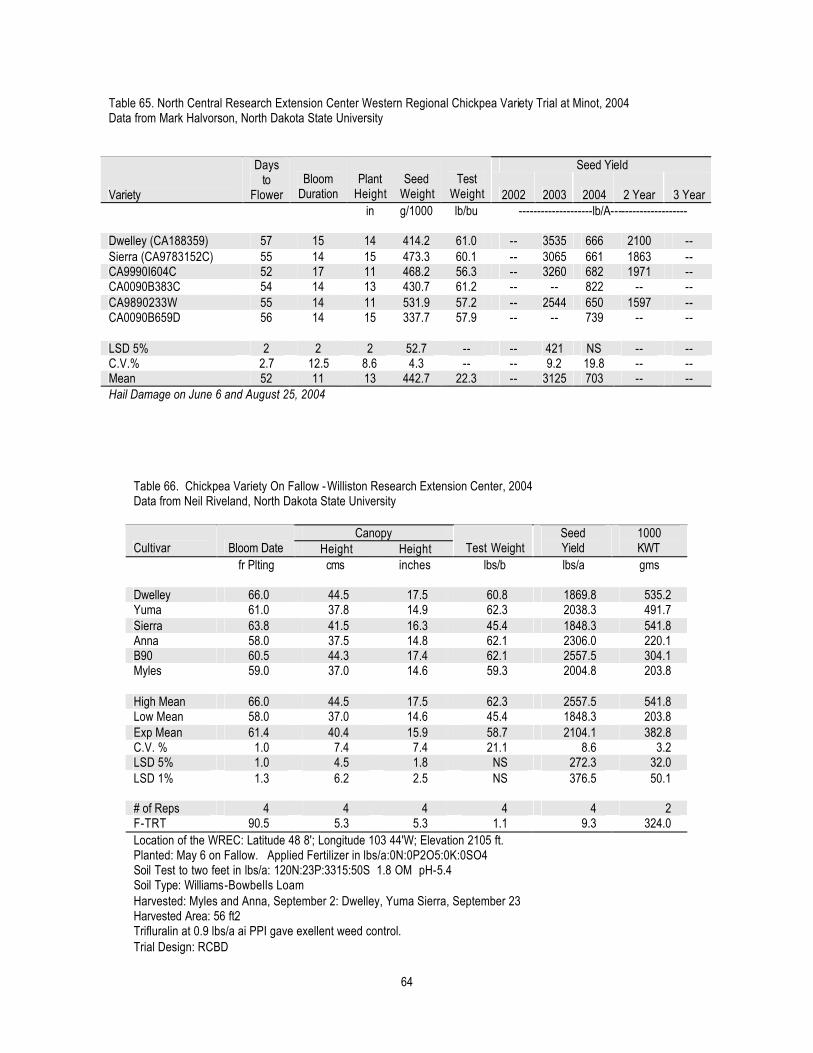
64
Table 65. North Central Research Extension Center Western Regional Chickpea Variety Trial at Minot, 2004 Data from Mark Halvorson, North Dakota State University
Seed Yield
Variety
Days to
Flower Bloom
Duration Plant
Height Seed
Weight Test
Weight 2002 2003 2004 2 Year 3 Year in g/1000 lb/bu --------------------lb/A--------------------- Dwelley (CA188359) 57 15 14 414.2 61.0 -- 3535 666 2100 -- Sierra (CA9783152C) 55 14 15 473.3 60.1 -- 3065 661 1863 -- CA9990I604C 52 17 11 468.2 56.3 -- 3260 682 1971 -- CA0090B383C 54 14 13 430.7 61.2 -- -- 822 -- -- CA9890233W 55 14 11 531.9 57.2 -- 2544 650 1597 -- CA0090B659D 56 14 15 337.7 57.9 -- -- 739 -- -- LSD 5% 2 2 2 52.7 -- -- 421 NS -- -- C.V.% 2.7 12.5 8.6 4.3 -- -- 9.2 19.8 -- -- Mean 52 11 13 442.7 22.3 -- 3125 703 -- -- Hail Damage on June 6 and August 25, 2004
Table 66. Chickpea Variety On Fallow -Williston Research Extension Center, 2004 Data from Neil Riveland, North Dakota State University
Canopy Cultivar Bloom Date Height Height Test Weight
Seed Yield
1000 KWT
fr Plting cms inches lbs/b lbs/a gms Dwelley 66.0 44.5 17.5 60.8 1869.8 535.2 Yuma 61.0 37.8 14.9 62.3 2038.3 491.7 Sierra 63.8 41.5 16.3 45.4 1848.3 541.8 Anna 58.0 37.5 14.8 62.1 2306.0 220.1 B90 60.5 44.3 17.4 62.1 2557.5 304.1 Myles 59.0 37.0 14.6 59.3 2004.8 203.8 High Mean 66.0 44.5 17.5 62.3 2557.5 541.8 Low Mean 58.0 37.0 14.6 45.4 1848.3 203.8 Exp Mean 61.4 40.4 15.9 58.7 2104.1 382.8 C.V. % 1.0 7.4 7.4 21.1 8.6 3.2 LSD 5% 1.0 4.5 1.8 NS 272.3 32.0 LSD 1% 1.3 6.2 2.5 NS 376.5 50.1 # of Reps 4 4 4 4 4 2 F-TRT 90.5 5.3 5.3 1.1 9.3 324.0 Location of the WREC: Latitude 48 8'; Longitude 103 44'W; Elevation 2105 ft. Planted: May 6 on Fallow. Applied Fertilizer in lbs/a:0N:0P2O5:0K:0SO4 Soil Test to two feet in lbs/a: 120N:23P:3315:50S 1.8 OM pH-5.4 Soil Type: Williams-Bowbells Loam Harvested: Myles and Anna, September 2: Dwelley, Yuma Sierra, September 23 Harvested Area: 56 ft2 Trifluralin at 0.9 lbs/a ai PPI gave exellent weed control. Trial Design: RCBD
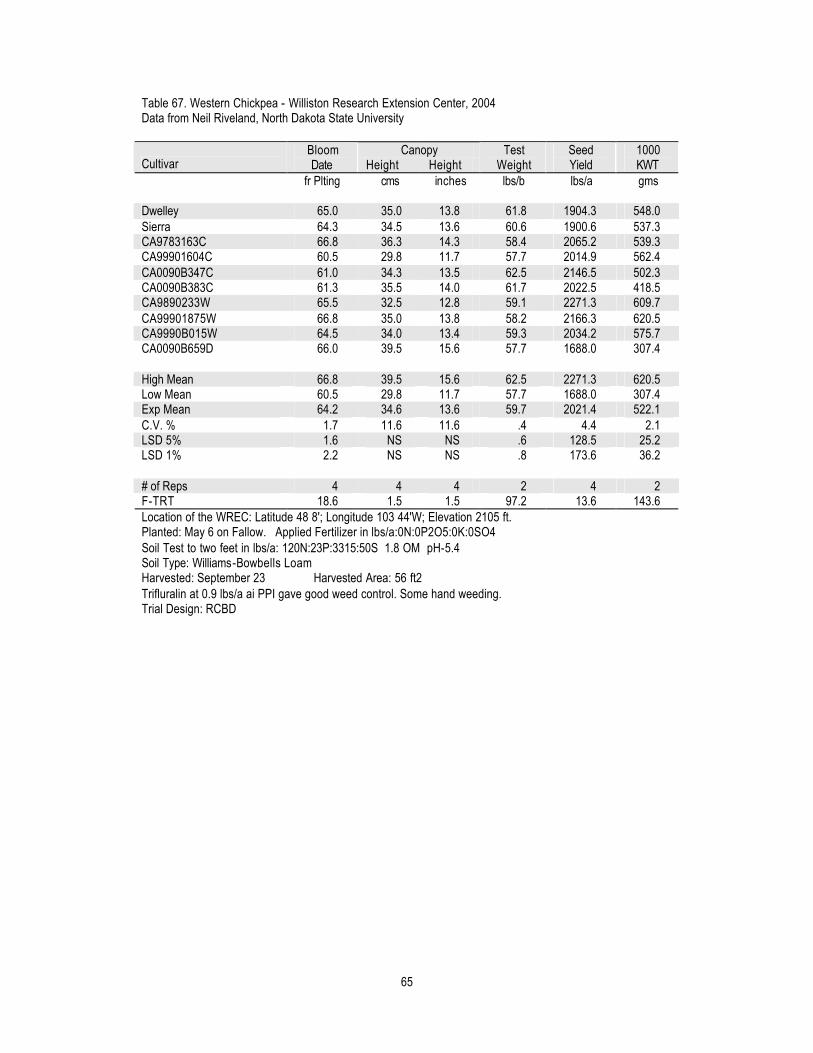
65
Table 67. Western Chickpea - Williston Research Extension Center, 2004 Data from Neil Riveland, North Dakota State University
Canopy Cultivar
Bloom Date Height Height
Test Weight
Seed Yield
1000 KWT
fr Plting cms inches lbs/b lbs/a gms Dwelley 65.0 35.0 13.8 61.8 1904.3 548.0 Sierra 64.3 34.5 13.6 60.6 1900.6 537.3 CA9783163C 66.8 36.3 14.3 58.4 2065.2 539.3 CA99901604C 60.5 29.8 11.7 57.7 2014.9 562.4 CA0090B347C 61.0 34.3 13.5 62.5 2146.5 502.3 CA0090B383C 61.3 35.5 14.0 61.7 2022.5 418.5 CA9890233W 65.5 32.5 12.8 59.1 2271.3 609.7 CA99901875W 66.8 35.0 13.8 58.2 2166.3 620.5 CA9990B015W 64.5 34.0 13.4 59.3 2034.2 575.7 CA0090B659D 66.0 39.5 15.6 57.7 1688.0 307.4 High Mean 66.8 39.5 15.6 62.5 2271.3 620.5 Low Mean 60.5 29.8 11.7 57.7 1688.0 307.4 Exp Mean 64.2 34.6 13.6 59.7 2021.4 522.1 C.V. % 1.7 11.6 11.6 .4 4.4 2.1 LSD 5% 1.6 NS NS .6 128.5 25.2 LSD 1% 2.2 NS NS .8 173.6 36.2 # of Reps 4 4 4 2 4 2 F-TRT 18.6 1.5 1.5 97.2 13.6 143.6 Location of the WREC: Latitude 48 8'; Longitude 103 44'W; Elevation 2105 ft. Planted: May 6 on Fallow. Applied Fertilizer in lbs/a:0N:0P2O5:0K:0SO4 Soil Test to two feet in lbs/a: 120N:23P:3315:50S 1.8 OM pH-5.4 Soil Type: Williams-Bowbells Loam Harvested: September 23 Harvested Area: 56 ft2 Trifluralin at 0.9 lbs/a ai PPI gave good weed control. Some hand weeding. Trial Design: RCBD

66
Table 68. SDSU Chickpea Variety Trial – Hayes, South Dakota – 2004 Data from John Rickertsen, South Dakota State University Variety Height Lodging Test Wt Yield Yield inches 0-9* lb/bu lb/ac kg/ha Dwelley 16 0 56.1 1037 1162 Sierra 16 0 54.3 1133 1269 CDC Diva 15 0 58.1 1437 1611 CDC Frontier 16 0 59.7 1847 2070 CDC Yuma 16 0 57.0 1228 1377 CDC Xena 16 0 56.7 1437 1611 CDC ChiChi 16 0 56.2 1559 1748 CDC Chico 15 0 58.6 1481 1660 Amit (B-90) 16 0 58.4 1359 1523 CDC Anna 16 0 58.0 1464 1641 CDC Cabri 16 0 54.1 1612 1807 CDC Desiray 14 0 54.2 1437 1611 Myles 14 0 53.9 1403 1572 CDC Nika 15 0 56.6 1551 1738 CA0090B659D 17 0 52.6 1150 1289 CA9783163C 16 0 51.3 880 986 CA9990I604C 15 0 54.7 1333 1494 CA0090B347C 15 0 57.8 1507 1689 CA0090B383C 16 0 55.9 1586 1777 CA9890233W 15 0 51.6 871 976 CA9990I875W 14 0 46.5 784 879 CA9990B015W 14 0 54.1 906 1016 Grand Mean 15.3 0.0 55.3 1318 1478 LSD (P=.05) 1.5 0.0 2.5 257.2 288.3 Standard Deviation 1.1 0.0 1.7 181.9 203.9 CV 6.9 0.0 3.1 13.8 13.8 * 0 = no lodging, 9 = 100% lodged. Planted: April 15, 2004 Harvested: August 6, 2004
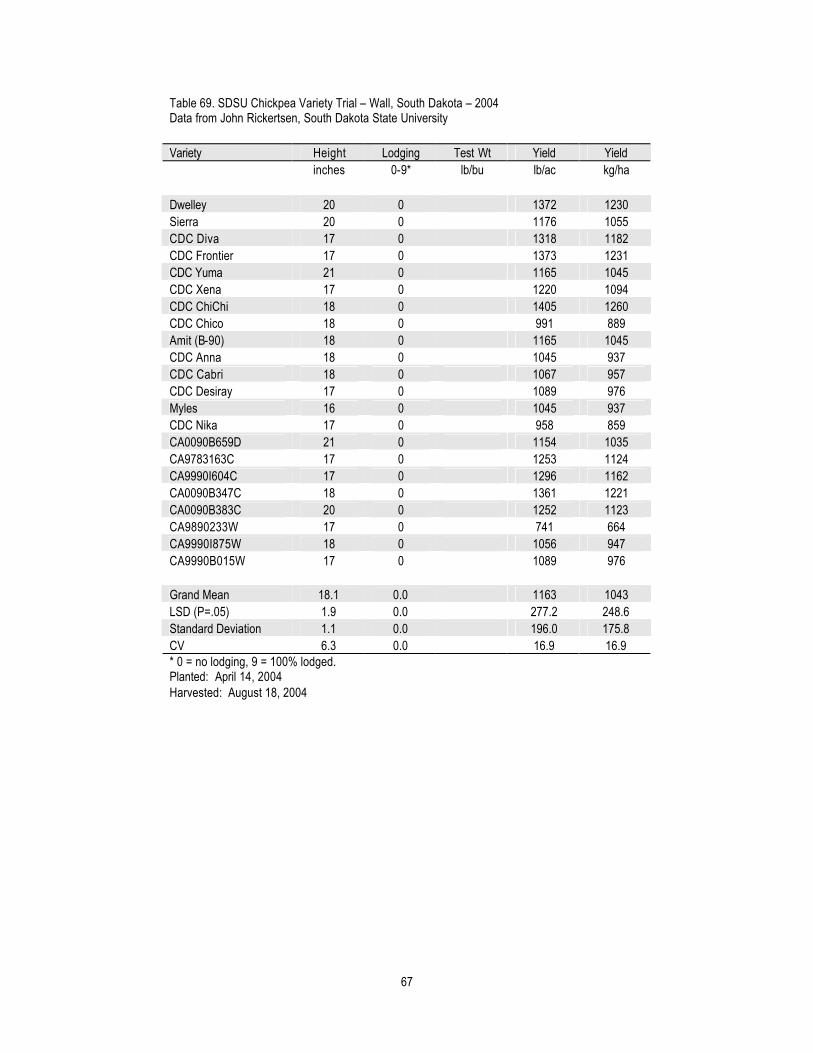
67
Table 69. SDSU Chickpea Variety Trial – Wall, South Dakota – 2004 Data from John Rickertsen, South Dakota State University Variety Height Lodging Test Wt Yield Yield inches 0-9* lb/bu lb/ac kg/ha Dwelley 20 0 1372 1230 Sierra 20 0 1176 1055 CDC Diva 17 0 1318 1182 CDC Frontier 17 0 1373 1231 CDC Yuma 21 0 1165 1045 CDC Xena 17 0 1220 1094 CDC ChiChi 18 0 1405 1260 CDC Chico 18 0 991 889 Amit (B-90) 18 0 1165 1045 CDC Anna 18 0 1045 937 CDC Cabri 18 0 1067 957 CDC Desiray 17 0 1089 976 Myles 16 0 1045 937 CDC Nika 17 0 958 859 CA0090B659D 21 0 1154 1035 CA9783163C 17 0 1253 1124 CA9990I604C 17 0 1296 1162 CA0090B347C 18 0 1361 1221 CA0090B383C 20 0 1252 1123 CA9890233W 17 0 741 664 CA9990I875W 18 0 1056 947 CA9990B015W 17 0 1089 976 Grand Mean 18.1 0.0 1163 1043 LSD (P=.05) 1.9 0.0 277.2 248.6 Standard Deviation 1.1 0.0 196.0 175.8 CV 6.3 0.0 16.9 16.9 * 0 = no lodging, 9 = 100% lodged. Planted: April 14, 2004 Harvested: August 18, 2004

68
Table 70. Western Regional Chickpea Yield Trial- Powell, WY, 2004 (0499) Data from Abdel Mesbah and Rob Smith, University of Wyoming Entry Cultivar Accession No. Stand Yield 103 plants/ac lbs/ac 1 Dwelley CA188359 71.3 1876 2 Sierra CA9783152C 76.0 1481 3 CA9783163C 75.4 1895 4 CA99901604C 82.6 1245 5 CA0090B383C 67.7 1923 6 CA9890233W 86.7 1064 7 CA9990B015W 83.8 1191 8 CA0090B659D 86.1 1499 Mean 78.7 1522 C.V.% 16.1 35.9 LSD (5%) 18.6 802 Planting date: May 14, 2004. Harvest date: November 04, 2004.
Table 71. Irrigated and Dryland Chickpea Variety Evaluation – U-W Research and Extension Center, WY 2004 Data from James Krall and Jerry Nachtman, University of Wyomi ng
Entry Torrington Irrigated
Yield SAREC Dryland
Yield (lb/A) (lb/A) CA0090B347C 2245 107 CA0090B383C 1931 169 CA0090B659D 1719 317 Dwelley 1649 157 WY D201 1281 121 Sierra 1189 205 CA9783163C 1123 139 WY D202 1085 187 WY K203 953 119 CA9990B015W 686 124 CA999001604C 660 155 CA99901875W 529 108 CA9890233W 393 86 Average 1190 153 DRS 0.05 528 121