
Western Energy Imbalance Market -...
23
Copyright 2016 California ISO Western Energy Imbalance Market Monday, May 23, 2016 Peter Colussy, External Affairs Manager - Regional
Transcript of Western Energy Imbalance Market -...

Copyright 2016 California ISO
Western Energy Imbalance Market
Monday, May 23, 2016
Peter Colussy, External Affairs Manager - Regional

Copyright 2016 California ISO
Energy Imbalance Market is an easily-scalable
extension of real-time market to broader region
• Situational awareness enhances
reliability
• No critical mass required. No exit
fees
• Easily scalable, low-cost, low risk,
voluntary option for new participants
• Preserves BAA autonomy, including
compliance, balancing, and reserve
obligations
• Benefits increase with more transfer
volume between BAAs
Slide 2

Copyright 2016 California ISO
EIM provides significant net benefits and will operate in eight
western states
Copyright 2015 California ISO
EIM Entities
PacifiCorp NV Energy Puget Sound
Energy
Arizona Public
Service
Go Live November 2014 October 2015 Fall 2016 Fall 2016
Peak Demand
(MW)
9,500 8,148 4,912 7,000
~ Annual benefits
(in millions)
$21-$129 $9-$18 (2017) $18-$30 $7-$18
$15-$29 (2022)
~ Start-up costs
(in millions)
$20 $11.2 $14.2 $13.5
~ Annual on-going
costs (in millions)
$3 $2.6 $3.5 $4
Slide 3
Copyright 2016 California ISO
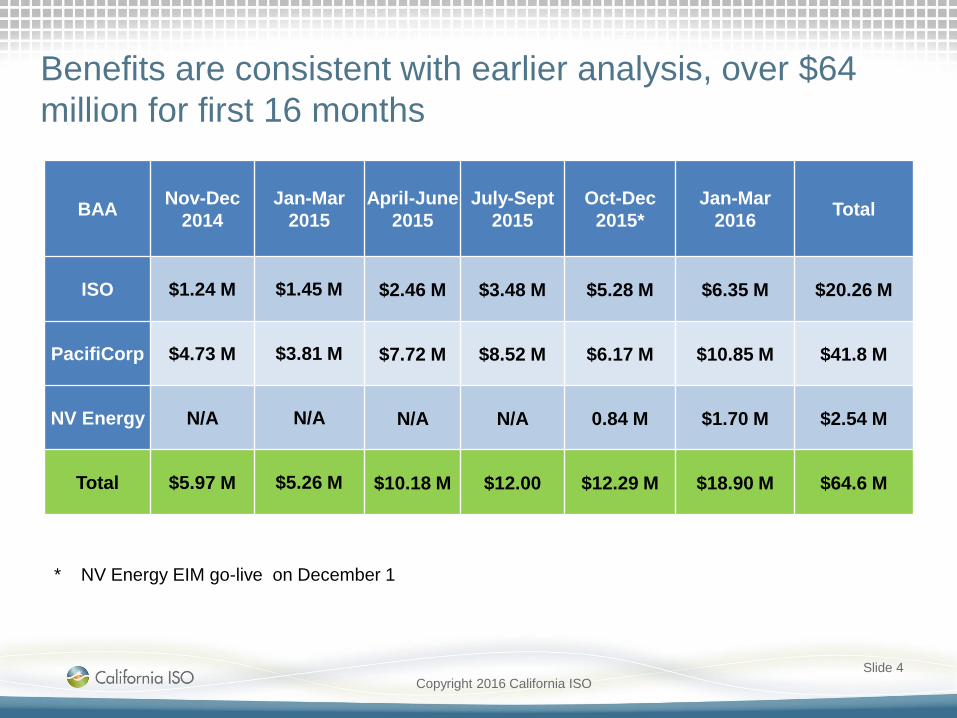
Benefits are consistent with earlier analysis, over $64
million for first 16 months
BAANov-Dec
2014
Jan-Mar
2015
April-June
2015
July-Sept
2015
Oct-Dec
2015*
Jan-Mar
2016Total
ISO $1.24 M $1.45 M $2.46 M $3.48 M $5.28 M $6.35 M $20.26 M
PacifiCorp $4.73 M $3.81 M $7.72 M $8.52 M $6.17 M $10.85 M $41.8 M
NV Energy N/A N/A N/A N/A 0.84 M $1.70 M $2.54 M
Total $5.97 M $5.26 M $10.18 M $12.00 $12.29 M $18.90 M $64.6 M
* NV Energy EIM go-live on December 1
Slide 4

PacifiCorp EIM Lessons Learned
Western Conference
May 23, 2016

EIM Interfaces
• 8 PacifiCorp system changes
were identified
• 40 new or modified interfaces
– 24 PacifiCorp/ISO interfaces
– 16 PacifiCorp internal
interfaces
• Additional 31 PacifiCorp
internal interfaces impacted by
regression testing
6
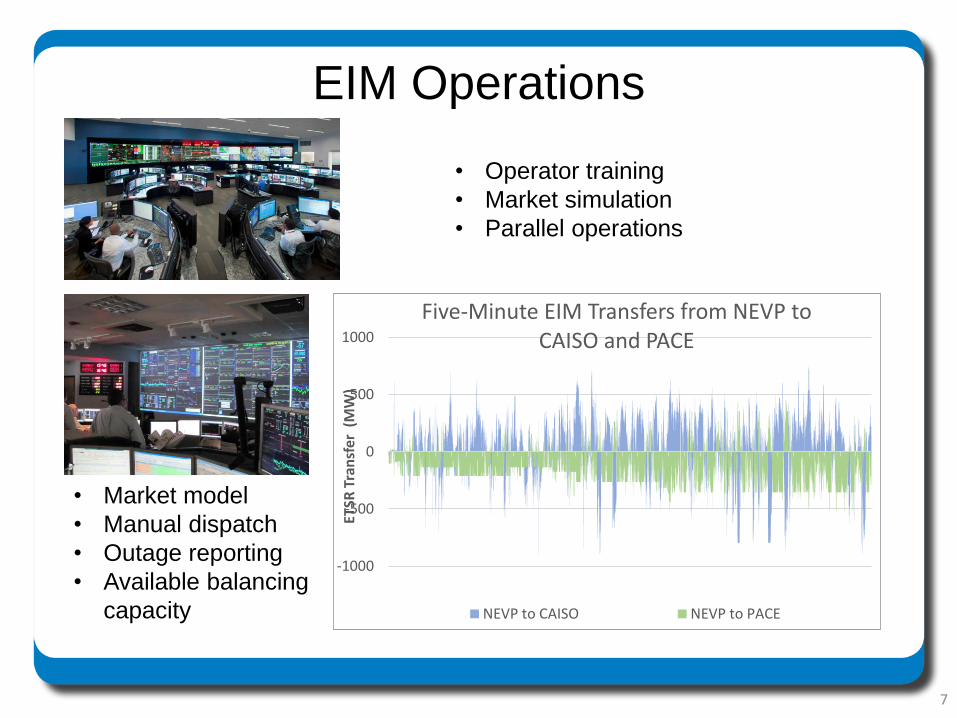
EIM Operations
7
• Operator training
• Market simulation
• Parallel operations
• Market model
• Manual dispatch
• Outage reporting
• Available balancing
capacity
-1000
-500
0
500
1000ET
SR T
ran
sfer
(M
W)
Five-Minute EIM Transfers from NEVP to CAISO and PACE
NEVP to CAISO NEVP to PACE

Variable Energy Operation

Energy Imbalance Market Update
Walter Spansel, Vice President, Transmission Officer
May 23, 2016

Operational Experience
NV Energy began participating in EIM starting December 1, 2015
• Balancing test passed 96.67 percent of the hours
• Flex ramp sufficiency test passed 98.9 percent of the intervals
• Solutions have been feasible using available bids:
99.7 percent of fifteen-minute market intervals
99.6 percent of five-minute market intervals
Enabling active market participation
Avoiding market infeasibilities
Systems operated as expected at launch and very smoothly due to extensive testing, simulation and parallel operations beforehand
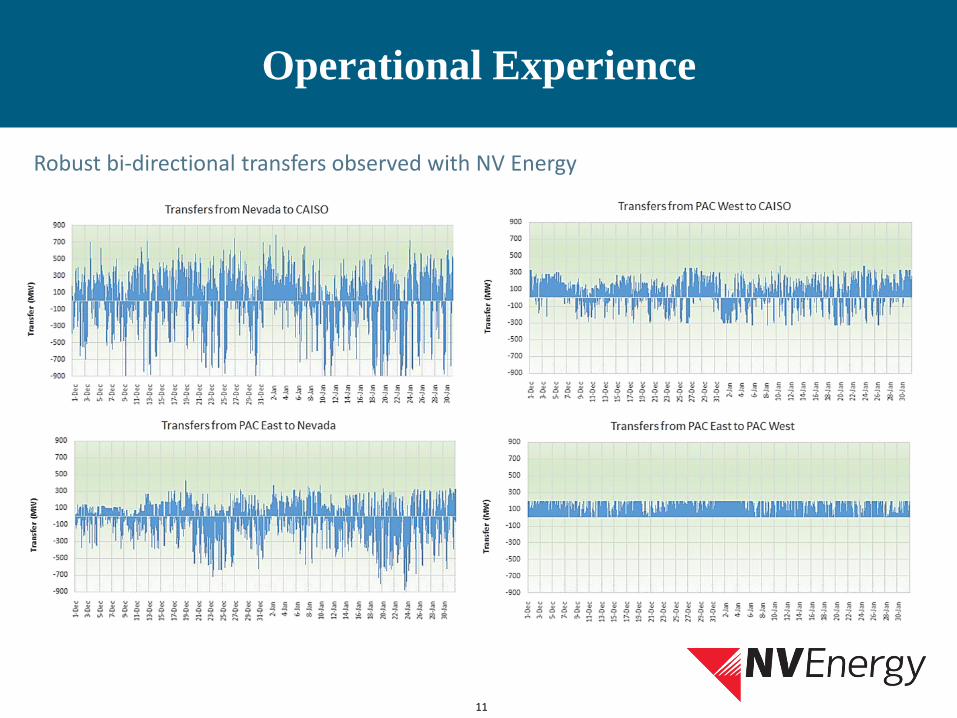
Operational Experience
11
Robust bi-directional transfers observed with NV Energy

• More efficient dispatch, both inter- and intra-regional, in the Fifteen-Minute Market
and Real-Time Dispatch
• Reduced renewable energy curtailment, by allowing balancing authority areas to
export or reduce imports of renewable generation when they would otherwise need to be
economically curtailed,
– Avoided curtailments displaced an estimated 48,342 metric tons of CO2 for Q1 2016
• Reduced flexibility reserves needed in all balancing authority areas, which saves
cost by aggregating the load, wind, and solar variability and forecast errors of the combined
EIM footprint.
• The EIM continued to show significant benefits during the first quarter of 2016. The total
benefits for the quarter of $18.90 million are consistent with pre-launch studies, and
reflect the transfer benefits of a more robust EIM footprint, that includes both PacifiCorp and
NV Energy.
Benefits
12

APS EIM Update
Brad Albert
GM – Resource Management
May 23, 2016
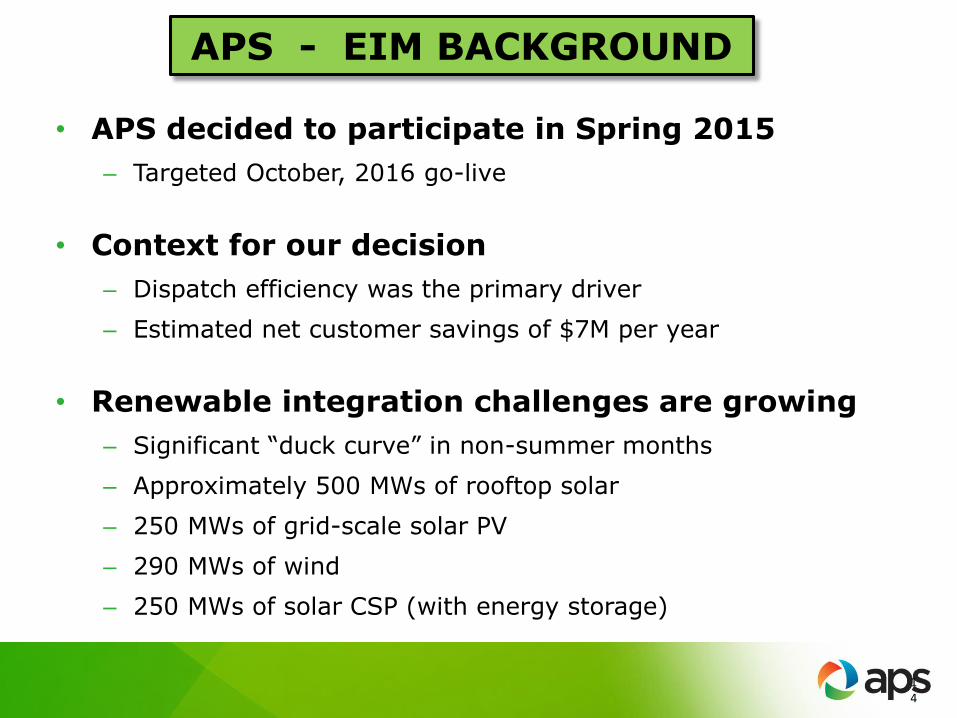
• APS decided to participate in Spring 2015
– Targeted October, 2016 go-live
• Context for our decision
– Dispatch efficiency was the primary driver
– Estimated net customer savings of $7M per year
• Renewable integration challenges are growing
– Significant “duck curve” in non-summer months
– Approximately 500 MWs of rooftop solar
– 250 MWs of grid-scale solar PV
– 290 MWs of wind
– 250 MWs of solar CSP (with energy storage)
14
APS - EIM BACKGROUND

• On-track for October 1st go-live
– System testing underway since early March
– Training operating staff
• Strong project team
– Internal staff from all operating areas
– Consulting support (Utilicast)
– Technology provider (PCI)
• Lessons learned
– Good assistance/support from other utilities
– Complexity of joint participant facilities
– “Tolled” generating units dynamically signaled into our BAA
15
APS - IMPLEMENTATION STATUS

Mariah Kennedy
Puget Sound Energy
May 23, 2016

17
Who is PSE?
Privileged and Confidential: For Internal Discussion Purposes Only
• Headquarters: Bellevue, Wash.
• Customers:
– More than 1 million electric
– More than 770,000 natural gas

18
Why EIM?
THEN
Load2337 MW
Coal677 MW
Hydro1610 MW
Wind150 MWHopkins Ridge
Gas Fired Generation902 MW
NOW
Load2585 MW
Coal677 MW
Hydro994 MW
Wind773 MW
Gas Fired Generation1871 MW
2016
2005
Energy Imbalance Market = Economic and Reliability Benefits
Estimated PSE Benefits$18.3 Million
19
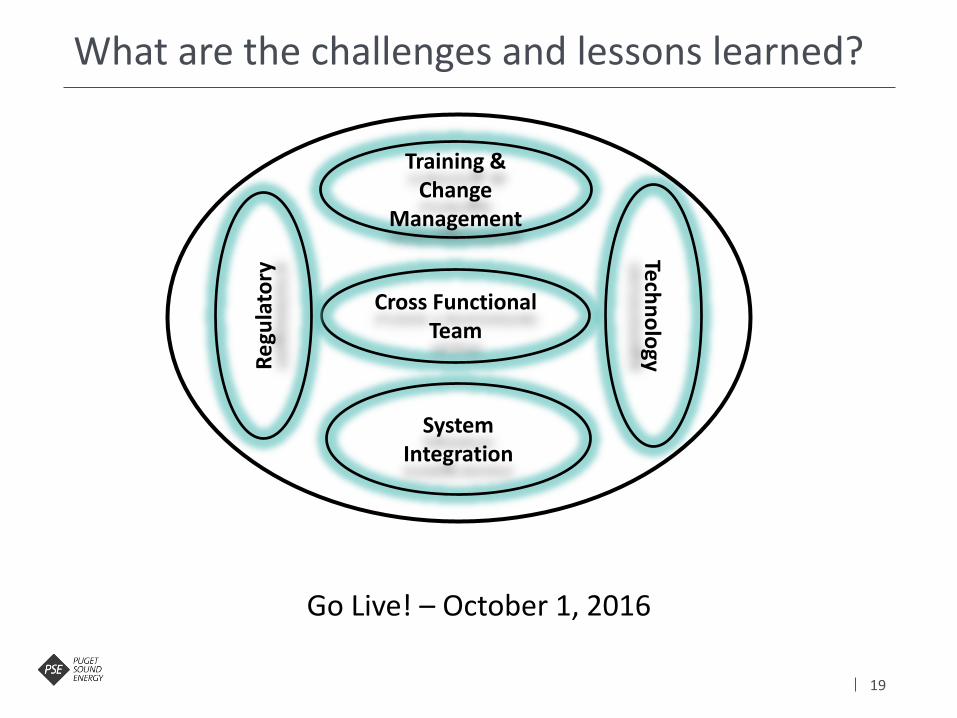
What are the challenges and lessons learned?
Training & Change
Management
Tech
no
logy
Cross Functional Team
Re
gula
tory
System Integration
Go Live! – October 1, 2016

PGE EIM Lessons Learned May 23, 2016
Western Conference
20
Confidential: For Internal Discussion Purposes Only21
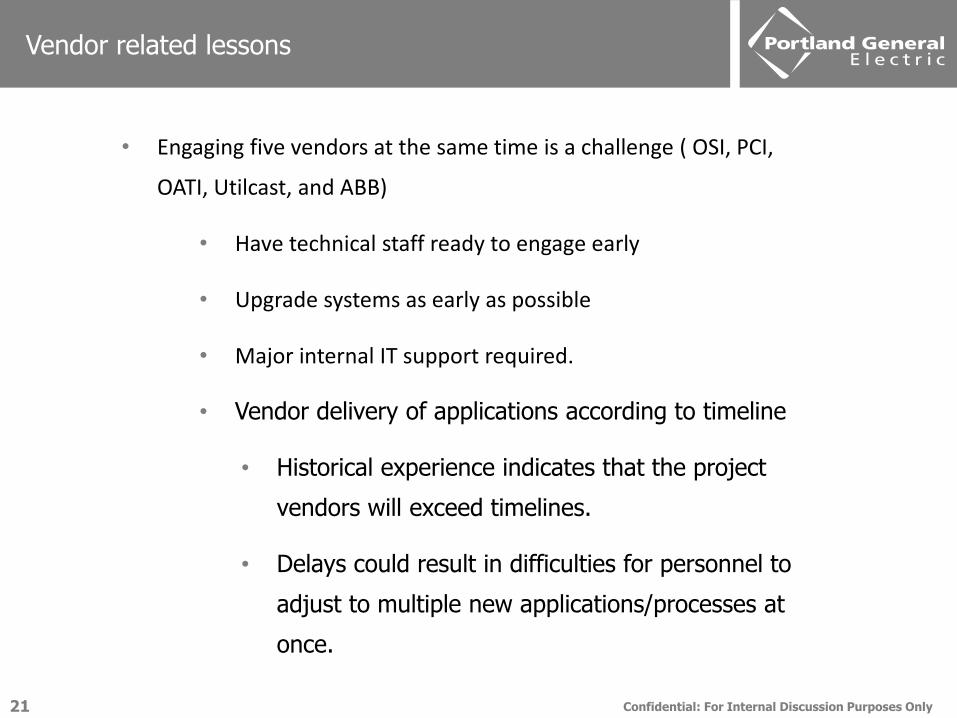
Vendor related lessons
• Engaging five vendors at the same time is a challenge ( OSI, PCI,
OATI, Utilcast, and ABB)
• Have technical staff ready to engage early
• Upgrade systems as early as possible
• Major internal IT support required.
• Vendor delivery of applications according to timeline
• Historical experience indicates that the project
vendors will exceed timelines.
• Delays could result in difficulties for personnel to
adjust to multiple new applications/processes at
once.
Confidential: For Internal Discussion Purposes Only22
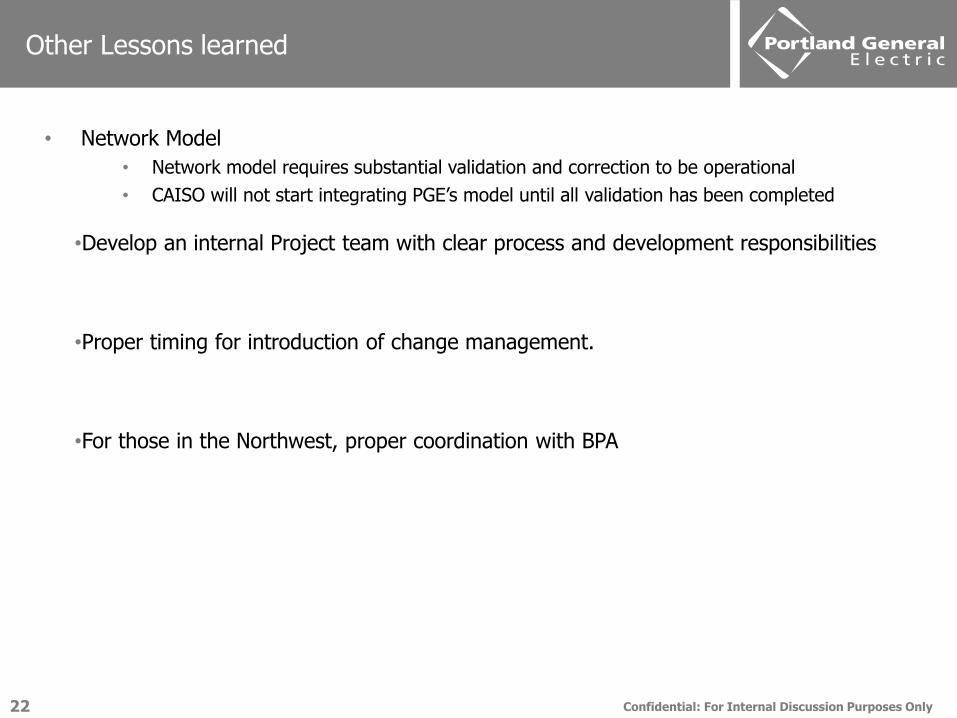
Other Lessons learned
• Network Model
• Network model requires substantial validation and correction to be operational
• CAISO will not start integrating PGE’s model until all validation has been completed
•Develop an internal Project team with clear process and development responsibilities
•Proper timing for introduction of change management.
•For those in the Northwest, proper coordination with BPA

Confidential: For Internal Discussion Purposes Only23
Next Steps
• Complete the CAISO Resource Data Template training
• Submit EIM Entity and PRSC Applications to CAISO
• Phase 2: Design and Build
Lower-level CAISO training for project resources
Determine business process and application changes due to CAISO EIM operations
Identify and document gap analysis to map out strategy for transitioning from current business processes to CAISO EIM operations business processes
Design and develop applications and interfaces to function within the CAISO EIM operations business processes