Western Australian Mineral and Petroleum Statistics Digest...
58
Western Australian Mineral and Petroleum Statistics Digest 2004–05
Transcript of Western Australian Mineral and Petroleum Statistics Digest...

Western AustralianMineral and PetroleumStatistics Digest 2004–05

DisclaimerInformation provided in this Digest is made available without charge, as a public service, in good faith. The information provided is derived from sources believed to be reliable and accurate at the time of publication. However, use of the information in the Digest is at your own risk. The Digest is provided solely on the basis that users will be responsible for making their own assessment of the information provided therein and users are advised to verify all representations, statements and information for decisions that concern the conduct of business that involves monetary or operational consequences.
Each user waives and releases the Department of Industry and Resources and the State of Western Australia and its servants to the full extent permitted by law from all and any claims relating to the use of the material in the Digest. In no event shall the Department of Industry and Resources or the State of Western Australia be liable for any incidental or consequential damages arising from any use or reliance on any material in the Digest.
Copyright © Copyright in this document is reserved to the State of Western Australia. Reproduction except in accordance with copyright law is prohibited.

CONTENTS page
Foreword 1
1. ECONOMY 2
1.1 Global economic context 2
2. EXPLORATION AND INVESTMENT 6
2.1 Mineral Exploration 6
2.2 Petroleum Exploration 6
3. RESOURCE FOCUS 2004–05 7
3.1 Overview 7
3.2 Commodity Prices 8
4. 2004 RESOURCE INDUSTRY ANALYSIS 9
4.1 Petroleum 9
4.2 Iron Ore 13
4.3 Nickel 15
4.4 Alumina 17
4.5 Gold 18
4.6 Heavy Mineral Sands 20
4.7 Diamonds 21
4.8 Base Metals (copper, lead and zinc) 22
4.9 Other Minerals 23
Tables
1 Quantity and Value of Minerals and Petroleum 26
2 Quantity and Value of Selected Major Commodities 28
3 Quantity and Value of Commodity by Local Government Area 30
4 Royalty Receipts 2003–04 and 2004–05 38
5 Average Number of Persons Employed in the WA Minerals and Petroleum Industries 40
6 Principal Mineral and Petroleum Producers 44
Abbreviations, References, Units and Conversion Factors 49
Data Sources 50
Local Government Boundaries 51
Major Mineral and Petroleum Projects in Western Australia 53
Western Australian Mineral and Petroleum Statistics Digest 2004–05 i

ii Western Australian Mineral and Petroleum Statistics Digest 2004–05
LIST OF FIGURES page
1 Global Economic Growth — Major Economies 2
2 Exchange Rate US$/A$ 5
3 Exchange Rate Trade Weighted Index 5
4 Tenements in Force 1978 Act 5
5 Mineral Exploration Expenditure 6
6 Petroleum Exploration Expenditure 6
7 Average Price Comparison 2003–04 and 2004–05 8
8 Major Commodities by Value 2003 and 2004 8
9 Sales by Commodity 2004 9
10 Non-Rural Commodity Price Index 9
11 Petroleum Exports 10
12 Crude Oil Exports 10
13 Condensate Exports 10
14 Crude Oil and Condensate Quantity 11
15 Crude Oil and Condensate Quantity and Value by Quarter 11
16 Tapis Crude Oil price 11
17 Australia’s Gas Resources 12
18 Iron Ore Exports 13
19 Iron Ore Price 13
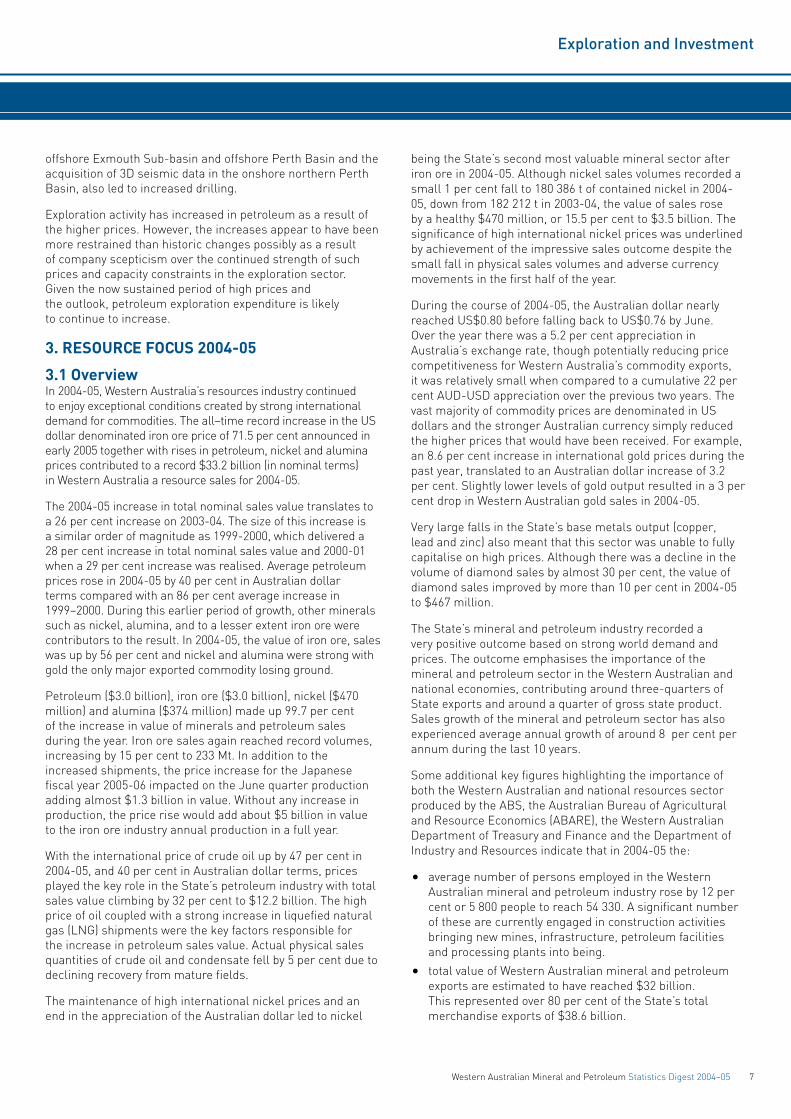
20 Iron Ore Quantity and Value by Quarter 14
21 Iron Ore Quantity 14
22 China’s Iron Imports by Source 15
23 Nickel Price 15
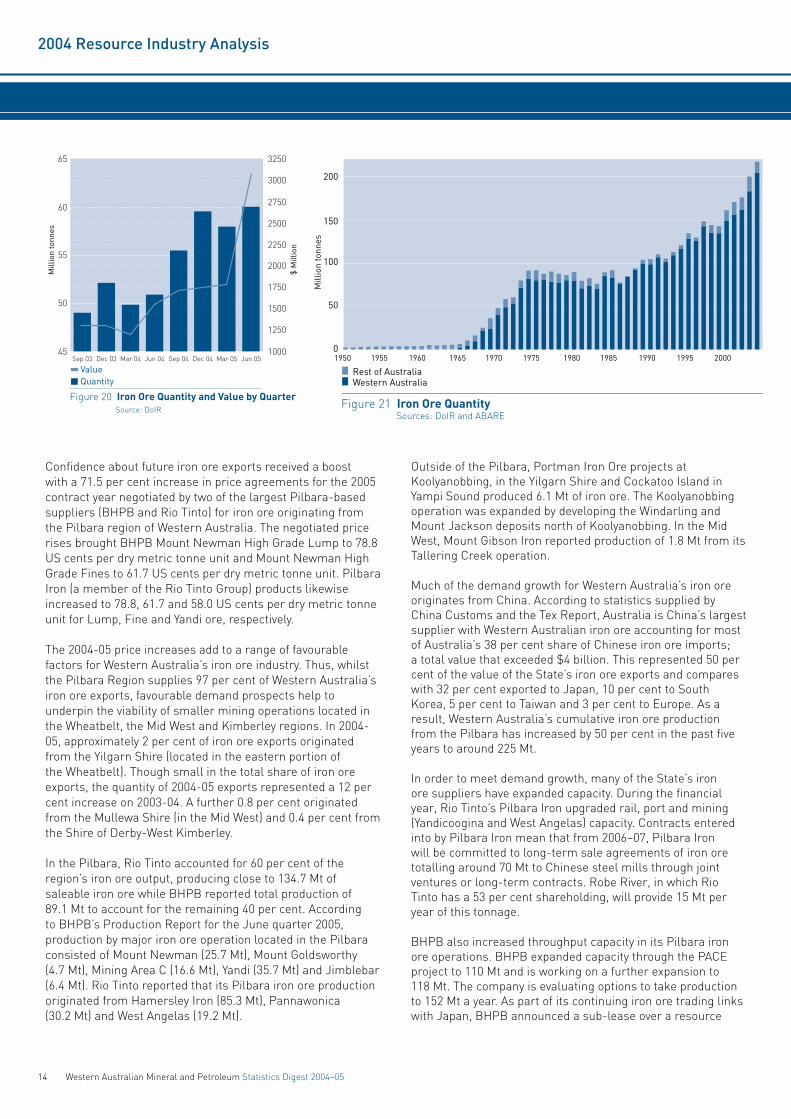
24 Nickel Quantity and Value by Quarter 16
25 Nickel Quantity 16
26 Alumina Exports 17
27 Alumina Quantity and Value by Quarter 17
28 Alumina Price A$/tonne 17
29 Alumina Quantity 18
30 Gold Price 18
31 Gold Production 19
32 Gold Quantity and Value by Quarter 19
33 Gold Exports 19
34 Heavy Mineral Sands Exports 20
35 Heavy Mineral Sands Price Index 21
36 Heavy Mineral Sands Value by Quarter 21
37 Heavy Mineral Sands Value of Production 21
38 Selected WA Commodities relative to world production ending 2004 by quantity 25
39 Royalty receipts by commodity 39
Map Local Government Boundaries 51
Map Local Government Boundaries 52
Map Major Mineral and Petrolum Projects in WA 53

Western Australian Mineral and Petroleum Statistics Digest 2004–05 1
Jim Limerick Director General
FOREWORD
Welcome to the Department of Industry and Resources’ 2004-05 Statistics Digest. This publication contains the most comprehensive information available on the Western Australian mineral and petroleum industry.
The Digest provides detailed quantity and value data, by commodity and industry sector in addition to figures on employment, royalty receipts, exploration, investment and principal producers. Incorporated with these data is an analysis explaining the performance of the various mineral and petroleum sectors. Numerous facets of the State’s resource sector, including commodity price trends and Western Australia’s position in the global economy as a resource exporter, are also covered.
Trends in sales volumes continued to strengthen in 2004-05. The all time record increase in the US dollar denominated iron ore price of 71.5 per cent announced in early 2005 together with rises in petroleum, nickel and alumina prices contributed to a record $33.2 billion in Western Australia resource sales for 2004-05.
The 2004-05 increase in total sales value translates to a 26 per cent increase on 2003-04. The size of this increase is a similar order of magnitude as 1999–00, which delivered a 28 per cent increase in total nominal sales value and 2000-01 when a 29 per cent increase was realised.
The breadth of the sales increases is a heartening feature, indicating increased diversity in exports as the mineral and petroleum industries expands. Diversification partly reflects our proximity to growing markets in Asia, which translates to a freight cost advantage relative to other major commodities suppliers. Strong investment in expanding the State’s export capacity will help to underpin our competitiveness in coming years.
In releasing the Western Australian Mineral and Petroleum Statistics Digest for 2004-05, I would like to express my appreciation to the many individuals and companies which have contributed to the preparation of this report, including the Australian Bureau of Agricultural and Resource Economics (ABARE), the Australian Bureau of Statistics (ABS) and the Western Australian Department of Treasury and Finance.

2 Western Australian Mineral and Petroleum Statistics Digest 2004–05
Economy
Figure 1 Global Economic Growth – Major Economies (Year Average GDP Growth)Source: International Monetary Fund – World Economic Outlook September 2005
Note: GDP denotes Gross Domestic Product
-2
0
2
4
6
8
10
12
1996 1997 1998 1999 2000 2001 2002 2003 2004 2005 2006-2
0
2
4
6
8
10
12
forecasts
per cent per cent
China WorldJapanEuro areaUnited States
1. ECONOMY
1.1 Global economic contextThe global economy achieved above–trend growth for the 2004-05 financial year although growth was variable over the year. The temporary slowdown evident in mid–2004 was followed by a strong first quarter in 2005. Then the impact of rising oil prices created uncertainty and a softening in leading indicators. Despite the significant rises in oil prices, global trade and manufacturing continued to strengthen through the start of 2005.
The global economy continues to be driven by growth in the United States (US) and Chinese economies, with Japan showing signs of a sustained lift in 2004-05 following insipid activity in 2002-03 and the slight improvement over 2003-04. Growth slowed in the other economies in East Asia as they felt the impact of a decline in demand in the global information and telecommunications sector. Other economies adding to rising global economic momentum included Latin America, Eastern Europe and India. The growth rate and prospects in the euro area economies remained poor at about half that of the US.
The outlook is for continuing global growth in 2006. Nevertheless there are some important risks. These risks include a significant dependence on US and Chinese demand for imports. This risk arises because the US economy is generating large current account deficits, and wider global current account imbalances seem to be entrenched into the medium term. There is potential for financial market instability in response to these current account deficits. The secondary effects of high oil prices and a strong labour market are two other important uncertainties worrying
central bankers with the potential for higher inflation. The productive capacity in China remains another uncertainty for the strong outlook.
United StatesGross Domestic Product (GDP) in the US grew solidly in the year to June 2005 recording an annual growth rate of 3.6 per cent. Growth was broad-based with investment, which rose by over 9 per cent over the year, continuing its increase driven by high levels of retained profits and low interest rates. Household consumption was also a key underlying driver growing solidly at 3.9 per cent.
A key factor driving household consumption was a rapid rise in housing prices in a number of regions. In California, for example, house prices rose at an annual rate of over 20 per cent to mid-2005. This rise in home–owner wealth drove consumer spending and confidence, and this was reflected in rising home equity-related borrowings. An important risk for the future are concerns that significant numbers of homes have become overvalued. There is a risk that household spending will slow significantly in the event of house–price falls.
A pick-up in employment growth, in the absence of significant income rises, was also critical to sustained US consumption–spending growth. Unemployment fell from 6 per cent in 2003 to 5.5 per cent in 2004 and is forecast to level out at 5.2 per cent in 2005 and 2006.
The latest estimates are that real GDP grew by 1.05 per cent in the September quarter for an annual equivalent rate of 4.3 per cent. The major contributors to the increase in that quarter were personal consumption expenditures (4.2 per cent), equipment and software (10.8 per cent), federal government spending (8.1 per cent), and residential fixed investment. The contributions of these components were partly offset by a negative contribution from private inventory investment and imports. Caution should be used when viewing a single quarter’s figures as even in an economy the size of the US, aggregate data can vary considerably from quarter to quarter.
Economic Growth Forecasts – Year average GDP growth
Outcomes Forecasts2003 2004 2005 2006
United States 2.7 4.2 3.5 3.3
Euro area 0.7 2.0 1.2 1.8
Japan 1.4 2.7 2.0 2.0
China 9.5 9.5 9.0 8.2
Other East Asia 3.8 5.8 4.4 5.0
Latin America 2.0 5.7 4.2 3.8
Emerging Europe 6.1 7.4 5.1 5.2
World 4.0 5.1 4.3 4.3
Source: Reserve Bank of Australia, November 2005

Western Australian Mineral and Petroleum Statistics Digest 2004–05 3
Economy
Recorded unemployment in November 2005 was 5.0 per cent and since May 2005 has ranged between 4.9 per cent and 5.1 per cent suggesting that if conditions remain favourable, the forecast of 5.2 per cent for 2005 and 2006 should be bettered. The number of unemployed people at 7.6 million has now remained static for a number of months.
JapanOver recent years, Japan’s modest but faltering growth has largely been driven by exports. As 2004-05 progressed, domestic demand began to show signs of sustained strengthening. This improvement occurred as consumer sentiment lifted in a climate of rising wages and employment stimulating private consumption. In addition, exports of cars and capital goods to Asia, the US and oil exporting countries have been rising and an improvement in corporate balance sheets lifted business activity and investment.
This broadening of economic activity was reflected in stronger GDP growth, which expanded by 0.8 per cent in the June quarter 2005 for an annual growth rate of 2.2 per cent. While still low, this is a significant improvement on recent years.
Consumption and investment growth in the June quarter of 2005 was significantly above forecast. In addition, net exports made their first positive contribution to growth in four quarters, driven by strong car sales to the US.
Underpinning the improvement in Japan’s economy has been stronger employment growth, which has boosted disposable incomes and consumer confidence. Employment grew by 0.6 per cent over the year to June and unemployment fell to 4.2 per cent, its lowest level in seven years. In a positive sign for the future, hiring expectations remain above long-term averages, suggesting further gains in the job market.
June quarter growth in business investment of 3.6 per cent led to an annual increase of 7.6 per cent. Investment intentions remain solid and, as reported in the September quarter Tankan survey, were revised upwards supported by improving corporate balance sheets, cost cutting and rising profitability. The ability of the banking sector to support rising growth through lending is also improving as finance sector balance sheets continue to be repaired and confidence improves in the banking sector following recent reforms.
ChinaChina’s strong growth in recent years continued and even accelerated through the year. Economic growth picked up in the June quarter 2005 to be 9.5 per cent higher than the year before. Confirming ongoing strength in the economy, industrial production accelerated to over 17 per cent up from 15 per cent in the previous quarter. Exports continued to grow rapidly, by 30 per cent in the year to June and, with slower import growth, China’s trade surplus widened further.
Concerns about the unbalanced nature of China’s growth also
persisted. Despite the Chinese Government’s aim of switching growth away from investment towards consumption to avoid unsustainable levels of excess capacity, investment growth continued. China’s aggregate fixed capital investment growth accelerated to 29 per cent in the year to June, well above the official target of around 16 per cent but lower than the peak levels of early 2004. Consumer demand, as reflected in retail sales, grew by 13 per cent over the year. Private consumption as a share of GDP is 40 per cent, which remains an historic low. An important concern remains that strong rates of fixed capital investment will lead to excess capacity, which in turn, may lead to a decline in investment and a marked softening of overall Chinese growth.
Another stress–point in China’s economy during the year, rapidly escalating housing prices, moderated with prices rising by a slower 8.0 per cent in the year to June 2005. This followed official policy moves to rein–in speculation in the real estate sector.
China’s economy continued to grow strongly into 2005-06 surprising some analysts, though the balance in growth appears to be improving. Forecast growth for 2005 of 9.0 per cent is expected to moderate to 8.2 per cent in 2006.
Recent strength in the domestic components of demand is a positive sign in that it appears that some of the reliance on exports for China’s growth is lessening. Currency reform in July 2005 assisted this process which needs to continue for China’s growth rate to be sustained.
Non-Japan East AsiaAfter easing during 2004, growth in the region began to improve in line with better conditions in the global telecommunications trade. Real GDP for 2004-05 was 4.3 per cent higher over the year.
In part reflecting the slowdown in telecommunications, regional exports growth slowed to stabilise at around 10 per cent, with support for economic growth provided by strong global commodity demand.
Domestic demand across the region was generally firm reflecting strong retail sales driven by rising employment, low interest rates and rising asset prices. Demand was a little softer in Thailand and South Korea reflecting the impacts of the tsunami and a rebuilding of household balance sheets respectively.
Growth recovered strongly in Hong Kong and Singapore which continued to benefit from integration with China’s robust growth and strength in the biomedical industry respectively. Thailand’s growth rate benefited from a recovery in tourism following the tsunami-affected March quarter.
Following an improvement in global telecommunications product demand, key regional indicators began to show some signs of life. Industrial production recovered to 7.2 per cent in

4 Western Australian Mineral and Petroleum Statistics Digest 2004–05
Economy
the year to August 2005 and merchandise exports lifted to over 15 per cent in the same period.
Importantly for the sustainability of recovery in the region, domestic demand across the region remained firm. High levels of capacity utilisation were a stimulus to stronger investment and retail sales lifted, driven by rising employment, low interest rates and rising asset prices.
High oil prices have put pressure on regional inflation rates, and this has been aggravated by fuel subsidies in some economies. As a consequence, there has been some moderate tightening of monetary policy across the region.
Inflation, reflecting varying impacts of higher oil prices, shows significant regional variation. Malaysia and Thailand, due to reductions of petrol price subsidies, have seen stronger price growth compared with Singapore and Hong Kong.
India, which in purchasing price parity terms is now the world’s fourth largest economy, continued to grow solidly over 2004-05. GDP growth of 8.2 per cent in the year to the June quarter 2005 was driven by the manufacturing and services sectors.
EuropeEuro area growth was weak with only a 1.1 per cent annual growth rate but there were some positive signs as the year ended with unemployment falling to 8.6 per cent from 8.9 per cent at the end of 2004.
Early in 2004-05, Europe appeared set to continue on a path of weak growth. This growth softened further as domestic demand remained moribund and exports weakened. GDP growth moderated to 1.4 per cent in the year to the March quarter 2005 with no growth in domestic demand. Within the region, Germany’s growth picked up, France’s slowed, while GDP in the Netherlands and Italy fell. Only Spain showed steady growth driven by the wealth effects of rising housing prices on consumption and an investment boom.
Inflation was heavily influenced by oil prices at a headline rate of 2.5 per cent to October 2005 but an underlying rate of only 1.3 per cent.
During the June quarter 2005, euro area growth slowed somewhat with falling industrial production and softer exports growth. Exporters struggled to absorb the impacts of a strong euro and rising input, including oil costs. These factors, as well as uncertainty about the impact of various economic reforms, and weak employment growth, drove falls in consumer and business confidence. Growth in June was driven primarily by changes in inventories, which contributed 0.2 percentage points to quarter-on-quarter real GDP growth.
The contribution of domestic demand to growth was weak, or even absent. In particular, the contribution of private consumption to growth was zero, which partly reflected the negative impact of rising oil prices on real income. Investment growth increased from a fall of 0.2 per cent in the first quarter
of 2005 to 0.2 per cent in the second quarter. However, this partly reflected a rebound of the weather–related decline in construction in the previous quarter.
Gross capital formation made a contribution of 0.1 percentage points to GDP growth in the second quarter. The contribution of net exports declined to almost zero in the second quarter.
On the positive side, there were signs of an improving business sector in early 2005-06 with industrial production rising by 2.5 per cent over the year to August. Exports rose by over 4 per cent and in a turnaround from recent performance, it appeared that Germany was beginning to lead the way, though growth remained modest.
The UK economy slowed rapidly over 2004-05 as cooling housing prices and higher interest rates constrained consumption. Softer domestic demand was compounded by weak merchandise exports. The labour market softened as a result, with unemployment rising from a low 2.6 per cent in January to 2.8 per cent in September 2005. On the positive side, business and consumer sentiment remained reasonably solid.
The Global OutlookGlobal growth is expected to remain firm over the near term, with the general consensus of forecasters expecting above–trend growth of 4.3 per cent in 2005 and 2006. The signs that Japan’s economy is now on the path to sustained broad–based growth and that Europe is beginning to expand more broadly than simply being driven by exports growth add weight to the optimistic outlook. However, while this highly positive picture remains the “central case” for the global outlook, this scenario is contingent on sustained growth in the US and China. Both economies are facing underlying challenges which have the potential to disrupt the benign short-term outlook. The potential for sustained high levels of petrol prices and the flow-on price impacts remain an uncertainty for the global economy.
A key factor for the future is the contribution of the demand growth in China and the US to high global commodity prices. The increase in oil prices is significant but world prices of iron ore, nickel and alloy metals, and base metals are also strong because of the same underlying demand.
In the US, growth has been heavily reliant on consumer spending. To a significant degree, this spending has been driven largely by wealth effects related to rapid rises in housing prices. This has been reflected in rapid rises in household borrowing to finance consumer spending and declines in household saving. There is now some evidence that housing prices are overvalued, which may cause households to reduce consumption growth, putting a significant brake on economic activity. In addition, given high levels of household debt, any period of household balance sheet consolidation as the wealth gains from housing prices moderate may have an additional cooling effect on consumption. Given these risks, it will be important for US and global growth prospects that the current investment upward trend is sustained.

Western Australian Mineral and Petroleum Statistics Digest 2004–05 5
Economy
Figure 2 Exchange Rate US$/A$ Source: Reserve Bank of Australia
0.45
0.50
0.55
0.60
0.65
0.70
0.75
0.80
US$
Figure 3 Exchange Rate Trade Weighted IndexSource: Reserve Bank of Australia
55.00
0.60
0.65
0.70
Jul-03 Jan-04 Jan-05Jul-04 Jul-05
(May 1970 = 100)
Jul-01 Jan-02 Jul-02 Jan-03 Jul-03 Jan-04 Jul-04 Jan-05 Jul-05 Jan-06
For China, the key risk to the strong growth expected over the near-term remains the potential for excess capacity. There are signs that this may now be affecting some sectors. These signs include rising inventory levels in some sectors including steel, weaker indicators of profitability and slower imports growth. To a significant extent the dependence of Chinese exports on the US demand is also a key risk factor.
Any significant weakening in China’s growth, particularly in terms of imports, would have significant knock-on effects in the region and on other suppliers of inputs including those from Australia’s resources sector.
Tenements in Force 1978 Act1996-97 1997-98 1998-99 1999-00 2000-01 2001-02 2002-03 2003-04 2004-05
Number 000 ha Number 000 ha Number 000 ha Number 000 ha Number 000 ha Number 000 ha Number 000 ha Number 000 ha Number 000 ha
Prospecting Licences 8,212 1,100 7,525 992 6,242 809 5,827 745 5,512 711 4,964 634 4,566 575 4,561 568 4,665 586
Exploration Licences 4,718 38,279 4,505 35,993 3,463 23,732 3,394 20,687 3,162 18,152 2,899 18,556 2,855 21,123 2,917 20,896 3,066 22,215
Mining Leases 5,180 2,047 6,690 2,031 7,555* 2,263 4,865 1,829 4,841 1,803 4,820 1,774 4,770 1,762 4,713 1,716 5,172 1,805
Other 1,537 89 1,584 205 2,001 468 3,625 2,840 3,618 3,002 3,629 3,299 3,590 3,115 3,258 2,982
Mineral Claims & Other 1904 Act 310 34 309 34 307 34 194 22 186 21 186 22 186 22 186 22 186 22
Total 19,647 41,515 19,029 39,255 17,567 26,838 16,280 23,751 17,326 23,829 16,487 23,988 16,006 26,781 15,967 26,317 16,347 27,610
* Includes Other

6 Western Australian Mineral and Petroleum Statistics Digest 2004–05
Exploration and Investment
2. EXPLORATION AND INVESTMENT
2.1 Mineral ExplorationWestern Australia continued to attract the major proportion (59 per cent) of mineral exploration expenditure in Australia. In 2004-05, mineral exploration expenditure figures for Western Australia rose by 30 per cent ($140 million) to $606 million. This was a significant rise on top of the increase in the previous year. However, this level of Western Australian mineral exploration was still below the peak nominal expenditure level of $692 million achieved in 1996-97.
While very welcome, the exploration expenditure recovery has been relatively stronger elsewhere in the world. A 2005 survey conducted by the Canadian–based Metals Economic Group reported that Australia’s share of the global non–ferrous exploration budget had gradually declined from second to fifth by 2004.
Gold exploration in Western Australia at $260 million was marginally down (6 per cent or $17 million) from the $277 million spent in 2003-04. According to the Geological Survey of Western Australia 2004-05 Annual Review (GL Survey), in 2004-05 dollars gold exploration expenditure has fallen to 1985-86 expenditure levels. Gold nevertheless remains the main focus of mineral exploration, accounting for 42.8 per cent of all expenditure in Western Australia in 2004-05.
Exploration for nickel and cobalt recovered strongly in 2004-05, more than doubling to $149 million from the $71 million recorded in the previous financial year. According to the GL Survey, this level of expenditure, in 2004-05 is the highest since 1989-90 and probably achieved an all-time record. Importantly, the GL Survey points out that expenditure in recent years has been principally led by junior companies developing nickel sulphide deposits (particularly in the Kambalda area) and by BHP Billiton (BHPB) completing feasibility work on the Ravensthorpe laterite nickel project.
Iron ore exploration expenditure rose by a substantial 112 per cent to $136.9 million (2004-05 dollar terms) and is now at the highest level ever recorded. This has been driven by strong customer demand for iron ore, particularly from China, with the major producers in the Pilbara able to respond fairly rapidly by expanding the operations at existing projects.
Counterbalancing the increases, diamond exploration decreased by $16 million for the year, primarily due to reduced resource–reserve drilling at Argyle, the Ellendale project reaching production phase and limited diamond exploration elsewhere in the State. Diamond exploration expenditure has been subdued for many years, has declined gradually over the last decade and is now far below the peak level of $139 million in 1981–82 (in 2004-05 dollar terms). However, the GL Survey indicates that greenfield exploration success in the western part of the Pilbara Craton may encourage further exploration.
According to the Australian Bureau of Statistics (ABS) exploration for mineral sands in Western Australia increased by 40 per cent to $15 million in 2004-05. After the switch in
the 1990s by mineral sand explorers to the Murray Basin in Australia’s eastern states, exploration in Western Australia has been subdued. As a result of that refocusing, Western Australia’s share of the Australian exploration expenditure for heavy minerals has fallen from around 70 per cent of the total in the mid-1990s to 46 per cent in 2004-05. The main greenfields exploration project is Coburn (south of Shark Bay), which is at the bankable feasibility study stage. There is also work around Keysbrook south of Perth.
Figure 5 Mineral Exploration Expenditure Source: ABS
0
200
400
600
800
1000
1200
1995-96 1998-99 2001-02 2004-05
$ Million
Rest of Australia Western Australia
Figure 6 Petroleum Exploration Expenditure Source: ABS
Rest of Australia Western Australia
0
200
400
600
800
1000
1200
1995-96 1998-99 2001-02 2004-05
$ Million
2.2 Petroleum ExplorationWestern Australian petroleum exploration expenditure fell $144 million to $526 million in 2004-05. Total Australian petroleum exploration expenditure increased by 11 per cent to $1045 million. As Western Australia’s petroleum exploration expenditure decreased, the State’s share of national petroleum expenditure fell from 71 per cent in 2003-04 to 50 per cent in 2004-05.
In 2004-05, 81 wells were drilled in Western Australia; representing a 5 per cent lift on the previous year’s total of 77. Significant discoveries were made in the Northern Carnarvon and Perth Basins. Successful new developments in the
Western Australian Mineral and Petroleum Statistics Digest 2004–05 7
Exploration and Investment
offshore Exmouth Sub-basin and offshore Perth Basin and the acquisition of 3D seismic data in the onshore northern Perth Basin, also led to increased drilling.
Exploration activity has increased in petroleum as a result of the higher prices. However, the increases appear to have been more restrained than historic changes possibly as a result of company scepticism over the continued strength of such prices and capacity constraints in the exploration sector. Given the now sustained period of high prices and the outlook, petroleum exploration expenditure is likely to continue to increase.
3. RESOURCE FOCUS 2004-05
3.1 OverviewIn 2004-05, Western Australia’s resources industry continued to enjoy exceptional conditions created by strong international demand for commodities. The all–time record increase in the US dollar denominated iron ore price of 71.5 per cent announced in early 2005 together with rises in petroleum, nickel and alumina prices contributed to a record $33.2 billion (in nominal terms) in Western Australia a resource sales for 2004-05.
The 2004-05 increase in total nominal sales value translates to a 26 per cent increase on 2003-04. The size of this increase is a similar order of magnitude as 1999-2000, which delivered a 28 per cent increase in total nominal sales value and 2000-01 when a 29 per cent increase was realised. Average petroleum prices rose in 2004-05 by 40 per cent in Australian dollar terms compared with an 86 per cent average increase in 1999–2000. During this earlier period of growth, other minerals such as nickel, alumina, and to a lesser extent iron ore were contributors to the result. In 2004-05, the value of iron ore, sales was up by 56 per cent and nickel and alumina were strong with gold the only major exported commodity losing ground.
Petroleum ($3.0 billion), iron ore ($3.0 billion), nickel ($470 million) and alumina ($374 million) made up 99.7 per cent of the increase in value of minerals and petroleum sales during the year. Iron ore sales again reached record volumes, increasing by 15 per cent to 233 Mt. In addition to the increased shipments, the price increase for the Japanese fiscal year 2005-06 impacted on the June quarter production adding almost $1.3 billion in value. Without any increase in production, the price rise would add about $5 billion in value to the iron ore industry annual production in a full year.
With the international price of crude oil up by 47 per cent in 2004-05, and 40 per cent in Australian dollar terms, prices played the key role in the State’s petroleum industry with total sales value climbing by 32 per cent to $12.2 billion. The high price of oil coupled with a strong increase in liquefied natural gas (LNG) shipments were the key factors responsible for the increase in petroleum sales value. Actual physical sales quantities of crude oil and condensate fell by 5 per cent due to declining recovery from mature fields.
The maintenance of high international nickel prices and an end in the appreciation of the Australian dollar led to nickel
being the State’s second most valuable mineral sector after iron ore in 2004-05. Although nickel sales volumes recorded a small 1 per cent fall to 180 386 t of contained nickel in 2004-05, down from 182 212 t in 2003-04, the value of sales rose by a healthy $470 million, or 15.5 per cent to $3.5 billion. The significance of high international nickel prices was underlined by achievement of the impressive sales outcome despite the small fall in physical sales volumes and adverse currency movements in the first half of the year.
During the course of 2004-05, the Australian dollar nearly reached US$0.80 before falling back to US$0.76 by June. Over the year there was a 5.2 per cent appreciation in Australia’s exchange rate, though potentially reducing price competitiveness for Western Australia’s commodity exports, it was relatively small when compared to a cumulative 22 per cent AUD-USD appreciation over the previous two years. The vast majority of commodity prices are denominated in US dollars and the stronger Australian currency simply reduced the higher prices that would have been received. For example, an 8.6 per cent increase in international gold prices during the past year, translated to an Australian dollar increase of 3.2 per cent. Slightly lower levels of gold output resulted in a 3 per cent drop in Western Australian gold sales in 2004-05.
Very large falls in the State’s base metals output (copper, lead and zinc) also meant that this sector was unable to fully capitalise on high prices. Although there was a decline in the volume of diamond sales by almost 30 per cent, the value of diamond sales improved by more than 10 per cent in 2004-05 to $467 million.
The State’s mineral and petroleum industry recorded a very positive outcome based on strong world demand and prices. The outcome emphasises the importance of the mineral and petroleum sector in the Western Australian and national economies, contributing around three-quarters of State exports and around a quarter of gross state product. Sales growth of the mineral and petroleum sector has also experienced average annual growth of around 8 per cent per annum during the last 10 years.
Some additional key figures highlighting the importance of both the Western Australian and national resources sector produced by the ABS, the Australian Bureau of Agricultural and Resource Economics (ABARE), the Western Australian Department of Treasury and Finance and the Department of Industry and Resources indicate that in 2004-05 the:
• average number of persons employed in the Western Australian mineral and petroleum industry rose by 12 per cent or 5 800 people to reach 54 330. A significant number of these are currently engaged in construction activities bringing new mines, infrastructure, petroleum facilities and processing plants into being.
• total value of Western Australian mineral and petroleum exports are estimated to have reached $32 billion. This represented over 80 per cent of the State’s total merchandise exports of $38.6 billion.Figure 6 Petroleum Exploration Expenditure Source: ABS
Rest of Australia Western Australia
0
200
400
600
800
1000
1200
1995-96 1998-99 2001-02 2004-05
$ Million

8 Western Australian Mineral and Petroleum Statistics Digest 2004–05
Resource Focus 2004 - 05
Figure 8 Major Commodities by Value 2003 and 2004 Source: DoIR
0 1000 2000 3000 4000 5000 6000 7000 8000 9000
Coal
Base metals
Diamonds
Heavy mineral sands
Natural gas & LPG
Nickel
LNG
Gold
Alumina
Iron ore
Crude oil & condensate
$ Million
2003-04 2004-05
Figure 7 Average Price Comparison 2003-04 and 2004-05Sources: LME, Kitco, TEX report, Metal Prices
0
10
-10
20
30
40
50
Oil Iron Ore Lump
Nickel Gold
Cobalt
Copper Lead Zinc
% Change
US$ A$
• total value of Australian mineral and petroleum exports are estimated to have amounted to $68.6 billion. This represented 54 per cent of the nation’s total merchandise exports of $126.3 billion.
• total value of Western Australia’s mineral and petroleum sales in 2004-05 ($33.2 billion) represented approximately 50 per cent of ABARE’s estimated total Australian value of mineral and petroleum sales in 2004-05.
3.2 Commodity PricesIn 2004-05, the Australian dollar continued to appreciate against the US dollar over the six months to December 2004, retracing some ground in the latter portion of the financial year. In annual average terms, one Australian dollar was worth US$75.4 cents, a 5.2 per cent increase compared to the previous year (US$71.4 cents). The slow fall in the Australian dollar since the beginning of 2005 has come about from the lower interest rate differential between Australia and the US and the outlook for more stable Australian interest rates in the future.
The resources sector experienced price increases across a range of commodities including oil which rose on average by 46.8 per cent in US dollar terms year on year. According to ABARE, a number of factors such as geopolitical tensions and a decline in spare capacity contributed to the increased oil price. Inventories of base metals were either at all–time lows, or appeared to be approaching such levels in the early stages of 2005. Overall, resource commodities performed better than most analysts expected with commodities such as base metals, alumina, nickel and tin all consolidating the price rises in the lead-up to 2004-05.
Strong global demand growth, largely attributed to China, continued to drive world demand for minerals and the average value of the Reserve Bank of Australia’s (RBA) US dollar, non-rural commodity price index was 30 per cent higher in 2004-05 compared to 2003-04. Due to the continued appreciation of the Australian currency, the RBA’s non-rural commodity price index in local currency terms was only 23 per cent higher in 2004-05 compared to 2003-04.
Base metals, such as copper, lead, zinc and nickel continued to experience strong price growth in US dollar terms, with the RBA’s base metal price index higher on average by 22 per cent during 2004-05. In Australian dollar terms, the base metals price index was only 16 per cent higher in annual average terms. Most commodity market prices are continuing to rise and only show signs of a slowdown in the rates of increase. In the metals markets however, the price of steel has come down from its highs.
Influenced by the activity in commodity trade, spot-ocean freight prices also increased significantly with spot rates for key vessel categories that deliver dry bulk commodities, such as coal and iron ore tripling. The surge in shipping rates reflected global demand for resources underpinned by China’s demand for coal and iron ore to produce steel for its construction programs. Construction books at major shipbuilders are full and the delivery dates are in the region of two to three years.

Western Australian Mineral and Petroleum Statistics Digest 2004–05 9
Resource Focus 2004 - 05
4. 2004-05 RESOURCE INDUSTRY ANALYSIS
4.1 PetroleumWorld oil prices in 2004-05 averaged US$49.4/bbl (Tapis price). This represented a 49 per cent increase above the equivalent average price in the preceding year. Locally, this increase was reduced a little by an increase in the average value of the Australian dollar against the US dollar. The average increase in the Australian dollar price was 40 per cent — still a substantial jump.
Key factors supporting oil prices have been strong demand combined with supply disruptions. On the demand side, the US economic recovery and rapid growth in oil consumption of newly industrialised countries, particularly China, have supported strong growth in oil requirements. Further upward pressure on oil prices emanated from production difficulties in Venezuela and Nigeria, continued sabotage of Iraq’s oil supply infrastructure, natural disasters and other geopolitical factors. These conditions generated considerable concerns about disruptions to oil supply and served to encourage speculative activity in the market.
Reserve Bank of Australia (RBA) Commodity Price IndexThe Reserve Bank of Australia Commodity Price Index is based on the price of 19 major commodities exported by Australia. These commodities collectively account for around two-thirds of total commodity exports. The index is apportioned into three sections — rural, non-rural and base metals.
The non-rural index comprises base metals (which consist of aluminium, copper, nickel, zinc and lead), gold, coking coal, steaming coal, iron ore, alumina and LNG. The index is compiled monthly and is expressed in US dollars, Australian dollars and Special Drawing Rights (SDR).
The RBA’s index, expressed in US dollar terms is useful because most commodities are traded in world markets in US dollars. However, such an index is subject to changes in the US dollar exchange rate (as it is based on spot prices). In this respect, the SDR index is a better indication of underlying supply and demand for commodities than the US dollar index.
SDR is a unit of account used by the International Monetary Fund (IMF). Its value is based on a basket of currencies comprising the euro, Japanese yen, English pound and US dollar. Weights are assigned to each of these currencies to reflect their relative importance in world terms. The RBA expresses the SDR component of its index in US dollar terms, with commodity prices derived from the London Metal Exchange and Bloomberg and converted to monthly averages of daily data.
Alternatively, the Australian dollar index is useful for gauging the domestic currency price received by Australian commodity exporters as it reflects the interrelation between world commodity prices and the Australian exchange rate. For example, if prices in foreign currency terms remain unchanged but the Australian dollar depreciates, this will be recorded as a favourable upward shift in the index, which would not be evident in either the SDR or US dollar index.
The RBA index is a fixed-weight Laspeyre’s index, using 2001–02 as the base year and excludes crude oil. The index is re-based every five years in order to make long-run reliable comparisons, unlike the national accounts that are re-based annually to track short-run movements. Base-period weights indicate the relative importance given to individual commodities. They are based on gross exports thus explaining the omission of crude oil (for which Australia is a net importer) and correspond to the export value of each commodity as a share of total exports. These weights change over time to reflect changes in the composition of commodity exports. Movements in the index from one period to the next reflect underlying price movements and do not take into account changes in volumes.
140
120
100
80
60
180
160
200
SDR
Inde
x
Figure 10 Non-Rural Commodity Price Index March 2001–02 = 100 Source: Reserve Bank of Australia
A$ US$
Jan-02 May-02 Sep-02 Jan-03 May-03 Sep-03 Jan-04 May-04 Sep-04 Jan-05 May-05 Sep-05
Figure 9 Sales by Commodity 2004-05 Source: DoIR
Nickel 11%
Petroleum37%
Others 8%Alumina 10%
Gold 9%
Iron ore 25%
Crude Oil 16%
LPG - Butane 0.5%
Natural Gas 2%
LNG 11%
LPG - Propane 0.5%
Condensate 7%
Figure 9 Sales by Commodity 2004-05 Source: DoIR
Nickel 11%
Petroleum37%
Others 8%Alumina 10%
Gold 9%
Iron ore 25%
Crude Oil 16%
LPG - Butane 0.5%
Natural Gas 2%
LNG 11%
LPG - Propane 0.5%
Condensate 7%

10 Western Australian Mineral and Petroleum Statistics Digest 2004–05
Resource Focus 2004 - 05
Although a number of significant oil discoveries have been made in recent years, it is anticipated that oil production in the short term will not increase until new fields commence. Scheduled to commence late in 2006 is the Woodside–operated Enfield oil field, with the BHPB–operated Stybarrow project in 2008.
About half of Western Australia’s crude oil is exported, with the US being the largest overseas market. Other export destinations include refineries in New Zealand, Singapore, Thailand, Malaysia, Japan, Papua New Guinea, China and South Korea.
CondensateSales volumes of condensate in Western Australia fell by 8.9 per cent to 5.63 GL in 2004–05. This was largely due to production decreases in the Goodwyn, East Spar and Perseus–Athena fields. However, the lower sales volumes
In 2004-05, the total value of Western Australian petroleum sales amounted to $12.2 billion. This represented an increase of a little over 32 per cent and reversed the static trend of the past few years. The strength of oil and condensate prices and a 34 per cent increase in LNG shipments were the key factors responsible for the increase, as the quantities sold of crude oil and condensate declined. In volume terms, crude oil and condensate sales fell by 5 per cent due to declining recovery from mature fields.
Crude oil was the principal contributor to total petroleum sales, accounting for 43 per cent of total petroleum sales value, followed by LNG (31 per cent) and condensate (18 per cent). Together these commodities account for over 90 per cent of the State’s petroleum sales. The rest was accounted for by natural gas (6 per cent) and liquid petroleum fuels (LPG - propane and butane).
Crude oilIn 2004-05, the sales value of crude oil reached $5.2 billion, which compared with $3.8 billion in the previous financial year. This was a 38 per cent increase due entirely to higher prices.
Strong growth in oil prices counteracted a drop in sales volumes of crude oil. Western Australia produced 80.5 MMbbl of crude oil down 3.2 per cent on the previous financial year. The total reduction in output was 2.6 MMbbl due to declining recoveries from several mature fields.
Falls in overall production levels were partially ameliorated by output increases from fields including Hermes, Hovea, Jingemia, Eremia and Mutineer–Exeter.
The financial year saw production commence at the Santos–managed Mutineer–Exeter field with first quarter production averaging 72 000 bbl per day. The project involved an establishment cost of $440 million with a service contract for the off–take vessel estimated to total $360 million.
Figure 13 Condensate Exports Total Value $2.11 billion Source: DoIR
Malaysia 7%
New Zealand 4%
China 6%
USA 8%
Thailand 19%
Singapore 26%
South Korea 20%
Japan 10%
Figure 11 Petroleum Exports Total Value $10.39 billion Source: DoIR
New Zealand 7%
USA 11%
Other 3%
China 4%
Singapore 10%
South Korea 11%
Malaysia 5% Thailand 8%
Japan 41%
Figure 12 Crude Oil Exports Total Value $4.11 billion Source: DoIR
USA 20%
New Zealand 15%
China 8%
Singapore 11%Malaysia 9%
Papua New Guinea 5%
Thailand 10%
South Korea 8%
Japan 14%

Western Australian Mineral and Petroleum Statistics Digest 2004–05 11
2004 - 05 Resource Industry Analysis
did not cancel out the much stronger prices leading to a large 26 per cent increase in the value of output over the previous financial year.
Condensate is a by-product from gas fields and Woodside Energy is Western Australia’s largest condensate producer. The top-three condensate fields operated by Woodside, namely Goodwyn, North Rankin and Echo–Yodel, account for around 93 per cent of the State’s total. North Rankin is the largest producer of condensate, generating 12.9 MMbbl in 2004–05 but production levels have decreased, dropping by 9 per cent compared with the previous year.
Almost all of Western Australia’s condensate was exported with the major destinations being refineries in Singapore, South Korea, Thailand, Japan and the US.
Figure 16 Tapis Crude Oil Price US$/bbl Source: WA Treasury Corporation
28
32
36
40
48
44
56
52
60
US$
Jan 04 Jan 05Jul 03 Jul 04 Jul 05
Gig
alitr
es
0
5
10
15
20
25
30
35
40
45
20001995199019851980197519701965
Rest of Australia Western Australia
Figure 14 Crude Oil Condensate Quantity Sources: DoIR and ABARE
Gig
alitr
es
$ M
illio
n
4.0 1000
1250
1500
1750
2000
2250
4.6
5.2
5.8
Jun 05Mar 05Dec 04Sep 04Jun 04Mar 04Dec 03Sep 03
Value Quantity
Figure 15 Crude Oil and Condensate Quantity and Value by Quarter
Source: DoIR

12 Western Australian Mineral and Petroleum Statistics Digest 2004–05
2004 Resource Industry Analysis
Liquefied natural gas (LNG)LNG is Western Australia’s second, most valuable petroleum product after crude oil, accounting for 31 per cent of the State’s total petroleum sales in 2004-05. In contrast to crude oil and condensate, the volume of LNG sales increased by an impressive 34 per cent to 10.4 Mt. All of Western Australia’s LNG is exported. In 2004-05, the value of LNG sales was $3.78 billion representing a 36 per cent increase compared to the previous financial year. Japan remains the dominant overseas market for LNG, accounting for about 84 per cent of the State’s total exports. Other LNG export destinations include South Korea, the US and Spain.
LNG is produced by the North West Shelf Venture (NWSV) gas project. Based on extensive gas and condensate reserves discovered in the early 1970s, the NWSV project began LNG exports to Japan in 1989 under a long-term contract. Japanese power utilities remain the principal purchasers. The NWSV also began supplying LNG to South Korea under a mid-term, seven-year contract that started in late 2003. In addition to contract sales, ‘spot’ cargo sales have also taken place around the world.
A new LNG sale and purchase agreement with the Japanese energy utility, Kansai Electric Power, was signed in July 2004 by the NWS LNG sellers. In December 2004, the NWSV signed an agreement to supply LNG to the Guangdong LNG project in
China. The Chinese oil company involved also acquired equity in the NWSV project entitling it to a share of future production.
The $2.7 billion fourth train expansion of the NWSV gas–processing facilities was completed in 2004 and commenced production in September 2004. The addition of this fourth train took production to the new high of 10.4 Mt for the year.
Woodside announced the development of a third platform on the Angel field to underpin current gas contract and future sales. This will be the third major offshore production platform (for the NWSV) to be built off the North West Shelf under the gas and condensate project. It will include a new 50 km subsea pipeline linking the platform to the venture’s existing North Rankin production facility. Platform capacity is up to 800 million cubic feet per day of gas plus up to 50 000 bbl of condensate, with production expected to commence in 2008.
Preliminary site works for a fifth LNG train have been completed. This train will lift LNG capacity to 15.9 Mt/a.
Whilst the NWSV gas project is currently the only LNG project in Western Australia, additional facilities are under consideration for the Gorgon project, the Scarborough project and the Pluto project.
The Gorgon gas project involves a processing plant on Barrow Island. The Scarborough project is considering development
Northern Territory
South Australia
New South Wales
Victoria
Tasmania
Queensland
Western Australia
80.6 Tcf
0.06 Tcf
CARNARVON BASIN
GIPPSLANDBASIN
BASSBASIN
OTWAYBASIN
PERTHBASIN
Perth
Karratha
Broome
Darwin
Brisbane
Sydney
Melbourne
Hobart
Adelaide
BROWSEBASIN
BONAPARTEBASIN
COOPER–EROMANGA
BASIN SURAT–BOWENBASIN
30.3 Tcf
22.92 Tcf
1.9 Tcf(total)
3.13 Tcf
0.5 Tcf (in place)
2.4 Tcf
ACT
Figure 17 Australia’s Gas Resources

Western Australian Mineral and Petroleum Statistics Digest 2004–05 13
2004 - 05 Resource Industry Analysis
at Onslow and a number of possible sites are under consideration for the Woodside Pluto project. Woodside has entered into a heads of agreement for sales to Tokyo Gas.
A development decision regarding the Gorgon LNG project is subject to market commitments. The Gorgon Joint Venture is targeting markets in China, South Korea and North America. Sale commitments have been made to US customers and more contracts are being sought. Woodside is marketing gas from the proposed Pluto project to similar customers while BHPB has looked to Asia and the west coast of America.
Natural gasApart from gas used as feedstock for LNG production, all remaining natural gas produced in Western Australia is for domestic industrial and household consumption. In 2004-05, natural gas sales for domestic purposes accounted for 6 per cent of the State’s total petroleum sales. Natural gas sales fell by 5 per cent to 7.6 Gm3, worth $679 million. The reduction was primarily due to the closure of the BHPB direct reduced iron plant at Port Hedland. This project was a large gas consumer. Lack of capacity in the transmission pipeline made it difficult to sell the unwanted gas to customers in the south of the state.
The 2004-05 year marked 20 years of gas supply to Western Australia from the NWSV project. Western Australia holds about 80 per cent of the nation’s total gas reserves. In addition, according to data sourced from ABARE’s Australian Mineral Statistics Quarterlies, Western Australia produces 65 per cent of the nation’s natural gas.
As at the end of 2005, the gas reserves for Australia were:
• Bonaparte Basin 21.6 Tcf (Western Australian portion 1.94 Tcf, Northern Territory portion 20.98 Tcf)
• Browse Basin 30.3 Tcf
• Carnarvon Basin 80.6 Tcf
• Perth Basin 0.06 Tcf
• Otway Basin 2.4 Tcf
• Bass Basin 0.5 Tcf
• Gippsland Basin 3.13 Tcf
• Cooper–Eromanga Basin and Surat–Bowen Basin 1.9 Tcf.
Western Australia holds about 80 per cent of the nation’s total gas reserves. In addition, according to data sourced from ABARE’s Australian Mineral Statistics Quarterlies, Western Australia produces 67 per cent of the nation’s natural gas.
Reserves are calculated on the basis of a 50 per cent probability of recovery. These refer to resources that may or may not eventually prove viable. They are resources that have not at present been delineated, audited or appraised by an independent third party.
Liquefied petroleum gas (LPG)In 2004-05, sales volumes of LPG (including butane and propane) increased by 4 per cent to 726 104 t compared to the previous financial year. Higher prices saw the value of
production jump by 33 per cent on the previous year to $375 million. The majority of LPG produced in the State is for export to Japan, the primary destination.
4.2 Iron OreThe quantity of iron ore expanded significantly by 15 per cent from 202 Mt to 233 Mt in 2004-05 while the corresponding value of production increased by 56 per cent to $8.3 billion. As a result, the share of iron ore in the total value of 2004-05 mineral and petroleum sales increased to 25 per cent from 20 per cent in 2003-04.
Figure 18 Iron Ore Exports Total Value $8.17 billion Source: DoIR
USA 0.2%Europe 4%
Taiwan 5%
South Korea 10%
Japan 32%
China 49%
Figure 19 Iron Ore Price A$/Fe unit Source: Tex Report, High Grade Fine Ore Prices
0.38
0.42
0.46
0.50
0.54
0.58
0.62
0.66
0.70
0.74
0.78
0.82
A$
Jan 04 Jan 05Jul 03 Jul 04 Jul 05
14 Western Australian Mineral and Petroleum Statistics Digest 2004–05
2004 Resource Industry Analysis
Confidence about future iron ore exports received a boost with a 71.5 per cent increase in price agreements for the 2005 contract year negotiated by two of the largest Pilbara-based suppliers (BHPB and Rio Tinto) for iron ore originating from the Pilbara region of Western Australia. The negotiated price rises brought BHPB Mount Newman High Grade Lump to 78.8 US cents per dry metric tonne unit and Mount Newman High Grade Fines to 61.7 US cents per dry metric tonne unit. Pilbara Iron (a member of the Rio Tinto Group) products likewise increased to 78.8, 61.7 and 58.0 US cents per dry metric tonne unit for Lump, Fine and Yandi ore, respectively.
The 2004-05 price increases add to a range of favourable factors for Western Australia’s iron ore industry. Thus, whilst the Pilbara Region supplies 97 per cent of Western Australia’s iron ore exports, favourable demand prospects help to underpin the viability of smaller mining operations located in the Wheatbelt, the Mid West and Kimberley regions. In 2004-05, approximately 2 per cent of iron ore exports originated from the Yilgarn Shire (located in the eastern portion of the Wheatbelt). Though small in the total share of iron ore exports, the quantity of 2004-05 exports represented a 12 per cent increase on 2003-04. A further 0.8 per cent originated from the Mullewa Shire (in the Mid West) and 0.4 per cent from the Shire of Derby-West Kimberley.
In the Pilbara, Rio Tinto accounted for 60 per cent of the region’s iron ore output, producing close to 134.7 Mt of saleable iron ore while BHPB reported total production of 89.1 Mt to account for the remaining 40 per cent. According to BHPB’s Production Report for the June quarter 2005, production by major iron ore operation located in the Pilbara consisted of Mount Newman (25.7 Mt), Mount Goldsworthy (4.7 Mt), Mining Area C (16.6 Mt), Yandi (35.7 Mt) and Jimblebar (6.4 Mt). Rio Tinto reported that its Pilbara iron ore production originated from Hamersley Iron (85.3 Mt), Pannawonica (30.2 Mt) and West Angelas (19.2 Mt).
Outside of the Pilbara, Portman Iron Ore projects at Koolyanobbing, in the Yilgarn Shire and Cockatoo Island in Yampi Sound produced 6.1 Mt of iron ore. The Koolyanobbing operation was expanded by developing the Windarling and Mount Jackson deposits north of Koolyanobbing. In the Mid West, Mount Gibson Iron reported production of 1.8 Mt from its Tallering Creek operation.
Much of the demand growth for Western Australia’s iron ore originates from China. According to statistics supplied by China Customs and the Tex Report, Australia is China’s largest supplier with Western Australian iron ore accounting for most of Australia’s 38 per cent share of Chinese iron ore imports; a total value that exceeded $4 billion. This represented 50 per cent of the value of the State’s iron ore exports and compares with 32 per cent exported to Japan, 10 per cent to South Korea, 5 per cent to Taiwan and 3 per cent to Europe. As a result, Western Australia’s cumulative iron ore production from the Pilbara has increased by 50 per cent in the past five years to around 225 Mt.
In order to meet demand growth, many of the State’s iron ore suppliers have expanded capacity. During the financial year, Rio Tinto’s Pilbara Iron upgraded rail, port and mining (Yandicoogina and West Angelas) capacity. Contracts entered into by Pilbara Iron mean that from 2006–07, Pilbara Iron will be committed to long-term sale agreements of iron ore totalling around 70 Mt to Chinese steel mills through joint ventures or long-term contracts. Robe River, in which Rio Tinto has a 53 per cent shareholding, will provide 15 Mt per year of this tonnage.
BHPB also increased throughput capacity in its Pilbara iron ore operations. BHPB expanded capacity through the PACE project to 110 Mt and is working on a further expansion to 118 Mt. The company is evaluating options to take production to 152 Mt a year. As part of its continuing iron ore trading links with Japan, BHPB announced a sub-lease over a resource
50
0
150
100
200
1950 1955 1960 19701965 1975 1980 1985 1990 1995 2000
Mill
ion
tonn
es
Figure 21 Iron Ore Quantity Sources: DoIR and ABARE
Rest of AustraliaWestern Australia
Mill
ion
tonn
es
$ M
illio
n
45 1000
1250
1500
1750
2000
2250
2500
2750
3000
3250
50
55
60
65
Jun 05Mar 05Dec 04Sep 04Jun 04Mar 04Dec 03Sep 03
ValueQuantity
Figure 20 Iron Ore Quantity and Value by Quarter Source: DoIR

Western Australian Mineral and Petroleum Statistics Digest 2004–05 15
2004 - 05 Resource Industry Analysis
20%
0%
60%
40%
80%
100%
2001
Australia2000 200420032002
Figure 22 China’s Iron Imports by Source Source: China Customs and The TEX Report
Brazil
India Other
South Africa
11.4% 9.6% 9.2% 6.5%5.3%
15.6% 18.3% 20.2% 21.8% 24.1%
21.1% 26.5% 26.7% 25.9% 22.1%
46.8% 41.1% 38.4% 39.3% 37.6%
In Australian dollars the nickel price rose from $17 067/t in 2003-04 to $19 914/t in 2004-05, a 17 per cent increase following the 30 per cent increase in the previous year. The bulk of the Australian dollar’s rise had occurred in 2003-04 and the small average appreciation of 5 per cent in 2004-05 had less of a negative impact on Australian returns.
Although nickel sales volumes recorded a small 1 per cent fall to 180 386 t of contained nickel in 2004-05, the value of sales rose by $470 million, or 16 per cent to $3.5 billion. Nickel moved in front of alumina as the second, most–valuable mineral commodity following iron ore.
Recent high production means that Western Australia is the world’s second–largest nickel producer, accounting for 14 per cent of the world’s nickel output.
• According to the ABS, Western Australia accounts for 90 per cent of Australia’s 26.7 Mt of total economic demonstrated resources (EDR) for nickel.
Figure 23 Nickel Price A$/tonne Source: LME Cash, Monthly Average
12
14
16
18
20
22
24
$/Thousand
Jan 04 Jan 05Jul 03 Jul 04 Jul 05
called Yandi Western 4. JFE Steel of Japan acquired a 20 per cent interest in the deposit with plans for 16 Mt over the next 11 years.
Among the smaller operators, Portman Iron Ore announced that its Koolyanobbing operation was expanded by developing the Windarling and Mount Jackson deposits north of Koolyanobbing. Portman Iron Ore also reported that the company’s Esperance Port infrastructure was expanded with a further expansion to 8 Mt a year planned for late 2006. This expansion follows an upgrading of reserves at Koolyanobbing that extended the expected life of the mine by 13 years, with additional upside potential from exploration.
Mount Gibson Iron Limited said that it plans to begin production at its second mine at Mt Gibson during 2007, with expected production of 1.5 Mt per year. Asia Iron, a new company in which Mount Gibson Iron Limited has a significant shareholding interest, is progressing development plans for the exploitation of the primary banded iron formations at Extension Hill at Mt Gibson involving concentration and pelletising.
There are a number of potential new developments at various stages of evaluation including the Mineralogy magnetite project in the Pilbara, Jack Hills, Weld Range, Mt Karara, and Blue Hills in the Mid West, Koolan Island in Yampi Sound and Southdown, east of Albany. Mineralogy Pty Ltd has environmental approval to develop a 19.6 Mt/a concentrate, pellet and DRI project with a deepwater port nearby at Cape Preston. Discussions with a large Chinese steel company in regard to investing in the project are continuing.
Iron ore is also becoming the focus of exploration activity in a number of other areas of the State, with companies promoting iron ore prospects having little difficulty in raising stock exchange subscriptions to progress the search and evaluation. The continued vigour of the steel industries in China, South
Korea and Taiwan linked to a stable major demand base of Japan will underpin significant increases in Western Australia’s iron ore sales well into the next decade.
4.3 NickelDuring 2004-05, the price of nickel continued to grow strongly with a 22 per cent 2004-05 average increase in the international US dollar denominated price over the average for 2003-04. The average price rose from US$12 264/t (US$5.56/lb) to US$14,959/t. Coming on the back of a 60 per cent increase in the previous year this has resulted in an average 82 per cent increase since 2002-03. Consequently, despite the impact of the local currency’s appreciation over the last two years, local producers received price increases of nearly 50 per cent.
16 Western Australian Mineral and Petroleum Statistics Digest 2004–05
2004 - 05 Resource Industry Analysis
• In turn, Australia accounts for 36.6 per cent of the world’s nickel EDR, making Australia the world’s largest single holder of nickel resources.
Western Australia’s nickel mining operations can be classified according to the ore bodies being mined and are known as being either sulphide or lateritic. According to the Australian Mines Atlas, Australia’s nickeliferous sulphide ores and their host rocks mainly form parts of ancient volcanic lava flows. However, most of the world's known resources are contained in nickel-bearing laterites in minerals such as garnierite and nickeliferous limonite (nickel mixed with hydrated iron oxide). These are secondary minerals, derived by the weathering of nickel-bearing mafic and ultramafic rocks in tropical and sub–tropical climates, which have been subsequently concentrated in the soil. The nickel grade of sulphide ore typically ranges from 1-4 per cent, and that of lateritic ore from 1-2 per cent.
Currently, all of Australia’s nickel production is from Western Australia. Nickel sulphide deposits are mined in Western Australia at Kambalda, Leinster, Mount Keith, Silver Swan, Cosmos, Wannaway, Mittel, RAV8, Radio Hill and Emily Ann by underground and open-cut methods. Lateritic nickel mining also occurs following the introduction of pressure acid leaching technology (PAL). Production from Cawse, Bulong and Murrin Murrin deposits all commenced in late 1998 or early 1999, with BHPB’s Ravensthorpe project expected to commence operations in 2007.
The most significant structural move in the Western Australian nickel industry during 2004–05 came in June 2005 with the takeover of Western Mining Corporation (WMC) by BHPB. BHPB now runs the former WMC operations at Mount Keith, Leinster, Kambalda and Kwinana refinery under the name, Nickel West.
The WMC acquisition means that BHPB is Western Australia’s largest nickel producer with the total for 2004–05 estimated to be at least 66 912 t.
Western Australia’s second-largest nickel producer, Minara Resources (Murrin Murrin) produced 28 631 t. However scheduled maintenance, unscheduled problems in the hydrogen sulphide plant and a fire in May 2005, reduced production in the June quarter 2005 to 4 736 t. Consequently production in the first half of 2005 (13 356 t) was lower than the 6 months to December 2004. Production in the record March quarter, prior to the maintenance problems was an annualised rate of 32 000 t per annum.
• the Murrin Murrin nickel operation is 60 per cent owned by Minara Resources with Glencore holding the remaining 40 per cent interest.
The third-largest producer was Jubilee Mines which produced over 11 000 t in 2004-05 from underground mining at Cosmos Deeps (some 500 metres below the Cosmos mine) following the cessation of open–cut mining.
• Jubilee Mines released resource estimates for its Prospero discovery, which indicated nickel worth more than $700 million. The initial inferred resource of 33 500 t of contained nickel, slightly more than Cosmos’ 32 900 t of contained nickel. Although, the Prospero ore body lies 600 metres below the Earth’s surface, Prospero is located 4.5 km south of Cosmos allowing utilisation of much of the existing infrastructure.
Other large producers include Mincor Resources (Miitel, Mariners, Redross, Wannaway) and LionOre (previously MPI Mines) operating at Black Swan, Maggie Hays and Emily Ann. Mincor commenced production from Redross in August 2004 and Mariners in early 2005 adding to its existing Miitel and Wannaway mines for an annual total of 10 028 t in 2004-05. LionOre’s operations at Black Swan produced at 6 000 t of contained nickel per annum for the first half of 2005 and its Emily Ann – Maggie Hays (Lake Johnson Operations) produced 9 882 t of contained metal in 2004-05.
40
0
160
80
120
200
1970 1975 1980 1985 1990 1995 2000
Thou
sand
tonn
es
Figure 25 Nickel Quantity Sources: DoIR and ABARE
Rest of AustraliaWestern Australia
Thou
sand
tonn
es
$ M
illio
n
30
35
40
45
50
55
500
600
700
800
900
1000
Jun 05Mar 05Dec 04Sep 04Jun 04Mar 04Dec 03Sep 03
Value Quantity
Figure 24 Nickel Quantity and Value by Quarter Source: DoIR

Western Australian Mineral and Petroleum Statistics Digest 2004–05 17
2004 - 05 Resource Industry Analysis
The continuing strong demand for nickel has stimulated the development of new prospects. Among the most significant is the BHPB Ravensthorpe nickel laterite project that is, according to the GL Survey, expected to produce 30 000 t/a to 50 000 t/a of contained nickel. Construction began in late 2004 with first production expected in late 2007 and full production in the second half of 2008. The mine is expected to have a life of 25 years.
Another large potential project is proposed by Heron Resources and Inco. Proposed production from the Kalgoorlie Nickel Project (KNP) at Goongarrie about 85 km north of Kalgoorlie is around 40 000 t/a of contained nickel. Inco, the world’s second largest nickel producer, has committed to spend $100 million to complete a bankable feasibility study of the KNP. The project, should it proceed to production, will begin mining a nickel ore body that is estimated to be approximately three times the size of BHPB’s Ravensthorpe mine.
Among new projects approaching operational status, Western Areas’ has identified nickel resources of at least 300 000 t at its Flying Fox nickel mine (400 km east of Perth). Production is expected to begin at the company’s T1 deposit sometime in 2006. Stage 1 production is expected to produce 6 000 t of contained metal per year.
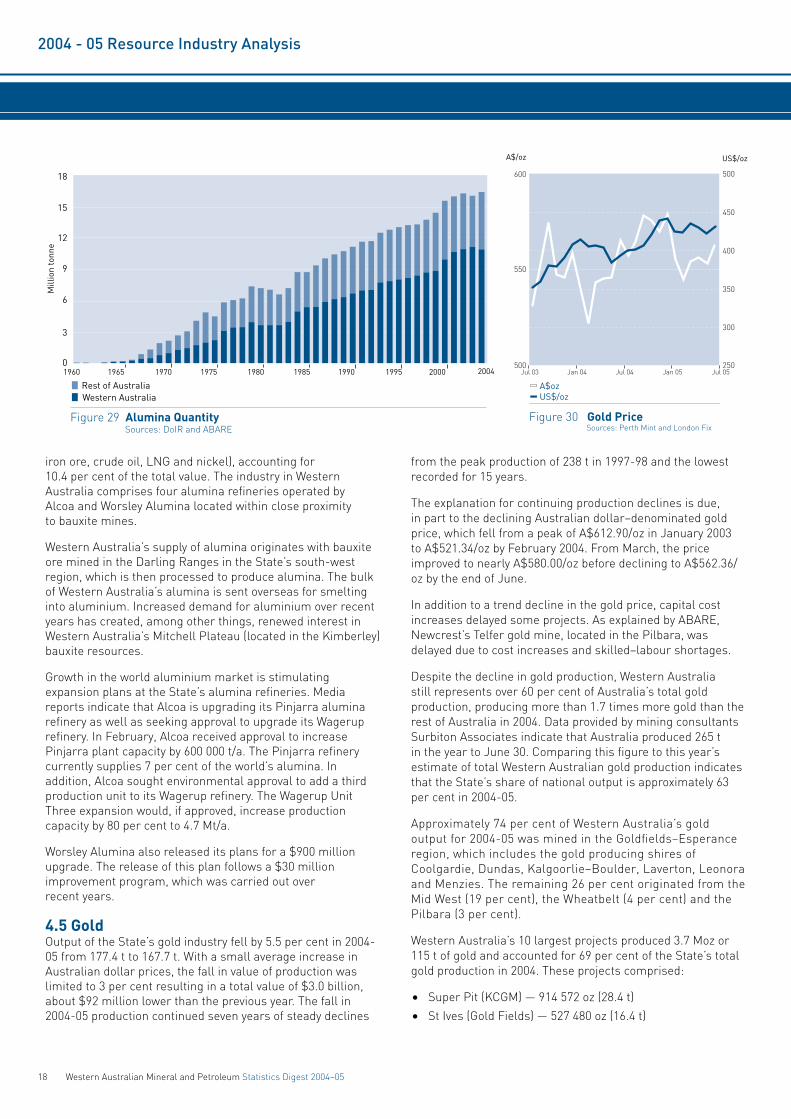
4.4 AluminaWestern Australian alumina production has increased continuously from 1980 until 2004-05 and has stabilised at close to 11 Mt/a.
The price received by local producers averaged A$310/t in the year. This was a 12 per cent increase on the previous 12 months and takes prices back towards, but still short of, the peak values received in 2000-01. This recovery in the alumina market, with solid US dollar price growth, was reflected in the strong growth in the value of production to a total of $3.5 billion for 2004-05.
The alumina industry is, in the 2004-05 period, Western Australia’s fifth–largest resources sector by sales value (after
Figure 26 Alumina Exports Total Value $3.05 billion Source: DoIR
Other 6%
USA 6%
Canada 15%
Mozambique 10%
UAE 15% China 13%
Bahrain 12%
South Africa 15%
Indonesia 5%
Egypt 3%
Figure 28 Alumina Price A$/tonne Source: ABS
250
270
290
310
330
Jan 04 Jan 05Jul 03 Jul 04 Jul 05
A$M
illio
n To
nnes
$ M
illio
n
2.5 600
700
800
900
1000
2.6
2.7
2.8
2.9
3.0
3.1
Jun 05Mar 05Dec 04Sep 04Jun 04Mar 04Dec 03Sep 03
Value Quantity
Figure 27 Alumina Quantity and Value by Quarter Source: DoIR
18 Western Australian Mineral and Petroleum Statistics Digest 2004–05
2004 - 05 Resource Industry Analysis
iron ore, crude oil, LNG and nickel), accounting for 10.4 per cent of the total value. The industry in Western Australia comprises four alumina refineries operated by Alcoa and Worsley Alumina located within close proximity to bauxite mines.
Western Australia’s supply of alumina originates with bauxite ore mined in the Darling Ranges in the State’s south-west region, which is then processed to produce alumina. The bulk of Western Australia’s alumina is sent overseas for smelting into aluminium. Increased demand for aluminium over recent years has created, among other things, renewed interest in Western Australia’s Mitchell Plateau (located in the Kimberley) bauxite resources.
Growth in the world aluminium market is stimulating expansion plans at the State’s alumina refineries. Media reports indicate that Alcoa is upgrading its Pinjarra alumina refinery as well as seeking approval to upgrade its Wagerup refinery. In February, Alcoa received approval to increase Pinjarra plant capacity by 600 000 t/a. The Pinjarra refinery currently supplies 7 per cent of the world’s alumina. In addition, Alcoa sought environmental approval to add a third production unit to its Wagerup refinery. The Wagerup Unit Three expansion would, if approved, increase production capacity by 80 per cent to 4.7 Mt/a.
Worsley Alumina also released its plans for a $900 million upgrade. The release of this plan follows a $30 million improvement program, which was carried out over recent years.
4.5 GoldOutput of the State’s gold industry fell by 5.5 per cent in 2004-05 from 177.4 t to 167.7 t. With a small average increase in Australian dollar prices, the fall in value of production was limited to 3 per cent resulting in a total value of $3.0 billion, about $92 million lower than the previous year. The fall in 2004-05 production continued seven years of steady declines
from the peak production of 238 t in 1997-98 and the lowest recorded for 15 years.
The explanation for continuing production declines is due, in part to the declining Australian dollar–denominated gold price, which fell from a peak of A$612.90/oz in January 2003 to A$521.34/oz by February 2004. From March, the price improved to nearly A$580.00/oz before declining to A$562.36/oz by the end of June.
In addition to a trend decline in the gold price, capital cost increases delayed some projects. As explained by ABARE, Newcrest’s Telfer gold mine, located in the Pilbara, was delayed due to cost increases and skilled–labour shortages.
Despite the decline in gold production, Western Australia still represents over 60 per cent of Australia’s total gold production, producing more than 1.7 times more gold than the rest of Australia in 2004. Data provided by mining consultants Surbiton Associates indicate that Australia produced 265 t in the year to June 30. Comparing this figure to this year’s estimate of total Western Australian gold production indicates that the State’s share of national output is approximately 63 per cent in 2004-05.
Approximately 74 per cent of Western Australia’s gold output for 2004-05 was mined in the Goldfields–Esperance region, which includes the gold producing shires of Coolgardie, Dundas, Kalgoorlie–Boulder, Laverton, Leonora and Menzies. The remaining 26 per cent originated from the Mid West (19 per cent), the Wheatbelt (4 per cent) and the Pilbara (3 per cent).
Western Australia’s 10 largest projects produced 3.7 Moz or 115 t of gold and accounted for 69 per cent of the State’s total gold production in 2004. These projects comprised:
• Super Pit (KCGM) — 914 572 oz (28.4 t)
• St Ives (Gold Fields) — 527 480 oz (16.4 t)
6
0
3
12
9
18
15
1960 1965 1970 1975 1980 1985 1990 1995 2000
Mill
ion
tonn
e
Figure 29 Alumina Quantity Sources: DoIR and ABARE
Rest of AustraliaWestern Australia
2004
Figure 30 Gold PriceSources: Perth Mint and London Fix
500
550
600
A$/oz
500
US$/oz
450
400
350
300
250Jan 04 Jan 05Jul 03 Jul 04 Jul 05
A$ozUS$/oz
Figure 30 Gold PriceSources: Perth Mint and London Fix
500
550
600
A$/oz
500
US$/oz
450
400
350
300
250Jan 04 Jan 05Jul 03 Jul 04 Jul 05
A$ozUS$/oz

Western Australian Mineral and Petroleum Statistics Digest 2004–05 19
2004 - 05 Resource Industry Analysis
• Sunrise Dam (AngloGold Ashanti Limited) — 473 928 oz (14.7 t)
• Granny Smith (Placer Dome) — 343 001 oz (10.7 t)
• Jundee-Nimary (Newmont) — 266 733 oz (8.3 t)
• Plutonic (Barrick Gold) — 280 892 oz (8.7 t)
• Kanowna Belle (Placer Dome) — 239 751 oz (7.5 t)
• Agnew (Gold Fields) — 212 437 oz (6.6 t)
• Marvel Loch-Southern Cross — 198 334 oz (6.2 t)• Hill 50 – Mount Magnet (Harmony Gold) — 181 627 oz (5.6 t)Western Australia exported 81 per cent of its gold to just three countries, India (50 per cent), the UK (17 per cent) and South Korea (14 per cent). ABARE estimates indicate that world gold production will have risen by about 70 t to 2 534 t from 2004 to 2005 and by a further 55 t in 2006. Indeed, ABARE reports that, for the first time in at least 10 years, jewellery demand exceeded mine production.
Tonn
es
0
50
150
100
250
200
300
350
1910 1920 1930 1940 1950 1960 1970 1980 1990 200019001890
Rest of AustraliaWestern Australia
Figure 31 Gold Production Sources: DoIR and ABARE
Tonn
es
$ M
illio
n
35 600
700
800
900
40
45
50
Jun 05Mar 05Dec 04Sep 04Jun 04Mar 04Dec 03Sep 03
Value Quantity
Figure 32 Gold Quantity and Value by Quarter Source: DoIR
Gold Export update 2004-05The Australia Bureau of Statistics (ABS) trade data indicated a significant rise in Western Australian gold exports. However, this apparent increase in gold exports from Western Australia has been due to a restructuring of Australia’s gold refining industry.
In October 2002, AGR Matthey was formed. This is a partnership between Johnson Matthey (Aust) in Victoria, Western Australia Mint (The Perth Mint) and the Australian Gold Alliance. As a result of the merger, all Australian gold is now refined in Western Australia. The Victorian refinery still refines silver and jewellery products.
Gold export data published by the ABS from Western Australia must therefore be interpreted with some caution. It includes gold produced in other States and Territories, in addition to production from overseas operations, namely Papua New Guinea and Asia, which is refined and exported from Western Australia. This export figure is therefore larger than Western Australia’s own level of gold production.
The ABS estimates that gold exports from Western Australia in 2004-05 amounted to approximately $5.6 billion. Approximately 54 per cent or $3.0 billion was gold
Figure 33 Gold Exports Total Value $3.02 billion Source: DoIR
Vietnam 2%Turkey 2%
Other 4%
India 50%
Japan 2%
United Kingdom 17%
Thailand 5%
Singapore 4%
South Korea 14%
produced in Western Australia. The remaining 46 per cent (approximately $2.7 billion) can be attributed to gold refined and exported from Western Australia but produced from mining operations in other states, territories and overseas.
Overseas imported gold also includes scrap which is refined in Western Australia and exported.
Figure 30 Gold PriceSources: Perth Mint and London Fix
500
550
600
A$/oz
500
US$/oz
450
400
350
300
250Jan 04 Jan 05Jul 03 Jul 04 Jul 05
A$ozUS$/oz

20 Western Australian Mineral and Petroleum Statistics Digest 2004–05
2004 - 05 Resource Industry Analysis
4.6 Heavy Mineral SandsWestern Australia remained the dominant producer of heavy mineral sands in Australia, providing 78 per cent of Australia’s total mineral sands sales value in 2004–05. During 2004–05, the total sales value of Western Australian heavy mineral sands (including garnet, ilmenite, leucoxene, rutile, staurolite and zircon) increased 5.5 per cent.
Prices paid to producers fell for ilmenite (-5.5 per cent), leucoxene (-0.6 per cent), and upgraded ilmenite (-20.7 per cent) but increased for zircon (22.0 per cent), and rutile (1.6 per cent). Sales volume decreased for ilmenite (-7.4 per cent), rutile (-26.8 per cent), and zircon (-3.5 per cent) while the sales volume increased for upgraded ilmenite (9.6 per cent) and leucoxene (36.0 per cent). The remaining sands collectively realised a 116.0 per cent price increase and a volume increase of 185.6 per cent. The net impact of price and production changes resulted in an increased sales value of 5.5 per cent from $755 million to $797 million.
According to TZMI, the weaker prices for titanium minerals has been due to oversupply and more competitive market conditions, which were exacerbated by the entry of some new suppliers. Whilst the price fall for ilmenite was influenced by the strength of the Australian dollar compared with its US counterpart, the price in US dollar terms also fell slightly. The average price received for upgraded ilmenite (synthetic rutile) was virtually unchanged over the previous financial year at A$515/t.
In Western Australia, the volume of zircon sales decreased by 3.5 per cent in 2004–05 to 417 924 t. The price jump of 22 per cent meant that the overall value of sales increased by nearly 18 per cent to $297 million. This meant that zircon increased its share of the value of heavy mineral sands from 33 to 37 per cent.
Although most zircon is exported, a substantial quantity is supplied to the domestic market including three local Western Australian producers involved in value adding processing activities. These comprise Australian Fused Materials and Doral Specialty Chemicals Pty Ltd (previously owned by Millennium Inorganic Chemicals) in Kwinana and Imdex in Jandakot.
Western Australia currently accounts for around 80 per cent of the nation’s production value of titanium and associated minerals and is the only state that produces the value-added products synthetic rutile and titanium dioxide pigment. The dominance of Western Australia in the Australian market reduced markedly in 2004, when it comprised 78 per cent of the total value of production. During the mid to late 1990s, this share was greater than 80 per cent, and generally exceeded 90 per cent between 1999 and 2003.
By region, 42 per cent of the State’s 2004–05 total sales volume originated in the South West, a further 39 per cent from the Mid West and the remaining 19 per cent originated from the Wheat Belt. The South West heavy mineral sands extractive operations located at Capel, Dardanup, Gwindinup,
Ludlow, and Sandalwood and the Kemerton refining plant supplied the majority of the State’s ilmenite (71 per cent) and leucoxene (66 per cent), 36 per cent of the State’s total synthetic rutile sales and nearly a quarter of the State’s zircon (23 per cent) sales. The Mid West heavy mineral sands extractive operations, located at Dongara and Eneabba, supplied 100 per cent of the State’s 2004-05 garnet sales, 72 per cent of the State’s naturally occurring rutile sold in 2004-05 and 53 per cent of the State’s zircon. The Mid West’s Narngulu plant supplied 31 per cent of the State’s total synthetic rutile sales. Remaining heavy mineral sands sales originated from the Wheat Belt. All of the State’s staurolite sold in 2004–05 originated from Dandaragan.
Western Australia’s principal heavy mineral sands suppliers are Cable Sands, Doral Mineral Sands, GMA Garnet, Iluka Resources and Tiwest. Cable Sands owns heavy mineral sands resources in Gwindinup, Jangardup, Ludlow, Tutunup and Yarloop, all located in the South West. The company also operates its mineral separation plant (MSP) in Bunbury. The MSP has treated ore from more than 20 ore bodies. Excess plant capacity is likely to be utilised to treat ore sourced from Pooncarie, New South Wales. Doral Sands owns mineral sands resources in Dardanup along with a wet plant and a dry plant at Picton. Operations began with an initial life of 10 years in 2002, however with identification of additional resources, mine life has been extended for a further 5–10 years. GMA Garnet mines dunes and operates a refinery in Port Gregory (Mid West) and exports its product from Geraldton port. Iluka’s Western Australian production facilities are located in Capel, Eneabba and Narngulu. The Capel operation consists of three mine sites, two dry separation plants, and a synthetic rutile processing plant. Titanium minerals and zircon from Iluka’s Mid West mining operations are processed at the Narngulu processing centre before being exported. Tiwest mines heavy mineral sands, separating titanium minerals and zircon; producing synthetic rutile and manufacturing titanium dioxide pigment.
Figure 34 Heavy Mineral Sands Exports Total Value $554.26 million Source: DoIR
Other 4%
Taiwan 12%
France 5%
South Korea 3%
USA 21%
Mexico 2% UK 9%Spain 7%
Belgium 4%
Netherlands 4%
Saudi Arabia 4%
Japan 10%
China 15%

Western Australian Mineral and Petroleum Statistics Digest 2004–05 21
2004 - 05 Resource Industry Analysis
Tiwest’s sites include: Cooljarloo (Mid West), which produces heavy mineral concentrates from dredging and dry mining operations; and Chandala (Wheatbelt) where the heavy mineral concentrates are separated into ilmenite, rutile, leucoxene and zircon.The ilmenite is also refined to synthetic rutile at Kwinana which processes synthetic rutile into titanium dioxide pigment.
Deposits north of Perth provide ilmenite suitable for synthetic rutile production and the chloride route for titanium dioxide (TiO2) pigment production. South of Perth, deposits are ilmenite-dominant and contain grades suitable for both the sulphate route (53–56 per cent TiO2) and the chloride route (greater than 57 per cent TiO2).
Heavy mineral sands basicsIlmenite, leucoxene and rutile are inorganic chemical compounds containing the element titanium. Titanium dioxide extracted from ilmenite, leucoxene and rutile is used mainly as non-toxic white pigment in products such as paints, paper, plastics, foods and cosmetics. Titanium dioxide is also used in the production of fluxes for welding rods and as a metallurgical flux in iron and steel–making. In its elemental form, titanium is a light, high–strength metal which is extremely resistant to corrosion. These characteristics have led to the use of titanium metal in jet aircraft engines and pipelines. Titanium is also being used increasingly in the manufacture of golf club heads and tennis racquets.
4.7 DiamondsWestern Australian diamond sales fell by approximately 30 per cent. This follows a substantial decline in production at the Argyle Diamond mine in the first half of 2004. Since that time, Argyle Diamonds has recorded substantially higher production figures. As diamond quantity statistics reported in this digest reflect sales, rather than production, the reported sales decline is consistent with the reduced production in the previous financial year. Reported sales from this mine and the Ellendale project of Kimberley Diamonds fell to 22.8 Mct from 32.5 Mct in the previous financial year. An improvement in international prices and a higher proportion of the more valuable Ellendale diamonds meant that the value of production fell by only 10 per cent compared with the 30 per cent fall in volume.
International diamond market conditions were strong in 2004-05. The Antwerp Diamond Index indicated a 6.5 per cent price increase and Belgium exports of polished diamonds increased by 10.9 per cent. Global retail sales were healthy with growth in the Asia–Pacific region, India, and the Middle East. Japan also recorded modest growth for the second year.
According to Geoscience Australia, Australia is the fourth–largest producer of diamond by weight after Botswana, Russia
Figure 35 Heavy Mineral Sands Price Index Source: WA Treasury Corporation
70
75
80
85
90
95
100
Jan 04 Jan 05Jul 03 Jul 04 Jul 05
A$
Inde
x (2
000-
01 =
100
)
$Mill
ion
0
200
400
600
800
1000
1200
1992 1997 20021987198219771972196719621957
Value Quantity
Figure 37 Heavy Mineral Sands Value of Production Includes Ilmenite, Leucoxene, Upgraded Ilmenite, Rutile, Zircon and Monazite Sources: DoIR and ABARE
150
175
200
225
250
Jun 05Mar 05Dec 04Sep 04Jun 04Mar 04Dec 03Sep 03
$ M
illio
n
Figure 36 Heavy Mineral Sands Value by Quarter Source: DoIR

22 Western Australian Mineral and Petroleum Statistics Digest 2004–05
2004 - 05 Resource Industry Analysis
and Congo. Australia is the fourth–largest producer of gem/near gem diamond and the third–largest producer of industrial grade diamonds. Western Australia dominates Australian production, with most production originating from the Argyle diamond mine located in the Kimberley.
All of Western Australia’s diamonds currently originate from the Kimberley, which is the only known significant source of pink diamonds, producing 90 to 95 per cent of the world’s supply. The Argyle diamond mine is also notable for being the first commercial diamond mine exploiting a volcanic pipe of lamproite, rather than the more usual kimberlite pipe.
Rio Tinto’s Argyle diamond mine accounts for the bulk of diamond sales from Western Australia. The Argyle project has been the world’s largest supplier of natural–coloured diamonds and its output accounts for almost all of Australia’s diamond production. In 2004-05, Argyle’s sales were recorded down by a third on the previous year. Mining difficulties in 2003-04 slowed production but the first half of 2005 production results from the Argyle mine showed a recovery to 18.1 Mct.
The Argyle open–pit operation is expected to continue until 2008. The company has committed to an underground mine that is expected to extend the mine’s life to 2018. Average annual production from the mine in the period 2007 to 2018 is expected to be around 60 per cent of Argyle’s historic annual average production level of 34 Mct.
Diamond production also continued at Western Australia’s only other diamond mine, Kimberley Diamond Company’s Ellendale mining operations near Derby. Kimberley Diamond Company began mining and marketing operations in 2002. The company’s resource statement as at 30 June 2005 indicates a total global resource of 5 Mct across three sites called Ellendale 9, Ellendale 4 and Ellendale 4 Satellite. Ellendale 9, the first stage of Kimberley Diamond’s Ellendale mine, reached full production in 2004. The operation at Ellendale 9 comprises two processing plants and associated infrastructure.
Production from Ellendale 9 reached 123 334 ct with diamond sales of 135 372 ct from Ellendale 9 and Ellendale 4 in 2004-05. According to the company, Ellendale 9 is the world’s most prolific producer of fancy yellow goods. The Ellendale 4 diamonds were extracted from the top surface material above the main ore body of the pipe as part of the company’s preparations to begin mining at Ellendale 4. The establishment of a second mining and production centre at Ellendale 4 is expected to increase the Kimberley Diamond Company’s annual production to 700 000 ct.
The GL Survey states that diamond exploration declined 8 per cent in Western Australia. The fall was attributed largely to reduced resource-reserve drilling activities at Argyle. Kimberley Diamond Company’s annual report for 2004-05 outlined an exploration program that included Ellendale 7, Ellendale 11, Terrace 5 as well as additional regional exploration.
Helix Resources Limited reported in its September Quarterly Report 2005 that:
“…reconnaissance and surface sampling [by DeBeers Australia Exploration] resulted in the discovery of two kimberlites, Blacktop and Clurrie in 2004. In a follow–up survey, three micro-diamonds were recovered from a rock chip containing weathered kimberlite from the Blacktop area. The discovery is immediately adjacent to DeBeers Australia Exploration’s Balmoral Project tenements where a 32.8 t bulk sample produced 89 macro diamonds totalling 4.17 carats (-8.0 + 1.0 mm fraction) from the Blacktop and sill complex. A further 46 diamonds totalling 1.1 carats were also found in the tailings re-treatment audit of the bulk sample…” The Blacktop and Clurrie kimberlites are located in the Pilbara, south of Dampier.
Diamond basicsDiamond is composed of carbon and is the hardest known natural substance. Its hardness and high light dispersion make it useful for industrial applications and jewellery. Diamonds are contained in manufactured items such as stone cutters, stone polishers and computer chips.
4.8 Base Metals (copper, lead and zinc)Overview of Western Australian productionThe overall value of Western Australia’s base metals production (copper, lead and zinc) increased slightly to $255 million from $246 million in the previous financial year. The rise was due, in part, to the recommencement of copper mining at Telfer, offsetting declines in lead and zinc caused by the closure of the Lennard Shelf mine in early 2004.
Copper accounted for 83 per cent of total base metal sales, while zinc accounted for 17 per cent and lead sales less than 1 per cent. Western Australia produces three copper products; copper cathode, copper concentrates and copper by-product. The quantity of copper sold on a ‘contained copper basis’ increased by 13 per cent to 60 467 t compared with 53 289 t in 2003–04. The average price received increased by around A$553/t of contained copper to A$3 477, helping to lift the total value of sales by 35 per cent to $210 million.
The quantity of zinc sold in Western Australia fell by over half to 46 530 t compared with the 108 042 t in the previous financial year. The value of zinc sold fell substantially by 45 per cent from $80 million in 2003–04 to $44 million in 2004–05.
Overall, Western Australia is a small base metals producer. According to Geoscience Australia, Australia ranks first in the world for lead production at 700 000 t/a. This contrasts with Western Australia, which accounts for just 0.4 per cent of Australia’s current production. Similarly, Western Australia’s 2004–05 copper production at 60 500 t accounts for 0.4 per cent of ABARE’s estimate of world copper mine production. Western Australia is also a relatively small zinc producer, accounting for 46 000 t of zinc against ABARE’s 2005 world zinc mine production estimate of 9.8 Mt.

Western Australian Mineral and Petroleum Statistics Digest 2004–05 23
2004 - 05 Resource Industry Analysis
Base metals prices trended substantially higher during 2004-05. Copper prices increased by an average 35 per cent in US dollar terms, reaching an average US$3 150/t. According to ABARE, a strong increase in Chinese copper consumption was offset by declines in the US, Japan and the European Union. Consumers reportedly delayed purchases because of high copper prices. On the supply side, world copper production increased by 3.2 per cent, with the increase largely attributed to the US and Indonesia. Significant increases in Indonesian output were offset by declines in Chilean production.
US dollar–denominated lead prices began a trend increase during 2003–04, increasing by 57 per cent. This recovery has continued into 2004–05 increasing a further 38 per cent to a high of US$964/t, or A$1 284/t up 32 per cent when converted to Australian dollars. Fundamentals behind this reflected strong demand for electrical battery storage and under-investment in mine production. With demand for lead continuing to rise strongly, it left the market in its worst deficit position since 1973, according to the London-based International Lead and Zinc Study Group (ILZSG). The industry organisation reported that demand exceeded supply by 236 000 t in 2004 and while production in China was up sharply, it was insufficient to offset production falls in Australia and the US.
The average LME price of zinc for 2004-05 increased by 22 per cent to US$1 171/t and by 16 per cent to A$1 554/t. Zinc prices increased during 2004 principally due to strong Chinese demand and relatively good OECD economic growth.
Western Australia’s principal base metals suppliers include the Birla Nifty copper mine, Newcrest Mining Limited and Oxiana. The Aditya Birla Group, one of India’s largest business houses, owns and operates the Birla Nifty copper mine, located in the Pilbara about 300 km southeast of Port Hedland. Birla Nifty currently has a capacity of 25 000 t of copper cathodes and a large undeveloped copper sulphide resource estimated at 1.9 Mt of copper equivalent.
Newcrest Mining Limited operates the Telfer mine, located in the Pilbara approximately 450 km southeast of Port Hedland. Known as one of the world’s top ten gold deposits, the Telfer mine also produces copper. Telfer commissioned two processing trains in November 2004 and February 2005. The commissioning follows a redevelopment of the mining operations following the suspension of production in August 2000. Annual copper production capacity is estimated at 30 000 t.
Oxiana Limited acquired Newmont Mining’s Golden Grove mining operation in July 2005. Located in the Mid West, approximately 280 km east of Geraldton, the Golden Grove mine produces zinc, copper, lead, gold and silver in concentrates. Oxiana estimates the mine’s life at seven years. Between 2001 and 2004, Golden grove produced an annual average of 55,240 t of zinc, 25 070 t of copper, 1.3 Mt of silver and 15 476 oz of gold.
Since the closure of the Lennard Shelf zinc mine, the originating regions for base metals has contracted to the
Mid West and the Pilbara. The Pilbara is currently the largest copper–producing region. The Mid West is the only region currently producing lead and zinc. Of particular importance for the Mid West is the Magellan lead mine being developed by Ivernia and officially opened in September 2005. Ivernia, an international base metals mining and exploration company, reported that the mine’s life is estimated at 10 years based on current proven and probable reserves and latest production plans. Substantial inferred resources and exploration opportunities exist to extend mine life. The mine is anticipated to produce some 100 000 t/a of lead in concentrate by 2007.
4.9 Other MineralsCoalAll of Western Australia’s coal supplies are sold domestically to Western Power or large local energy users, mainly in the mineral-processing sector. The production of coal rose 4 per cent to 6.2 Mt, but the value of sales fell by 2 per cent to $270 million.
The Griffin Group is progressing plans for a coal-fired power station in conjunction with the proposed Coolangatta industrial estate in Collie. Griffin plans to finalise construction of the Bluewaters Power Station by late 2006. Griffin also announced plans for the expansion of the Ewington mine at Collie with reserves of 80 Mt and opening up the Chicken Creek-3 deposit to supplement supply from the Muja mine, which is fully dedicated to the Muja power station.
Wesfarmers Premier Coal is the larger of the two coal producers based at Collie, and recently won contracts to increase its sales to Western Power.
Coal comprises some 16 per cent of Western Australia’s primary energy consumption. This percentage will fall as the Government has decided, following a process of open tender, that the next base–load power station will be fired by gas.
CobaltWorld cobalt prices fell back some 3.5 per cent in 2004–05 to US$44 728/t (US$20/lb) and 6 per cent when converted to Australian dollars to A$60 045/t. While price–falls for cobalt metal were reflected in prices for associated cobalt products, these make up about one-third of the value of cobalt production in Western Australia. Cobalt metal prices have been driven by strong demand, particularly from China and despite the slight weakening are at relatively high historical levels.
The buoyant demand and strong prices for cobalt metal were offset by reduced production of metal and reduced prices for other cobalt products. The result was that the total of all Western Australian cobalt sales fell from $213 million to $204 million for the year to June 2005.
Analysts do not expect that the high prices for cobalt metal can be sustained if the production increases associated with nickel production continue. The driving force behind the price increases has been global economic growth and while continuing for longer than originally expected, is still expected
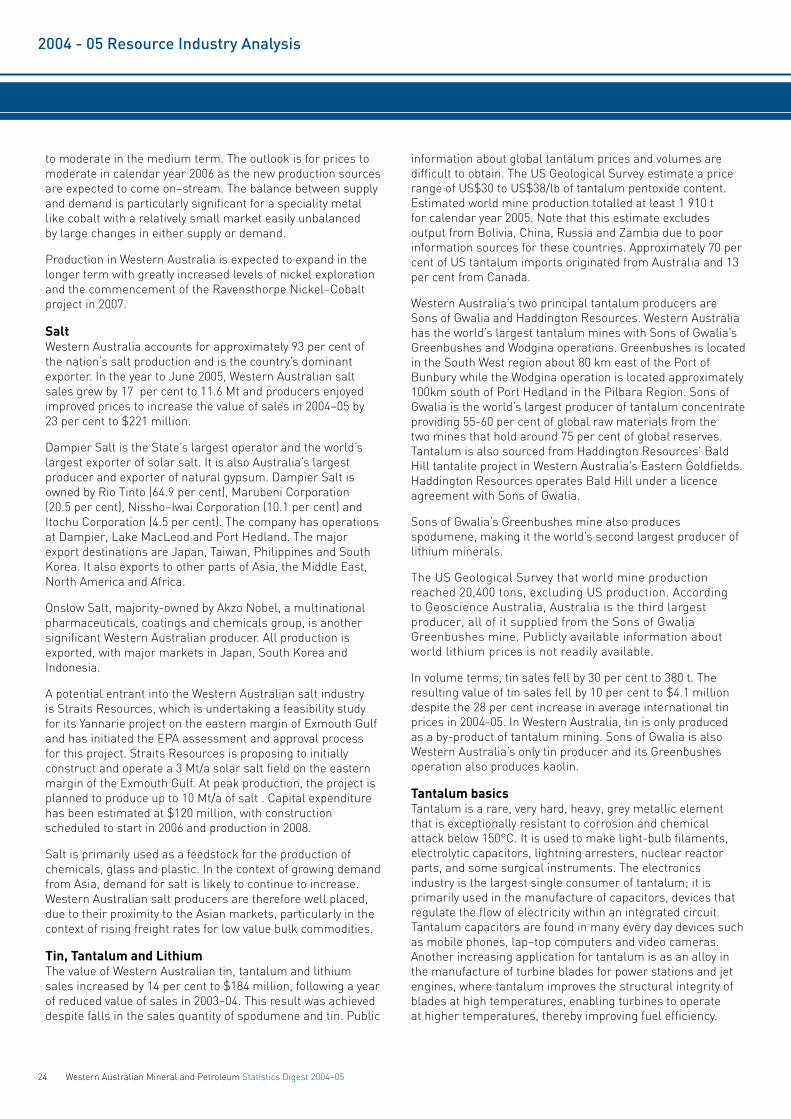
24 Western Australian Mineral and Petroleum Statistics Digest 2004–05
2004 - 05 Resource Industry Analysis
to moderate in the medium term. The outlook is for prices to moderate in calendar year 2006 as the new production sources are expected to come on–stream. The balance between supply and demand is particularly significant for a speciality metal like cobalt with a relatively small market easily unbalanced by large changes in either supply or demand.
Production in Western Australia is expected to expand in the longer term with greatly increased levels of nickel exploration and the commencement of the Ravensthorpe Nickel–Cobalt project in 2007.
SaltWestern Australia accounts for approximately 93 per cent of the nation’s salt production and is the country’s dominant exporter. In the year to June 2005, Western Australian salt sales grew by 17 per cent to 11.6 Mt and producers enjoyed improved prices to increase the value of sales in 2004–05 by 23 per cent to $221 million.
Dampier Salt is the State’s largest operator and the world’s largest exporter of solar salt. It is also Australia’s largest producer and exporter of natural gypsum. Dampier Salt is owned by Rio Tinto (64.9 per cent), Marubeni Corporation (20.5 per cent), Nissho–Iwai Corporation (10.1 per cent) and Itochu Corporation (4.5 per cent). The company has operations at Dampier, Lake MacLeod and Port Hedland. The major export destinations are Japan, Taiwan, Philippines and South Korea. It also exports to other parts of Asia, the Middle East, North America and Africa.
Onslow Salt, majority-owned by Akzo Nobel, a multinational pharmaceuticals, coatings and chemicals group, is another significant Western Australian producer. All production is exported, with major markets in Japan, South Korea and Indonesia.
A potential entrant into the Western Australian salt industry is Straits Resources, which is undertaking a feasibility study for its Yannarie project on the eastern margin of Exmouth Gulf and has initiated the EPA assessment and approval process for this project. Straits Resources is proposing to initially construct and operate a 3 Mt/a solar salt field on the eastern margin of the Exmouth Gulf. At peak production, the project is planned to produce up to 10 Mt/a of salt . Capital expenditure has been estimated at $120 million, with construction scheduled to start in 2006 and production in 2008.
Salt is primarily used as a feedstock for the production of chemicals, glass and plastic. In the context of growing demand from Asia, demand for salt is likely to continue to increase. Western Australian salt producers are therefore well placed, due to their proximity to the Asian markets, particularly in the context of rising freight rates for low value bulk commodities.
Tin, Tantalum and LithiumThe value of Western Australian tin, tantalum and lithium sales increased by 14 per cent to $184 million, following a year of reduced value of sales in 2003–04. This result was achieved despite falls in the sales quantity of spodumene and tin. Public
information about global tantalum prices and volumes are difficult to obtain. The US Geological Survey estimate a price range of US$30 to US$38/lb of tantalum pentoxide content. Estimated world mine production totalled at least 1 910 t for calendar year 2005. Note that this estimate excludes output from Bolivia, China, Russia and Zambia due to poor information sources for these countries. Approximately 70 per cent of US tantalum imports originated from Australia and 13 per cent from Canada.
Western Australia’s two principal tantalum producers are Sons of Gwalia and Haddington Resources. Western Australia has the world’s largest tantalum mines with Sons of Gwalia’s Greenbushes and Wodgina operations. Greenbushes is located in the South West region about 80 km east of the Port of Bunbury while the Wodgina operation is located approximately 100km south of Port Hedland in the Pilbara Region. Sons of Gwalia is the world’s largest producer of tantalum concentrate providing 55-60 per cent of global raw materials from the two mines that hold around 75 per cent of global reserves. Tantalum is also sourced from Haddington Resources’ Bald Hill tantalite project in Western Australia’s Eastern Goldfields. Haddington Resources operates Bald Hill under a licence agreement with Sons of Gwalia.
Sons of Gwalia’s Greenbushes mine also produces spodumene, making it the world’s second largest producer of lithium minerals.
The US Geological Survey that world mine production reached 20,400 tons, excluding US production. According to Geoscience Australia, Australia is the third largest producer, all of it supplied from the Sons of Gwalia Greenbushes mine. Publicly available information about world lithium prices is not readily available.
In volume terms, tin sales fell by 30 per cent to 380 t. The resulting value of tin sales fell by 10 per cent to $4.1 million despite the 28 per cent increase in average international tin prices in 2004-05. In Western Australia, tin is only produced as a by-product of tantalum mining. Sons of Gwalia is also Western Australia’s only tin producer and its Greenbushes operation also produces kaolin.
Tantalum basicsTantalum is a rare, very hard, heavy, grey metallic element that is exceptionally resistant to corrosion and chemical attack below 150°C. It is used to make light-bulb filaments, electrolytic capacitors, lightning arresters, nuclear reactor parts, and some surgical instruments. The electronics industry is the largest single consumer of tantalum; it is primarily used in the manufacture of capacitors, devices that regulate the flow of electricity within an integrated circuit. Tantalum capacitors are found in many every day devices such as mobile phones, lap–top computers and video cameras. Another increasing application for tantalum is as an alloy in the manufacture of turbine blades for power stations and jet engines, where tantalum improves the structural integrity of blades at high temperatures, enabling turbines to operate at higher temperatures, thereby improving fuel efficiency.

Western Australian Mineral and Petroleum Statistics Digest 2004–05 25
2004 - 05 Resource Industry Analysis
Tantalum is obtained from tantalite, a mineral consisting of tantalum oxide of iron and manganese that occurs with niobite or in coarse granite.
According to the Tantalum-Niobium International Study Centre, tantalum ores are found primarily in Australia, Canada, Brazil and central Africa, with some additional quantities originating in South–east Asia and in China.
ManganeseMost manganese is used in steel making and hence China now accounts for 40 per cent of the world’s manganese consumption. In 2004-05, Western Australia’s manganese sales remained steady at 585 454 t and a strong lift in prices of some 40 per cent caused the value of sales to increase by the same percentage to $115 million for the same period. A 63 per cent increase in the benchmark price for manganese was announced during the March 2005 quarter and will further boost sales values into 2005-06.
Consolidated Minerals’ Woodie Woodie project in the Pilbara is Western Australia’s sole manganese producer and represents 5 per cent of the world’s high-grade exports. The operation is also one of only two manganese mines in Australia, with a third under construction in the Northern Territory. In response to buoyant prices and strong Chinese demand, Consolidated Minerals has completed the commissioning of the upgraded processing plant at Woodie Woodie. The new long–term production level will be 1 Mt/a and a new crushing circuit will be commissioned in October 2005 which is expected to enhance the performance of the processing plant.
It is estimated that Australia is the third-largest producer of manganese after China and South Africa.
Figure 38 Selected WA Commodities relative to world production ending 2004 by quantitySources: DoIR, ABARE and USGS
0 10 20 30 40 50 60 70 80 90 100
Zircon
Tantalum
Salt
Rutile
Nickel
LNG
Iron ore
Ilmenite
Gold
Diamonds
Alumina
Western Australia Rest of Australia Rest of World
The latest comparable data show that the Western Australian share (by quantity) of the world's output of the following products was: alumina 17%, gold 7%, ilmenite 19%, iron ore 17%, LNG (sea−borne trade) 7%, nickel 15%, rutile 27%, salt 5%, tantalum 55%, zircon 36% and 14% of diamonds (mainly industrial grade).
Per cent
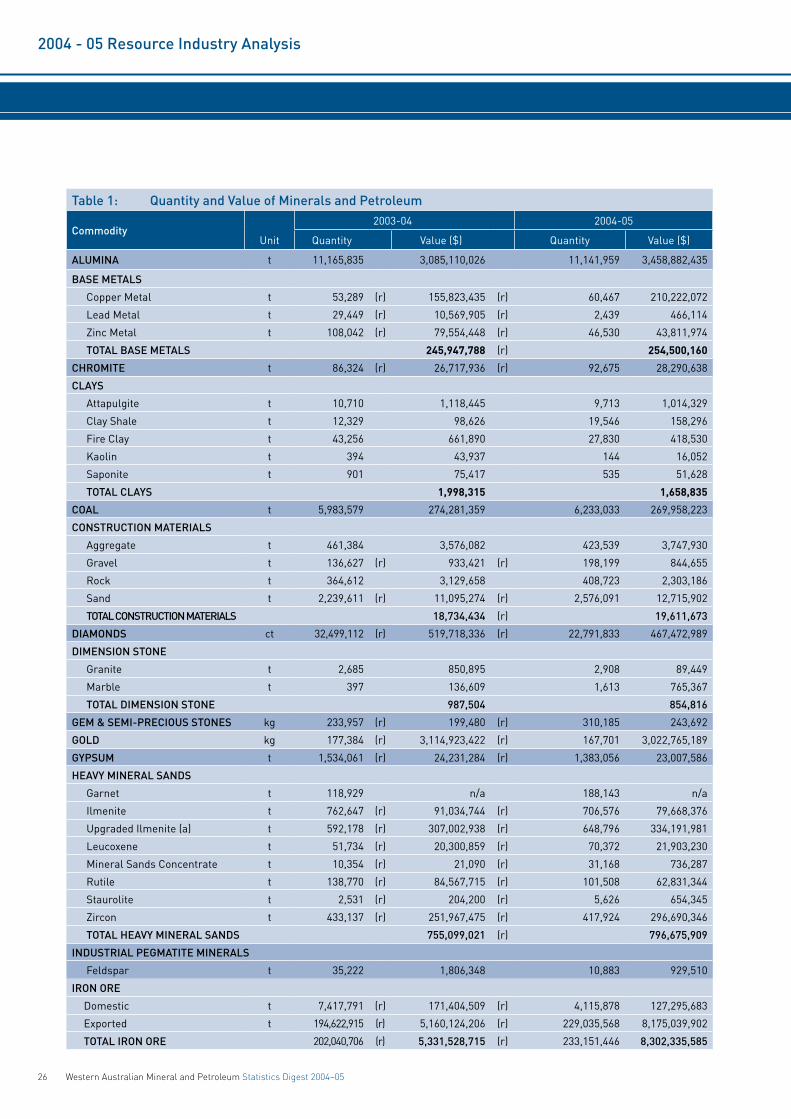
26 Western Australian Mineral and Petroleum Statistics Digest 2004–05
2004 - 05 Resource Industry Analysis
Table 1: Quantity and Value of Minerals and Petroleum
Commodity2003-04 2004-05
Unit Quantity Value ($) Quantity Value ($)
ALUMINA t 11,165,835 3,085,110,026 11,141,959 3,458,882,435
BASE METALS
Copper Metal t 53,289 (r) 155,823,435 (r) 60,467 210,222,072
Lead Metal t 29,449 (r) 10,569,905 (r) 2,439 466,114
Zinc Metal t 108,042 (r) 79,554,448 (r) 46,530 43,811,974
TOTAL BASE METALS 245,947,788 (r) 254,500,160
CHROMITE t 86,324 (r) 26,717,936 (r) 92,675 28,290,638
CLAYS
Attapulgite t 10,710 1,118,445 9,713 1,014,329
Clay Shale t 12,329 98,626 19,546 158,296
Fire Clay t 43,256 661,890 27,830 418,530
Kaolin t 394 43,937 144 16,052
Saponite t 901 75,417 535 51,628
TOTAL CLAYS 1,998,315 1,658,835
COAL t 5,983,579 274,281,359 6,233,033 269,958,223
CONSTRUCTION MATERIALS
Aggregate t 461,384 3,576,082 423,539 3,747,930
Gravel t 136,627 (r) 933,421 (r) 198,199 844,655
Rock t 364,612 3,129,658 408,723 2,303,186
Sand t 2,239,611 (r) 11,095,274 (r) 2,576,091 12,715,902
TOTAL CONSTRUCTION MATERIALS 18,734,434 (r) 19,611,673
DIAMONDS ct 32,499,112 (r) 519,718,336 (r) 22,791,833 467,472,989
DIMENSION STONE
Granite t 2,685 850,895 2,908 89,449
Marble t 397 136,609 1,613 765,367
TOTAL DIMENSION STONE 987,504 854,816
GEM & SEMI-PRECIOUS STONES kg 233,957 (r) 199,480 (r) 310,185 243,692
GOLD kg 177,384 (r) 3,114,923,422 (r) 167,701 3,022,765,189
GYPSUM t 1,534,061 (r) 24,231,284 (r) 1,383,056 23,007,586
HEAVY MINERAL SANDS
Garnet t 118,929 n/a 188,143 n/a
Ilmenite t 762,647 (r) 91,034,744 (r) 706,576 79,668,376
Upgraded Ilmenite (a) t 592,178 (r) 307,002,938 (r) 648,796 334,191,981
Leucoxene t 51,734 (r) 20,300,859 (r) 70,372 21,903,230
Mineral Sands Concentrate t 10,354 (r) 21,090 (r) 31,168 736,287
Rutile t 138,770 (r) 84,567,715 (r) 101,508 62,831,344
Staurolite t 2,531 (r) 204,200 (r) 5,626 654,345
Zircon t 433,137 (r) 251,967,475 (r) 417,924 296,690,346
TOTAL HEAVY MINERAL SANDS 755,099,021 (r) 796,675,909
INDUSTRIAL PEGMATITE MINERALS
Feldspar t 35,222 1,806,348 10,883 929,510
IRON ORE
Domestic t 7,417,791 (r) 171,404,509 (r) 4,115,878 127,295,683
Exported t 194,622,915 (r) 5,160,124,206 (r) 229,035,568 8,175,039,902
TOTAL IRON ORE 202,040,706 (r) 5,331,528,715 (r) 233,151,446 8,302,335,585
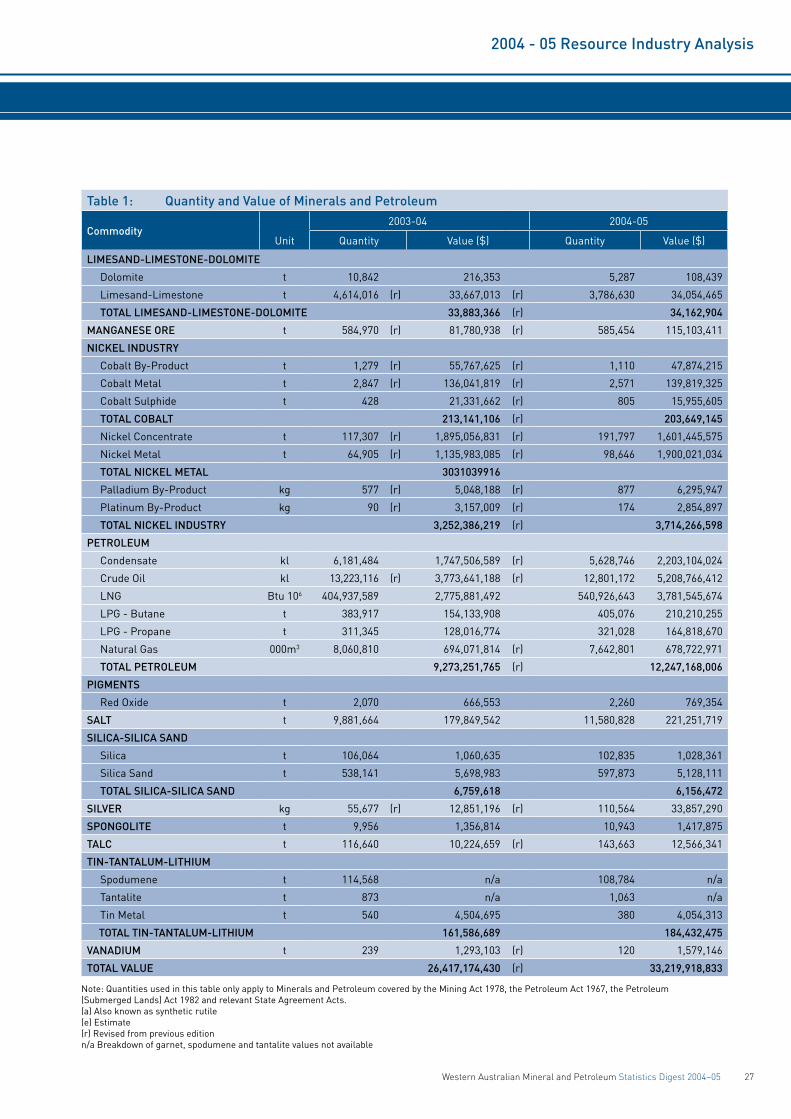
Western Australian Mineral and Petroleum Statistics Digest 2004–05 27
2004 - 05 Resource Industry Analysis
Table 1: Quantity and Value of Minerals and Petroleum
Commodity2003-04 2004-05
Unit Quantity Value ($) Quantity Value ($)
LIMESAND-LIMESTONE-DOLOMITE
Dolomite t 10,842 216,353 5,287 108,439
Limesand-Limestone t 4,614,016 (r) 33,667,013 (r) 3,786,630 34,054,465
TOTAL LIMESAND-LIMESTONE-DOLOMITE 33,883,366 (r) 34,162,904
MANGANESE ORE t 584,970 (r) 81,780,938 (r) 585,454 115,103,411
NICKEL INDUSTRY
Cobalt By-Product t 1,279 (r) 55,767,625 (r) 1,110 47,874,215
Cobalt Metal t 2,847 (r) 136,041,819 (r) 2,571 139,819,325
Cobalt Sulphide t 428 21,331,662 (r) 805 15,955,605
TOTAL COBALT 213,141,106 (r) 203,649,145
Nickel Concentrate t 117,307 (r) 1,895,056,831 (r) 191,797 1,601,445,575
Nickel Metal t 64,905 (r) 1,135,983,085 (r) 98,646 1,900,021,034
TOTAL NICKEL METAL 3031039916
Palladium By-Product kg 577 (r) 5,048,188 (r) 877 6,295,947
Platinum By-Product kg 90 (r) 3,157,009 (r) 174 2,854,897
TOTAL NICKEL INDUSTRY 3,252,386,219 (r) 3,714,266,598
PETROLEUM
Condensate kl 6,181,484 1,747,506,589 (r) 5,628,746 2,203,104,024
Crude Oil kl 13,223,116 (r) 3,773,641,188 (r) 12,801,172 5,208,766,412
LNG Btu 106 404,937,589 2,775,881,492 540,926,643 3,781,545,674
LPG - Butane t 383,917 154,133,908 405,076 210,210,255
LPG - Propane t 311,345 128,016,774 321,028 164,818,670
Natural Gas 000m3 8,060,810 694,071,814 (r) 7,642,801 678,722,971
TOTAL PETROLEUM 9,273,251,765 (r) 12,247,168,006
PIGMENTS
Red Oxide t 2,070 666,553 2,260 769,354
SALT t 9,881,664 179,849,542 11,580,828 221,251,719
SILICA-SILICA SAND
Silica t 106,064 1,060,635 102,835 1,028,361
Silica Sand t 538,141 5,698,983 597,873 5,128,111
TOTAL SILICA-SILICA SAND 6,759,618 6,156,472
SILVER kg 55,677 (r) 12,851,196 (r) 110,564 33,857,290
SPONGOLITE t 9,956 1,356,814 10,943 1,417,875
TALC t 116,640 10,224,659 (r) 143,663 12,566,341
TIN-TANTALUM-LITHIUM
Spodumene t 114,568 n/a 108,784 n/a
Tantalite t 873 n/a 1,063 n/a
Tin Metal t 540 4,504,695 380 4,054,313
TOTAL TIN-TANTALUM-LITHIUM 161,586,689 184,432,475
VANADIUM t 239 1,293,103 (r) 120 1,579,146
TOTAL VALUE 26,417,174,430 (r) 33,219,918,833
Note: Quantities used in this table only apply to Minerals and Petroleum covered by the Mining Act 1978, the Petroleum Act 1967, the Petroleum (Submerged Lands) Act 1982 and relevant State Agreement Acts. (a) Also known as synthetic rutile (e) Estimate (r) Revised from previous edition n/a Breakdown of garnet, spodumene and tantalite values not available

28 Western Australian Mineral and Petroleum Statistics Digest 2004–05
Table 2: Quantity and Value of Selected Major Commodities1995-96 1996-97 1997-98 1998-99 1999-00 2000-01 2001-02 2002-03 2003-04 2004-05
Unit Quantity Value $M Quantity Value $M Quantity Value $M Quantity Value $M Quantity Value $M Quantity Value $M Quantity Value $M Quantity Value $M Quantity Value $M Quantity Value $M
ALUMINA Mt 8.23 1,918.34 8.35 1,955.77 8.51 2,260.54 8.86 2,367.03 9.35 2,657.89 10.48 3,600.67 10.86 3,584.38 11.13 3,204.65 11.17 3,085.11 11.14 3,458.88
BASE METALS
Copper Metal kt 23.69 65.42 27.73 58.98 29.43 61.12 24.44 43.71 30.73 64.62 42.62 111.12 53.50 122.57 59.45 138.78 53.29 155.82 60.47 210.22
Lead Metal kt 21.28 12.64 13.49 6.09 27.00 10.45 51.55 17.25 64.47 20.24 82.33 37.31 75.08 36.72 70.02 31.85 29.45 10.57 2.44 0.47
Zinc Metal kt 113.49 75.32 88.37 75.12 124.00 117.11 194.90 170.73 232.59 251.01 236.01 280.24 223.67 173.82 206.45 173.19 108.04 79.55 46.53 43.81
TOTAL BASE METALS 153.39 140.19 188.68 231.69 335.87 428.67 333.11 343.82 245.95 254.50
COAL Mt 5.90 270.36 5.56 257.30 5.71 257.28 5.80 256.74 6.50 271.53 6.10 252.28 6.16 258.13 6.32 272.89 5.98 274.28 6.23 269.96
COBALT kt 0.87 66.69 0.88 50.85 1.50 81.78 1.09 55.27 2.07 86.26 4.19 174.38 4.43 127.36 4.92 124.18 4.55 213.14 4.49 203.65
DIAMONDS M ct 33.52 525.21 52.52 395.79 42.48 537.87 51.23 610.44 50.98 703.67 25.42 614.45 25.69 489.34 38.89 773.32 32.50 519.72 22.79 467.47
GOLD t 205.89 3,404.65 228.02 3,409.61 239.46 3,468.95 219.26 3,219.52 204.96 2,951.26 201.21 3,245.06 185.00 3,279.50 187.47 3,445.34 177.01 3,109.56 167.70 3,022.77
HEAVY MINERAL SANDS
Ilmenite Mt 1.10 111.18 1.10 117.28 1.31 149.14 1.32 158.59 1.16 151.66 1.10 168.75 0.80 128.75 0.96 136.51 0.76 91.03 0.71 79.67
Rutile kt 119.14 75.06 110.96 77.74 104.13 78.58 119.71 90.97 98.49 72.78 127.21 110.04 122.61 106.74 113.57 82.53 138.77 84.57 101.51 62.83
Upgraded Ilmenite
(Synthetic Rutile)
kt 517.00 252.56 545.00 270.48 688.00 355.79 475.54 275.23 552.51 324.65 643.27 409.19 585.91 380.21 597.27 353.10 592.18 307.00 648.80 334.19
Zircon kt 410.03 181.21 324.09 177.99 321.38 169.13 284.53 136.07 348.11 153.27 343.08 198.84 317.77 218.84 411.15 255.81 433.14 251.97 417.92 296.69
Other HMS 18.50 26.51 24.63 19.44 28.85 18.08 19.78 16.86 20.53 23.29
TOTAL HEAVY MINERAL SANDS 638.51 670.00 777.27 680.30 731.20 904.90 854.32 844.81 755.01 796.68
IRON ORE Mt 132.90 2,924.06 141.29 3,159.65 149.74 3,930.77 141.03 3,898.53 151.16 3,722.12 161.77 4,912.70 164.63 5,207.61 188.52 5,205.27 202.04 5,331.53 233.15 8,302.34
MANGANESE ORE kt 347.04 41.34 324.11 37.62 86.30 9.39 27.40 3.42 212.38 25.68 401.36 58.50 474.27 68.62 619.65 75.38 584.97 81.78 585.45 115.10
NICKEL kt 103.30 1,097.30 114.10 1,051.11 135.19 1,146.64 125.77 876.62 143.93 1,806.29 167.45 2,238.74 179.46 2,002.07 191.89 2,482.47 182.21 3,031.04 290.44 3,501.47
PETROLEUM
Condensate Gl 4.65 685.74 5.73 943.15 6.76 1,065.84 5.55 743.91 6.35 1,583.94 5.81 1,984.53 6.33 1,680.03 6.93 2,046.37 6.18 1,747.51 5.63 2,203.10
Crude oil Gl 9.65 1,535.67 10.47 1,915.93 9.85 1,567.16 9.16 1,189.64 12.05 3,144.77 13.96 4,792.05 15.09 4,198.78 14.00 4,258.12 13.22 3,773.64 12.80 5,208.77
LNG Btu 1012 379.79 1,350.92 370.50 1,528.77 379.54 1,591.94 391.90 1,434.42 393.61 1,971.06 429.54 2,695.53 386.08 2,970.61 403.83 3,130.83 404.94 2,775.88 540.93 3,781.55
LPG - Butane kt 100.24 22.71 209.69 59.67 376.09 90.47 388.69 90.62 443.58 190.90 428.90 221.97 482.20 193.71 460.47 221.47 383.92 154.13 405.08 210.21
LPG - Propane kt 87.02 19.73 185.74 55.66 263.26 61.26 259.21 57.63 334.57 145.94 333.47 187.54 374.32 167.87 346.60 172.39 311.35 128.02 321.03 164.82
Natural Gas Gm3 6.31 454.76 6.89 534.65 6.88 557.47 6.44 549.83 6.55 578.76 7.63 630.36 7.53 643.28 8.12 661.92 8.06 694.07 7.64 678.72
TOTAL PETROLEUM 4,069.53 5,037.83 4,934.14 4,066.65 7,615.37 10,511.98 9,854.28 10,491.10 9,273.25 12,247.17
SALT Mt 7.45 154.22 7.55 153.62 8.19 188.70 8.57 199.64 8.81 208.58 8.30 233.08 8.60 227.95 9.61 227.95 9.88 179.85 11.58 221.25
OTHER 125.75 141.33 153.07 189.73 229.26 371.67 409.47 366.48 316.87 358.59
TOTAL 15,389.35 16,460.67 17,935.08 16,655.58 21,344.98 27,547.08 26,696.14 27,857.66 26,417.17 33,219.92

Western Australian Mineral and Petroleum Statistics Digest 2004–05 29
Table 2: Quantity and Value of Selected Major Commodities1995-96 1996-97 1997-98 1998-99 1999-00 2000-01 2001-02 2002-03 2003-04 2004-05
Unit Quantity Value $M Quantity Value $M Quantity Value $M Quantity Value $M Quantity Value $M Quantity Value $M Quantity Value $M Quantity Value $M Quantity Value $M Quantity Value $M
ALUMINA Mt 8.23 1,918.34 8.35 1,955.77 8.51 2,260.54 8.86 2,367.03 9.35 2,657.89 10.48 3,600.67 10.86 3,584.38 11.13 3,204.65 11.17 3,085.11 11.14 3,458.88
BASE METALS
Copper Metal kt 23.69 65.42 27.73 58.98 29.43 61.12 24.44 43.71 30.73 64.62 42.62 111.12 53.50 122.57 59.45 138.78 53.29 155.82 60.47 210.22
Lead Metal kt 21.28 12.64 13.49 6.09 27.00 10.45 51.55 17.25 64.47 20.24 82.33 37.31 75.08 36.72 70.02 31.85 29.45 10.57 2.44 0.47
Zinc Metal kt 113.49 75.32 88.37 75.12 124.00 117.11 194.90 170.73 232.59 251.01 236.01 280.24 223.67 173.82 206.45 173.19 108.04 79.55 46.53 43.81
TOTAL BASE METALS 153.39 140.19 188.68 231.69 335.87 428.67 333.11 343.82 245.95 254.50
COAL Mt 5.90 270.36 5.56 257.30 5.71 257.28 5.80 256.74 6.50 271.53 6.10 252.28 6.16 258.13 6.32 272.89 5.98 274.28 6.23 269.96
COBALT kt 0.87 66.69 0.88 50.85 1.50 81.78 1.09 55.27 2.07 86.26 4.19 174.38 4.43 127.36 4.92 124.18 4.55 213.14 4.49 203.65
DIAMONDS M ct 33.52 525.21 52.52 395.79 42.48 537.87 51.23 610.44 50.98 703.67 25.42 614.45 25.69 489.34 38.89 773.32 32.50 519.72 22.79 467.47
GOLD t 205.89 3,404.65 228.02 3,409.61 239.46 3,468.95 219.26 3,219.52 204.96 2,951.26 201.21 3,245.06 185.00 3,279.50 187.47 3,445.34 177.01 3,109.56 167.70 3,022.77
HEAVY MINERAL SANDS
Ilmenite Mt 1.10 111.18 1.10 117.28 1.31 149.14 1.32 158.59 1.16 151.66 1.10 168.75 0.80 128.75 0.96 136.51 0.76 91.03 0.71 79.67
Rutile kt 119.14 75.06 110.96 77.74 104.13 78.58 119.71 90.97 98.49 72.78 127.21 110.04 122.61 106.74 113.57 82.53 138.77 84.57 101.51 62.83
Upgraded Ilmenite
(Synthetic Rutile)
kt 517.00 252.56 545.00 270.48 688.00 355.79 475.54 275.23 552.51 324.65 643.27 409.19 585.91 380.21 597.27 353.10 592.18 307.00 648.80 334.19
Zircon kt 410.03 181.21 324.09 177.99 321.38 169.13 284.53 136.07 348.11 153.27 343.08 198.84 317.77 218.84 411.15 255.81 433.14 251.97 417.92 296.69
Other HMS 18.50 26.51 24.63 19.44 28.85 18.08 19.78 16.86 20.53 23.29
TOTAL HEAVY MINERAL SANDS 638.51 670.00 777.27 680.30 731.20 904.90 854.32 844.81 755.01 796.68
IRON ORE Mt 132.90 2,924.06 141.29 3,159.65 149.74 3,930.77 141.03 3,898.53 151.16 3,722.12 161.77 4,912.70 164.63 5,207.61 188.52 5,205.27 202.04 5,331.53 233.15 8,302.34
MANGANESE ORE kt 347.04 41.34 324.11 37.62 86.30 9.39 27.40 3.42 212.38 25.68 401.36 58.50 474.27 68.62 619.65 75.38 584.97 81.78 585.45 115.10
NICKEL kt 103.30 1,097.30 114.10 1,051.11 135.19 1,146.64 125.77 876.62 143.93 1,806.29 167.45 2,238.74 179.46 2,002.07 191.89 2,482.47 182.21 3,031.04 290.44 3,501.47
PETROLEUM
Condensate Gl 4.65 685.74 5.73 943.15 6.76 1,065.84 5.55 743.91 6.35 1,583.94 5.81 1,984.53 6.33 1,680.03 6.93 2,046.37 6.18 1,747.51 5.63 2,203.10
Crude oil Gl 9.65 1,535.67 10.47 1,915.93 9.85 1,567.16 9.16 1,189.64 12.05 3,144.77 13.96 4,792.05 15.09 4,198.78 14.00 4,258.12 13.22 3,773.64 12.80 5,208.77
LNG Btu 1012 379.79 1,350.92 370.50 1,528.77 379.54 1,591.94 391.90 1,434.42 393.61 1,971.06 429.54 2,695.53 386.08 2,970.61 403.83 3,130.83 404.94 2,775.88 540.93 3,781.55
LPG - Butane kt 100.24 22.71 209.69 59.67 376.09 90.47 388.69 90.62 443.58 190.90 428.90 221.97 482.20 193.71 460.47 221.47 383.92 154.13 405.08 210.21
LPG - Propane kt 87.02 19.73 185.74 55.66 263.26 61.26 259.21 57.63 334.57 145.94 333.47 187.54 374.32 167.87 346.60 172.39 311.35 128.02 321.03 164.82
Natural Gas Gm3 6.31 454.76 6.89 534.65 6.88 557.47 6.44 549.83 6.55 578.76 7.63 630.36 7.53 643.28 8.12 661.92 8.06 694.07 7.64 678.72
TOTAL PETROLEUM 4,069.53 5,037.83 4,934.14 4,066.65 7,615.37 10,511.98 9,854.28 10,491.10 9,273.25 12,247.17
SALT Mt 7.45 154.22 7.55 153.62 8.19 188.70 8.57 199.64 8.81 208.58 8.30 233.08 8.60 227.95 9.61 227.95 9.88 179.85 11.58 221.25
OTHER 125.75 141.33 153.07 189.73 229.26 371.67 409.47 366.48 316.87 358.59
TOTAL 15,389.35 16,460.67 17,935.08 16,655.58 21,344.98 27,547.08 26,696.14 27,857.66 26,417.17 33,219.92

30 Western Australian Mineral and Petroleum Statistics Digest 2004–05
Table 3: Quantity and Value of Commodity by Local Government Area Financial Year 2004-05
Commodity Local gov’t authorityQuantity
(Tonnes)Content
Value
($)
ALUMINA Boddington 3,290,539 971,572,684
Murray 5,525,873 1,751,219,948
Waroona 2,325,547 736,089,803
TOTAL ALUMINA 11,141,959 3,458,882,435 (c), (d)
BASE METALS Cu tonnes
Copper By-Product Coolgardie 1,906 6,465,118
Dundas 491 1,706,350
Halls Creek 3,869 13,438,904
Kalgoorlie-Boulder 562 1,900,826
Ravensthorpe 76 258,717
Roebourne 1,412 5,708,033
Wiluna 412 1,510,054
Total 8,727 30,988,002 (a), (b)
Cu tonnes
Copper Concentrates East Pilbara 18,104 56,511,248
Yalgoo 17,701 56,232,988
Total 35,805 112,744,236 (a)
Cu tonnes
Copper Cathode East Pilbara 15,936 66,489,834 (a)
Total Copper (Cu) 60,468 210,222,072 (a), (b)
Pb tonnes
Lead (Pg) Yalgoo 2,439 466,114 (a)
Zn tonnes
Zinc (Zn) Yalgoo 46,530 43,811,974 (a)
TOTAL BASE METALS 254,500,160 (a), (b), (j)
CHROMITE Cr2O3 tonnes
Chromite Ore Meekatharra 221,182 92,675 28,290,638 (a)
CLAY
Attapulgite Mullewa 9,713 1,014,329
Clay Shale Collie 19,546 158,296
Fire Clay Broome 108 2,700
Chittering 27,722 415,830
Total 27,830 418,530
Kaolin Bridgetown-Greenbushes 144 16,052
Saponite Coorow 535 51,628
TOTAL CLAY 57,767 1,658,835 (e)
COAL Collie 6,233,033 269,958,223 (f)
CONSTRUCTION MATERIALS
Aggregate Ashburton 10,402 52,009
Broome 66,258 1,961,526
East Pilbara 81,621 408,105
Port Hedland Town 88,963 444,818
Roebourne 107,301 536,503

Western Australian Mineral and Petroleum Statistics Digest 2004–05 31
Wyndham-East Kimberley 68,994 344,970
Total 423,539 3,747,930
Gravel Ashburton 2,545 28,000
Broome 2,487 32,253
Coolgardie 6,574 32,870
Derby–West Kimberley 2,200 11,000
Exmouth 25 250
Halls Creek 1,942 17,474
Kalamunda 158,338 518,949
Kalgoorlie-Boulder 4,630 23,150
Port Hedland Town 5,000 62,500
Wyndham–East Kimberley 14,458 118,209
Total 198,199 844,655
Rock Broome 3,222 73,409
Derby–West Kimberley 363 6,296
East Pilbara 302,794 1,427,462
Kalgoorlie–Boulder 83,949 419,745
Port Hedland Town 18,123 374,914
Wyndham–East Kimberley 272 1,360
Total 408,723 2,303,186
Sand Ashburton 2,925 25,275
Broome 40,475 300,108
Cockburn 133,609 534,436
Coolgardie 125,763 682,680
Coorow 3,491 15,332
Dandaragan 930 4,650
Derby–West Kimberley 7,685 46,808
East Pilbara 27,653 138,265
Esperance 1,470 7,349
Exmouth 11,000 104,500
Gingin 167 667
Kalgoorlie–Boulder 2,563 13,805
Kwinana 631,212 3,156,058
Marble Bar 45,502 227,510
Meekatharra 26,841 91,553
Menzies 27,218 136,091
Northam 125,302 626,513
Port Hedland Town 26,815 134,075
Roebourne 167,357 629,194
Wanneroo 1,161,373 5,807,320
Wyndham–East Kimberley 2,980 14,902
Yilgarn 3,762 18,811
Total 2,576,091 12,715,902
TOTAL CONSTRUCTION MATERIAL 3,606,552 19,611,673 (e)
Table 3: Quantity and Value of Commodity by Local Government Area Financial Year 2004-05
Commodity Local gov’t authorityQuantity
(Tonnes)Content
Value
($)

32 Western Australian Mineral and Petroleum Statistics Digest 2004–05
carats
DIAMONDS Derby-West Kimberley 135,374 39,684,566
Wyndham-East Kimberley 22,656,459 427,788,423
TOTAL DIAMONDS 22,791,833 467,472,989 (a)
DIMENSION STONE
Granite Dundas 2,530 50,594
Roebourne 378 38,855
Total 2,908 89,449
Marble Ashburton 1,613 765,367
TOTAL DIMENSION STONE 4,521 854,816 (e)
GEM & SEMI-PRECIOUS STONES kg
Agate Marble Bar 26,131 18,689
Amethyst Upper Gascoyne 180 932
Chalcedony/Mookaite Carnarvon 600 300
Jasper Marble Bar 193 221
Meekatharra 11,231 7,685
Total 11,424 7,906
Tourmaline Upper Gascoyne 649 7,497
Variscite Carnarvon 271,200 208,368
TOTAL GEM & SEMI-PRECIOUS STONES 310,185 243,692
Au oz Au kg
GOLD (AU) Ashburton Shire 5,140 160 2,883,394
Coolgardie 708,072 22,024 396,301,215
Dundas 114,043 3,547 64,224,792
East Pilbara 164,421 5,114 91,011,806
Kalgoorlie-Boulder 1,631,660 50,744 916,229,607
Laverton 348,971 10,854 195,882,507
Leonora 1,133,487 35,255 634,948,473
Meekatharra 282,093 8,774 158,077,405
Menzies 51,929 1,615 29,130,140
Mt Magnet 242,220 7,534 136,053,957
Sandstone 42,418 1,320 23,822,714
Wiluna 447,155 13,908 250,574,131
Yalgoo 14,961 465 8,536,919
Yilgarn 205,363 6,387 115,088,129
TOTAL GOLD 5,391,933 167,701 3,022,765,189 (g)
GYPSUM Carnarvon 1,147,723 19,469,734
Corrigin 1,603 22,442
Dalwallinu 67,730 604,032
Dandaragan 47,352 1,562,621
Dundas 24,454 398,395
Esperance 5,996 61,160
Irwin 2,484 56,345
Table 3: Quantity and Value of Commodity by Local Government Area Financial Year 2004-05
Commodity Local gov’t authorityQuantity
(Tonnes)Content
Value
($)

Western Australian Mineral and Petroleum Statistics Digest 2004–05 33
Kent 9,390 131,459
Koorda 220 4,400
Lake Grace 20,784 193,493
Nungarin 13,421 167,940
Perenjori 840 9,240
Ravensthorpe 17,345 90,983
Wyalkatchem 18,782 176,148
Yilgarn 4,933 59,195
TOTAL GYPSUM 1,383,056 23,007,586 (f)
HEAVY MINERAL SANDS
Garnet Sand Northampton 188,143 TiO2 tonnes n/a
Ilmenite Bunbury City 193,807 22,482,090
Capel 212,671 22,571,099
Carnamah 145,932 15,142,332
Dandaragan 42,269 5,848,592
Dardanup 97,586 12,424,259
Northampton 14,311 1,200,004
Total 706,576 TiO2 tonnes 79,668,376
Synthetic Rutile Capel 235,113 121,384,494
Carnamah 200,502 102,848,302
Dandaragan 213,181 109,959,185
Total 648,796 TiO2 tonnes 334,191,981
Leucoxene Bunbury City 3,472 1,831,455
Capel 34,428 8,956,372
Dandaragan 24,166 6,962,038
Dardanup 8,306 4,153,365
Total 70,372 21,903,230
Mineral Sands Concentrate Bunbury City 31,168 736,287
Rutile Bunbury City 466 403,673
Carnamah 73,357 44,136,930
Dandaragan 27,685 18,290,741
Total 101,508 TiO2 tonnes 62,831,344
Staurolite Dandaragan 5,626 654,345
Zircon Bunbury City 27,266 21,224,683
Capel 55,197 40,753,698
Carnamah 220,023 156,244,307
Dandaragan 101,378 67,899,840
Dardanup 14,060 10,567,818
Total 417,924 296,690,346
TOTAL HEAVY MINERAL SANDS 796,675,909 (a)
Table 3: Quantity and Value of Commodity by Local Government Area Financial Year 2004-05
Commodity Local gov’t authorityQuantity
(Tonnes)Content
Value
($)

34 Western Australian Mineral and Petroleum Statistics Digest 2004–05
INDUSTRIAL PEGMATITE MINERALS
Feldspar East Pilbara 10,170 918,940
Mukinbudin 714 10,571
Total 10,884 929,510 (e)
IRON ORE Fe %
Domestic Ore Ashburton 60,181 609,042
East Pilbara 4,051,807 126,596,291
Yilgarn 3,890 90,350
Total 4,115,878 127,295,683
Exported Ore Ashburton 73,952,716 2,408,698,274
Derby-West Kimberley 893,023 39,569,461
East Pilbara 147,155,713 5,436,945,315
Mullewa 1,836,494 74,024,618
Yilgarn 5,197,622 215,802,234
Total 229,035,568 8,175,039,902
TOTAL IRON ORE 233,151,446 8,302,335,585 (a)
LIMESAND-LIMESTONE-DOLOMITE
Dolomite Lake Grace 2,767 66,999
Yilgarn 2,520 41,440
Total 5,287 108,439
Limesand-Limestone Broome 25 250
Carnamah 15,190 60,760
Carnarvon 10,999 270,902
Cockburn 2,126,501 6,246,088
Coorow 18,896 283,439
Dandaragan 41,481 263,151
Dundas 190,200 19,489,263
Exmouth 4,171 47,380
Gingin 145,228 1,078,589
Irwin 149,452 418,878
Kwinana 59,502 609,555
Laverton 664,300 1,328,600
Manjimup 6,199 71,736
Shark Bay 705 98,638
Wanneroo 313,593 3,662,566
Wiluna 39,031 78,062
Wyndham-East Kimberley 1,158 46,610
Total 3,786,630 34,054,465
TOTAL LIMESAND-LIMESTONE-DOLOMITE 3,791,917 34,162,904 (e)
Table 3: Quantity and Value of Commodity by Local Government Area Financial Year 2004-05
Commodity Local gov’t authorityQuantity
(Tonnes)Content
Value
($)

Western Australian Mineral and Petroleum Statistics Digest 2004–05 35
Mn tonnes
MANGANESE ORE (Mn) East Pilbara 585,454 275,837 115,103,411
NICKEL INDUSTRY Co tonnes
Cobalt By-Product (Co) Coolgardie 18.84 1,130,001
Dundas 179.14 8,384,352
Halls Creek 321.37 10,119,820
Kalgoorlie-Boulder 150.54 8,443,035
Leonora 65.07 3,534,514
Ravensthorpe 2.44 150,773
Roebourne 67.46 3,570,906
Wiluna 304.66 12,540,814
Total 1,109.52 47,874,215
Cobalt Metal (Co) Coolgardie 594 34,325,724
Laverton 1,977 105,493,601
Total 2,571 139,819,325
Cobalt Sulphide Kalgoorlie-Boulder 806 15,955,605
TOTAL COBALT 4,486 203,649,145 (a), (b)
Ni tonnes
Nickel Concentrates Coolgardie 20,751 410,106,932
Dundas 9,063 177,870,261
Halls Creek 5,757 112,338,893
Kalgoorlie-Boulder 22,397 434,942,371
Ravensthorpe 1,579 30,918,364
Roebourne 2,004 37,991,908
Wiluna 20,187 397,276,846
Total 81,738 1,601,445,575
Ni tonnes
Nickel Metal (Ni) Laverton 29,602 546,631,623
Coolgardie 69,044 1,353,389,411
Total 98,646 1,900,021,034
TOTAL NICKEL 180,384 3,501,466,609 (i)
Pd kg
Palladium By-Product (Pd) Coolgardie 877 6,295,947 (b)
Pt kg
Platinum By-Product (Pt) Coolgardie 175 2,854,897 (b)
TOTAL NICKEL INDUSTRY 3,714,266,598
PETROLEUM kilolitres
Condensate Ashburton 146,196 57,161,390
Carnamah 73 17,000
Irwin 866 293,506
Roebourne 5,481,611 2,145,632,128
Total 5,628,746 2,203,104,024
Table 3: Quantity and Value of Commodity by Local Government Area Financial Year 2004-05
Commodity Local gov’t authorityQuantity
(Tonnes)Content
Value
($)

36 Western Australian Mineral and Petroleum Statistics Digest 2004–05
Kilolitres
Crude Oil Ashburton 2,779,949 1,111,573,545
Derby-West Kimberley 37,740 14,676,826
Irwin 507,825 188,682,597
Roebourne 9,475,658 3,893,833,443
Total 12,801,172 5,208,766,412
Btu 106
LNG - Liquidfied Natural Gas Roebourne 540,926,643 3,781,545,674
tonnes
LPG - Butane Roebourne 405,076 210,210,255
tonnes
LPG - Propane Roebourne 321,028 164,818,670
‘ 000 m³
Natural Gas Ashburton 663,423 60,742,932
Carnamah 25,174 2,103,835
Irwin 158,459 17,643,892
Roebourne 6,795,745 598,232,312
Total 7,642,801 678,722,971
TOTAL PETROLEUM PRODUCTS 12,247,168,006 (d)
PIGMENTS
Red Oxide Cue 2,260 769,354
SALT Ashburton 2,209,202 45,859,833 (a)
Carnarvon 1,581,855 30,805,718 (a)
Esperance 11,955 489,304 (h)
Port Hedland Town 3,606,273 65,966,835 (a)
Roebourne 3,028,208 55,492,575 (a)
Shark Bay 1,021,110 16,040,061 (a)
Wyalkatchem 217 20,611 (h)
Yilgarn 122,009 6,576,783 (h)
TOTAL SALT 11,580,828 221,251,719
SILICA-SILICA SAND
Silica Moora 102,835 1,028,361
Silica Sand Albany 121,592 2,484,503
Coolgardie 162,934 399,189
Swan 313,347 2,244,419
Total 597,873 5,128,111
TOTAL SILICA-SILICA SAND 700,709 6,156,472 (a)
Table 3: Quantity and Value of Commodity by Local Government Area Financial Year 2004-05
Commodity Local gov’t authorityQuantity
(Tonnes)Content
Value
($)
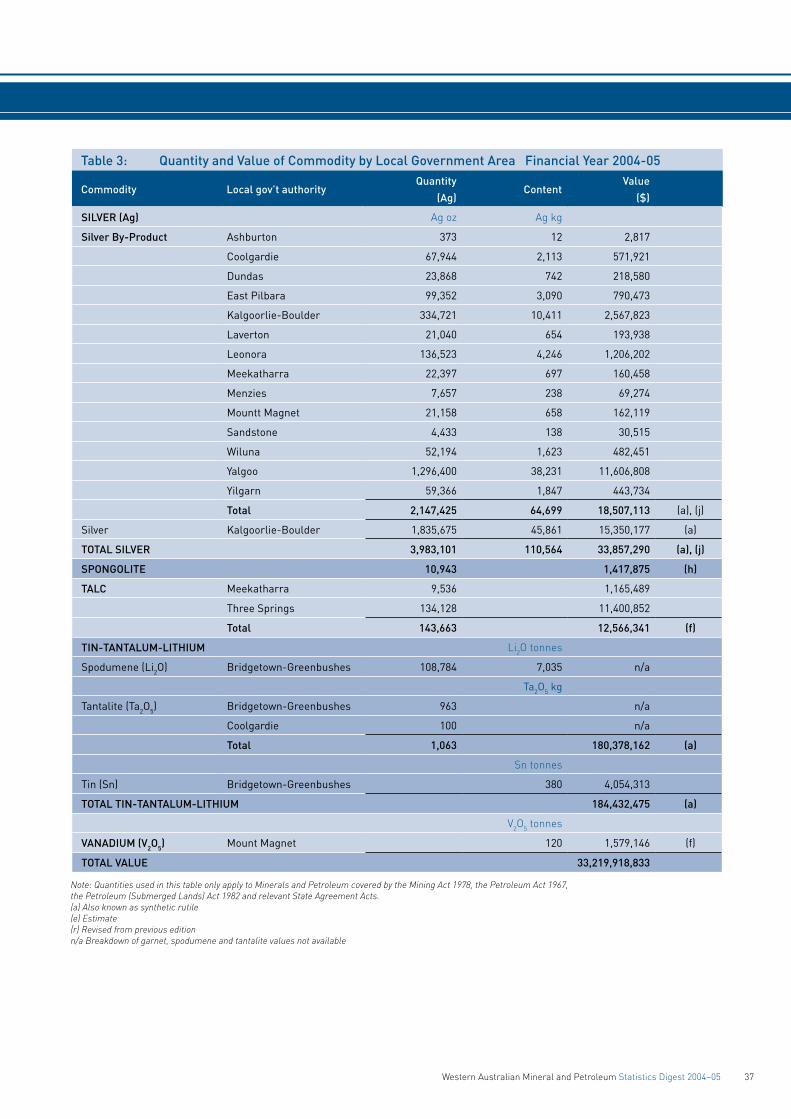
Western Australian Mineral and Petroleum Statistics Digest 2004–05 37
SILVER (Ag) Ag oz Ag kg
Silver By-Product Ashburton 373 12 2,817
Coolgardie 67,944 2,113 571,921
Dundas 23,868 742 218,580
East Pilbara 99,352 3,090 790,473
Kalgoorlie-Boulder 334,721 10,411 2,567,823
Laverton 21,040 654 193,938
Leonora 136,523 4,246 1,206,202
Meekatharra 22,397 697 160,458
Menzies 7,657 238 69,274
Mountt Magnet 21,158 658 162,119
Sandstone 4,433 138 30,515
Wiluna 52,194 1,623 482,451
Yalgoo 1,296,400 38,231 11,606,808
Yilgarn 59,366 1,847 443,734
Total 2,147,425 64,699 18,507,113 (a), (j)
Silver Kalgoorlie-Boulder 1,835,675 45,861 15,350,177 (a)
TOTAL SILVER 3,983,101 110,564 33,857,290 (a), (j)
SPONGOLITE 10,943 1,417,875 (h)
TALC Meekatharra 9,536 1,165,489
Three Springs 134,128 11,400,852
Total 143,663 12,566,341 (f)
TIN-TANTALUM-LITHIUM Li2O tonnes
Spodumene (Li2O) Bridgetown-Greenbushes 108,784 7,035 n/a
Ta2O5 kg
Tantalite (Ta2O5) Bridgetown-Greenbushes 963 n/a
Coolgardie 100 n/a
Total 1,063 180,378,162 (a)
Sn tonnes
Tin (Sn) Bridgetown-Greenbushes 380 4,054,313
TOTAL TIN-TANTALUM-LITHIUM 184,432,475 (a)
V2O5 tonnes
VANADIUM (V2O5) Mount Magnet 120 1,579,146 (f)
TOTAL VALUE 33,219,918,833
Table 3: Quantity and Value of Commodity by Local Government Area Financial Year 2004-05
Commodity Local gov’t authorityQuantity
(Ag)Content
Value
($)
Note: Quantities used in this table only apply to Minerals and Petroleum covered by the Mining Act 1978, the Petroleum Act 1967, the Petroleum (Submerged Lands) Act 1982 and relevant State Agreement Acts.(a) Also known as synthetic rutile(e) Estimate(r) Revised from previous editionn/a Breakdown of garnet, spodumene and tantalite values not available

38 Western Australian Mineral and Petroleum Statistics Digest 2004–05
Table 4: Royalty Receipts 2003–04 and 2004 –05
Commodity 2003–04Total A$
2004–05Total A$
2004–05 Growth
A$ %
ALUMINA 49,998,033 54,578,682 4,580,649 9
BASE METALS
Copper 5,808,644 6,050,690 242,046 4.2
Lead 1,139,745 23,345 -1,116,400 (98)
Zinc 7,233,354 1,863,619 -5,369,735 (74)
TOTAL BASE METALS 14,181,743 7,937,654 -6,244,089 (44)
CHROMITE 1,117,826 1,669,491 551,665 49
CLAYS 80,357 72,277 -8,080 (10)
COAL 13,522,666 14,220,474 697,808 5
CONSTRUCTION MATERIALS
Aggregate 134,818 123,179 -11,639 (9)
Gravel 30,822 60,355 29,533 96
Rock 94,678 106,877 12,199 13
Sand 585,158 787,777 202,619 35
TOTAL CONSTRUCTION MATERIALS 845,476 1,078,188 232,712 28
DIAMONDS 45,022,369 32,635,115 -12,387,254 (28)
DIMENSION STONE 1,706 3,236 1,530 90
GEM AND SEMI-PRECIOUS STONES 14,582 18,548 3,966 27
GOLD 79,500,095 72,914,303 -6,585,792 (8)
GYPSUM 470,469 546,958 76,489 16
HEAVY MINERAL SANDS
Garnet 777,394 884,132 106,738 14
Ilmenite 7,947,561 10,256,821 2,309,260 29
Leucoxene 960,517 740,743 -219,774 (23)
Rutile 4,458,431 3,304,079 -1,154,352 (26)
Staurolite 13,488 18,237 4,749 35
Zircon 12,052,314 11,576,731 -475,583 (4)
TOTAL HEAVY MINERAL SANDS 26,209,705 26,780,743 571,038 2
INDUSTRIAL PEGMATITE MINERALS
Feldspar 75,548 67,370 -8,178 (11)
IRON ORE 293,675,166 380,332,086 86,656,920 30
LIMESAND-LIMESTONE-DOLOMITE
Dolomite 3,078 1,611 -1,467 (48)
Limesand-Limestone 2,145,461 1,676,207 -469,254 (22)
TOTAL LIMESAND-LIMESTONE-DOLOMITE 2,148,539 1,677,818 -470,721 (22)
MANGANESE 3,164,431 5,747,729 2,583,298 82

Western Australian Mineral and Petroleum Statistics Digest 2004–05 39
Table 4: Royalty Receipts 2003–04 and 2004–05
Commodity 2003–04Total A$
2004–05Total A$
2004–05 Growth
A$ %
NICKEL
Palladium By-Product 85,455 124,289 38,834 45
Platinum By-Product 82,585 63,278 -19,307 (23)
TOTAL NICKEL INDUSTRY 76,769,045 93,395,043 16,625,998 22
PETROLEUM
Condensate 88,570,858 129,949,150 41,378,292 47
Liquified Natural Gas 121,262,529 187,783,823 66,521,294 55
LPG - Butane 8,730,167 11,760,736 3,030,569 35
LPG - Propane 7,130,002 9,453,319 2,323,317 33
Natural Gas 35,463,262 38,407,720 2,944,458 8
Oil 155,174,688 172,306,165 17,131,477 11
TOTAL PETROLEUM 416,331,506 549,660,913 133,329,407 32
PIGMENTS
Red Oxide 46,584 36,334 -10,250 (22)
SALT 2,293,565 2,700,904 407,339 18
SILICA SAND 314,026 310,820 -3,206 (1)
SILVER 412,337 781,107 368,770 89
SPONGOLITE 64,969 75,665 10,696 16
TALC 65,900 71,178 5,278 8
TIN-TANTALUM-LITHIUM
Spodumene 991,350 916,611 -74,739 (8)
Tantalite 5,652,060 7,454,335 1,802,275 32
Tin 102,293 106,702 4,409 4
TOTAL TIN-TANTALUM-LITHIUM 6,745,703 8,477,648 1,731,945 26
VANADIUM 509,643 93,587 -416,056 (82)
TOTAL REVENUE 1,033,581,989 1,255,883,871 222,301,882 22
Note: All Royalty Receipts above are only those paid into the State’s Consolidated Revenue Fund during the period. It does not include royalty receipts collected on behalf of the Commonwealth.
0
200
400
600
800
1000
1200
2003-042001-021999-001997-981995-961993-941991-921989-901987-881985-861983-84
Gold
Nickel
Alumina
Diamonds
Iron Ore
Petroleum
Other
A$ M
illio
n
1400
Figure 39 Royalty Receipts by Commodity Source: DoIR
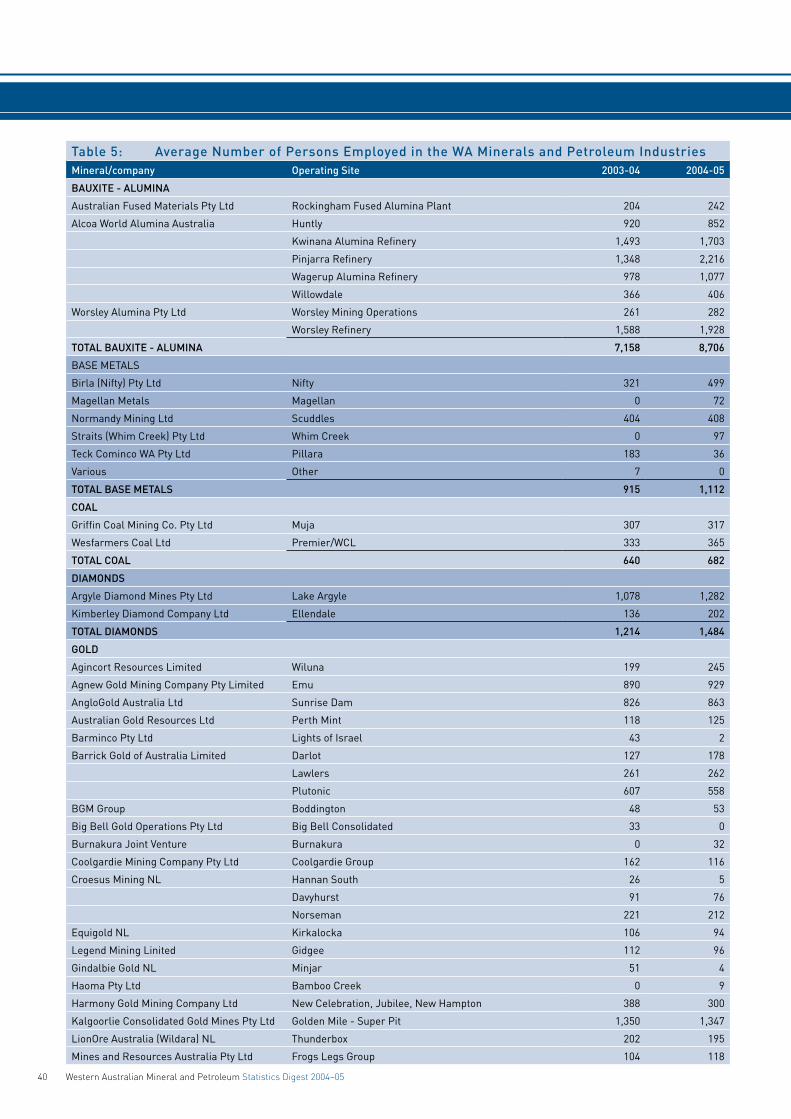
40 Western Australian Mineral and Petroleum Statistics Digest 2004–05
Table 5: Average Number of Persons Employed in the WA Minerals and Petroleum IndustriesMineral/company Operating Site 2003-04 2004-05
BAUXITE - ALUMINA
Australian Fused Materials Pty Ltd Rockingham Fused Alumina Plant 204 242
Alcoa World Alumina Australia Huntly 920 852
Kwinana Alumina Refinery 1,493 1,703
Pinjarra Refinery 1,348 2,216
Wagerup Alumina Refinery 978 1,077
Willowdale 366 406
Worsley Alumina Pty Ltd Worsley Mining Operations 261 282
Worsley Refinery 1,588 1,928
TOTAL BAUXITE - ALUMINA 7,158 8,706
BASE METALS
Birla (Nifty) Pty Ltd Nifty 321 499
Magellan Metals Magellan 0 72
Normandy Mining Ltd Scuddles 404 408
Straits (Whim Creek) Pty Ltd Whim Creek 0 97
Teck Cominco WA Pty Ltd Pillara 183 36
Various Other 7 0
TOTAL BASE METALS 915 1,112
COAL
Griffin Coal Mining Co. Pty Ltd Muja 307 317
Wesfarmers Coal Ltd Premier/WCL 333 365
TOTAL COAL 640 682
DIAMONDS
Argyle Diamond Mines Pty Ltd Lake Argyle 1,078 1,282
Kimberley Diamond Company Ltd Ellendale 136 202
TOTAL DIAMONDS 1,214 1,484
GOLD
Agincort Resources Limited Wiluna 199 245
Agnew Gold Mining Company Pty Limited Emu 890 929
AngloGold Australia Ltd Sunrise Dam 826 863
Australian Gold Resources Ltd Perth Mint 118 125
Barminco Pty Ltd Lights of Israel 43 2
Barrick Gold of Australia Limited Darlot 127 178
Lawlers 261 262
Plutonic 607 558
BGM Group Boddington 48 53
Big Bell Gold Operations Pty Ltd Big Bell Consolidated 33 0
Burnakura Joint Venture Burnakura 0 32
Coolgardie Mining Company Pty Ltd Coolgardie Group 162 116
Croesus Mining NL Hannan South 26 5
Davyhurst 91 76
Norseman 221 212
Equigold NL Kirkalocka 106 94
Legend Mining Linited Gidgee 112 96
Gindalbie Gold NL Minjar 51 4
Haoma Pty Ltd Bamboo Creek 0 9
Harmony Gold Mining Company Ltd New Celebration, Jubilee, New Hampton 388 300
Kalgoorlie Consolidated Gold Mines Pty Ltd Golden Mile - Super Pit 1,350 1,347
LionOre Australia (Wildara) NL Thunderbox 202 195
Mines and Resources Australia Pty Ltd Frogs Legs Group 104 118

Western Australian Mineral and Petroleum Statistics Digest 2004–05 41
Table 5: Average Number of Persons Employed in the WA Minerals and Petroleum IndustriesMineral/company Operating Site 2003-04 2004-05
White Foil 14 0
Mount Magnet Gold NL Hill 50-Mt Magnet 404 395
Newcrest Mining Ltd Telfer 1,476 1,868
Newmont Mining Corporation Jundee 500 575
Bronzewing-Mt McClure 224 11
Newfield Central Pty Ltd Newfield Central 11 10
Nustar Mining Corporation Limited Paulsens 0 112
Perilya Daisy-Milano Pty Ltd Daisy-Milano 39 60
Placer Dome Inc Granny Smith 525 595
Kanowna Belle 473 400
Paddington-Mt Pleasant 491 460
Siberia Gold Operations Pty Ltd Siberia Group / SMC 0 37
Sipa Resources International NL Mt Olympus 33 0
Sons of Gwalia NL Marvel Loch-Yilgarn Star 493 395
St Barbara Mines Ltd Bluebird Group 80 21
Carosue Dam 465 269
Sons of Gwalia 361 60
St Ives Gold Mining Company Pty Limited Kambalda/St Ives 1,525 1,340
Troy Resources Ltd Sandstone Group 50 47
Other Various 21 16
TOTAL GOLD 13,150 12,490
HEAVY MINERAL SANDS
BHP Titanium Minerals Pty Ltd Beenup 14 8
Cable Sands Pty Ltd Bunbury 289 324
Doral Mineral Sands Pty Ltd Dardanup 140 286
GMA Garnet Pty Ltd Narngulu Garnet Plant 31 29
Port Gregory - Hutt Laggoon 23 24
Doral Specialty Chemicals Pty Ltd Rockingham Zirconia Plant 24 23
Iluka Resources Limited Capel 490 538
Eneabba 301 269
Narngulu Synthetic Rutile Plants 463 480
Gingin/Iluka 0 28
TiWest Pty Ltd Chandala-Muchea 232 253
Cooljarloo 363 364
TOTAL HEAVY MINERAL SANDS 2,370 2,626
IRON ORE
BGC Contracting Pty Ltd Mt Newman Ore Body 18- Shovelanna Hill 0 17
BHP Iron Ore (Goldsworthy) Ltd Finucane Island 234 277
Yarrie 220 253
BHP Iron Ore (Jimblebar) Ltd Jimblebar 148 244
BHP Iron Ore Ltd Mining Area C 205 286
Mt Newman Railway 436 486
Mt Whaleback 1,314 1,578
Nelson Point 601 704
Orebody 25 135 173
Port Hedland HBI Plant 1,331 639
Yandi 389 384
Hamersley Iron Pty Ltd Brockman No. 2 Detritals Group 129 194
Dampier Port Operations (includes Hamersley and Robe railway employees)* 1,415 1,408
Table 5: Average Number of Persons Employed in the WA Minerals and Petroleum IndustriesMineral/company Operating Site 2003-04 2004-05
BAUXITE - ALUMINA
Australian Fused Materials Pty Ltd Rockingham Fused Alumina Plant 204 242
Alcoa World Alumina Australia Huntly 920 852
Kwinana Alumina Refinery 1,493 1,703
Pinjarra Refinery 1,348 2,216
Wagerup Alumina Refinery 978 1,077
Willowdale 366 406
Worsley Alumina Pty Ltd Worsley Mining Operations 261 282
Worsley Refinery 1,588 1,928
TOTAL BAUXITE - ALUMINA 7,158 8,706
BASE METALS
Birla (Nifty) Pty Ltd Nifty 321 499
Magellan Metals Magellan 0 72
Normandy Mining Ltd Scuddles 404 408
Straits (Whim Creek) Pty Ltd Whim Creek 0 97
Teck Cominco WA Pty Ltd Pillara 183 36
Various Other 7 0
TOTAL BASE METALS 915 1,112
COAL
Griffin Coal Mining Co. Pty Ltd Muja 307 317
Wesfarmers Coal Ltd Premier/WCL 333 365
TOTAL COAL 640 682
DIAMONDS
Argyle Diamond Mines Pty Ltd Lake Argyle 1,078 1,282
Kimberley Diamond Company Ltd Ellendale 136 202
TOTAL DIAMONDS 1,214 1,484
GOLD
Agincort Resources Limited Wiluna 199 245
Agnew Gold Mining Company Pty Limited Emu 890 929
AngloGold Australia Ltd Sunrise Dam 826 863
Australian Gold Resources Ltd Perth Mint 118 125
Barminco Pty Ltd Lights of Israel 43 2
Barrick Gold of Australia Limited Darlot 127 178
Lawlers 261 262
Plutonic 607 558
BGM Group Boddington 48 53
Big Bell Gold Operations Pty Ltd Big Bell Consolidated 33 0
Burnakura Joint Venture Burnakura 0 32
Coolgardie Mining Company Pty Ltd Coolgardie Group 162 116
Croesus Mining NL Hannan South 26 5
Davyhurst 91 76
Norseman 221 212
Equigold NL Kirkalocka 106 94
Legend Mining Linited Gidgee 112 96
Gindalbie Gold NL Minjar 51 4
Haoma Pty Ltd Bamboo Creek 0 9
Harmony Gold Mining Company Ltd New Celebration, Jubilee, New Hampton 388 300
Kalgoorlie Consolidated Gold Mines Pty Ltd Golden Mile - Super Pit 1,350 1,347
LionOre Australia (Wildara) NL Thunderbox 202 195
Mines and Resources Australia Pty Ltd Frogs Legs Group 104 118

42 Western Australian Mineral and Petroleum Statistics Digest 2004–05
Table 5: Average Number of Persons Employed in the WA Minerals and Petroleum IndustriesMineral/company Operating Site 2003-04 2004-05
HIsmelt/Kwinana 736 666
Marandoo 205 206
Nammuldi 0 9
Paraburdoo/Channar/Eastern Range 787 682
Tom Price 1,094 1,209
Yandicoogina 477 595
Henry Walker Eltin Cockatoo Pty Ltd Cockatoo Island 83 119
Mine and Port Developments Joint Venture PACE-RGP Group 386 91
Mount Gibson Mining Tallering Peak 43 117
Portman Mining Ltd Koolyanobbing 225 290
Robe River Mining Co. Pty Ltd Cape Lambert 703 771
West Angelas 352 586
Pannawonica Deepdale 439 475
TOTAL IRON ORE 12,087 12,459
NICKEL
Australian Mines Limited Blair 31 55
Australian Nickel Mines NL Armstrong - Kambalda 0 27
BHP Billiton Minerals Pty Ltd Ravensthorpe 3 227
Fox Resources Pty Ltd Radio Hill 13 85
GME Resources Limited Murrin Murrin 686 1,670
Goldfields Mine Management Pty Ltd Kambalda Group /GMM 0 134
Kimberley Nickel Mines Pty Ltd Sally Malay Group 36 208
Lanfranchi Nickel Mines Lanfranchi 0 16
Lightning Nickel Pty Ltd Long Nickel 111 126
LionOre Australia (Nickel) Ltd Bulong 131 17
Emily Ann 222 272
Honeymoon Well 0 376
Mincor Operations Pty Ltd Miitel, Wannaway, Redross, Mariners 187 268
OMG Cawse Pty Ltd Cawse 210 199
MPI Mines Ltd Black Swan 219 255
Reliance Operations Ltd Beta-Hunt Nickel Group 31 109
Sir Samuel Mines NL Cosmos 100 115
Tectonic Resources NL Rav 8 75 69
View Resources Ltd Carnilya Hill - Carnilya East 9 34
Western Areas Limited Forrestania 0 33
Western Mining Corporation Ltd Cliffs 0 5
Kalgoorlie Nickel Smelter 910 911
Kambalda 361 232
Kwinana Refinery 454 367
Leinster 1,147 1,372
Mt Keith 951 1,166
TOTAL NICKEL 5,887 8,348
PETROLEUM PRODUCTS
Apache Energy Ltd East Spar, Harriet, Stag, Campbell, Chervil,
Agincourt-Wonnich, Sinbad, Tanami, North Herald,
South Pepper 202 323
ARC Energy NL Dongara, Erimia, Hovea 29 20
BHP Billiton Petroleum (North West
Shelf) Pty Ltd Griffin 93 89
ENI Australia Woollybutt 65 74
**

Western Australian Mineral and Petroleum Statistics Digest 2004–05 43
Table 5: Average Number of Persons Employed in the WA Minerals and Petroleum IndustriesMineral/company Operating Site 2003-04 2004-05
Hardman Oil & Gas Pty Ltd Woodada 5 0
Kimberley Oil NL Blina, Boundary, Lloyd, Sundown, West Terrace 2 3
Mobil Exploration & Producing Australia Pty Ltd Wandoo 28 23
Origin Energy Resources Ltd Beharra Springs, Tubridgi, Jingemia 22 23
Nexen Petroleum Australia Pty Limited Buffalo 23 0
ChevronTexaco Pty Ltd Barrow Island, Cowle, Roller-Skate, Saladin,
Yammaderry 131 157
Woodside Energy Ltd Athena, Cossack, Echo-Yodel, Goodwyn, Hermes, North
Rankin, Wanaea, Lambert, Legendre
LNG 4th Train Construction
2nd Trunkline Construction 1,984 2,803
TOTAL PETROLEUM PRODUCTS 2,584 3,515
SALT
Dampier Salt Ltd Dampier 224 227
Lake MacLeod 162 184
Port Hedland 99 124
WA Salt Supply Koolyanobbing Pty Ltd Lake Deborah 12 10
Onslow Solar Salt Pty Ltd Onslow 95 142
Shark Bay Salt JV Useless Loop 65 74
Western Salt Refinery Pty Ltd Pink Lake 0 7
TOTAL SALT 657 768
TOTAL CLAYS 65 72
TOTAL CONSTRUCTION MATERIALS 287 324
TOTAL DIMENSION STONE 125 132
TOTAL INDUSTRIAL PEGMATITE MINERALS 22 22
TOTAL LIMESTONE - LIMESAND 112 115
TOTAL MANGANESE ORE 154 308
TOTAL PHOSPHATE 137 135
TOTAL SILICA - SILICA SAND 190 216
TOTAL TALC 108 127
TOTAL TIN - TANTALUM - LITHIUM 479 526
TOTAL VANADIUM 19 15
TOTAL CHROMITE 40 51
ALL OTHER MATERIALS 68 97
TOTAL 48,468 54,330
SOURCE: AXTAT Reporting System, Resources Safety Division, Department of Consumer and Employment Protection, for minerals data and petroleum producers for petroleum data. Figures are as provided by the various operating companies.
* NOTE: Pilbara Railway Company employees are now reported under the Dampier Port Operations
** The 2004-05 employee number for Murrin Murrin substantially exceeds historical variance. DoIR is investigating the reason for the variance and may revise the estimate

44 Western Australian Mineral and Petroleum Statistics Digest 2004–05
TABLE 6: Principal Mineral and Petroleum Producers effective 1 December 2005
BASE METALS
Copper–Lead–Zinc
Newcrest Mining LtdLevel 2, 20 Terrace RoadEast Perth WA 6004(08) 9270 7070Telferwww.newcrest.com.au
Oxiana LimitedPMB 7Geraldton WA 6530(08) 9956 4222Golden Grovewww.oxiana.com.au
Birla Mineral Resources Pty LtdLevel 2, 23 Ventnor AvenueWest Perth WA 6005Nifty.(08) 9179 0900www.adityabirla.com/our_companies/international_companies/birla_nifty.htm
BHP Billiton (Nickel West)191 Great Eastern HighwayBelmont WA 6104(08) 9479 0500Kambaldawww.bhpbilliton.com
BAUXITE–ALUMINA
Alumina
Alcoa World Alumina Australia 181–205 Davy Street Booragoon WA 6154(08) 9316 5111Del Park, Willowdale, Huntly www.alcoa.com.au
Worsley Alumina Pty Ltd PO Box 344 Collie WA 6225 (08) 9734 8311 Boddington www.wapl.com.au
CHROMITE
Chromite Ore
Pilbara Chromite Pty Ltd 28 Ventnor Avenue West Perth WA 6005 (08) 9321 3633 Coobinawww.consminerals.com.au
CLAY
Attapulgite
Hudson Resources Ltd34 James Street, Narngulu Geraldton WA 6530 (08) 9923 3604Lake Nerramynewww.hudsonresources.com
Clay Shale
The Griffin Coal Mining Company Pty Ltd 28 The Esplanade Perth WA 6000 (08) 9261 2800Colliewww.griffincoal.com.au
Fire Clay
Broome Brick Company Pty LtdPO Box 323Broome WA 6725(08) 9192 1385Broome
Kaolin
Sons of Gwalia Ltd16 Parliament PlaceWest Perth WA 6005 (08) 9263 5555Greenbusheswww.sog.com.au
Saponite
Watheroo Minerals Pty Ltd PO Box 353Dunsborough, WA 6281 0427 517 005Watheroo Clays www.bentoniteproductswa.com.au
COAL
The Griffin Coal Mining Company Pty Limited 28 The Esplanade Perth WA 6000 (08) 9261 2800 Colliewww.griffincoal.com.au
Wesfarmers Premier Coal LtdPremier RoadCollie WA 6225 (08) 9780 2222Collie www.wesfarmers.com.au
CONSTRUCTION MATERIALS
Aggregate
The Readymix Group (WA) 75 Canning Highway Victoria Park WA 6100 (08) 9212 2000 Boodarrie, Burrup–DampierMarble Bar, Newman, Turner Riverwww.readymix.com.au
Gravel
Hanson Construction Pty Ltd123 Burswood RoadVictoria Park WA 6100(08) 9311 8811Maitland Riverwww.hanson.biz/au
Martinjinni Pty LtdPO Box 7Kununurra WA 6743040 8822 736Kununurra
WA Limestone Co.41 Spearwood Avenue Bibra Lake WA 6163 (08) 9434 2299Pickering Brook
Sand
Boral Resources (WA) Ltd 63-69 Abernethy Road Belmont WA 6104 (08) 9333 3400 Banjupwww.boral.com.au
Rocla Quarry Products 130 Fauntleroy AvenueRedcliffe WA 6104 (08) 9475 2555 Gnangarrawww.rocla.com.au
The Readymix Group (WA) 75 Canning HighwayVictoria Park WA 6100 (08) 9212 2000 Various sites www.readymix.com.au
Tuma Holdings Pty Ltd T/as Action Sand Supplies42 Noel RoadGooseberry Hill WA 6076(08) 9275 1100Mobile: 0408 923 801 Chidlow
DIAMONDS
Argyle Diamonds Australia 2 Kings Park Road West Perth WA 6005 (08) 9482 1166 Argylewww.argylediamonds.com.au
Kimberley Diamond Company 12 Walker AvenueWest Perth WA 6005(08) 9321 5887Ellendalewww.kimberleydiamondco.com.au
DIMENSION STONE
Granite
Fraser Range Granite NLEyre HighwayNorseman WA 6443(08) 9039 3442Fraser Range Granite
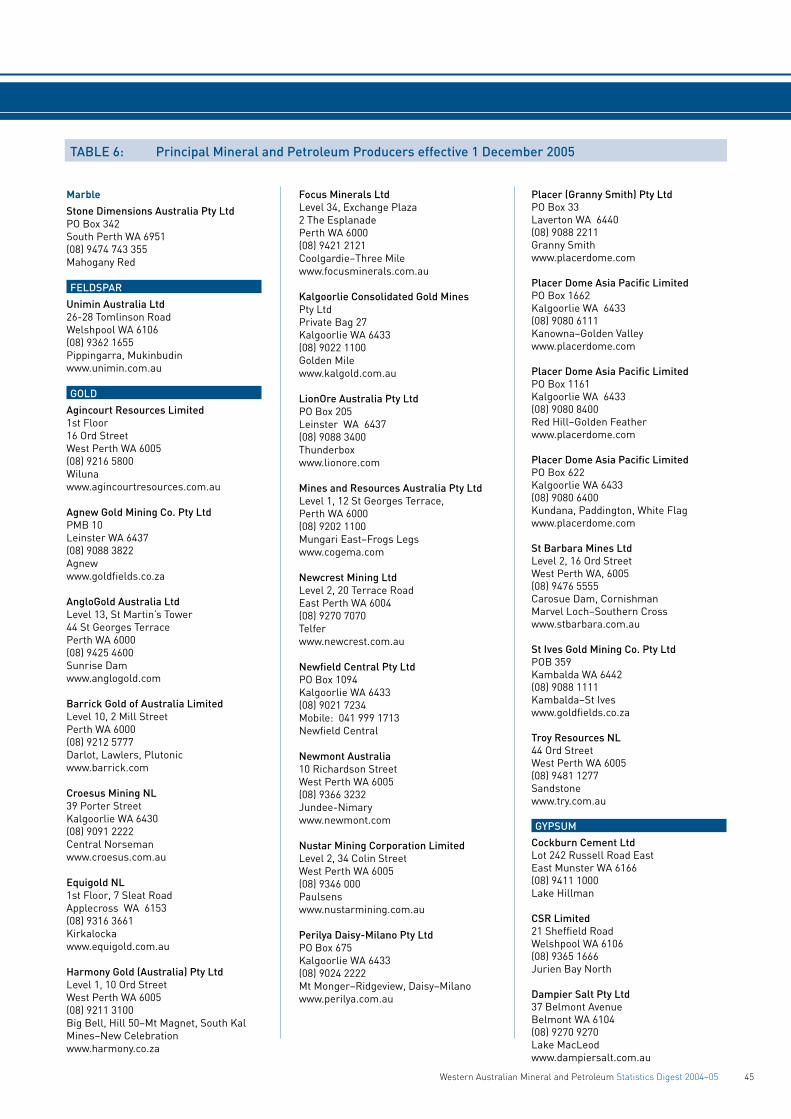
Western Australian Mineral and Petroleum Statistics Digest 2004–05 45
TABLE 6: Principal Mineral and Petroleum Producers effective 1 December 2005
Marble
Stone Dimensions Australia Pty LtdPO Box 342South Perth WA 6951(08) 9474 743 355Mahogany Red FELDSPAR
Unimin Australia Ltd26-28 Tomlinson Road Welshpool WA 6106(08) 9362 1655Pippingarra, Mukinbudinwww.unimin.com.au
GOLD
Agincourt Resources Limited1st Floor16 Ord StreetWest Perth WA 6005 (08) 9216 5800Wilunawww.agincourtresources.com.au
Agnew Gold Mining Co. Pty Ltd PMB 10Leinster WA 6437 (08) 9088 3822Agnewwww.goldfields.co.za
AngloGold Australia LtdLevel 13, St Martin’s Tower44 St Georges Terrace Perth WA 6000 (08) 9425 4600Sunrise Dam www.anglogold.com
Barrick Gold of Australia LimitedLevel 10, 2 Mill Street Perth WA 6000 (08) 9212 5777 Darlot, Lawlers, Plutonicwww.barrick.com
Croesus Mining NL 39 Porter Street Kalgoorlie WA 6430(08) 9091 2222 Central Norseman www.croesus.com.au
Equigold NL1st Floor, 7 Sleat RoadApplecross WA 6153(08) 9316 3661Kirkalockawww.equigold.com.au
Harmony Gold (Australia) Pty LtdLevel 1, 10 Ord Street West Perth WA 6005(08) 9211 3100Big Bell, Hill 50–Mt Magnet, South Kal Mines–New Celebration www.harmony.co.za
Focus Minerals LtdLevel 34, Exchange Plaza2 The EsplanadePerth WA 6000(08) 9421 2121Coolgardie–Three Milewww.focusminerals.com.au
Kalgoorlie Consolidated Gold Mines Pty LtdPrivate Bag 27 Kalgoorlie WA 6433 (08) 9022 1100 Golden Mile www.kalgold.com.au
LionOre Australia Pty LtdPO Box 205Leinster WA 6437(08) 9088 3400Thunderboxwww.lionore.com
Mines and Resources Australia Pty LtdLevel 1, 12 St Georges Terrace,Perth WA 6000(08) 9202 1100Mungari East–Frogs Legswww.cogema.com
Newcrest Mining LtdLevel 2, 20 Terrace RoadEast Perth WA 6004(08) 9270 7070Telferwww.newcrest.com.au
Newfield Central Pty LtdPO Box 1094Kalgoorlie WA 6433(08) 9021 7234Mobile: 041 999 1713Newfield Central
Newmont Australia10 Richardson StreetWest Perth WA 6005(08) 9366 3232Jundee-Nimary www.newmont.com
Nustar Mining Corporation LimitedLevel 2, 34 Colin StreetWest Perth WA 6005(08) 9346 000Paulsenswww.nustarmining.com.au
Perilya Daisy-Milano Pty LtdPO Box 675Kalgoorlie WA 6433(08) 9024 2222Mt Monger–Ridgeview, Daisy–Milanowww.perilya.com.au
Placer (Granny Smith) Pty Ltd PO Box 33 Laverton WA 6440 (08) 9088 2211Granny Smith www.placerdome.com
Placer Dome Asia Pacific LimitedPO Box 1662Kalgoorlie WA 6433(08) 9080 6111Kanowna–Golden Valleywww.placerdome.com
Placer Dome Asia Pacific LimitedPO Box 1161Kalgoorlie WA 6433(08) 9080 8400Red Hill–Golden Featherwww.placerdome.com
Placer Dome Asia Pacific LimitedPO Box 622Kalgoorlie WA 6433(08) 9080 6400Kundana, Paddington, White Flagwww.placerdome.com
St Barbara Mines Ltd Level 2, 16 Ord Street West Perth WA, 6005 (08) 9476 5555 Carosue Dam, CornishmanMarvel Loch–Southern Cross www.stbarbara.com.au
St Ives Gold Mining Co. Pty Ltd POB 359 Kambalda WA 6442 (08) 9088 1111 Kambalda–St Ives www.goldfields.co.za
Troy Resources NL 44 Ord StreetWest Perth WA 6005 (08) 9481 1277Sandstone www.try.com.au
GYPSUM
Cockburn Cement Ltd Lot 242 Russell Road East East Munster WA 6166 (08) 9411 1000 Lake Hillman
CSR Limited21 Sheffield RoadWelshpool WA 6106 (08) 9365 1666 Jurien Bay North
Dampier Salt Pty Ltd 37 Belmont Avenue Belmont WA 6104(08) 9270 9270Lake MacLeod www.dampiersalt.com.au

46 Western Australian Mineral and Petroleum Statistics Digest 2004–05
TABLE 6: Principal Mineral and Petroleum Producers effective 1 December 2005
Gypsum Industries PO Box 952Canning Bridge WA, 6153(08) 9364 4951 Lake Cowcowingwww.aglime.com.au
Lake Hillman Mining Pty LtdPO Box 1Kalannie WA 6468(08) 9666 2045Lake Hillman.
HEAVY MINERAL SANDS
Garnet Sand
GMA Garnet Pty Ltd PO Box 188Geraldton WA 6531 (08) 9923 3747Port Gregory,www.gmagarnet.com
Ilmenite, Leucoxene, Rutile and Zircon
Cable Sands (WA) Pty LtdPO Box 133 Bunbury WA 6231 (08) 9721 0200 Jangardup, Sandalwood, Ludlow Tutunupwww.cablesands.com.au
Doral Mineral SandsLot 7 Harris RoadPICTON WA 6229(08) 9725 4899Dardanupwww.doral.com.au
Iluka Resources Ltd Level 23, 140 St Georges TerracePerth WA 6000(08) 9360 4700 Capel, Eneabba, Yoganup www.iluka.com
TiWest Pty Ltd1 Brodie-Hall Drive Bentley WA 6102 (08) 9365 1333 Cooljarloowww.tiwest.com.au
IRON ORE
BHP Billiton Iron Ore (Goldsworthy) Ltd 200 St Georges Terrace Perth WA 6000 (08) 9320 4444 Mining Area C, Nimingarra–Yarrie www.bhpbilliton.com
BHP Billiton Iron Ore Ltd 200 St Georges Terrace Perth WA 6000 (08) 9320 4444 Jimblebar, Newman, Yandicoogina www.bhpbilliton.com
Channar Mining Pty Ltd 152 St Georges Terrace Perth WA 6000 (08) 9327 2327Channar.
Hamersley Iron Pty Ltd 152 St Georges Terrace Perth WA 6000 (08) 9327 2327 Brockman, Marandoo, Paraburdoo, Tom Price, Yandicoogina www.hamersleyiron.com
Mount Gibson Iron Limited1st Floor7 Havelock StreetWest Perth WA 6005 (08) 9426 7500Tallering Peakwww.mtgibsoniron.com.au
Portman Iron Ore Ltd Level 11, 1 William Street Perth WA 6000 (08) 9426 3333 Cockatoo Island, Koolyanobbing www.portman.com.au
Robe River Iron AssociatesLevel 27 Central Park152-158 St Georges TerracePerth WA 6000(08) 9327 2800Pannawonica, West Angeleswww.roberiver.com.au
LIMESAND–LIMESTONE
Cockburn Cement Ltd Lot 242, Russell Road EastEast Munster WA 6163 (08) 9411 1000 Cockburn, Dongarawww.cockburncement.com.au
Limestone Resources Australia Pty Ltd Parkland Road, Cnr Hasler Street Osborne Park WA, 6017(08) 9445 3433Wanneroo, Moore River, Caraboodawww.limestone-resources.com.au
Loongana Lime Pty Ltd PO Box 808 Kalgoorlie WA 6430 (08) 9021 8055 Loongana
WA Limestone Co. 41 Spearwood Avenue Bibra Lake WA 6163 (08) 9434 2299 Postans
Gypsum Industries of Australia PO Box 952 Canning Bridge WA 6153 (08) 9364 4951 Dongara–Denison, Cervantes, Lancelin Jurien
MANGANESE
Pilbara Manganese Pty Ltd 28 Ventor AvenueWest Perth WA 6005 (08) 9321 3633 Woodie Woodie www.consminerals.com.au
NICKEL
Fox Resources LtdSuite 1 and 2614 Newcastle StreetLeederville WA 6007(08) 9318 5600Radio Hillwww.foxresources.com.au
Minara Resources Ltd Level 4, 30 The EsplanadePerth WA 6000 (08) 9212 8400 Murrin Murrin www.minara.com.au
Independence Group NLPO Box 893South Perth WA 6951(08) 9367 2755Long Nickelwww.independencegroup.com.au
LionOre (Australia) Pty Ltd Level 3, 88 Colin Street West Perth WA 6005 (08) 9426 0100Black Swan, Emily Ann www.lionore.com
Mincor Resources NL Level 1, 1 Havelock Street West Perth, WA 6005 (08) 9321 7125, Miitel, Mariners, Redross, Wannaway www.mincor.com.au
OMG Cawse Pty Ltd Cawse Nickel Operations Locked Bag 32, Kalgoorlie WA 6433 (08) 9024 8800 Cawsewww.omgi.com
Sally Malay Mining LtdLevel 22, Allendale Square77 St Georges TerracePerth WA 6000(08) 9225 0999Sally Malaywww.sallymalay.com

Western Australian Mineral and Petroleum Statistics Digest 2004–05 47
TABLE 6: Principal Mineral and Petroleum Producers effective 1 December 2005
Sir Samuel Mines NL 3rd Floor, 24 Outram Street West Perth WA 6005(08) 9213 1588 Cosmoswww.jubileemines.com.au
Tectonic Resources NLSuite 4, 100 Hay Street Subiaco WA 6008 (08) 9388 3872 RAV8www.tectonicres.com.au
View Resources LtdLevel 12, London House216 St Georges TerracePerth WA 6000(08) 9226 4611Carnilya Hillwww.viewresources.com.au
BHP Billiton (Nickel West)191 Great Eastern HighwayBelmont WA 6104(08) 9479 0500Kambalda, Leinster, Mt Keith Kalgoorlie, Kwinanawww.wmc.com
PALLADIUM
BHP Billiton (Nickel West)191 Great Eastern HighwayBelmont WA 6104(08) 9479 0500 Kambalda, www.wmc.com
PETROLEUM
Apache Energy Ltd Level 3, 256 St Georges TerracePerth WA 6000 (08) 9422 7222 Agincourt, Albert, Artreus, Bambra,Double Island, East Spar, Endymion, Gudrun, Gipsy, John Brookes, Harriet, Hoover, Linda, Little Sandy, Mohave, Monet, North Alkimos, North Pedirka, Pedirka, Rose, Simpson, Sinbad, South Plato, Stag, Tanami, Victoria, Wonnichwww.apachecorp.com
ARC Energy Ltd Level 4, 679 Murray Street West Perth WA 6005 (08) 9486 7333 Dongara, Hovea-Eremia, WoodadaMt Horner, Xyris www.arcenergy.com.au
BHP Billiton Petroleum (North West Shelf) Pty Ltd Level 42, Central Park 152-158 St Georges Terrace Perth WA 6000 (08) 9278 4888 Chinook–Scindian, Griffin www.bhpbilliton.com
ChevronTexaco Australia Pty Ltd Level 24, QV1 Building 250 St Georges Terrace Perth WA 6000(08) 9216 4000Barrow Island, Cowle, CrestRoller-Skate, Saladin, Yammaderry www.chevrontexaco.com
ENI Australia LimitedLevel 3, 40 Kings Park RoadWest Perth WA 6005(08) 9320 1111Woollybutt
Kimberley Oil NL Suite 12B, 573 Canning HighwayAlfred Cove WA 6154 (08) 9330 8876 Blinawww.kimberleyoil.com.au
Origin Energy Resources Ltd 34 Collins StreetWest Perth WA 6005 (09) 9324 6111 Beharra Springs, Jingemia www.originenergy.com.au
Santos LimitedLevel 29 Santos House91 King William StreetAdelaide SA 5000(08) 8218 5111Mutineer–Exeterwww.santos.com.au
Vermillion Oil and Gas Pty LtdLevel 7, BNZ House30 The EsplanadePerth WA 6000(08) 9480 0300Wandoowww.vermillionenergy.com
Woodside Energy Ltd 240 St Georges TerracePerth WA 6000 (08) 9348 4000Athena, Cossack, Echo-Yodel, Goodwyn, Hermes, Lambert, Laminaria, Legendre, North Rankin, Perseus, Wanaea www.woodside.com.au
PLATINUM
BHP Billioton (Nickel West)191 Great Eastern HighwayBelmont WA 6104 (08) 9479 0500Kambalda www.wmc.com.au
SALT
Dampier Salt Pty Lt 37 Belmont Avenue Belmont WA 6104(08) 9270 9270 Dampier, Lake MacLeod, Port Hedland www.dampiersalt.com.au
Onslow Salt Pty Ltd PO Box 23 Onslow WA 6710(08) 9184 9000 Onslow Salt www.onslowsalt.com
Shark Bay Salt Joint Venture Level 16, 2 The EsplanadePerth WA 6000 (08) 9265 8000Useless Loop.
WA Salt Supply Ltd Cockburn Road Hamilton Hill WA 6163 (08) 9430 5495 Lake Deborah East, Pink Lake www.wasalt.com.au
SILICA–SILICA SAND
Silica
Simcoa Operations Pty Ltd PO Box 1389 Bunbury WA 6231 (08) 9780 6666 Dalaroo www.simcoa.com.au
Silica Sand
Rocla Quarry Products 180 Fauntleroy Avenue Kewdale WA 6105 (08) 9475 2555 Gnangarra www.rocla.com.au
Austsand Pty Ltd PO Box 1373 Albany WA 6330(08) 9846 1222 Mindijup
SPONGOLITE
Supersorb Minerals NL 55 Collie Street Albany WA 6330 (08) 9842 1955 Woogenellup www.supersorb.com.au
TALC
Luzenac Australia Pty Ltd GPO Box A42 Perth WA 6837 (08) 9327 2277Three Springs www.luzenac.com

48 Western Australian Mineral and Petroleum Statistics Digest 2004–05
TABLE 6: Principal Mineral and Petroleum Producers effective 1 December 2005
Unimin Australia Ltd 26 Tomlinson RoadWelshpool WA 6106 (08) 9362 1411Mt Seabrookwww.unimin.com.au
TIN–TANTALUM–LITHIUM
Spodumene
Sons of Gwalia Ltd 16 Parliament Place West Perth WA 6005 (08) 9263 5555 Greenbushes, Wodgina www.sog.com.au
Tantalite–Tin
Sons of Gwalia Ltd 16 Parliament Place West Perth WA 6005 (08) 9263 5555 Greenbushes, Wodgina www.sog.com.au Haddington Resources Ltd PO Box 1909 West Perth WA 6872 (08) 9488 5100Bald Hillwww.haddington.com.au

Western Australian Mineral and Petroleum Statistics Digest 2004–05 49
Abbreviations A$ Australian Dollar km kilometres ABARE Australian Bureau of Agricultural and Resource Economics km2 square kilometres ABS Australian Bureau of Statistics LME London Metal Exchange AFR Australian Financial Review Mbbl thousand barrels of oil ANZ Australia and New Zealand bank MMbbl million barrels of oil bbl barrels of oil Mct million carats Bcm billion cubic metres Moz million ounces BMR Bureau of Mineral Resources Mt million tonnes cons concentrates Mt/a million tonnes per annum CSO Central Selling Organisation n/a not applicable ct carat oz ounce DRI Direct Reduced Iron RBA Reserve Bank of Australia ECB European Central Bank SARS Severe Acute Respiratory Syndrome f.o.b. free-on-board t tonnes f.o.t. free-on-truck t/a tonnes per annum GDP Gross Domestic Product Tcf trillion cubic feet HBI Hot Briquetted Iron US$ United States dollar IMF International Monetary Fund WTI West Texas Intermediate
References Table 3(a) Estimated f.o.b. value (g) London PM Gold Fix price as supplied by WA Treasury Corporation
(b) Metallic by-product of nickel mining (h) Estimated f.o.t. value
(c) Value based on the average Australian value of alumina as published by the ABS
(i) Estimated f.o.b. value based on the current price of nickel-containing products
(d) Delivered/shipped value (j) By-products of gold mining
(e) Value at works (r) Revised from previous edition
(f) Estimated ex-mine value
Units and Conversion FactorsMetric Unit Symbol Imperial Unit
Mass 1 gram g = 0.032151 troy (fine) ounce (oz)
1 kilogram kg = 2.204624 pounds (lb)
1 tonne t = 1.10231 United States short ton [1 US short ton = 2,000 lb]
1 tonne t = 0.98421 United Kingdom long ton [1 UK long ton = 2,240 lb]
1 tonne LNG t = 52,000,000 British Thermal Units (Btu)
Volume 1 kilolitre kl = 6.28981 barrels (bbl)
1 cubic metre m3 = 35.3147 cubic feet (ft3) [1 kilolitre (kl) = 1 cubic metre (m3)]
Energy 1 kilojoule kj = 0.94781 British Thermal Units (Btu)
Energy Content Prefix
Coal 19.7 GJ/t kilo (k) 103
Condensate 32.0 MJ/L mega (M) 106
Crude oil 37.0 MJ/L giga (G) 109
LNG 25.0 MJ/L tera (T) 1012
Natural gas 38.2 MJ/m3 peta (P) 1015
LPG-butane 28.7 MJ/L (1tonne LPG-butane = 1,720 litres)
LPG-propane 25.4 MJ/L (1tonne LPG-propane = 1,960 litres)
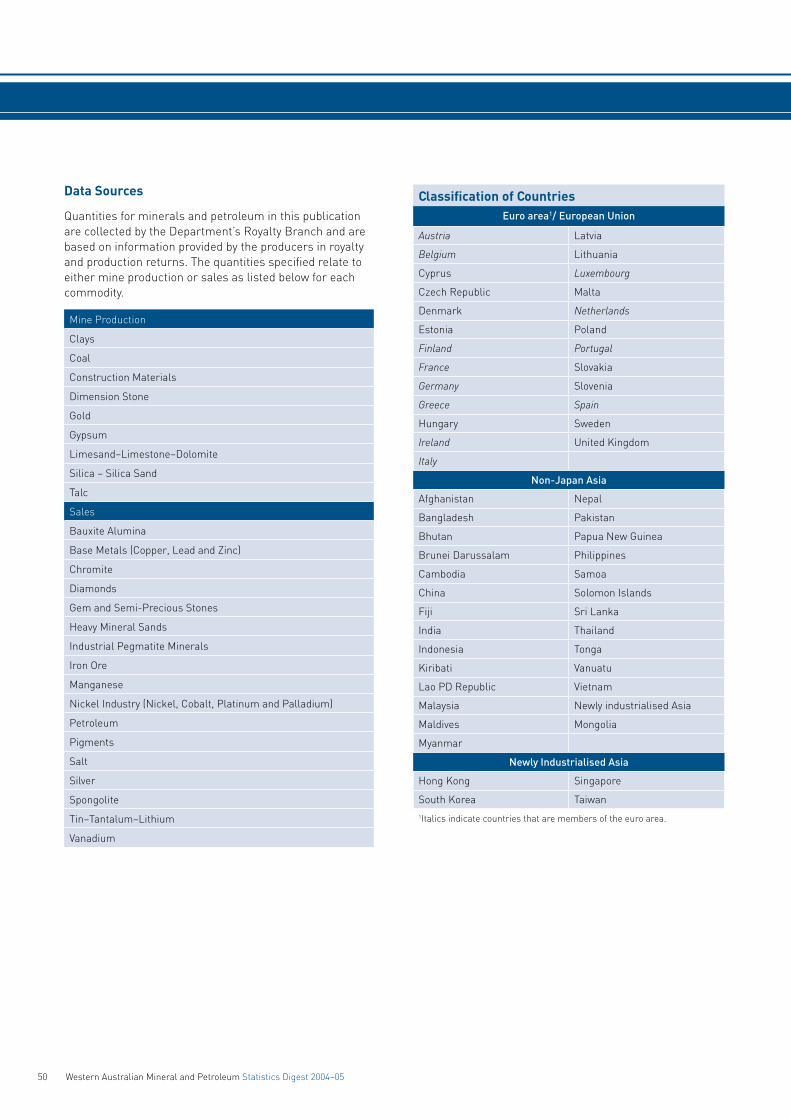
50 Western Australian Mineral and Petroleum Statistics Digest 2004–05
Data Sources
Quantities for minerals and petroleum in this publication are collected by the Department’s Royalty Branch and are based on information provided by the producers in royalty and production returns. The quantities specified relate to either mine production or sales as listed below for each commodity.
Mine Production
Clays
Coal
Construction Materials
Dimension Stone
Gold
Gypsum
Limesand–Limestone–Dolomite
Silica – Silica Sand
Talc
Sales
Bauxite Alumina
Base Metals (Copper, Lead and Zinc)
Chromite
Diamonds
Gem and Semi-Precious Stones
Heavy Mineral Sands
Industrial Pegmatite Minerals
Iron Ore
Manganese
Nickel Industry (Nickel, Cobalt, Platinum and Palladium)
Petroleum
Pigments
Salt
Silver
Spongolite
Tin–Tantalum–Lithium
Vanadium
Classification of CountriesEuro area1/ European Union
Austria Latvia
Belgium Lithuania
Cyprus Luxembourg
Czech Republic Malta
Denmark Netherlands
Estonia Poland
Finland Portugal
France Slovakia
Germany Slovenia
Greece Spain
Hungary Sweden
Ireland United Kingdom
Italy
Non-Japan Asia
Afghanistan Nepal
Bangladesh Pakistan
Bhutan Papua New Guinea
Brunei Darussalam Philippines
Cambodia Samoa
China Solomon Islands
Fiji Sri Lanka
India Thailand
Indonesia Tonga
Kiribati Vanuatu
Lao PD Republic Vietnam
Malaysia Newly industrialised Asia
Maldives Mongolia
Myanmar
Newly Industrialised Asia
Hong Kong Singapore
South Korea Taiwan1Italics indicate countries that are members of the euro area.

Western Australian Mineral and Petroleum Statistics Digest 2004–05 51
MAP 1
Local government boundaries

52 Western Australian Mineral and Petroleum Statistics Digest 2004–05
MAP 2
Local government boundaries

Western Australian Mineral and Petroleum Statistics Digest 2004–05 53
Long Nickel
Kundana
JubileeKambalda
Paddington
Central Norseman
Kanowna BelleGolden Mile
New Celebration
St Ives
CawseCarosue Dam
Davyhurst
Black Swan
MiitelBald Hill
BinduliWhite Foil
Emily Ann
Three Mile
Beta HuntCarnilya Hill
Blair
Wannaway
Bullabulling
50 km
Argyle
Cockatoo Island
NiftyWodgina
Plutonic
Port Hedland
Radio Hill
PannawonicaSaladinGriffin
Tom Price–ParaburdooChannar
ParaburdooNewman
Roller–Skate
WandooStagBarrow Island Harriet
HermesNorth Rankin
East Spar Dampier
Goodwyn Cossack
Useless LoopBluebird Wiluna
Big Bell GidgeeMt Keith
DarlotLawlers
Jundee – Nimary
Agnew
TarmoolaSons of Gwalia Granny SmithPort Gregory
Dongara
Woodada EneabbaThree Springs
Cooljarloo
WillowdaleBoddington
GreenbushesJangardup
Yoganup
Del Park Huntly
Collie/GriffinCollie/Wesfarmers
Yarrie
Koolyanobbing
MAJOR MINERAL AND PETROLEUM PROJECTSIN WESTERN AUSTRALIA
Wanaea
Sunrise Dam
Beharra Springs
Tubridgi
200 km
Murrin Murrin
Woodie Woodie
Lake MacLeod GypsumLake MacLeod Salt
Cosmos
RAV8
Woogenellup
Base metalsBauxite–AluminaCoalDiamondsGoldHeavy Mineral SandsGypsumIron Ore
ManganeseNickelPetroleumSaltSpongoliteTalcTin–Tantalum–Lithium
s
s
LambertLegendre
Marvel Loch –Southern Cross
Hill 50 – Mt Magnet
Sandalwood
Onslow Salt
Golden GroveMinjar
West Angelas
Athena
Echo–Yodel
Ellendale
Kirkalocka
Thunderbox
Bronzewing-Mt McClureLeinsterMt Klemptz
Bulchina –
North Capel
DJF112e 01.11.04
JingemiaEremiaHovia
Woollybutt
Dardanup
Brockman Marandoo
Mining Area C
Tallering Peak
Yandicoogina HIYandicoogina BHP
Sally MalayBlina–Lloyd
Crest
Cornishman–Pilot
Newfield Central
Long Nickel
Kundana
JubileeKambalda
Paddington
Central Norseman
Kanowna BelleGolden Mile
New Celebration
St Ives
CawseCarosue Dam
Davyhurst
Black Swan
MiitelBald Hill
BinduliWhite Foil
Emily Ann
Three Mile
Beta HuntCarnilya Hill
Blair
Wannaway
Bullabulling
50 km
SEEENLARGEMENT
MAP 2

DoIRMAR06_625
Head Office:Mineral House100 Plain StreetEast Perth WA 6004
Telephone: +61 8 9222 3333Facsimile: +61 8 9222 3568Email: [email protected]


![[2005] WAMW 5 - dmp.wa.gov.au](https://static.fdocuments.us/doc/165x107/622d500291bca001047fa3a9/2005-wamw-5-dmpwagovau.jpg)