Westbrook - Warrington · Westbrook Ward Profile 2015. Page 2 of 15 Warrington Borough Council ......
15
Westbrook Ward Profile 2015 December 2015 Produced by: Customer Insight Team Warrington Borough Council Email: [email protected] www.warrington.gov.uk – facts and figures
Transcript of Westbrook - Warrington · Westbrook Ward Profile 2015. Page 2 of 15 Warrington Borough Council ......

Westbrook
Ward Profile 2015
December 2015
Produced by: Customer Insight Team
Warrington Borough Council
Email: [email protected] www.warrington.gov.uk – facts and figures
Westbrook Ward Profile 2015
Warrington Borough Council Page 2 of 15
Contents
Introduction ................................................................................................................ 3
Population .................................................................................................................. 4
Housing Tenure .......................................................................................................... 5
Health ......................................................................................................................... 6
Education and Skills ................................................................................................... 7
Economic Activity ....................................................................................................... 9
Deprivation ............................................................................................................... 10
Indices of Deprivation table ...................................................................................... 11
Indices of Deprivation map ....................................................................................... 12
Out of Work Benefits ................................................................................................ 13
Crime and Antisocial Behaviour ............................................................................... 14
Contact details ......................................................................................................... 15

Westbrook Ward Profile 2015
Warrington Borough Council Page 3 of 15
Introduction This profile sets out the key demographic data for Westbrook from the 2011 Census and later sources. Westbrook is one of 22 wards within Warrington. In the map below, the wards of Warrington are outlined in black and Westbrook is the area shaded blue. All data within the profile is provided from the Office for National Statistics unless otherwise stated (source: Office for National Statistics licensed under the Open Government License v.2.0). Figures may not sum to 100% due to rounding.

Westbrook Ward Profile 2015
Warrington Borough Council Page 4 of 15
Westbrook measures 436.45 hectares and at the time of the 2011 Census was home to 14.80 persons per hectare. By comparison, the average figure for Warrington was 11.20 persons per hectare.
Geographical area, land only measurements Density (census)
2013 2011
hectares persons per hectare
Westbrook 436.45 14.80
Warrington 18,065.98 11.20
Population The latest midyear estimates suggest that there were 6,419 people living in Westbrook in 2013, and Census 2011 indicated that the area contained 2,449 households. In 2011 the average size of household in Westbrook was 2.60 people per household, compared with a Warrington average of 2.30 people per household.
Number of all households
Average household size
Total resident population
2011 2011 2013
households people per household people
Westbrook 2,449 2.60 6,419
Warrington 85,140 2.30 205,100
According to the midyear population estimates, 50.2% of Westbrook residents were female and 49.8% were male. Residents from black and minority ethnic (BME) groups formed 7.9% of Westbrook's population, compared with 4.1% for Warrington.
Percentage Of all usual residents -
female
Percentage Of all usual residents -
male BME population (%)
2013 2013 2011
% % %
Westbrook 50.2 49.8 7.9
Warrington 50.4 49.6 4.1

Westbrook Ward Profile 2015
Warrington Borough Council Page 5 of 15
According to the 2013 midyear population estimates, 18.2% of residents in Westbrook were aged under 16 compared with the Warrington average of 19.1%. 69.6% were aged 16 to 64 compared with the Warrington average of 63.8%. Amongst the older population, 12.2% of residents in Westbrook were aged 65+, compared with a Warrington average of 17.1%.
Housing Tenure In Westbrook at the time of the 2011 Census, the main housing tenure type was 'Households owned with a mortgage or loan' (56.6%). Across Warrington the main housing tenure type was also 'Households owned with a mortgage or loan' (39.6%).

Westbrook Ward Profile 2015
Warrington Borough Council Page 6 of 15
Health According to Public Health England data, men in Westbrook are expected to live for 76.9 years on average, and women for 80.0 years. This compares with an average of 78.1 years for men across Warrington and 81.8 years for women across Warrington. Life expectancy at birth for men across England is currently 78.9 years and for women it is 82.8 years.
55.2% of residents in Westbrook reported their health as 'very good' and 30.5% reported it as 'good' in the 2011 Census. This compares with figures of 49.8% and 32.7% respectively amongst residents across Warrington overall.

Westbrook Ward Profile 2015
Warrington Borough Council Page 7 of 15
Under the National Child Measurement Programme, a child is classed as obese if they fall within the top 5% for Body Mass Index on the 1990 national child growth charts for a child of their sex and age. According to the Programme, 5.6% of Westbrook children measured in Reception year between the academic years 2012/13-2014/15 were obese, compared with 7.9% across Warrington and 9.3% across England. Amongst Year 6 children measured, 15.3% were classed as obese in Westbrook, compared with 16.4% for Warrington and 19.0% for England.
Obese children in reception year (%) Obese children in year 6 (%)
2011/12-2013/14 (academic)
2012/13-2014/15 (academic)
2011/12-2013/14 (academic)
2012/13-2014/15 (academic)
Westbrook 6.5% 5.6% 16.2% 15.3%
Warrington 8.2% 7.9% 17.9% 16.4%
England 9.4% 9.3% 19.1% 19.0%
Childhood obesity has decreased in Westbrook over time, which is in line with the Warrington and England trends. Between 2011/12 and 2013/14 in reception year 6.5% of Westbrook children were obese, compared with 8.2% across Warrington and 9.4% across England. In Year 6 over the same period, 16.2% were classed as obese in Westbrook, compared with 17.9% for Warrington and 19.1% for England.
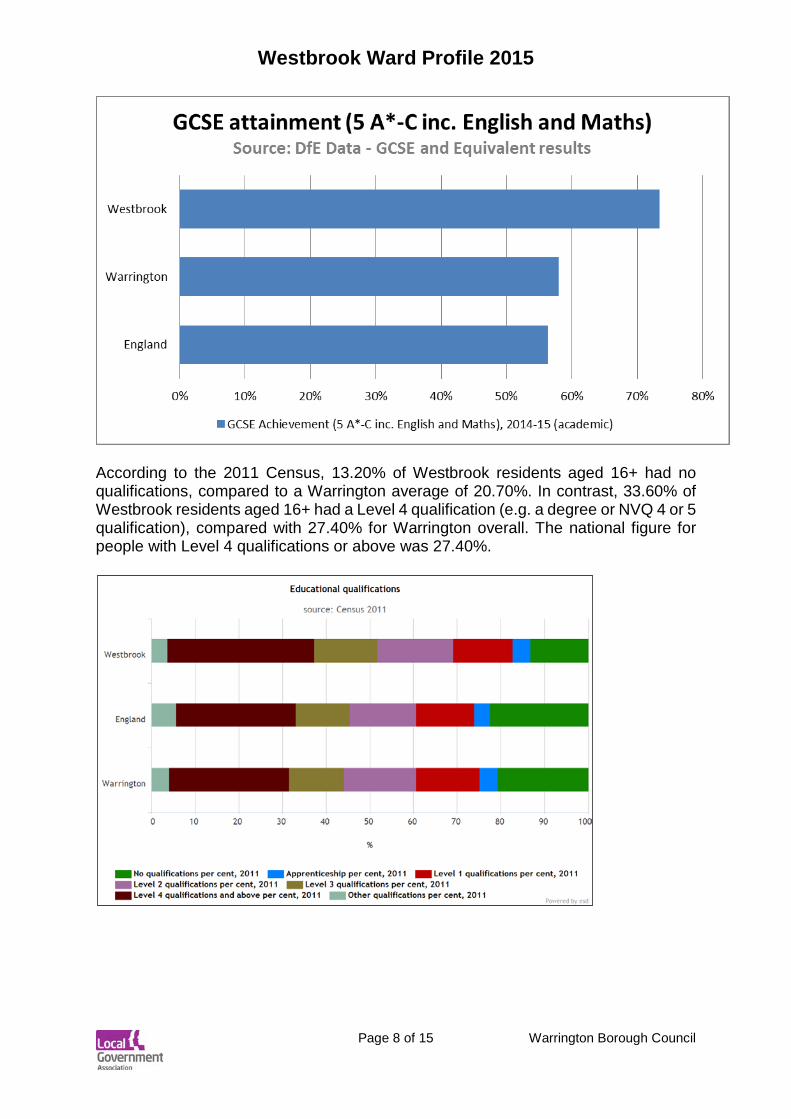
Education and Skills In summer 2015, 73.4% of pupils living in Westbrook achieved at least 5 GCSE passes at grades A*-C (including English and Maths). This compares with a Warrington average of 57.9%, and an England average of 56.3%.
Westbrook Ward Profile 2015
Warrington Borough Council Page 8 of 15
According to the 2011 Census, 13.20% of Westbrook residents aged 16+ had no qualifications, compared to a Warrington average of 20.70%. In contrast, 33.60% of Westbrook residents aged 16+ had a Level 4 qualification (e.g. a degree or NVQ 4 or 5 qualification), compared with 27.40% for Warrington overall. The national figure for people with Level 4 qualifications or above was 27.40%.

Westbrook Ward Profile 2015
Warrington Borough Council Page 9 of 15
Economic Activity According to the Census, 49.40% of Westbrook residents aged 16+ were employed full-time in 2011, compared with 42.70% for Warrington. A total of 2.80% were unemployed in Westbrook, compared with 4.00% for Warrington. In Westbrook 2.90% were long-term sick or disabled (4.10% across Warrington).
Westbrook Warrington
2011 2011
% %
Employee: Full time per cent 49.40 42.70
Employee: Part time per cent 15.30 14.60
Full time student per cent 3.50 3.00
Long-term sick or disabled per cent 2.90 4.10
Looking after home or family per cent 2.30 3.30
Retired per cent 10.70 14.80
Self-employed per cent 8.20 7.80
Student (including full-time students) per cent 3.80 3.60
Unemployed per cent 2.80 4.00
Other economically inactive per cent 1.20 2.10
Long-term unemployed per cent 0.80 1.50

Westbrook Ward Profile 2015
Warrington Borough Council Page 10 of 15
In 2011, the main occupational group amongst employed residents in Westbrook was Professional occupations (22.34%, compared with 18.10% for Warrington). In Warrington the main occupational group was Professional occupations (18.10%, compared with 22.34% in Westbrook). Across England the main occupational group was Professional occupations (17.49%).
Deprivation The Indices of Deprivation 2015 provide a set of relative measures of deprivation for small areas (Lower-layer Super Output Areas) across England, based on seven different domains of deprivation: Income Deprivation, Employment Deprivation, Education, Skills and Training Deprivation, Health Deprivation and Disability, Crime, Barriers to Housing and Services, Living Environment Deprivation. Each of these domains is based on a basket of indicators. As far as is possible, each indicator is based on data from the most recent time point available; in practice most indicators in the Indices of Deprivation 2015 relate to the tax year 2012/13.
Combining information from the seven domains produces an overall relative measure of deprivation, the Index of Multiple Deprivation. In addition, there are seven domain-level indices, and two supplementary indices: the Income Deprivation Affecting Children Index and the Income Deprivation Affecting Older People Index.
There are 32,844 small areas (Lower Super Output Areas or LSOAs) in England, each with an average of 1,500 residents. The Index of Multiple Deprivation ranks every small area in England from 1 (most deprived area) to 32,844 (least deprived area). This can be expressed as a ‘national rank percentile’ (where 0% is the most deprived and 100% is the least deprived). It is common to describe how relatively

Westbrook Ward Profile 2015
Warrington Borough Council Page 11 of 15
deprived a small area is by saying whether it falls among the most deprived 10 per cent, 20 per cent or 30 per cent of small areas in England (although there is no definitive cut-off at which an area is described as ‘deprived’). The table below and map on the following page shows how small areas in Warrington compare for Multiple Deprivation. On the map the small areas coloured red are those with the most deprivation and small areas coloured dark green are those with the least deprivation. In the table each small area is presented alongside the national rank out of 32,844 small areas and the corresponding national rank percentile. For more information: https://www.gov.uk/government/statistics/english-indices-of-deprivation-2015
Indices of Deprivation table
Source: Indices of Multiple Deprivation 2015, Communities and Local Government, Crown Copyright 2015. Adapted from CLG under the Open Government Licence v3.0
Westbrook WardDeprivation Domain E01012561 E01012562 E01012563 E01012564Index of Multiple Deprivation Rank 20,420 27,677 30,408 17,149
Index of Multiple Deprivation Percentile 62 84 93 52
Income Rank 17,311 31,528 29,468 20,106
Income Percentile 53 96 90 61
Employment Rank 18,183 27,508 24,145 13,889
Employment Percentile 55 84 74 42
Education Skills & Training Rank 23,883 26,856 30,441 25,318
Education Skills & Training Percentile 73 82 93 77
Health Deprivation and Disability Rank 8,316 19,759 23,726 3,841
Health Deprivation and Disability Percentile 25 60 72 12
Crime Rank 25,046 20,560 27,873 12,943
Crime Percentile 76 63 85 39
Barriers to Housing and Services Rank 29,127 8,925 21,903 29,749
Barriers to Housing and Services Percentile 89 27 67 91
Living Environment Rank 20,148 28,813 27,961 27,537
Living Environment Percentile 61 88 85 84
Income Deprivation Affecting Older People Rank 7,186 31,364 28,096 14,309
Income Deprivation Affecting Older People Percentile 22 95 86 44
Income Deprivation Affecting Children Rank 23,730 31,270 26,268 28,789
Income Deprivation Affecting Children Percentile 72 95 80 88
Lower Layer Super Output Area Code

Westbrook Ward Profile 2015
Warrington Borough Council Page 12 of 15
Indices of Deprivation map

Westbrook Ward Profile 2015
Warrington Borough Council Page 13 of 15
Out of Work Benefits Data from the Department for Work and Pensions show that in August 2015 there were 1,620 residents in Warrington claiming Job Seeker's Allowance (JSA) representing 1.1% of the population aged 16 to 64 years.
It is estimated that of these, 25 were living in Westbrook Ward, representing 0.6% of the population aged 16 to 64 years. The ward ranked 19 across the 22 wards of Warrington for JSA claims (where 1 is the worst-performing).
It should be noted that JSA claimant rates are falling, as claims to Universal Credit increase. Details of Universal Credit claims are not available at ward level.
In February 2015 there were 10,750 residents in Warrington claiming out of work benefits, representing 8.2% of the population aged 16 to 64 years. It is estimated that of these, 230 were living in Westbrook Ward, representing 5.1% of the population aged 16 to 64 years. The ward ranked 16 across the 22 wards of Warrington for out of work benefits (where 1 is the worst performing).
Area
Total JSA claimants Out of work benefit claimants
August 2015 February 2015
people % rate people % rate
Westbrook 25 0.6 230 5.1
Warrington 1,620 1.1 10,750 8.2 Source: Department for Work and Pensions via https://www.nomisweb.co.uk Note: % is a proportion of resident population mid 2013 aged 16 to 64 years Main out-of-work benefits include the groups: job seekers, ESA and incapacity benefits, lone parents and others on income related benefits. Note: The most up to date figures are available via https://www.nomisweb.co.uk Ward labour market profiles are also available and regularly updated via Nomis: here

Westbrook Ward Profile 2015
Warrington Borough Council Page 14 of 15
Crime and Antisocial Behaviour According to data from the Warrington Community Safety Partnership, the All Crime rate measured per 1,000 residents has increased sharply in Westbrook ward over the last year, and is now above the Warrington average. In 2014/15 there were 54.4 crimes per 1,000 residents within the ward, compared with 53.1 crimes per 1,000 residents across Warrington overall.
The rate of Antisocial behaviour (ASB) per 1,000 residents has declined in Westbrook during 2014. Within the year there were 30.8 ASB incidents per 1,000 ward residents reported to the Community Safety Partnership, compared with 40.9 incidents per 1,000 residents across Warrington overall.
49
50
51
52
53
54
55
56
57
2013/14 2014/15
All Crime 2013/14 - 2014/15 (incidents per 1,000 population)
Warrington
Westbrook
Source: Warrington Community Safety
Partnership
05
101520253035404550
2013/14 2014/15
Antisocial Behaviour 2013/14 - 2014/15 (incidents per 1,000 population)
Warrington
Westbrook
Source: Warrington Community Safety
Partnership

Westbrook Ward Profile 2015
Warrington Borough Council Page 15 of 15
Contact details
Your views on the ward profile
We welcome your feedback, so please tell us how we can improve these new style ward profiles by emailing [email protected]
• Is there any information missing from the profiles that you would wish to see
included?
• Is the information on the profiles easy to understand?
• Is there the right balance between graphs/maps/tables and text/analysis?
Warrington Borough Council
Resources and Strategic Commissioning
Customer Insight Team
4th Floor Quattro
Buttermarket Street
Warrington
WA1 2NH
www.warrington.gov.uk