West Yorkshire Finding Independence: an Impact and Value ... · 3.5. Summary This chapter has...
35
Transcript of West Yorkshire Finding Independence: an Impact and Value ... · 3.5. Summary This chapter has...


West Yorkshire Finding Independence: an Impact and Value for Money Assessment
Authors:
Ian Wilson
Rich Crisp
July 2020

Acknowledgements
The authors would like to thank Mark Crowe, Anthony Leeman and Geoff Doyle at Humankind for consistent help and support in producing the analysis underpinning this report. This was a genuinely co-produced element of the evaluation.

Contents
Executive Summary .................................................................................................................... i
1. Introduction......................................................................................................................... 1
2. WY-FI beneficiaries and the support they received ........................................................... 7
3. Outcomes achieved by beneficiaries ............................................................................... 13
4. Impact on use of services................................................................................................. 18
5. Recommendations ............................................................................................................ 28

Centre for Regional Economic and Social Research | i
Executive Summary
This report provides an Impact and Value for Money (VFM) assessment of the West Yorkshire Finding Independence (WY-FI) programme. It considers the service's cost (Inputs); the number of people it has supported and the support it has provided (the Outputs and Activity); and the difference this support has made (the Outcomes) as well as calculating cost efficiency and cost effectiveness. Key findings include:
• It is estimated that total WY-FI expenditure from January 2014 to the end of December 2019 was £9,426,000. Just under two thirds of this comprises staffing costs.
• By the end of December 2019, 822 beneficiaries had started on the WY-FI service; of whom 28 had two starts and one had three separate starts. This is greater than the revised target of 800.
• The average cost per beneficiary is £11,467. This represents the cost efficiency of the WY-FI service.
• All WY-FI beneficiaries displayed multiple and complex needs. The majority of beneficiaries (56 per cent) were identified as having all four HARM needs: Homelessness, Addiction, Re-offending and Mental Ill Health. A further 39 per cent had three needs. In additional a third of beneficiaries (275 beneficiaries) identif ied as having a long-term health problem or disability.
• Substantial support has been provided to most beneficiaries over a sustained period of time. On average WY-FI beneficiaries received 4.3 different forms of support (out of nine possible forms). Analysis of time in the Navigator caseload reveals on average beneficiaries had received support for over 537 days (approximately 18 months).
• A majority of beneficiaries achieved positive progression across a range of outcomes. These included:
- 426 beneficiaries who had a planned exit (57 per cent of exited beneficiaries); the average cost per beneficiary who had a planned exit is £22,217.
- Average HOS scores improved 12 points between their baseline and last/latest assessments; from 28 points to 40 points. At an individual beneficiary level, 67 per cent had an improvement in their HOS score. The average cost per beneficiary who has an improved HOS score is £17,176.
- Average NDTA scores improved nine points between their baseline and last/latest assessments: from 35 points to 26 points (where a lower score implies an improvement). Fully 74 per cent of beneficiaries reported an improvement. The average cost per beneficiary who had an improved NDTA score was £15,461.
• Overall WY-FI is found to increase its beneficiaries' wider service use costs. The expected increase in service costs is £5,584 per beneficiary over six quarters compared to the baseline. This implied for every £1 of WY-FI expenditure there is a further £0.49 in wider service costs.

Centre for Regional Economic and Social Research | ii
• However this needs be put into context:
- Service usages with increased costs tend to be positive treatment services. Many of these will be to address previously untreated conditions. These costs will reduce over time and are likely to prevent longer-term, often more expensive and reactive, service usages.
- Increased costs were identified despite beneficiaries reporting positive outcomes on other metrics, for example HOS and NDTA scores. This suggests that improvements in HOS and NDTA scores have been achieved because of the increases in wider service use costs. Therefore cost increases, at least in the short term, should be seen as a positive, rather than a negative, effect of WY-FI.
- Ensuring beneficiaries achieve a planned exit is important to limit or reduce costs. Analysis revealed that average service usage costs increased by a far greater amount for beneficiaries with an unplanned exit (£7,813) compared to beneficiaries who had a planned exit (£2,543). However this also shows that achieving a planned exit is still associated with some increased service use costs beyond the WY-FI service, to address beneficiary needs and promote independence.
- Finally, addressing factors which may lead to a prison stay should be prioritised. More detailed analysis identif ied a large difference in the increase in service use costs between beneficiaries who recorded a prison stay after starting on WY-FI compared to those who did not: £10,624 and £515.
Centre for Regional Economic and Social Research | 1
1 1. Introduction
1.1. Introduction
The National Lottery Community Fund (formerly known as The Big Lottery) has invested up to £112m in 12 areas of England to improve the lives of people with multiple and complex needs. The programme seeks to achieve the following outcomes:
• People with multiple needs are better able to manage their lives through access to more person-centred and co-ordinated services.
• Services are more tailored and better connected and will empower users to fully take part in effective service design and delivery.
• Shared learning and the improved measurement of outcomes for people with multiple needs will demonstrate the impact of service models to key stakeholders.
The West Yorkshire Finding Independence (WY-FI) project has been funded through
this Programme. It focuses on adults with at least three needs including homelessness, re-offending, problematic substance misuse and mental ill health and who are also disengaged from services. The intention is to work with 800 individuals over six years across West Yorkshire with the highest number of beneficiaries in Leeds and the lowest in Calderdale reflecting the geographical pattern of need. The aim is to join up existing provision for the client group.
The vision for the WY-FI project is that by 2020, adults with complex needs in West Yorkshire should have the opportunity of a settled home, positive health and wellbeing, access to education and employment and trust in a positive future.
Launched in May 2014, the key aim of WY-FI is to improve partnership working and achieve a 'system change' in the way in which people with multiple and complex needs are supported in West Yorkshire. It is based around a core model compromising the following key elements:
• A Regional Support Hub based in Leeds.
• Navigator teams based in the five districts to ensure beneficiaries can access the support they need.
• Multi-Agency Review Boards (MARBs) to facilitate multi-agency case conferencing, improve the co-ordination of service delivery, and ensure services are delivered in a personalised and flexible fashion.
• An Employment, Training and Education (ETE) Team delivering a Peer Mentor course as a pathway into volunteering or paid work.
• Peer Mentors to provide support to beneficiaries and show that positive change is possible.

Centre for Regional Economic and Social Research | 2
• Co-production with beneficiaries.
• Advocacy and Prison Engagement workers (in post between 2014 and 2017).
In 2014 the Centre for Regional Economic and Social Research (CRESR) at Sheffield
Hallam University was commissioned as an evaluation partner to the WY-FI project. The evaluation has been co-produced between CRESR and the central WY-FI evaluation team and contains both formative and summative elements. This briefing report focuses on one strand of the evaluation: to test and quantify the impact of WY-FI on service use by its beneficiaries.
A key aim of the evaluation is to assess the impact and Value for Money of the WY-FI service on its beneficiaries. Implicit in this question is whether the service has led to reduced costs by reducing use of services such as accident and emergency attendances or frequent arrest. The results from this strand of the evaluation are central to the WY-FI securing longer-term funding, as well as informing the financial mechanisms to fund it.
The analysis is based on an Impact and Value for Money (VFM) framework rooted in the Treasury's Green Book principles1. It includes reporting the service's cost (Inputs); the number of people it has supported and the support it has provided (the Outputs and Activity); and the difference this support has made (the Outcomes) as well as calculating cost efficiency and cost effectiveness. In simple terms:
• cost efficiency is the average cost of the support provided to beneficiaries;
• cost effectiveness is the average cost per outcome achieved.
Ultimately it is possible to put a monetary value on the change in service use to provide a Benefit Cost Ratio. The Benefit Cost Ratio shows for every pound spent what the impact has been on the cost of wider services used.
However it is important to note that the outcomes analysis presented in this report is based on change data for beneficiaries. It has not been possible to access a counterfactual sample to improve the assessment of additionality. This means all change between responses has been attributed to the WY-FI programme. In reality some of this change may have occurred anyway.
The next section summarises the data and methods that underpin the analysis. This includes the costing model developed for this evaluation that underpins the analysis.
1.2. Data and methods
This section covers data and methods that are central to the analysis presented in this report. It includes:
• Homelessness Outcome Star assessments
• New Direction Team Assessment (the Chaos Index)
• and the costing model which underpins the service use analysis.
1 HM Treasury (2003) The Green Book: Appraisal and Evaluation in Central Government. London, TSO. http://www.hm-treasury.gov.uk/d/green_book_complete.pdf

Centre for Regional Economic and Social Research | 3
Homelessness Outcome Star
Homelessness Outcome Stars have been used by WY-FI to support and evidence change when working with clients. The Star was originally developed by Triangle Consulting for St Mungo's. It has developed through ‘bottom up’ processes, rooted in an understanding of the nature of change. It is therefore meaningful to both beneficiaries and workers, supporting the delivery of services, as well as providing robust outcomes data that reflects the aims, objectives and activities of services.
The Homelessness Outcome Star is a keyworker tool: it supports the beneficiary in making changes by providing them with a map of the journey of change and a way of plotting progress and planning the actions they need take. It focuses on 10 core areas (listed below) that have been found to be critical in supporting people to move away from homelessness:
• motivation and taking responsibility
• self-caring and living skills
• managing money and personal administration
• social networks and relationships
• drug and alcohol misuse
• physical health
• emotional and mental health
• meaningful uses of time
• managing tenancy and accommodation
• offending.
Five broad stages are identif ied against each area, reflecting the process by which people make changes in the areas of their life which aren't working. The five stages are: stuck, accepting help, believing, learning and self -reliance. Within each stage there are two levels which combine to create a ten point scale. On this scale '10' indicates that they are managing well and do not currently require any support. Conversely a score of '1' implies they have a problem in the area but they are completely ignoring it and letting it get worse.
The process of completing the Stars involves the worker and beneficiary discussing the ten areas and deciding where they feel the beneficiary is on the 10 point scale. This is not an exact science and will depend on the beneficiary and how they see their journey of change.
Analysis of Homeless Outcome Star data illustrates in broad term the multifaceted needs of beneficiaries and the support required to facilitate the journey towards independence which lies ahead.
The New Directions Team Assessment "Chaos Index"
The Chaos Index was originally developed by the New Directions Team in the London Borough of Merton, which was one of 12 pilots from the national Adults Facing Chronic Exclusion (ACE) Programme. It was developed to identify individuals or groups to target. The initial phase of development was to understand the different perspectives of the multi-agency steering group and who the tool would be serving; this included for example Primary Care, Housing, the Police, Jobcentre Plus and the volunteer bureau. A review was then undertaken of the research evidence about the characteristics frequently identified with people who have chaotic lives. This identified 10 areas:
Centre for Regional Economic and Social Research | 4
• engagement with frontline services
• intentional self -harm
• unintentional self -harm
• risk to others
• risk from others
• stress and anxiety
• social effectiveness
• alcohol/drug abuse
• impulse control
• housing.
Within each area a five point scale was set out against which to assess the beneficiary. These are then combined to create an overall index score. Eight of the areas are scored on a scale from '0' to '4', whereas two areas - 'risk to others' and 'risk from others' - are on a scale running 0, 2, 4, 6, 8. In each case the lowest score reflects there are no concerns. Conversely the highest score indicates a lacking, severe level or immediate risk within the given area. Summing across the 10 areas provides a score running from '0' (the lowest level) to '48' (the highest level) on a spectrum of chaos in the life of the beneficiary.
The costing model
Central to the analysis of impact and VFM has been the development of a costing model that is able to quantify and monetise the impact of WY-FI on its beneficiaries. Since January 2016 the WY-FI project has collected quarterly instances of service use across 18 areas:
• evictions
• arrests
• police cautions
• nights spent in police custody
• magistrates court proceedings
• crown court proceedings
• convictions
• nights in prison
• presentations at Accident and Emergency
• outpatient attendances
• hospital inpatient episodes
• face to face contacts with Community Mental Health Teams
• counselling or psychotherapy sessions
• mental health service out-patient attendances
• days spent as a mental health service inpatient
• face to face contacts with drug / alcohol services

Centre for Regional Economic and Social Research | 5
• days spent in inpatient detoxification
• weeks spent in residential rehabilitation.
Beneficiaries are asked to self -report the number of times that they have experienced
each of the 18 types of service use in the previous quarter. The latest data that are available cover the period to the end of December 2019. However the costing model only considers change in service use (and therefore cost savings) from a baseline to a seven quarter period because few beneficiaries have completed more than this number of data returns. In total data are available for 310 beneficiaries who have had at least two recorded quarters of service use data and who entered the Navigator caseload post January 2016.
Although the model is based on service use data for up to 310 beneficiaries, where stated its results have been scaled up to show the results for all 823 expected WY-FI beneficiaries – bearing in mind that the savings to the public purse shown are only for seven quarter's worth of engagement for each of them.
There are two main stages in the development of the costing model: calculating change in service use and determining unit costs for each type of service use that can be applied to the former.
Each beneficiary's data is first ordered by quarter number, rather than by date. Average propensities per quarter per beneficiary are then calculated for each service use event type. This is the expected number of incidents for any given beneficiary in that quarter. The analysis then compares change in propensities in the first quarter, which is taken to be a baseline, against propensities for each of the next seven quarters (where service use data are available). So the average propensity for quarter one is compared to the average propensity for quarter two, then the average propensity for quarter one is compare to the average propensity for quarter three and so on until quarter one is compared against quarter eight - in the current iteration of the model.
Implicit in the method is the assumption that all change in service usage is additional and is attributed to the WY-FI service. There had been an aspiration among Humankind and CRESR to draw on the work of the national evaluation of the Fulfilling Lives programme to develop a counterfactual to the programme using Making Every Adult Matters (MEAM) areas. However, despite best efforts this approach has was not been able to provide the necessary robust evidence to inform the cost model. Issues include: the Fulfilling Lives beneficiary group having significantly higher needs compared to other populations; only a small number of counterfactual individuals could be identif ied; and considerable data access issues to enable an analysis over a similar set of service use outcomes.
To scale this up to overall change in service use (i.e. the overall fewer/additional instances of each beneficiary per quarter) the expected beneficiary caseload - 834 beneficiaries - is applied to the change in propensities. These amounts are then multiplied by unit costs for each type of service use event to give cost savings.
Unit costs for each of the 18 service use types have been obtained from the Cabinet Office/New Economy Cost Calculator database. These values have then been put into 2019/20 prices using Treasury GDP deflators. This adjusts the value of benefits for when they are likely to emerge based on the caseload profile over time. Adjustments are also made for optimism bias (due to beneficiary self-reporting of outcomes) using Cabinet Office/New Economy Cost Calculator assumptions.

Centre for Regional Economic and Social Research | 6
1.3. WY-FI service costs
It is estimated that expenditure from January 2014 to the end of December 2019 was £9,426,000.
This has been computed based on an actual expenditure of £8,184,000 in the five financial years ending March 2019. Added to this is a pro-rata of the projected expenditure for year six for the nine months to the end of December 2019 (giving an additional £1,242,000 in expenditure over the nine months) .
Further analysis of year five expenditure (i.e. the financial year 2018/19) reveals staffing costs of £986,000, accounting for 63 per cent of the total spend in that year. Given there were 46.20 Full Time Equivalent (FTE) staff this implies an average staff cost of £21,300 per FTE.
The cost of the WY-FI service is used throughout this report to compute the average cost of working with beneficiaries, the average cost per outcome and as part of a comparison of monetised benefits to cost. In these calculations it should be noted that the cost figure represents the total reported expenditure, including both delivery and non-delivery specific costs. Many non-delivery specific costs - such as those for local evaluation and partnership development - would not be part of a 'mainstreamed' version of the WY-FI service. Also the funding from the National Lottery Community Fund gave freedoms to 'test and learn', facilitate the development of partnerships and capacity building, and enable more resource intensive activity with those who need it.

Centre for Regional Economic and Social Research | 7
2 2. WY-FI beneficiaries and the support they received
2.1. Introduction
This chapter examines:
• the number of beneficiaries who started on the WY-FI service and how this compares against the target number
• the average cost of WY-FI per beneficiary (the cost efficiency of WY-FI)
• the characteristics of beneficiaries
• the activities and support undertaken by beneficiaries.
2.2. Beneficiaries starting on the WY-FI service
By the end of December 2019, 822 beneficiaries had started on WY-FI service; of whom 28 had two starts and one had three separate starts. This is greater than the revised target number of beneficiaries: 800. By December 2019, only 86 beneficiaries were still active with the service, whereas 736 beneficiaries had exited.
Analysis by locality reveals Leeds (240 starts) and Bradford (195 starts) accounted for 53 per cent of beneficiaries. Calderdale had 145 starts, Wakefield had 135 starts and Kirklees had 107 starts.
2.3. The average cost of WY-FI per beneficiary
The average cost - or cost efficiency - of WY-FI per beneficiary is calculated by comparing the service's expenditure to the number of beneficiaries who started on the service over the same timeframe. This gives:
£11,467 = the cost per beneficiary2
This average cost is lower (better) than the expected average cost agreed with the National Lottery Community Fund (£11,783), which is based on achieving the revised target of 800 beneficiaries. In year five approximately nine per cent was accounted for by evaluation and research costs. Excluding this amount from the
2 Note the average cost per start on WY-FI is £11,076. This is lower because 28 service users had two starts and one service user had three starts.

Centre for Regional Economic and Social Research | 8
average cost efficiency calculation provides a cost efficiency of £10,451 per service user.
2.4. The characteristics of beneficiaries
This section considers the characteristics of beneficiaries who have benefited from the WY-FI service. It includes the HARM needs that they exhibit when they first engage with the WY-FI service and their socio-demographic characteristics.
HARM Needs
The majority of beneficiaries (56 per cent) had all four HARM needs (Homelessness, Addiction, Re-offending and Mental Ill Health). A further 39 per cent had three needs. Just five per cent had either one (0.4 per cent) or two (five per cent) needs. The following shows the proportion of beneficiaries with each need (Figure 2.1):
• 97 per cent (799 beneficiaries) had Addiction needs
• 97 per cent (794 beneficiaries) had Mental Ill Health needs
• 80 per cent (660 beneficiaries) had Reoffending needs
• 77 per cent (631 beneficiaries) had Homelessness needs.
Figure 2.1: HARM needs reported by beneficiaries
Socio-demographics characteristics
This section briefly summarises the socio-demographic characteristics of the 822 beneficiaries who had started on the WY-FI service by the end of December 2019.
77
80
97
97
0 20 40 60 80 100 120
Homelessness
Reoffending
Mental ill-health
Addiction
Percentage of service users

Centre for Regional Economic and Social Research | 9
Males (64 per cent; 526 beneficiaries) comprised almost double the number of beneficiaries compared to females (36 per cent; 296 beneficiaries).
The average age of beneficiaries was 38 years. Further analysis reveals most beneficiaries were aged between 25 and 54 years of age:
• nine per cent were aged less than 24 years (73 beneficiaries)
• 29 per cent were aged 25 to 34 years (242 beneficiaries)
• 36 per cent were aged 35 to 44 years (293 beneficiaries)
• 20 per cent were aged 45 to 54 years (166 beneficiaries)
• four per cent were aged 55 to 64 years (32 beneficiaries)
• two per cent were aged 65 years or over (16 beneficiaries).
Of the 705 beneficiaries who gave an ethnicity: 83 per cent were White British or Irish; five per cent identif ied as being from a 'White Other' ethnic group, which will include most European migrants; and 11 per cent were identif ied as being BAME.
Finally a third of beneficiaries (275) identified as having a long-term health problem or disability.
2.5. The support provided to beneficiaries
The support provided to beneficiaries by the WY-FI service was recorded during their time in the Navigator caseload. Figure 2.2 summarises this support; for simplicity support types have been grouped by nine broad categories. The most commonly received forms of support were:
• Advice and information (83 per cent); this includes advice for legal and criminal justice, housing, welfare, personal care and addictions.
• Health-related support (78 per cent); including GP, in- and out-patient treatment, community support and self -help and support group attendance.
• and substance misuse support (70 per cent); including rehab, detox and use of support workers.
On average WY-FI beneficiaries received 4.3 different forms of support. Interestingly the average number is lower amongst those who had exited the service (4.1 forms of support) compared to those who were still receiving support (6.2 forms of support). However, these averages hide considerable variation across beneficiaries. Twenty two per cent of beneficiaries had received seven or more of the nine forms of support, whereas 18 per cent received one or none of the forms of support.

Centre for Regional Economic and Social Research | 10
Figure 2.2: Support received by beneficiaries
2.6. Time in the WY-FI navigator caseload
Analysis of time in the Navigator caseload reveals on average beneficiaries had received support for over 537 days (approximately 18 months). When the analysis is limited to those who had exited the service the average is lower: 505 days (just under 17 months). Unsurprisingly these averages mask a wide variation. Figure 2.3 shows:
• 14 per cent of beneficiaries had received six months of support or less.
• A further 25 per cent had received six to 12 months of support.
• At the other end of the spectrum nine per cent had received over three years of support.
29
35
36
38
38
45
70
78
83
0 10 20 30 40 50 60 70 80 90
Social care
Activities
Counselling and therapies
Mentoring and befriending
Education and training
Personal budgeting
Substance misuse support
Health related
Advice and information
Percentage of service users

Centre for Regional Economic and Social Research | 11
Figure 2.3: Time in the WY-FI navigator caseload
2.7. Summary
This chapter has considered who has benefited from the WY-FI service and the support that they have received. The following points emerged:
• By the end of December 2019, 822 beneficiaries had started on WY-FI service; of whom 28 had two starts and one had three separate starts. This is above WY-FI's revised target of 800 beneficiaries.
• Comparing the number of beneficiaries to the cost of the service gives an average cost per beneficiary of £11,467. In evaluation terms this is the cost efficiency of WY-FI. This average cost is less than the (i.e. better) expected cost based on supporting 800 beneficiaries.
• The majority of beneficiaries (56 per cent) were identified as having all four HARM needs: Homelessness, Addiction, Re-offending and Mental Ill Health. A further 39 per cent had three needs. In additional a third of beneficiaries (275) identified as having a long-term health problem or disability.
The most commonly received forms of support provided to beneficiaries were:
• Advice and information (83 per cent); this includes advice for legal and criminal justice, housing, welfare, personal care and addictions.
• Health-related support (78 per cent); including GP, in- and out-patient treatment, community support and self-help and support group attendance.
• And substance misuse support (70 per cent); including rehab, detox and use of support workers.
7
17
34
26
15
9
18
34
25
14
0 5 10 15 20 25 30 35 40
Over 3 years
2 years to 3 years
1 year to 2 years
6 months to 12 months
6 months or less
Percentage of service users
All service users
Exited service users

Centre for Regional Economic and Social Research | 12
On average WY-FI beneficiaries received 4.3 different forms of support (out of nine
possible forms). However, this masks considerable variation across beneficiaries:
• 22 per cent of beneficiaries had received seven or more forms of support.
• 18 per cent received one or none of the forms of support.
On average beneficiaries had received support for over 537 days (approximately 18 months). However:
• 14 per cent of beneficiaries had received six months support or less.
• A further 25 per cent had received six to 12 months of support.
• At the other end of the spectrum nine per cent had received over three years of support.

Centre for Regional Economic and Social Research | 13
3 3. Outcomes achieved by beneficiaries
3.1. Introduction
This chapter assesses outcomes achieved by beneficiaries and the cost effectiveness of the WY-FI service in supporting these outcomes3. The outcomes considered include:
• planned versus unplanned exits
• recording an improved Homelessness Outcome Star score
• recording an improved NDTA "Chaos Index" score.
3.2. Planned exits
By the 31st December 2019, 90 per cent of beneficiaries had exited the WYFI service. This includes:
• 426 beneficiaries who had a planned exit; 57 per cent of exited beneficiaries.
• 316 beneficiaries who had an unplanned exit; 43 per cent of exited beneficiaries.
Planned exits include: gaining independence, having external support networks in
place and moving to other support. Conversely unplanned exits include: prison, not being ready for support, refusing support and becoming deceased.
Based on the total expenditure of the WY-FI service (see Section 1.3) this implies:
£22,217 = the cost per beneficiary who has a planned exit
This is the cost effectiveness of WY-FI.
Excluding evaluation costs gives an average cost of £20,166 per beneficiary who has a planned exit.
3 As stated in the introduction, some of this change will be attributable directly to WY-FI but other factors may also
have contributed to the positive outcomes noted in this chapter. Without a more scienti fic approach to assessing
additionality, to assess the counterfactual, it is not possible to attribute outcomes to WY-FI with a high degree of confidence and rigor.

Centre for Regional Economic and Social Research | 14
3.3. Homelessness Outcome Star
In total 686 beneficiaries completed more than one Homelessness Outcome Star (HOS) assessment. This includes 609 beneficiaries who had exited the service by the end of December 2019; 61 per cent of whom had a planned exit.
Analysis of responses reveals a statistically significant improvement between first and last/latest assessments. The average beneficiary HOS score improved 12 points between their baseline and last/latest assessments, from 28 points to 40 points.
Two thirds of beneficiaries (67 per cent) had an improvement in their HOS score; 14 per cent of beneficiaries recorded no change and for 20 per cent of beneficiaries their score worsened. Based on the total expenditure this implies the following cost effectiveness:
£17,176 = the cost per beneficiary who has an improved HOS score
Excluding evaluation costs this figure is £15,654.
Figure 3.1 shows how the average score on each of the 10 HOS domains compared at the first and last/latest assessment. Positive progression (a shift outwards) has been identif ied across all 10 areas, with average scores increasing by at least 1 point on the 10 point scale. The largest absolute increases were recorded on the following domains:
• managing tenancy and accommodation (1.5 point improvement)
• meaningful uses of time (1.3 point improvement)
• emotional and mental health (1.2 point improvement)
• drug and alcohol misuse (1.2 point improvement) areas.

Centre for Regional Economic and Social Research | 15
Figure 3.1: Average service user Homelessness Outcome Star scores at
baseline and last/latest assessment
Note: each tick mark implies one point on the 10 point scale, with the centre value being 1
3.4. New Directions Team Assessment (NDTA) 'Chaos Index'
Some 751 beneficiaries completed more than one NDTA. This includes 675 beneficiaries who had exited the service by the end of December 2019; 60 per cent of whom had a planned exit. Analysis of responses reveals a statist ically significant improvement between first and last/latest NDTA scores. On average beneficiaries’ NDTA scores improved nine points between their baseline and last/latest assessments: from 35 points to 26 points (where a lower score implies an improvement). This is statistically significant at a 0.001 level.
Analysis of individual beneficiary scores reveals 74 per cent had an improvement in their NDTA score; 13 per cent of beneficiaries recorded no change and for 13 per cent of beneficiaries their score worsened.
Based on the total expenditure of the WY-FI service this implies the following level of cost effectiveness:
£15,461 = the cost per beneficiary who has an improved NDTA score
Excluding evaluation costs this figure is £14,091.
Motivation &taking
reponsibility
Self Caring &Living Skills
Managing Money& Personal
Administration
Social Networks &Relationships
Drug & AlcoholMisuse
Physical Health
Emotional &Mental Health
Meaningful UsesOf Time
ManagingTenancy &
Accommodation
Offending
Baseline
Last/latest

Centre for Regional Economic and Social Research | 16
Figure 3.2 shows how the average score on each of the ten domains compares at the first and last/latest assessment4. Positive progression (a shift inwards towards the centre) has been identif ied across all ten domains, with average scores improving by at least 0.3 points on the six point scale. The largest absolute increases were recorded on the following domains:
• Unintentional harm (0.8 point improvement)
• Risk to others (0.8 point improvement)
• Housing (0.8 point improvement)
• Engagement with frontline services (0.7 point improvement)
• Stress and anxiety (0.7 point improvement).
Figure 3.2: Average beneficiary NDTA scores at baseline and last/latest assessment
Note: each tick mark implies one point on the six point scale, with the centre value being 0
3.5. Summary
This chapter has considered the outcomes achieved by beneficiaries. In summary it has highlighted the positive progression most beneficiaries have made across outcomes, in particular change in their HOS and NDTA scores.
4 To aid comparison ‘risk to others’ and ‘risk from others’ have been scored on a 0 to 5 s cale.
Engagement withfrontline services
Intentional selfharm
Unintentional selfharm
Risk to others
Risk from others
Stress andanxiety
Socialeffectiveness
Alcohol drugabuse
Impulse control
Housing
Baseline
Last/latest
Centre for Regional Economic and Social Research | 17
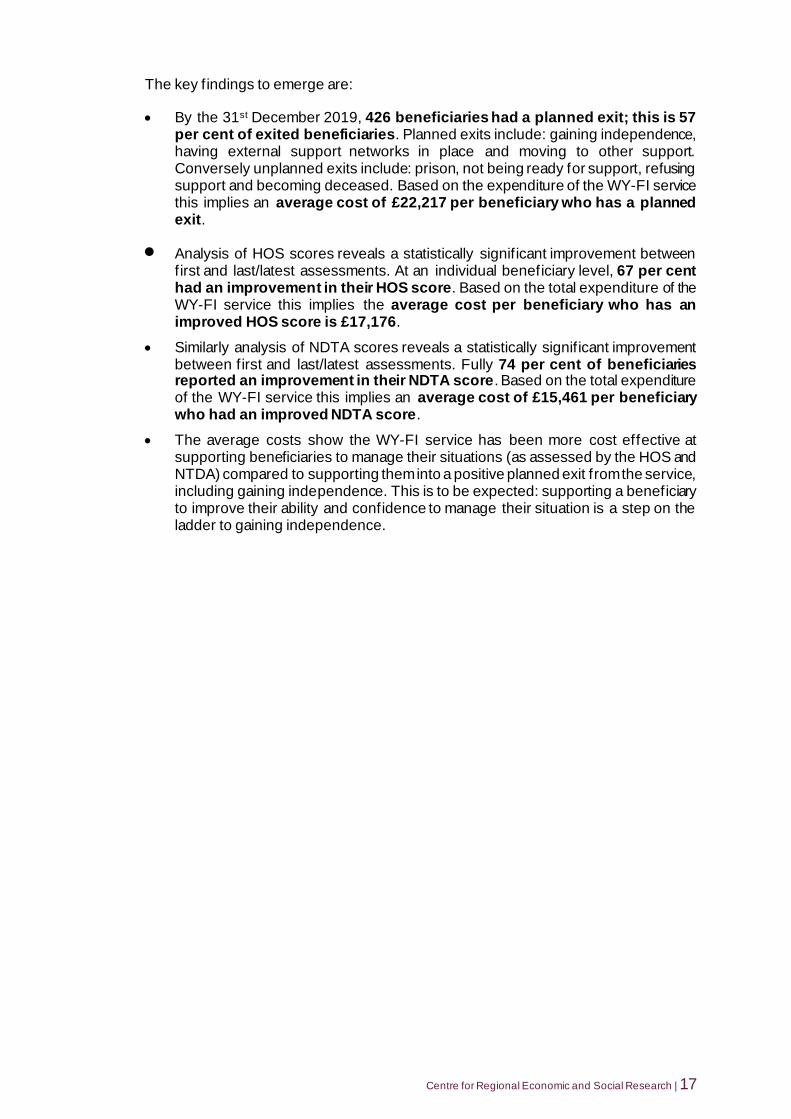
The key findings to emerge are:
• By the 31st December 2019, 426 beneficiaries had a planned exit; this is 57 per cent of exited beneficiaries. Planned exits include: gaining independence, having external support networks in place and moving to other support. Conversely unplanned exits include: prison, not being ready for support, refusing support and becoming deceased. Based on the expenditure of the WY-FI service this implies an average cost of £22,217 per beneficiary who has a planned exit.
• Analysis of HOS scores reveals a statistically significant improvement between first and last/latest assessments. At an individual beneficiary level, 67 per cent had an improvement in their HOS score. Based on the total expenditure of the WY-FI service this implies the average cost per beneficiary who has an improved HOS score is £17,176.
• Similarly analysis of NDTA scores reveals a statistically significant improvement between first and last/latest assessments. Fully 74 per cent of beneficiaries reported an improvement in their NDTA score. Based on the total expenditure of the WY-FI service this implies an average cost of £15,461 per beneficiary who had an improved NDTA score.
• The average costs show the WY-FI service has been more cost effective at supporting beneficiaries to manage their situations (as assessed by the HOS and NTDA) compared to supporting them into a positive planned exit from the service, including gaining independence. This is to be expected: supporting a beneficiary to improve their ability and confidence to manage their situation is a step on the ladder to gaining independence.

Centre for Regional Economic and Social Research | 18
4 4. Impact on use of services
4.1. Introduction
This section considers the following questions:
• What is the overall impact on WY-FI on wider service costs?
• How does the overall impact of WY-FI on wider service costs break down by type of service usage and agency?
• How does the impact on wider service costs change over time?
• How does the impact on wider service costs vary by beneficiary outcomes?
4.2. What is the overall impact of WY-FI on wider service costs?
Using the cost model set out in Section 1.2, it is predicted that the WY-FI service will lead to increased costs for wider statutory services of £4.596 million (in 2019/20 prices) over the six quarters following the baseline quarter (Figure 4.1). This is based on its expected 823 beneficiaries and after adjusting for optimism bias. This equates to an additional service use cost of approximately £5,584 per beneficiary, on average. However this masks a more nuanced picture that emerges in the following sections in this chapter.
Based on the total expenditure of the WY-FI service, this implies:
Every £1 of WY-FI expenditure leads to £0.49 in wider service costs
This is the benefit-cost ratio of the WY-FI service. It highlights the increase in wider service costs that are associated with participation in WY-FI. However it is important to note that this benefit-cost ratio does not include wellbeing gains that beneficiaries will have achieved, nor does it include the outcomes implicit in the HOS or NDTA assessment.

Centre for Regional Economic and Social Research | 19
4.3. How does the overall impact of WY-FI on wider service costs break down by type of service use and agency?
Figure 4.1 shows costs savings or increases by service use type. WY-FI is predicted to create cost savings in ten of the 18 types of service use that are considered. Conversely cost increases are expected for eight types of service use.
Generally cost savings are associated with reductions in negative 'reactive' events. Whereas cost increases result from increases in more positive 'treatment' or 'preventative' events. By far the largest cost increase (and influence on the overall result) is for 'days as a mental health service inpatient', which is predicted to increase by £2.9 million. This equates to just under £3,500 per beneficiary. The second highest cost increase is for 'hospital inpatient episodes': £1,193,000 or £1,450 per beneficiary.
The overall increase in costs have resulted from relatively small increases in the absolute number of beneficiaries using each type of service. For example the estimated number of beneficiaries receiving mental health service inpatient care increased from 27 (out of 823) beneficiaries in the baseline quarter to 40 (out of 823) beneficiaries in quarter six.
The largest cost savings result from reductions in:
• court proceedings (£234,000 or approximately £280 per beneficiary)
• arrests (£214,000 or approximately £260 per beneficiary)
• evictions (£200,000 or approximately £240 per beneficiary).
Figure 4.1: Cost change by service use type
Figure 4.2 considers cost savings, or increases, by agency. It shows that six of the eight agencies considered are likely to experience a cost reduction, albeit a fairly small cost reduction. Conversely two agencies experience an increased cost: the NHS
-£233,8
09
-£214,0
58
-£199,6
12
-£147,0
34
-£142,2
40
-£93,7
71
-£58,6
48
-£37,2
73
-£9,1
03
-£8,6
07
£646
£11,6
39
£16,9
41
£153,9
64
£717,4
37
£753,0
24
£1,1
93,0
69 £
2,8
93,0
18
£4,5
95,5
83
-£1,000,000
£0
£1,000,000
£2,000,000
£3,000,000
£4,000,000
£5,000,000
Cro
wn
court
pro
ce
edin
gs
Arr
ests
Evic
tion
s
Ma
gis
tra
tes c
ourt
pro
ce
edin
gs
Co
nvic
tio
ns
Polic
e c
aution
s
F2F
with
dru
g/a
lcoh
ol se
rvic
es
Da
ys s
pen
t in
inpa
tie
nt d
eto
x.
MH
se
rvic
e o
ut pa
tie
nt a
tten
d.
Co
unselli
ng/p
sycho
thera
py s
essio
ns
Nig
hts
spe
nt in
polic
e c
usto
dy
Pre
se
nta
tio
ns a
t A
&E
F2F
con
tacts
with C
MH
T
Outp
atient
atte
nda
nces
Weeks in
resid
ential re
ha
bili
tation
Nig
hts
in p
rison
Ho
sp
ita
l in
pa
tie
nt e
pis
odes
Da
ys a
s a
MH
serv
ice inp
atient
Tota
l
Ch
an
ge i
n s
erv
ice c
osts
Service cost reduction
Service cost increase

Centre for Regional Economic and Social Research | 20
(£4.66 million or £5,670 per beneficiary) and local authorities5 (£211,000 or £211 per beneficiary).
Figure 4.2: Cost change by agency
4.4. How does the impact on wider service costs change over time?
This question considers how changes in service use costs have changed over time. It is based on an analysis of data undertaken in Autumn 2019 covering service use up to the end of June 2019. Figure 4.3 provides a visual representation of the trend in overall average service use costs per beneficiary over time. Two quarter rolling average figures have been used to smooth the trend caused by fluctuations between individual quarters. A spike in costs is shown during the first 12 month following a beneficiary's engagement. In the second year the evidence suggests there are signs of reducing cost increases and cost savings.
In more detail Figure 4.3 shows average beneficiary costs per beneficiary increased by a growing amount in each quarter from starting on WY-FI (Q1-Q2) until Q3-Q4. In Q4-Q5 and Q5-Q6 although costs were higher than in the baseline period the level of increases were less than in both the preceding periods: increases of £406 and £246 per beneficiary respectively. Finally the responses for the per iod Q6-Q7 highlight a £350 reduction in average beneficiary service use costs compared to the baseline .
5 Through costs for evictions and provisions to health and social services.
-£173,6
63
-£36,4
45
-£22,5
42
-£21,5
78
-£1
7,9
07
-£10,1
83
£211,4
19
£4,6
66,4
81
£4,5
95,5
83
-£1,000,000
£0
£1,000,000
£2,000,000
£3,000,000
£4,000,000
£5,000,000
Ho
usin
g P
rovid
er
Po
lice
Priso
ns
Oth
er
CJS
Co
urt
s/L
eg
al A
id
Pro
batio
n
Lo
ca
l A
uth
ority
NH
S
To
tal
Ch
an
ge
in
se
rvic
e c
os
ts
Service cost reduction
Service cost increase

Centre for Regional Economic and Social Research | 21
Analysis of change in average beneficiary service use costs over time by service type
reveals four broad patterns:
• Cost savings in all six time periods. These are generally reactive usages associated with the criminal justice system: arrests, convictions, police cautions and evictions.
• Cost increases in all six time periods. These are generally associated with significant 'planned' treatments: outpatient attendances, hospital inpatient attendances, mental health inpatient attendances and nights in prison.
• Initial cost increase followed by cost savings. These are mainly less long-term preventative and treatment services: counselling or psychotherapy attendances, face-to-face contacts with drug and alcohol services, days spent in inpatient detoxification, weeks spent in residential rehabilitation, presentation at A&E and nights spent in police custody.
• The remaining four service use types fit between these main patterns, with some fluctuation within a broader trend of initial cost increases and later cost savings.
Figure 4.3: Change in average service use costs per beneficiary over time
4.5. How does the impact on wider service costs vary by beneficiary outcomes?
This question seeks to identify differences in service use costs changes by other beneficiary outcomes. Specifically it compares differences between beneficiaries who:
• had a planned exit from WY-FI and those whose exit was unplanned
• improved on the Homeless Outcome Star and those whose score stayed the same or worsened
• improved on the NDTA and those whose score stayed the same or worsened
• had a prison stay and those who did not.
£570£655
£1,012
£406
£246
-£350
-£600
-£400
-£200
£0
£200
£400
£600
£800
£1,000
£1,200
Q1 - Q2 Q2 - Q3 Q3 - Q4 Q4 - Q5 Q5 - Q6 Q6 - Q7
Ave
rag
e c
han
ge in s
erv
ice u
ser
co
sts
(ave
rage fo
r q
uart
ers
ve
rsu
s b
ase
line)

Centre for Regional Economic and Social Research | 22
Nature of exit
This sub-section compares changes in service use costs by whether a beneficiary had a planned or unplanned exit from WY-FI.
The analysis considers differences in change between the base quarter and the subsequent 4 quarters (12 months). Overall average service costs were seen to increase for beneficiaries regardless of whether they had a planned or unplanned exit from WY-FI. However average service usage costs increased by a far greater amount for beneficiaries with an unplanned exit (£7,813) compared to beneficiaries who had a planned exit (£2,543); a difference of £5,270 per beneficiary (Table 4.1).
Analysis by beneficiary types reveals:
• Beneficiaries with an unplanned exit reported much higher service use cost increases for:
- Days as a mental health service inpatient: an average increase of £6,680 per beneficiary with an unplanned exit compared to £1,165 per beneficiary with a planned exit.
- Hospital inpatient episodes: an average increase of £1,523 per beneficiary with an unplanned exit compared to a £88 cost saving per beneficiary with a planned exit.
- Nights in prison: an average increase of £1,571 per beneficiary with an unplanned exit compared to £449 per beneficiary with a planned exit.
• Beneficiaries with a planned exit reported significantly higher service use cost increases for:
- Weeks in residential rehabilitation: an average increase of £1,104 per beneficiary with a planned exit compared to £0 per beneficiary with an unplanned exit.
- Crown court proceedings: an average saving of £229 per beneficiary with planned exit compared to a £1,227 cost saving per beneficiary with an unplanned exit.
- Magistrates court proceedings: an average increase of £216 per beneficiary with a planned exit compared to a £449 cost saving per beneficiary with an unplanned exit.
This subsection highlights two points. First the importance of ensuring that a beneficiary's exit is 'planned'. Second achieving a planned exit still requires increased service usage and costs beyond the WY-FI service itself to address beneficiary needs and promote independence.

Centre for Regional Economic and Social Research | 23
Table 4.1: Change in average service costs per beneficiary by planned or
unplanned exit from WY-FI
Service Planned Unplanned Difference
Days as a MH service inpatient £1,165 £6,680 -£5,515 Hospital inpatient episodes -£88 £1,523 -£1,612 Nights in prison £449 £1,571 -£1,121 Presentations at A&E -£26 £417 -£444 Outpatient attendances £115 £174 -£59 Evictions -£154 -£123 -£30 Counselling/psychotherapy sessions -£15 -£6 -£9 MH service outpatient attend. -£19 -£26 £6 Days spent in inpatient detox. -£48 -£63 £15 F2F with drug/alcohol services -£18 -£36 £19 Nights spent in police custody £18 -£17 £34 Police cautions -£9 -£113 £104 F2F contacts with CMHT £67 -£88 £155 Arrests -£65 -£256 £191 Convictions £80 -£148 £228 Magistrates court proceedings £216 -£449 £665 Crown court proceedings -£229 -£1,227 £997 Weeks in residential rehabilitation £1,104 £0 £1,104
Overall £2,543 £7,813 -£5,270
Homelessness Outcome Star
Table 4.2 shows change in average service use costs per beneficiary over two quarters following their baseline, split by whether beneficiaries reported an improvement or no change/worsening in their HOS assessment score. The data have been ordered by the difference in change, with a negative difference (the categories shaded in grey near the top) indicating instances where beneficiaries with an improved HOS reported a 'better' change in average service use costs compared to beneficiaries who reported a worsening HOS score.
The following key points emerged:
• Over the two quarters overall average service costs increased both for beneficiaries whose HOS assessment scores improved and stayed the same/worsened.
• Overall average service costs increased by a greater amount for beneficiaries whose HOS score improved (£1,655) compared to beneficiaries whose HOS score stayed the same/worsened (£1,526); this suggests initial increases in service usage helps WY-FI beneficiaries to improve their HOS outcomes by addressing treatment needs and promoting independence.
• Typically beneficiaries who had an improved HOS assessment score reported:
- Relatively greater cost increases for positive treatment service uses such as: days as a mental health service inpatient, weeks in residential rehabilitation and face to face appointments with CMHT.
- Relatively greater cost savings for negative reactive service uses such as: crown court proceeding and nights in prison.

Centre for Regional Economic and Social Research | 24
Table 4.2: Change in average service costs per beneficiary by whether HOS
score improved or stayed the same/worsened
Service Improved Same/Worsened Difference
Crown court proceedings -£453 £620 -£1,074 Nights in prison £70 £653 -£583 Convictions -£42 £116 -£158 F2F with drug/alcohol services -£5 £52 -£57 Evictions -£72 -£53 -£19 Presentations at A&E £74 £82 -£7 Nights spent in police custody £2 £8 -£6 Outpatient attendances £22 £26 -£4 Counselling/psychotherapy sessions £18 £7 £11 Arrests -£47 -£69 £22 Days spent in inpatient detox. -£1 -£26 £25 Police cautions £11 -£30 £41 Magistrates court proceedings -£41 -£114 £73 MH service outpatient attend. £83 -£41 £123 Hospital inpatient episodes £385 £184 £201 F2F contacts with CMHT £188 -£39 £227 Weeks in residential rehabilitation £427 £0 £427
Days as a MH service inpatient £1,039 £149 £890
Overall £1,655 £1,526 £129
New Directions Team Assessment "Chaos Index"
Table 4.3 shows changes in average service costs in the two quarters following the baseline quarter broken down by whether beneficiaries had reported an improvement or no change/worsening in their NDTA score. The data have been ordered by the difference in change, with a negative difference (the categories shaded in grey near the top) indicating instances where beneficiaries with an improved NDTA score reported a 'better' change in average service costs compared to beneficiaries who reported the same or a worse NDTA score. The following key points emerged:
• Over three quarters overall average service costs per beneficiary increased for beneficiaries whose NDTA scores improved and stayed the same/worsened.
• Overall average service costs increased by a greater amount for beneficiaries whose NDTA score improved (£1,637) compared to beneficiaries whose NDTA score stayed the same/worsened (£1,269); as in the previous subsection this suggests increased service usage and costs, at least over the short term, support beneficiaries to improve their outcomes.
• Underpinning this difference, those whose NDTA score improved reported a significantly higher service use cost increase for days as a mental health service inpatient: an average increase of £969 per beneficiary with an improved NDTA score compared to £155 per beneficiary with the same or worse NDTA score.

Centre for Regional Economic and Social Research | 25
Table 4.3: Change in average service costs per beneficiary by whether NDTA
score improved or stayed the same/worsened
Service Improved Same/
worsened Difference
Weeks in residential rehabilitation £232 £755 -£523 Nights in prison £217 £662 -£446 Presentations at A&E £34 £249 -£215 Days spent in inpatient detox. -£19 £148 -£167 F2F with drug/alcohol services -£3 £9 -£12 Hospital inpatient episodes £390 £399 -£9 Counselling/psychotherapy sessions £12 £11 £0 Outpatient attendances £21 £20 £1 Nights spent in police custody £5 -£10 £15 F2F contacts with CMHT £104 £75 £29 Evictions -£77 -£122 £44 Convictions -£22 -£67 £45 MH service outpatient attend. £50 -£2 £52 Police cautions £10 -£48 £59 Arrests -£38 -£171 £133 Magistrates court proceedings -£30 -£198 £167 Crown court proceedings -£215 -£596 £381 Days as a MH service inpatient £969 £155 £814
Overall £1,637 £1,1269 £368
Prison stay
A striking difference in service costs emerged between those who had a prison stay compared to those who did not. To do this analysis, beneficiaries were split into two groups: those who had been to prison in the 12 months following the baseline quarter and beneficiaries who had not been to prison in that period.
Table 4.4 shows changes in average service costs per beneficiary over two quarters following the baseline quarter split by whether beneficiaries had a prison stay or not. The data have been ordered by the difference in change, with a negative difference (the categories shaded in grey near the top) indicating instances where beneficiaries without a prison stay reported a 'better' change in service costs compared to beneficiaries who reported a prison stay.
The following key points emerged:
• Over the time period considered overall average service use costs increased for beneficiaries who both had a prison stay and did not.
• However overall average service costs increased by a much greater amount for beneficiaries who had a prison stay (£10,624) compared to beneficiaries who did not (£515).
• Beneficiaries with a prison stay had significantly higher average service use cost increases for:
- Nights in prison: on average increased by £3,733 per beneficiary with a prison stay compared to a £166 reduction for beneficiaries without a prison stay.

Centre for Regional Economic and Social Research | 26
- Days as a mental health service inpatient: on average increased by £4,123 per beneficiary with a prison stay compared to a £506 increase for beneficiaries without a prison stay.
- Crown court proceedings: on average increased by £1,172 per beneficiary with a prison stay compared to a cost reduction of £477 for beneficiaries without a prison stay.
• Conversely beneficiaries without a prison stay had significantly higher service use cost increases for weeks in residential rehabilitation.
Table 4.4: Change in average service costs per beneficiary by prison stay or not
Service No prison Prison Difference
Nights in prison -166 3,733 -3,899 Days as a MH service inpatient 506 4,123 -3,617 Crown court proceedings -477 1,172 -1,649
F2F contacts with CMHT 31 453 -422
Arrests -84 286 -370
Evictions -107 134 -241 Magistrates court proceedings -72 123 -195 MH service outpatient attend. 22 139 -117 Hospital inpatient episodes 387 460 -73 Convictions -30 9 -39 Police cautions -7 23 -30 Nights spent in police custody -1 28 -29 Outpatient attendances 22 14 9 F2F with drug/alcohol services 0 -10 10 Counselling/psychotherapy sessions 10 -1 12 Days spent in inpatient detox. -2 -27 24
Presentations at A&E 99 -34 133
Weeks in residential rehabilitation 385 0 385
Overall £515 £10,624 -£10,109
4.6. Summary
This chapter has considered the impact of the WY-FI service in beneficiaries’ use of services. It has shown:
• Overall WY-FI leads to increased service costs. The expected increase in service costs is £5,584 per beneficiary over six quarters compared to the baseline. This implies £1 of WY-FI expenditure leads to £0.49 wider service costs.
However this needs be put into context:
• Overall increases in costs have mainly been created by increased service use in a limited number of service use types; particularly days as a mental health service inpatient. Costs were shown to be lower for 10 of the 18 service use types considered.
• The service use types with increased costs tend to be positive treatment services. Many of these increases in service use will be to address previous untreated conditions. As such these expenditures could have taken place earlier if they had been identif ied sooner, and support had been available to enable beneficiaries to access the treatments that they were entitled. It is likely that these will reduce over time as treatments are completed. Also these treatment services are likely to prevent longer-term, often more expensive and reactive, service use. For

Centre for Regional Economic and Social Research | 27
example planned outpatient attendances are likely to lead to longer-term reduced reactive accident and emergency attendances.
• Analysis of changes in service costs over time suggests that savings start to emerge within the second year after starting on WY-FI. The trend is for a spike in wider service use costs during the f irst 12 months following engagement. In the second year the evidence suggests that in Q4-Q5 and Q5-Q6 although costs were higher than in the baseline period the level of increases were less than in both the preceding periods. Finally the figures for the period Q6-Q7 indicate a reduction in average service use costs compared to the baseline.
• The overall increase in costs has resulted from relatively small increases in the absolute number of beneficiaries using each type of service. For example the estimated number of beneficiaries receiving mental health service inpatient care increased from 27 (out of 823) beneficiaries in the baseline quarter to 40 (out of 823) beneficiaries in quarter six.
• Increased service use costs were identif ied despite beneficiaries reporting positive outcomes on other metrics such as improved HOS and NDTA scores. It is likely that these improvements have been achieved because of the increases in service costs. Therefore cost increases, at least in the short term, should be seen as a positive, rather than a negative, impact of WY-FI.
• Finally more detailed analysis identif ied a large difference in the increase in service costs between beneficiaries who recorded a prison stay after starting on WY-FI compared to those who did not: £10,624 and £515 respectively over three quarters. Addressing factors which may lead to a prison stay should be addressed as a priority. This includes promoting the relatively lower cost preventative and treatment service uses which can reduce the likelihood of a prison stay.
Centre for Regional Economic and Social Research | 28
5 5. Recommendations
5.1. Introduction
This chapter presents a series of recommendations based on the analysis in preceding sections.
5.2. Recommendations
Based on these findings the following recommendations can be made.
First, the positive findings developed in this report, alongside the wider process evaluation, provide support for the principles underpinning the WY-FI service to be adopted in services to promote independence for those with multiple and complex needs.
Second, addressing multiple and complex needs requires a substantial and sustained financial commitment from commissioners. This needs to cover interventions working directly with beneficiaries as well as indirect support services which assist those with a lived experience to overcome treatment needs. These indirect services include mental health services, secondary hospital care and drug and alcohol services.
Third, work is needed to develop funding mechanisms that appropriately reward and compensate services for the additional cost burdens that they face in supporting people with lived experience to become independent. Such funding mechanisms need to reflect distribution across services and over time, with upfront preventative work replacing later reactive service costs. The findings in this report support a move to more collaborative longer-term funding agreements and a move away from annual, siloed budgets.
Fourth, despite the learning developed in these evaluation reports there should be a commitment to further research and evaluation work to understand the longer -term benefits and implications of WY-FI and its approach. In particular this should focus on the longer-term impact on service costs and the implications that this has for funding arrangements.
Finally, the report has highlighted the importance of continued work with beneficiaries. A central priority is keeping beneficiaries out of prison.