West Virginia State University Office of Institutional ...
53
West Virginia State University Office of Institutional Research and Assessment 2013-2014 University Factbook Enrollment Information Yearly Enrollment and Graduates 1892-2013 Fall Semester Enrollment 2009-2013 Fall FTE Enrollment (Undergraduate and Graduate) Enrollment by Full-/Part-Time Status Enrollment by Gender Enrollment by Gender and Graduate Status Enrollment (overall) by Race Undergraduate and Graduate Enrollment by Race In-State/Out of State (overall) Enrollment Undergraduate and Graduate In-State/Out-of-State Enrollment Residence Hall/Commuter Enrollment Enrollment by Degree Objective Enrollment by Student Type Enrollment by Student Level WV First-Time Freshmen by County WV First-Time Freshmen by High School First-Time Freshmen ACT Scores and High School GPAs Headcount and FTE Enrollment by Calendar Year Five-Year Trend in Enrollment by Level and Full-/Part-Time Status Five Year Trend in Enrollment by Gender and Full-/Part-Time Status Average Age of Students, Fall 2013 Military Science Enrollment Five-Year Trend in Geographic Origin of Students
Transcript of West Virginia State University Office of Institutional ...

West Virginia State University
Office of Institutional Research and Assessment 2013-2014 University Factbook
Enrollment Information
Yearly Enrollment and Graduates 1892-2013
Fall Semester Enrollment 2009-2013
Fall FTE Enrollment (Undergraduate and Graduate)
Enrollment by Full-/Part-Time Status
Enrollment by Gender
Enrollment by Gender and Graduate Status
Enrollment (overall) by Race
Undergraduate and Graduate Enrollment by Race
In-State/Out of State (overall) Enrollment
Undergraduate and Graduate In-State/Out-of-State Enrollment
Residence Hall/Commuter Enrollment
Enrollment by Degree Objective
Enrollment by Student Type
Enrollment by Student Level
WV First-Time Freshmen by County
WV First-Time Freshmen by High School
First-Time Freshmen ACT Scores and High School GPAs
Headcount and FTE Enrollment by Calendar Year
Five-Year Trend in Enrollment by Level and Full-/Part-Time Status
Five Year Trend in Enrollment by Gender and Full-/Part-Time Status
Average Age of Students, Fall 2013
Military Science Enrollment
Five-Year Trend in Geographic Origin of Students

Academic Programs
Degrees Offered
Fall Semesters Master's and Baccalaureate Program Enrollments
Enrollment by Degree Type and Undecided/Undeclared Composition
Five-Year Trend in Degrees Conferred
Faculty and Staff
Instructional Faculty by Gender and Full-/Part-Time Status
Faculty by Highest Degree Held and Full-/Part-Time Status
Percent of Tenured, Full-Time Faculty by Rank
Average 9-Month Salary of Full-Time Faculty
Average 9-Month Exclusively in Teaching by Academic Rank
University Employees by EEOC Classification and Full-/Part-Time Status
Average Salaries of Full-Time Staff by EEOC Classification
Finance
Financial Aid Summary Report for FTFT Degree Seeking Undergraduates
Educational and General Expenditures by Function for Fiscal Year Ending June 30, 2013
Operating Revenues by Source
Facilities
Physical Plant Assets for Fiscal Year
Alumni
Alumni by State
Library
Drain-Jordan Library Collection
Persistence
First-to-Second Year Retention Rates
Graduation Rates

Yearly Enrollment and Graduates*
1892 through 2013
Year
Enrollment
Graduates
Year
Enrollment
Graduates 1892-1893
40
1911-1912
261
54
1893-1894
50
1912-1913
277
26
1894-1895
60
1913-1914
348
48
1895-1896
109
14
1914-1915
380
46
1896-1897
100
6
1915-1916
383
46
1897-1898
131
15
1916-1917
403
47
1898-1899
150
3
1917-1918
322
58
1899-1900
204
11
1918-1919
326
37
1900-1901
180
23
1919-1920
297
80
1901-1902
145
16
1920-1921
445
55
1902-1903
150
20
1921-1922
302
63
1903-1904
197
12
1922-1923
326
78
1904-1905
201
16
1923-1924
444
46
1905-1906
218
7
1924-1925
493
80
1906-1907
216
20
1925-1926
506
72
1907-1908
228
19
1926-1927
546
91
1908-1909
235
37
1927-1928
655
90
1909-1910
251
43
1928-1929
601
102
1910-1911
266
48
1929-1930
676
98
*The enrollment and graduates figures for the years 1892 through 1966 were taken from John C. Harlan’s book,
History of West Virginia State College, 1891-1965. The subsequent years’ counts were taken from official reports to
the West Virginia Board of Regents, Board of Directors, and the Higher Education Policy Commission.

Yearly Enrollment and Graduates (cont.)
Year
Enrollment
Graduates
Year
Enrollment
Graduates 1930-1931
750
139
1954-1955
983
144
1931-1932
718
142
1955-1956
1,423
162
1932-1933
643
126
1956-1957
2,223
151
1933-1934
627
133
1957-1958
2,199
128
1934-1935
682
168
1958-1959
2,390
159
1935-1936
708
160
1959-1960
2,084
221
1936-1937
750
130
1960-1961
2,057
170
1937-1938
806
128
1961-1962
2,153
104
1938-1939
816
130
1962-1963
2,482
179
1939-1940
983
126
1963-1964
2,636
213
1940-1941
1,026
149
1964-1965
2,742
209
1941-1942
996
137
1965-1966
2,882
253
1942-1943
808
153
1966-1967
3,146
235
1943-1944
772
128
1967-1968
3,028
272
1944-1945
680
104
1968-1969
3,074
303
1945-1946
851
107
1969-1970
3,710
249
1946-1947
1,371
175
1970-1971
3,663
263
1947-1948
1,785
197
1971-1972
3,581
345
1948-1949
1,597
300
1972-1973
3,521
490
1949-1950
1,450
336
1973-1974
3,669
544
1950-1951
1,270
206
1974-1975
3,518
548
1951-1952
999
208
1975-1976
3,941
564
1952-1953
894
197
1976-1977
4,001
596
1953-1954
837
177
1977-1978
3,865
515

Yearly Enrollment and Graduates (cont.)
Year
Enrollment
Graduates
Year
Enrollment
Graduates
1978-1979
3,664
511
1996-1997
4,545
556
1979-1980
3,905
468
1997-1998
4,603
555
1980-1981
4,366
531
1998-1999
4,817
560
1981-1982
4,485
462
1999-2000
4,794
602
1982-1983
4,414
480
2000-2001
4,823
583
1983-1984
4,731
509
2001-2002
4,836
570
1984-1985
4,315
487
2002-2003
4,992
641
1985-1986
4,462
472
2003-2004*
3,357
432
1986-1987
4,383
489
2004-2005
3,344
438
1987-1988
4,503
524
2005-2006
3,491
482**
1988-1989
4,504
489
2006-2007
3,502
471
1989-1990
4,635
537
2007-2009
3,218
452
1990-1991
4,835
577
2009-2009
3,003
379
1991-1992
4,986
537
2009-2010
4,003
396
1992-1993
4,896
638
2010-2011
3,190
396
1993-1994
4,756
563
2011-2012
2,827
421
1994-1995
4,519
580
2012-2013
2,644
396
1995-1996
4,486
573
2013-2014
2,677
410
* From this year forward, figures reflect the separation of the University and Community College.
**Includes first 6 Master's Degree recipients.

Fall Semesters 2009-2013
Headcount Enrollment
By Credit Type Received
Fall Semester 2009 2010 2011 2012 2013
Undergraduate 3,953 3,145 2,772 2,561 2,622
Graduate 50 45 55 83* 55
Headcount 4,003 3,190 2,827 2,644 2,677
*Includes 28 post-baccalaureate students who received graduate credit for professional development course

FTE Enrollment
Fall Semester 2009 2010 2011 2012 2013
Undergraduate FTE 2,710 2,429 2,224 2,069 2,123
Graduate FTE 29 29 28 37 28
Note: One undergraduate FTE is equal to 15 credit hours. One graduate FTE is equal to twelve credit hours.
Total FTE Enrollment
2710
2429
2224 2069 2123
29 29 28 37 28 0
500
1000
1500
2000
2500
3000
2009 2010 2011 2012 2013
Undergraduate
Graduate

Enrollment by Full-/Part-Time Status
Fall Semester
2009
2010
2011
2012
2013 Full-Time
2,023
2,133 1,956 1,882
1,890
Part-Time
1,980
1,057 871 762
787
Total
4,003
3,190
2,827
2,644
2,677
2023 2133
1956 1882 1890
1980
1057
871 762 787
0
500
1000
1500
2000
2500
2009 2010 2011 2012 2013
Full-Time/Part-Time
Full-Time
Part-Time

Enrollment by Gender
Fall Semester 2009 2010 2011 2012 2013
Female 2,399 1,847 1,629 1,489 1,469
Male 1,604 1,343 1,198 1,155 1,208
Total 4,003 3,190 2,827 2,644 2,677
0
500
1000
1500
2000
2500
3000
2009 2010 2011 2012 2013
Enrollment by Gender
Male
Female

Enrollment by Gender and Graduate Status
Fall Semester 2009 2010 2011 2012 2013
Undergraduate Female 2,373 1,825 1,600 1,456 1,438
Graduate Female 26 22 29 33 31
Total Female 2,399 1,847 1,629 1,489 1,469
Undergraduate Male 1,580 1,320 1,172 1,133 1,184
Graduate Male 24 23 26 22 24
Total Male 1,604 1,343 1,198 1,155 1,208
Grand Total 4,003 3,190 2,827 2,644 2,677

Enrollment by Race
Fall Semester 2009 2010 2011 2012 2013
American Indian 18 18 15 13 12
Asian 29 27 30 25 13
Black 644 492 357 302 272
Hispanic 30 25 25 20 17
White 2,725 2,067 1,722 1,476 1,476
Other 557 561 678 808 887
Total 4,003 3,190 2,827 2,644 2,677
644 492
357 302 272
2,725
2,067
1,722
1,476 1,476
0
500
1000
1500
2000
2500
3000
2009 2010 2011 2012 2013
Enrollment by Race
American Indian
Asian
Black
Hispanic
White
Other

Undergraduate Enrollment by Race
Fall Semester 2009 2010 2011 2012 2013
American Indian 18 18 15 13 12
Asian 25 23 27 20 9
Black 639 488 350 290 264
Hispanic 29 24 23 18 15
White 2,691 2,037 1,688 1,448 1,447
Other 551 555 669 800 875
Total 3,953 3,145 2,772 2,589 2,622
Graduate Degree Program Enrollment by Race
Fall Semester 2009 2010 2011 2012 2013
American Indian 0 0 0 0 0
Asian 4 4 3 5 4
Black 5 4 7 12 8
Hispanic 1 1 2 2 2
White 34 30 34 28 29
Other 6 6 9 8 12
Total 50 45 55 55 55

In-State/Out-of-State Enrollment
Fall Semester 2009 2010 2011 2012 2013
In-State 3,796 2,917 2,595 2,439 2,428
Out-of-State 196 266 216 183 224
Non-Resident Alien 11 7 16 22 25
Total 4,003 3,190 2,827 2,644 2,677
0
500
1,000
1,500
2,000
2,500
3,000
3,500
4,000
2009 2010 2011 2012 2013
In-State, Out-of-State Enrollment
In-State
Out-of-State
Non-Resident Alien

Undergraduate In-State/Out-of-State Enrollment
Fall Semester 2009 2010 2011 2012 2013
In-State 3,712 2,882 2,554 2,397 2,428
Out-of-State 234 256 209 182 182
Non-Resident Alien 7 7 9 10 12
Total 3,953 3,145 2,772 2,589 2,622
Graduate Degree Program In-State/Out-of-State Enrollment
Fall Semester 2009 2010 2011 2012 2013
In-State 38 32 41 42 41
Out-of-State 4 4 7 1 1
Non-Resident Alien 8 9 7 12 13
Total 50 45 55 55 55

Residence Hall/Commuter Enrollment
Fall Semester 2009 2010 2011 2012 2013
Dormitory 482 403 328 281 270
Commuter 3,521 2,787 2,499 2,363 2,407
TOTAL 4,003 3,190 2,827 2,644 2,677
482 403 328 281 270
3,521
2,787
2,499 2,363 2,407
0
500
1000
1500
2000
2500
3000
3500
4000
2009 2010 2011 2012 2013
Residence Hall/Commuter Enrollment
Dormitory
Commuter

Enrollment by Degree Objective
Fall Semester 2009 2010 2011 2012 2013
Bachelor's 2,524 2,534 2,329 2,135 2,166
Graduate 50 45 55 55 55
BoD File
Undecided/
Undeclared*
1,429 611 443 426 456
Total 4,003 3,190 2,827 2,644** 2,677
*The Higher Education Policy Commission files count students enrolled in the baccalaureate general education
program and certain other programs as undecided/undeclared
**Total includes 28 non-graduate degree program students receiving graduate credit for professional development
2,524 2,534
2,329 2,135 2,166
1,429
611 443 426 456
0
500
1,000
1,500
2,000
2,500
3,000
2009 2010 2011 2012 2013
Enrollment by Degree Objective
Bachelor's
Graduate
Undecided/Undeclared

Enrollment by Student Type
Fall Semester
2009
2010
2011
2012
2013
First-Time
Freshmen 455 358 309 291 418
Returning
Students 1,942 2,100 1,678 1,428 1,415
Readmitted
Students 245 108 146 140 165
Transfer
Students 52 86 267 267 230
High School
Students 244 361 306 311 312
Other* 1,065** 177 121 207 137
Total 4,003 3,190 2,827 2,644 2,677
*All column totals include graduate students, which are not shown in the chart **A total of 984 of these students were KVCTC students taking courses at the University.

Enrollment by Student Level
Fall Semester 2009 2010 2011 2012 2013
Freshman 1,527 915 772 734 822
Sophomore 714 557 474 414 369
Junior 606 490 445 415 421
Senior 862 822 775 687 698
Graduate 50 45 55 55 55
Total* 4,003 3,190 2,827 2,644 2,677
*Includes unclassified special high school students taking college courses.
1,527
915
772 734 822
0
200
400
600
800
1,000
1,200
1,400
1,600
1,800
2009 2010 2011 2012 2013
Enrollment by Student Level
Freshman
Sophomore
Junior
Senior
Graduate

West Virginia First-Time Freshmen by County
Fall Semester
2009
2010
2011
2012
2013
Barbour 0 0 0 0 0 Berkeley
1
0 0 0
0
Boone
0
5 6 12
11
Braxton
0
0 0 0
0
Brooke
0
0 2 0
0
Cabell
0
4 3 6
9
Calhoun
0
0 0 0
0
Clay
0
3 0 1
1
Doddridge
0
0 0 0
0
Fayette
0
0 0 0
3
Grant
0
0 0 0
0
Greenbrier
0
0 1 2
2
Hancock
0
0 0 0
0
Harrison
0
0 0 1
1
Jackson
0
4 2 2
0
Jefferson
0
0 0 0
3
Kanawha
419
206 200 176
229
Lincoln
0
3 4 6
5
Logan
2
9 2 4
4
Marion
0
0 0 0
0
Mason
0
0 0 1
1
McDowell
0
0 0 0
0
Mercer
0
0 1 2
1
Mingo
0
0 0 0
1

WV First-Time Freshmen by County (cont.) Fall Semester
2009
2010
2011
2012
2013
Monongalia
0
0 0 0
0
Monroe
0
0 0 1
0
Nicholas
0
0 0 1
4
Ohio
0
0 0 1
0
Pendleton
0
0 0 1
0
Pocahontas
0
0 0 0
0
Preston
0
0 0 0
0
Putnam
2
59 37 36
65
Raleigh
0
2 1 0
1
Randolph
0
0 0 0
1
Ritchie
0
0 0 0
0
Roane
0
1 5 4
0
Summers
0
0 0 0
0
Taylor
0
0 0 0
0
Wayne
0
2 1 2
1
Webster
0
0 0 0
0
Wetzel
0
0 0 0
0
Wirt
0
0 0 0
3
Wood
0
1 0 1
0
Wyoming
0
0 1 0
0
Total WV
Residents 424 299 0 260
346
Out-of-State 31 59 43 31
72
Total Entering
Freshmen 455 358 309 291 418

West Virginia First-Time Freshmen by High School (With 10 or more students enrolled)
High School Fall 2013
Buffalo 12
Capital 22
George Washington 18
Herbert Hoover 19
Nitro 26
Poca 25
Riverside 11
Sissonville 15
South Charleston 27
St. Albans 28
Winfield 18
Note: Students may not have enrolled in college the same year they graduated from high school.
Fall 2013 First-Time Freshmen Average ACT Scores
and High School GPA
English 19.88
Mathematics 18.50
Natural Science 19.95
Social Science 20.84
Composite 19.93
High School GPA 3.03

Headcount and FTE 15 Enrollment by Calendar Year
Year
Spring FTE
Spring
Headcount
Summer
FTE
Summer
Headcount
Fall FTE
Fall
Headcount 1978
*
*
*
*
2,568
3,664
1979
*
*
*
*
2,729
3,905
1980
*
*
644
1,631
3,024
4,366
1981
2,823
4,174
338
1,141
2,861
4,485
1982
2,972
4,188
412
1,386
2,989
4,414
1983
2,807
4,373
429
1,329
3,072
4,731
1984
2,887
4,279
350
1,266
2,952
4,315
1985
2,784
4,105
353
1,219
2,934
4,462
1986
2,740
4,134
336
1,127
3,005
4,383
1987
2,837
4,330
251
950
3,011
4,503
1988
2,661
4,256
191
682
3,074
4,509
1989
2,854
4,136
225
835
3,143
4,635
1990
2,911
4,230
270
922
3,277
4,834
1991
3,115
4,539
317
1,115
3,479
4,986
1992
3,235
4,680
332
1,158
3,417
4,896
1993
3,230
4,632
318
1,046
3,362
4,756
1994
3,129
4,323
286
994
3,236
4,519
1995
3,014
4,190
311
1,029
3,215
4,486
1996
3,112
4,288
312
1,046
3,316
4,545
1997
3,148
4,398
336
1,116
3,358
4,603

Headcount and FTE Enrollment (cont.)
by Calendar Year
Year
Spring FTE
Spring
Headcount
Summer
FTE
Summer
Headcount
Fall FTE
Fall
Headcount 1998
3,117
4,384
332
1,083
3,387
4,817
1999
3,128
4,529
354
1,134
3,446
4,794
2000
3,276
4,576
309
1,021
3,453
4,823
2001
3,256
4,539
362
1,179
3,557
4,836
2002
3,495
4,846
349
1,156
3,639
4,992
2003
3,418
4,800
355
1,189
2,550
3,357
2004
2,412
3,132
289
889
2,482
3,344
2005
2,478
3,158
277
869
2,694
3,491
2006
2,542
3,300
244
783
2,727
3,502
2007
2,460
2,983
207
683
2,570
3,218
2008
2,339
2,797*
175
576
2,332
3,003
2009
2,183
2,643
198
643
2,733
4,003
2010
2,489*
3,454
196
636
2,458
3,190
2011
2,224*
2,674
184
549
2,252
2,827
2012
2,073
2,629
147
462
2,106
2,644
2013
2,003*
2,435
151
491
2,158
2,677
*Revised from last edition Note: All numbers reflect FTE 15.

Five-Year Trend in Enrollment by Level and Full-/Part-Time Status
Fall Semester 2009 2010 2011 2012 2013
Freshman 1,527 915 772 734 822
Full-Time 684 694 642 621 721
Part-Time 843 221 130 113 101
Sophomore 714 557 474 414 369
Full-Time 416 436 397 362 314
Part-Time 298 121 77 52 55
Junior 606 490 445 415 421
Full-Time 387 382 353 355 359
Part-Time 219 108 92 60 62
Senior 862 822 775 687 698
Full-Time 528 573 555 505 495
Part-Time 334 249 220 182 203
Graduate 50 45 55 55 55
Full-Time 26 41* 28 34 33
Part-Time 24 4* 27 21 22
Total** 4,003 3,190 2,827 2644 2,677
Full-Time 2,041 2,119 1,975 1882 1,922
Part-Time 1,962 1,071 546 762 443
* Now derived from IPEDS Fall Enrollment Survey
* *Totals include dual-credit high school students who are not part of the listed student levels.

Five-Year Trend in Enrollment by Gender and Full-/Part-Time Status
Fall Semester
2009
2010
2011
2012
2013
Female
2,399
1,847
1,629
1,489
1,469
Full-Time
1,145
1,154
1,084
1,030
1,005
Part-Time
1,254
693
545
459
464
Male
1,604
1,343
1,198
1,155
1,208
Full-Time
879
938
872
852
885
Part-Time
725
405
326
303
323
Total
4,003
3,190
2,827
2,644
2,677
Full-Time
2,024
2,092
1,956
1,882
1,890
Part-Time
1,979
1,098
871
762
787

Average Age of Students, Fall 2013
Category
Average Age
Female
25.5
Male
23.9
White
26.4
Black
26.1
Hispanic
28.0
Asian
26.9
American Indian
29.9
Other/Unknown
21.5
Freshman
22.3
Sophomore
25.0
Junior
26.6
Senior
29.6
Graduate
31.6

Military Science Enrollment
Year
Headcount
Year
Headcount
1983-1984
178
1998 -1999
163
1984-1985
165
1999-2000
220
1985-1986
161
2000-2001
135
1986-1987
196
2001-2002
120
1987-1988
198
2002-2003
100
1988-1989
248
2003-2004
46
1989-1990
101
2004-2005
38
1990-1991
96
2005-2006
44
1991-1992
105
2006-2007
51
1992-1993
100
2007-2008
33
1993-1994
102
2008-2009
34
1994-1995
97
2009-2010
47
1995-1996
87
2010-2011
60
1996-1997
61
2011-2012
26
2012-2013
19

Five-Year Trend in Geographic Origin of Students
Fall Semester
2009 2010 2011 2012
2013
Alabama 0 0 1 0 0 Alaska 0 0 0 0 0 Arizona 0 1 0 0 0 Arkansas 0 0 0 1 1 California 5 5 9 15 16 Colorado 1 0 0 0 0 Connecticut 6 7 8 5 3 Delaware 3 5 3 2 1 D.C. 14 17 10 10 8 Florida 10 15 17 16 11 Georgia 6 12 5 5 6 Hawaii 0 0 0 0 0 Iowa 0 0 0 1 0 Illinois 7 9 2 3 9 Indiana 2 5 2 0 2 Kansas 0 1 0 0 0 Kentucky 3 3 4 5 6 Louisiana 1 0 0 0 0 Maine 0 0 0 0 0 Maryland 20 48 33 32 37 Massachusetts 3 5 4 1 1 Michigan 8 17 15 14 10 Minnesota 0 0 0 0 1 Mississippi 0 0 0 0 0 Missouri 0 3 3 1 0 Montana 0 1 1 0 0

Five-Year Trend in Geographic Origin of Students (cont.)
Fall Semester
2009
2010
2011
2012
2013
Nebraska 0 0 0 0 1
New Hampshire 0 0 0 0 0
New Jersey 5 9 6 5 7
New York 9 9 7 7 5
Nevada 0 0 1 0 0
North Carolina 7 7 5 3 5
North Dakota 0 0 0 0 0
Ohio 33 34 33 28 29
Pennsylvania 17 20 17 15 4
Rhode Island 0 0 0 0 0
South Carolina 5 3 2 0 0
Tennessee 0 0 0 0 0
Texas 0 4 4 3 3
Utah 0 0 0 0 0
Vermont 0 0 0 0 0
Virginia 34 21 22 10 16
Washington 0 0 0 0 0
West Virginia 3,796 2,917 2,598 2,452 2,483
Wisconsin 1 1 0 0 0
Wyoming 0 1 1 0 0

Five-Year Trend in Geographic Origin of Students (cont.) Fall Semester
2009 2010 2011 2012
2013
Territories and Foreign Countries
7 10 13 10 12
Total 4,003 3,190 2,827 2,644 2,677
In-State 94.8% 91.4% 91.9% 92.7% 92.8%
Out-of-State 5.2% 8.6% 8.1% 7.3% 7.2%
0
2
4
6
8
10
12
14
2009 2010 2011 2012 2013
Percentages In-State and Out-of-State
Territories & Foreign Countries
In-State
Out-of-State

Degrees Offered as of Fall 2013 Master's Programs
Master of Arts
Biotechnology
Media Studies
Master of Science
Biotechnology
Law Enforcement and Administration
Baccalaureate Programs
Bachelor of Arts
Art Economics English History International Studies Political Science Psychology
Regents Sociology
Bachelor of Science Biology Business Administration Chemistry Communications
Computer Science Criminal Justice Education, Elementary Education, Secondary Health Science Mathematics Recreation Social Work
Sports Studies

Master's Program Enrollments
Fall Semesters
2009
2010
2011
2012
2013
MA
Biotechnology 1 1 1 1 1
Media Studies 36 28 25 27 24
Total MA 37 29 26 28 25
MS
Biotechnology 13 16 19 16 17
Law
Enforcement* 8 11 13
Professional
Development** 0 0 2 28 0
Total MS 13 16 29 27 30
Total MA/MS 50 45 55 55 55
Baccalaureate Program Enrollments
Fall Semesters BA
2009 2010 2011 2012
2013
Art 71 57 53 49 56
Economics 5 5 9 6 12
English 67 47 44 49 42
History 58 59 60 51 55
International
Studies -- 1* 11 15 13
Political
Science 41 39 28 22 31
Psychology 155 145 127 127 120
Regents 102 113 102 88 87
Sociology 31 32 18 14 11
Total BA 530 498 452 421 427
*New degree program
**Not counted in Master Program Enrollment totals. These post-baccalaureate students earned graduate level credit
in a non-graduate degree program.

Baccalaureate Program Enrollments (cont.)
Fall Semesters
BS
2009
2010
2011
2012
2013
Biology 214 198 199 161 187
Business
Administration 523 474 393 359 345
Chemistry 58 55 52 39 41
Communi-
cations 209 196 177 135 130
Computer
Science 39 25 29 25 38
Criminal
Justice 163 218 203 211 221
Education
591 601 577 528 513
Health
Sciences 59 89 52 69 48
Mathematics 7 9 11 9 18
Recreation
Administration 42 29 21 12 8
Social
Work 89 98 90 80 100
Sports Studies* -- 44 73 86 90
Total BS 1,994 2,036 1,877 1,714 1,739
* New program

BA/BS Enrollment
Fall Semester 2009 2010 2011 2012 2013
Total BA, BS 2,524 2,534 2,329 2,135 2,166
2,524 2,534
2,329
2,135 2,166
1,900
2,000
2,100
2,200
2,300
2,400
2,500
2,600
2009 2010 2011 2012 2013
Total BA, BS Enrollment
Total BA, BS Enrollment

Enrollment by Degree Type
Fall Semester
2009
2010
2011
2012
2013
Total BA & BS 2,524 2,534 2,329 2,135 2,166
Total
Graduate
Students
50 45 55 55 55
BoD
Undecided
or
Undeclared*
1,429 611 443 454 456
Total 4,003 3,190 2,827 2,644** 2,677
*The source of information contained in this table is the Higher Education Policy Commission data files. The
composition of the Undecided/Undeclared is listed on the following table. The total includes 28 students receiving
graduate credit for a non-graduate degree professional development program for post-baccalaureate students.
Undecided/Undeclared Composition
Source: Banner Data Files
Fall Semester 2009 2010 2011 2012 2013
General Ed.
Program,
Baccalaureate
145 86 46 44 70
Professional
Certificate in
Accounting
3 15 11 8 13
Non-program 295 510 386 402 373
Major/Minor
Not Declared 986 0 0 0 0
Total* 1,429 611 443 454 456
*Totals include dual-credit high school students.

Five-Year Trend in Degrees Conferred
Master's Degrees Academic
Year* 2009 2010 2011 2012 2013
Media Studies
(MA) 6 6 5 4 3
Biotechnology
(MA/MS) 5 6 6 9 4
Law
Enforcement
& Admin.
(MA/MS)
-- -- -- -- 10*
Total MA/MS 11 12 11 13 17
*First degrees awarded in program
Bachelor of Arts Academic Year *
2009 2010 2011 2012 2013
Art 9 -- 6 5 10
Economics 10 10 6 9 11
English 11 3 3 11 8
History 12 13 22 21 13
International
Studies -- 1 1 3 7
Political
Science 2 3 8 1 5
Psychology 26 25 20 34 26
Regents 70 89 96 87 93
Sociology 4 7 6 1 3
Total BA 144 150 168 172 176
*Includes all students receiving a degree from June through May. For example, “Academic Year 2009" counts graduates from the Summer
2009, Fall 2009, and Spring 2010 semesters.

Five-Year Trend in Degrees Conferred (cont.)
Bachelor of Science
Academic
Year*
2009
2010
2011
2012
2013
Biology 17 13 10 14 18
Business
Administration 57 64 49 50 55
Chemistry 5 4 5 1 3
Communi-
cations 43 36 34 24 15
Computer
Science -- 2 0 0 0
Criminal
Justice 37 23 35 36 38
Education,
Elementary 24 19 30 23 25
Education,
Secondary 23 20 38 29 34
Health
Sciences 9 24 13 19 14
Mathematics 1 1 4 1 3
Recreation
Administration 10 6 3 3 2
Social Work 15 17 21 16 22
Sports Studies -- -- 4 9 13
Total BS 241 229 246 225 242
*Includes all students receiving a degree from June through May. For example, “Academic Year 2012" counts graduates from the Summer
20012, Fall 20012, and Spring 2013 semesters.

Five-Year Trend in Degrees Conferred (cont.)
Totals for All Programs
Academic Year
2009
2010
2011
2012
2013
Total BA 144 150 168 172 176
Total BS 241 229 246 225 242
Total MA/MS 11 12 11 13 17
Grand Total 396 396* 432* 411* 437*
*Total includes 1 or more professional certificates in Accounting, a special postbaccalaureate award.

Instructional Faculty by Gender and Full-/Part-Time Status
Fall Semester
2009
2010
2011
2012
2013
Female
Full-Time
46
46
46
44
48
Female
Part-Time
36
42
36
31
40
Total Female
82
88
82
75
88
Male
Full-Time
75
74
74
76
71
Male
Part-Time
39
40
36
29
28
Total Male
114
114
110
105
99
Total
Full-Time
121
120
120
120
119
Total
Part-Time
75
82
72
60
68
Total Faculty
196
202
192
180
187

Faculty by Highest Degree Held and Full-/Part-Time Status Fall Semester
2009
2010
2011
2012
2013
Doctorate,
Full-Time 79 80 86 81 86
Doctorate,
Part-Time 8 4 5 2 5
Professional,
Full-Time 2 2 2 2 1
Professional,
Part-Time 2 2 2 3 1
Master's,
Full-Time 40 38 32 36 31
Master's,
Part-Time 48 62 53 48 53
Bachelor's,
Full-Time 0 0 0 1 1
Bachelor's,
Part-Time 16 13 12 6 9
Less than
Bachelor's,
Full-Time
0 0 0 0 0
Less than
Bachelor's,
Part-Time
1 1 0 1 0
Total Full-Time 121 120 120 120 119
Total Part-
Time 75 82 72 60 68
Total Faculty
196
202
192
180
187

Percent of Tenured, Full-Time Instructional Faculty by Rank
Fall 2013*
Number of Professors 28
Number of Tenured Professors 24
Percent of Tenured Professors 85.7
Number of Associate Professors 42
Number of Tenured, Associate Professors 20
Percent of Tenured, Associate Professors 47.6
Number of Assistant Professors 39
Number of Tenured, Assistant Professors 6
Percent of Tenured, Assistant Professors 15.4
Number of Instructors 8
Number of Tenured Instructors 1
Percent of Tenured Instructors 12.5
Number with No Rank 2
Number of Tenured No Rank 1
Percent of Tenured No Rank 50
Total Number of Instructional Faculty 119
Number of Lecturers 0
Number of Tenured Lecturers 0
Percent of Tenured Lecturers 0
Total Number of Tenured Instructional Faculty 52
Percent of Tenured Instructional Faculty 43.7
*Source: BODC3 file AAUP Survey, CDS

Average 9-Month Salary of Full-Time Faculty
Exclusively in Teaching by Rank*
Fall Semester
2009
2010
2011
2012
2013
Professor $62,291 $62,118 $63,477 $62,814 $64,395
Associate Professor $57,584 $57,950 $54,710 $56,780 $57,138
Assistant Professor $47,635 $48,293 $49,130 $47,819 $49,817
Instructor $38,600 $37,433 $38,757 $38,298 $41,347
*Source: BODC3 file
Average 9-Month Salary of Full-Time Faculty
Exclusively in Teaching by Highest Degree Held** Fall Semester
2009
2010
2011
2012*
2013
Doctorate $54,797 $54,352 $54,973 $55,284 $56,886
Professional
Degree or
Advanced
Certificate
$55,266 $55,429 $56,633 $56,693 $62,206
Master's $46,553 $47,596 $49,607 $48,820 $48,177
*Revised from previous edition
**Source: BODC3 file

University Employees by EEOC Classification
and Full-/Part-Time Status
Fall 2013*
EEOC Classification
Full-Time
Part-Time
Total
Clerical/Secretarial 27 0 27
Executives,
Administrators, &
Managers
18 1 19
Faculty (instructional) 119 68 187
Professional Non-Faculty 91 2 93
Service/
Maintenance 58 3 61
Technical/
Paraprofessional 20 0 20
Total 333 74 407
*Source: BODC3 file

Average Salaries of Full-Time Staff by EEOC Classification* Fall Semester
2009
2010
2011
2012
2013
Clerical/
Secretarial $28,221 $27,906 $27,456 $29,169 $29,257
Executives,
Admin. and
Managers
$77,192 $81,691 $87,920 $95,207 $76,140
Professional
Non-Faculty $42,807 $42,390 $43,574 $44,593 $43,223
Service/
Maintenance $26,038 $27,906 $25,484 $27,017 $28,127
Skilled Craft $35,193 N/A N/A N/A N/A
Tech./Para-
professional $33,445 $32,630 $32,800 $33,748 $34,822
*Source: BODC3 file

Financial Aid Summary Report
Aid Year 2012-2013
For Fall 2012 Cohort of 284
First-Time Full-Time Degree Seeking Undergraduates
Group
Count
Total Awarded, $
Average Award, $
Any Grant* 251 1,496,691 5,963
Federal Grants 207 750,289 3,625
Pell Grants 179 728,412 4,069
Other Federal Grants 28 21,877 781
State/Local Government Grants 140 436,537 3,118
Institutional Grants 70 309,865 4,427
Loans to Students 143 819,784 5,733
Federal Loans 143 819,783 5,733
Other Loans 0 0 0
* Refers to grants or scholarships from the federal government, state/local government, or the Institution. Unduplicated student counts are reported in each aid category; however, a student can appear in more than one aid category.
Source: IPEDS Student Financial Aid 2013-14 survey Part C for Fall 2012

Educational and General Expenditures by Function
For Fiscal Year Ending June 30, 2013
Core Expenses
Expense Function Reported Values % of Total Core
Expenses
Core Expenses/FTE
Enrollment**
Instruction $14,314,108 31% $6,379
Research $3,838,173 8% $1,710
Public Service $4,745,720 10% $2,115
Academic Support $2,140,986 5% $954
Institutional Support $14,623,303 31% $6,517
Student Services $3,276,041 7% $1,460
Other Core Expenses $3,649,661 8% $1,626
Total Core Expenses $46,587,992 100% $20,761
Total Expenses $55,102,452 $24,555
Core expenses include expenses for instruction, research, public service, academic support, institutional support, student
services, operation and maintenance of plant, depreciation, scholarships and fellowships expenses, other expenses, and
nonoperating expenses.
**Based on 12-month student FTE of 2,244
Sources: IPEDS Finance Survey Summary
WVSU Research & Development Corp. Annual Financial Statement FY 2013

Revenues and Other Additions by Source
For Fiscal Year Ending June 30, 2013
Tuition and Fees $8,751,219
Federal Operating Grants and Contracts $13,305,666
State Operating Grants and Contracts $3,139,842
Local/Private Operating Grants and Contracts $544,719
Sales and Services of Auxiliary Enterprises $5,502,198
Sales and Services of Educational Activities $68,483
Other Sources - Operating $3,087,298
Total Operating Revenues* $34,399,425
Total All Revenues** $54,507,118
*Operating revenues and expenses result from providing goods and services. Nonoperating revenues are those
outside the activities that are part of the operating activities of the Institution. Most government appropriations are
nonoperating because they are not generated by the operations of the Institution.
**All revenues consists of the sum of total operating revenues, total nonoperating revenues, and total other
revenues and additions (the sum of capital grants and gifts and a calculated value for other revenues and additions).
Sources: IPEDS Finance Survey Part B, Part D
WVSU Research & Development Corp. Annual Financial Statement FY 2013

Facilities
Facility
Year Built or Acquired
Original Cost
ACEOP Administrative Bldg.
2005
$535,000
Austin W. Curtis, Sr., Complex
2003
$410,000
Cole Complex
1982
$2,700,000
Davis Fine Arts
1964
$1,058,000
Dawson Hall
1918
$96,000
Drain-Jordan Library
1951
$61,000
East Hall
1895
$2,000
Ferguson-Lincoln
1974
$310,242
Ferrell Administration
1925
$374,000
Fleming Hall
1941
$328,000
Football Stadium Quarters
1965
$145,000
Gore Hall
1926
$125,000
Hamblin Hall
1953
$910,000
Hill Hall
1936
$130,000
Leon Sullivan Hall
1969
$2,366,000
Prillerman Hall
1936
$125,000
Prillerman Hall Quarters
1965
$145,000
Wallace Hall
1970
$2,731,000
Wilson Student Union
1965
$1,092,000

Physical Plant Assets for Fiscal Year 2013
Type of Asset
Book Value at
Beginning of Year
Additions During
Year
Deductions During
Year
Book Value at End
of Year
Land and Land
Improvements 3,064,585 162,664 -- 3,227,249
Infrastructure 4,149,923 -- -- 4,149,923
Buildings 41,065,163 1,128,634 -- 42,193,797
Construction in
Progress 1,122,961 1,318,076 -- 2,441,037
Equipment,
Including Art and
Library Collections
12,595,368 -- $32,063 12,563,305
Source: IPEDS Finance Survey Part A

Alumni by State as of July 2013
State Number State Number
Alabama 44 Nebraska 6
Alaska 3 Nevada 41
Arizona 36 New Hampshire 4
Arkansas 5 New Jersey 180
California 204 New Mexico 8
Colorado 36 New York 272
Connecticut 35 North Carolina 437
District of Columbia 212 North Dakota 1
Delaware 28 Ohio 652
Florida 441 Oklahoma 26
Georgia 323 Oregon 4
Hawaii 4 Pennsylvania 315
Idaho 1 Rhode Island 6
Illinois 141 South Carolina 207
Indiana 86 South Dakota 0
Iowa 7 Tennessee 121
Kansas 12 Texas 200
Kentucky 142 Utah 3
Louisiana 37 Vermont 2
Maine 39 Virginia 538
Maryland 480 Washington 21
Massachusetts 39 West Virginia 14,873
Michigan 264 Wisconsin 11
Minnesota 16 Wyoming 3

Mississippi 22 Territories/Foreign
Countries 24
Missouri 41 APO 8
Montana 4 Total 22,070*
*Total includes 1,405 with no city/state listed or available.

Drain-Jordan Library Collections
Fiscal Year 2012-2013
Category
Held at the End of the Fiscal Year
1. Books, Serial Backfiles, and Other Materials*
(Includes Government Documents Cataloged in LC)
185,723
a. E-Books 5,803
b. Microform Units 194,375
c. Audiovisual Materials - Units 4,418
2. Use of electronic resources**
a. Use of successful full-text article requests (journals) 37,467
b. Number of Regular Searches (Database) 194,422
MA
Source: * ALS (Academic Libraries Survey) 2012-2013
**ACRL (Association of College and Research Libraries) 2012-2013 report
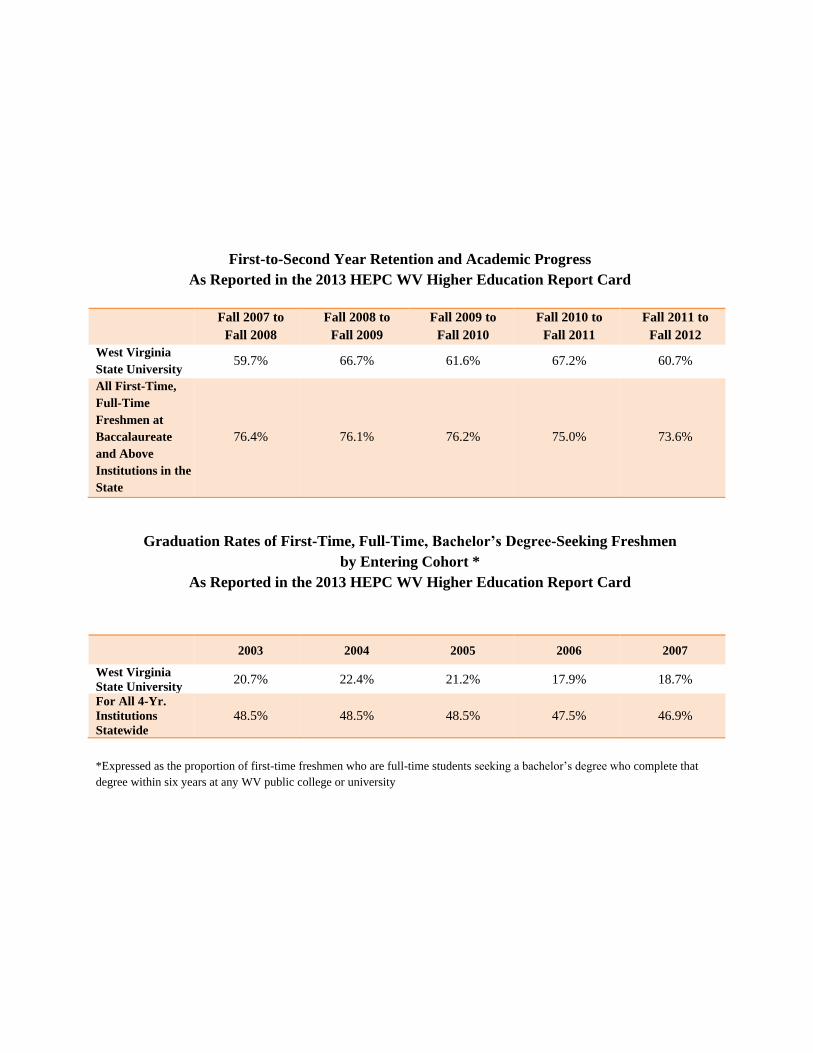
First-to-Second Year Retention and Academic Progress
As Reported in the 2013 HEPC WV Higher Education Report Card
Fall 2007 to
Fall 2008
Fall 2008 to
Fall 2009
Fall 2009 to
Fall 2010
Fall 2010 to
Fall 2011
Fall 2011 to
Fall 2012
West Virginia
State University 59.7% 66.7% 61.6% 67.2% 60.7%
All First-Time,
Full-Time
Freshmen at
Baccalaureate
and Above
Institutions in the
State
76.4% 76.1% 76.2% 75.0% 73.6%
Graduation Rates of First-Time, Full-Time, Bachelor’s Degree-Seeking Freshmen
by Entering Cohort *
As Reported in the 2013 HEPC WV Higher Education Report Card
2003 2004 2005 2006 2007
West Virginia
State University 20.7% 22.4% 21.2% 17.9% 18.7%
For All 4-Yr.
Institutions
Statewide
48.5% 48.5% 48.5% 47.5% 46.9%
*Expressed as the proportion of first-time freshmen who are full-time students seeking a bachelor’s degree who complete that
degree within six years at any WV public college or university


![STATE OF WEST VIRGINIA AUDIT REPORT OF WEST VIRGINIA STATE ... · WEST VIRGINIA STATE POLICE INTRODUCTION The West Virginia State Police [State Police] was created in 1919 by Chapter](https://static.fdocuments.us/doc/165x107/5e268e4aa6c417777a2293bb/state-of-west-virginia-audit-report-of-west-virginia-state-west-virginia-state.jpg)