WEST COAST BIOREGION - Department of Fisheries · changes from limestone to predominantly granite...
47
WEST COAST BIOREGION 25 STATUS REPORTS OF THE FISHERIES AND AQUATIC RESOURCES OF WESTERN AUSTRALIA 2015/16 WEST COAST BIOREGION ABOUT THE BIOREGION The marine environment of the West Coast Bioregion between Kalbarri and Augusta is predominantly a temperate oceanic zone, but it is heavily influenced by the Leeuwin Current, which transports warm tropical water southward along the edge of the continental shelf. The Integrated Marine and Coastal Regionalisation for Australia (IMCRA V 4.0) scheme divides this Bioregion into three meso-scale regions: Abrolhos Islands, Central West Coast and Leeuwin Naturaliste (West Coast Overview Figure 1). Most of the fish stocks of the region are temperate, in keeping with the coastal water temperatures that range from 18° C to about 24° C. The Leeuwin Current is also responsible for the existence of the unusual Abrolhos Islands coral reefs at latitude 29° S and the extended southward distribution of many tropical species along the West Coast and even into the South Coast. The Leeuwin Current system, which can be up to several hundred kilometres wide along the West Coast, flows most strongly in autumn/winter (April to August) and has its origins in ocean flows from the Pacific through the Indonesian archipelago. The current is variable in strength from year-to-year, flowing at speeds typically around 1 knot, but has been recorded at 3 knots on occasions. The annual variability in current strength is reflected in variations in Fremantle sea levels, and is related to El Niño or Southern Oscillation events in the Pacific Ocean. Weaker counter-currents on the continental shelf (shoreward of the Leeuwin Current), such as the Capes Current that flows northward from Cape Leeuwin as far as Shark Bay, occur during summer and influence the distribution of many of the coastal finfish species. The most significant impact of the clear, warm, low- nutrient waters of the Leeuwin Current is on the growth and distribution of the temperate seagrasses. These form extensive meadows in protected coastal waters of the West Coast Bioregion, generally in depths of 20 m (but up to 30 m), and act as major nursery areas for many fish species and particularly for the western rock lobster stock. The West Coast is characterised by exposed sandy beaches and a limestone reef system that creates surface reef lines, often about 5 kilometres off the coast. Further offshore, the continental shelf habitats are typically composed of coarse sand interspersed with low limestone reef associated with old shorelines. There are few areas of protected water along the west coast, the exceptions being within the Abrolhos Islands, the leeward sides of some small islands off the Midwest Coast, plus behind Rottnest and Garden Islands in the Perth metropolitan area. The two significant marine embayments in the West Coast are Cockburn Sound and Geographe Bay. Along the West Coast, there are 4 significant estuarine systems – the Swan/Canning, Peel/Harvey and Leschenault estuaries and Hardy Inlet (Blackwood estuary). All of these are permanently open to the sea and form an extension of the marine environment except when freshwater run- off displaces the oceanic water for a short period in winter and spring. Southward of Cape Naturaliste, the coastline changes from limestone to predominantly granite and becomes more exposed to the influences of the Southern Ocean. The ecosystem boundaries as defined by IMCRA (V 4.0) in the bioregion are depicted in West Coast Overview Figure 1. The potential threats and risks to these ecosystems are often similar. For simplicity risk ratings were allocated by grouping the ecosystems into two broad groups, estuarine or marine. However, if a particular ecosystem is unique and/or is exposed to different or significant threats, risk was allocated to these ecosystems separately.
-
Upload
duongtuyen -
Category
Documents
-
view
216 -
download
3
Transcript of WEST COAST BIOREGION - Department of Fisheries · changes from limestone to predominantly granite...

WEST COAST BIOREGION
25 STATUS REPORTS OF THE FISHERIES AND AQUATIC RESOURCES OF WESTERN AUSTRALIA 2015/16
WEST COAST BIOREGION
ABOUT THE BIOREGION
The marine environment of the West Coast Bioregion between Kalbarri and Augusta is predominantly a temperate oceanic zone, but it is heavily influenced by the Leeuwin Current, which transports warm tropical water southward along the edge of the continental shelf. The Integrated Marine and Coastal Regionalisation for Australia (IMCRA V 4.0) scheme divides this Bioregion into three meso-scale regions: Abrolhos Islands, Central West Coast and Leeuwin Naturaliste (West Coast Overview Figure 1).
Most of the fish stocks of the region are temperate, in keeping with the coastal water temperatures that range from 18° C to about 24° C. The Leeuwin Current is also responsible for the existence of the unusual Abrolhos Islands coral reefs at latitude 29° S and the extended southward distribution of many tropical species along the West Coast and even into the South Coast.
The Leeuwin Current system, which can be up to several hundred kilometres wide along the West Coast, flows most strongly in autumn/winter (April to August) and has its origins in ocean flows from the Pacific through the Indonesian archipelago. The current is variable in strength from year-to-year, flowing at speeds typically around 1 knot, but has been recorded at 3 knots on occasions. The annual variability in current strength is reflected in variations in Fremantle sea levels, and is related to El Niño or Southern Oscillation events in the Pacific Ocean.
Weaker counter-currents on the continental shelf (shoreward of the Leeuwin Current), such as the Capes Current that flows northward from Cape Leeuwin as far as Shark Bay, occur during summer and influence the distribution of many of the coastal finfish species.
The most significant impact of the clear, warm, low-nutrient waters of the Leeuwin Current is on the growth and distribution of the temperate seagrasses. These form extensive meadows in protected coastal waters of the West Coast Bioregion, generally in depths of 20 m (but up to 30 m), and act as major nursery areas for many fish species and particularly for the western rock lobster stock.
The West Coast is characterised by exposed sandy beaches and a limestone reef system that creates surface reef lines, often about 5 kilometres off the coast. Further offshore, the continental shelf habitats are typically composed of coarse sand
interspersed with low limestone reef associated with old shorelines. There are few areas of protected water along the west coast, the exceptions being within the Abrolhos Islands, the leeward sides of some small islands off the Midwest Coast, plus behind Rottnest and Garden Islands in the Perth metropolitan area.
The two significant marine embayments in the West Coast are Cockburn Sound and Geographe Bay. Along the West Coast, there are 4 significant estuarine systems – the Swan/Canning, Peel/Harvey and Leschenault estuaries and Hardy Inlet (Blackwood estuary). All of these are permanently open to the sea and form an extension of the marine environment except when freshwater run-off displaces the oceanic water for a short period in winter and spring.
Southward of Cape Naturaliste, the coastline changes from limestone to predominantly granite and becomes more exposed to the influences of the Southern Ocean.
The ecosystem boundaries as defined by IMCRA (V 4.0) in the bioregion are depicted in West Coast Overview Figure 1. The potential threats and risks to these ecosystems are often similar. For simplicity risk ratings were allocated by grouping the ecosystems into two broad groups, estuarine or marine. However, if a particular ecosystem is unique and/or is exposed to different or significant threats, risk was allocated to these ecosystems separately.
WEST COAST BIOREGION
DEPARTMENT OF FISHERIES 26
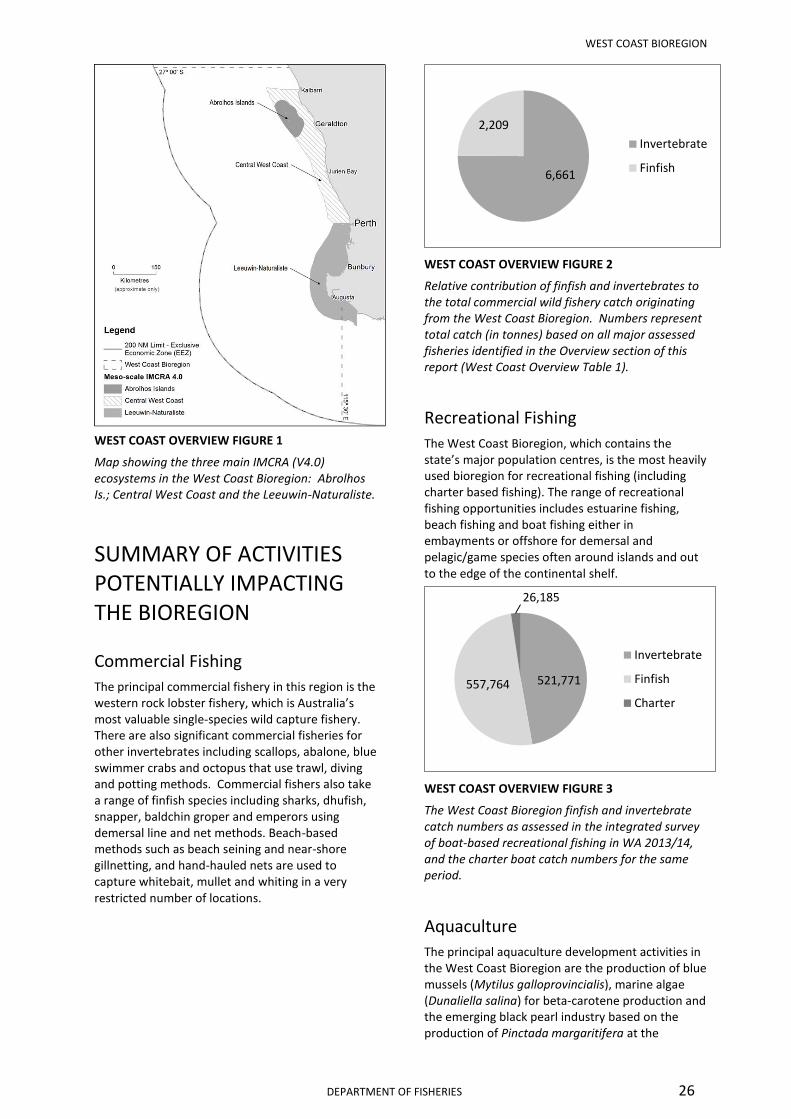
WEST COAST OVERVIEW FIGURE 1
Map showing the three main IMCRA (V4.0) ecosystems in the West Coast Bioregion: Abrolhos Is.; Central West Coast and the Leeuwin-Naturaliste.
SUMMARY OF ACTIVITIES POTENTIALLY IMPACTING THE BIOREGION
Commercial Fishing
The principal commercial fishery in this region is the western rock lobster fishery, which is Australia’s most valuable single-species wild capture fishery. There are also significant commercial fisheries for other invertebrates including scallops, abalone, blue swimmer crabs and octopus that use trawl, diving and potting methods. Commercial fishers also take a range of finfish species including sharks, dhufish, snapper, baldchin groper and emperors using demersal line and net methods. Beach-based methods such as beach seining and near-shore gillnetting, and hand-hauled nets are used to capture whitebait, mullet and whiting in a very restricted number of locations.
WEST COAST OVERVIEW FIGURE 2
Relative contribution of finfish and invertebrates to the total commercial wild fishery catch originating from the West Coast Bioregion. Numbers represent total catch (in tonnes) based on all major assessed fisheries identified in the Overview section of this report (West Coast Overview Table 1).
Recreational Fishing
The West Coast Bioregion, which contains the state’s major population centres, is the most heavily used bioregion for recreational fishing (including charter based fishing). The range of recreational fishing opportunities includes estuarine fishing, beach fishing and boat fishing either in embayments or offshore for demersal and pelagic/game species often around islands and out to the edge of the continental shelf.
WEST COAST OVERVIEW FIGURE 3
The West Coast Bioregion finfish and invertebrate catch numbers as assessed in the integrated survey of boat-based recreational fishing in WA 2013/14, and the charter boat catch numbers for the same period.
Aquaculture
The principal aquaculture development activities in the West Coast Bioregion are the production of blue mussels (Mytilus galloprovincialis), marine algae (Dunaliella salina) for beta-carotene production and the emerging black pearl industry based on the production of Pinctada margaritifera at the
6,661
2,209
Invertebrate
Finfish
521,771 557,764
26,185
Invertebrate
Finfish
Charter

WEST COAST BIOREGION
27 STATUS REPORTS OF THE FISHERIES AND AQUATIC RESOURCES OF WESTERN AUSTRALIA 2015/16
Abrolhos Islands. The main mussel farming area is in southern Cockburn Sound, where conditions are sheltered and the nutrient and planktonic food levels are sufficient to promote good growth rates. Owing to the generally low productivity of the Western Australian coastline under the influence of the Leeuwin Current, areas outside embayments (where nutrient levels are enhanced) are unsuitable for bivalve aquaculture. Initiatives to expand the number of aquaculture sectors in this bioregion currently include those for octopus, live rock/coral and finfish, the Department of Fisheries is in the process of securing strategic environmental approvals for Mid-West Aquaculture Development Zone.
Tourism
The State capital, Perth, is the principal gateway to more than two million visitors to Western Australia each year and a major international transit point for travellers arriving in Australia from Europe and Asia. The south-west of the state is also an important tourism destination for international and interstate visitors, as well as for Western Australian residents. Beach-going is among the most popular leisure activities for tourists in the West Coast Bioregion. Surfing, fishing, SCUBA diving and snorkelling, windsurfing, whale watching and other marine wildlife experiences are also popular tourist activities.
Shipping and Maritime Activity
The West Coast Bioregion contains several major port facilities, including the State’s busiest general cargo port (Fremantle), as well as the Royal Australian Navy’s largest base (HMAS Stirling) on Garden Island. In addition to handling most of Western Australia’s container trade, significant quantities of non-containerised cargo passes through Fremantle, including: motor vehicles, steel and machinery imports, livestock exports and bulk commodities, such as petroleum, grain, alumina, iron ore, mineral sands, fertilisers and sulphur. Two other major commercial ports at Bunbury and Geraldton, primarily export iron ore, grain, mineral sands and alumina. In addition to commercial and naval shipping, international cruise ship visitations have increased to record levels in recent years and some cruise liners are now home-based in Fremantle.
Major shipbuilding, repair, maintenance and offshore construction support industries are also located at Henderson in the north-eastern corner of Cockburn Sound. Collectively, these enterprises directly employ over 2000 people, indirectly
support 3000 more jobs and generate around $700 million annually in trade.
Other Activities
High rates of population growth and boat ownership in Western Australia have strained recreational boating facilities around major population centres, particularly in the Perth metropolitan region. New and upgraded marinas and boat launching facilities have therefore been completed or are planned to accommodate this demand. In addition, major coastal infrastructure developments have been planned for an outer deep-water harbour at Fremantle and for a deep-water iron-ore port at Oakajee, 24 km north of Geraldton. Two large desalination plants at Kwinana and Binningup (22km North of Bunbury), which supply approximately half of Perth’s freshwater requirements, also operate in the bioregion.
BIOREGIONAL SPECIFIC ECOSYSTEM MANAGEMENT Within each Bioregion there are a range of management measures that have been implemented to manage the potential impact of activities (See Chapter 3 for an overview). Management measures specific to the West Coast Bioregion include:
Spatial Closures
The marine benthic habitats and their associated biodiversity along most of the West Coast are largely protected from any physical impact of commercial fishing due to the extensive closures to trawling. These closures inside 200m depth were introduced in the 1970s and 1980s, in recognition of the significance of extensive areas of seagrass and reef as fish habitat (West Coast Overview Figure 4). Demersal gillnet and longline fishing was also prohibited from waters inside the 250m isobath between 31⁰ and 33⁰ South in November 2007. The extent of these areas means that most of the West Coast Bioregion inside 200m depth could be classified as one of the marine protected area IUCN categories (Ecosystem Management Table 1).
Protection of fish habitat and biodiversity is also provided by marine protected areas consistent with IUCN categories of I, II and III along the West Coast including: Fish Habitat Protection Areas (FHPAs) at the Abrolhos Islands, Lancelin Island Lagoon, Cottesloe Reef, and Kalbarri Blueholes; Reef Observation Areas within the Abrolhos Islands FHPA and closures to fishing under s.43 of the Fish Resources Management Act 1994 at Yallingup Reef,

WEST COAST BIOREGION
DEPARTMENT OF FISHERIES 28
Cowaramup Bay, the Busselton Underwater Observatory and around the wrecks of the Saxon Ranger (Shoalwater Bay) and Swan (Geographe Bay). In addition, marine conservation areas proclaimed under the Conservation and Land Management Act 1984 exist at Jurien Bay, Marmion, Swan Estuary, Shoalwater Islands, and Ngari Capes Marine Park between Cape Leeuwin and Cape Naturaliste; and the Rottnest Island Marine Reserve. (West Coast Overview Figure 5).
The Commonwealth Government is also undertaking a Marine Bioregional Planning process for Commonwealth waters between Kangaroo Island, South Australia and Shark Bay.
WEST COAST OVERVIEW FIGURE 4
Map showing areas of permanent and extended seasonal closures to trawl fishing in the West Coast Bioregion. The areas permanently closed are consistent with IUCN marine protected area category IV.
WEST COAST ECOSYSTEM MANAGEMENT TABLE 1
The areas and proportions of the West Coast Bioregion making up State Waters and all continental shelf waters,
out to 200 m depth, which meet the IUCN criteria for classification as marine protected areas. This table does not
yet include the closures that may be implemented by the Commonwealth as part of their marine planning zones.
IUCN category
or equivalent
State Waters only (10,088 km
2)
All Waters (481,488 km
2 (including State Waters))
Fisheries Existing MPA Fisheries Existing MPA
km2 % km
2 % km
2 % km
2 %
I 0 0 0 0 0 0 0 0
II 1 < 1 171 2 1 < 1 171 < 1
III 0 0 0 0 0 0 0 0
IV 4,500 44 1,900 19 33,600 7 1,900 < 1
V 0 0 0 0 0 0 0 0
VI 3,400 34 116 1 445,700 93 116 < 1

WEST COAST BIOREGION
29 STATUS REPORTS OF THE FISHERIES AND AQUATIC RESOURCES OF WESTERN AUSTRALIA 2015/16
WEST COAST OVERVIEW FIGURE 5
Map showing current and proposed formal marine protected areas in the West Coast Bioregion.
ECOSYSTEM MONITORING AND STATUS In order to assess the adequacy of management arrangements aimed at ensuring sustainability of the ecological assets within the West Coast Bioregion, the Department must identify and monitor trends in the condition of these resources. This is achieved through application of an Ecosystem Based Fisheries Management (EBFM) framework (Fletcher, et al., 2010 see How to use this Volume for more information) to identify, in a hierarchical manner, the key ecological resources that require ongoing monitoring and assessment. (See How to Use section for more details). These key ecological assets identified for the West Bioregion are identified in West Coast Ecosystem
Management Figure 6 and their current risk status reported on in the following sections.
External Drivers
External factors include factors impacting at the bioregional-level that are likely to affect the ecosystem as whole and may not fall within the direct control of Fishery legislation (e.g. climate change). An understanding of these factors, which are typically environmental (cyclones, ocean currents) is necessary to fully assess the performance of the ecological resource. The main external drivers identified with potential to affect the West Coast Bioregion include climate and introduced pests and diseases.

WEST COAST BIOREGION
DEPARTMENT OF FISHERIES 30
External Drivers
Estuarine
Nearshore
Inshore & Offshore Demersal
Pelagic
Finfish
Estuarine/Nearshore
Inshore
Crustaceans
Nearshore
Inshore
Molluscs
Captured Species
'Fish'
Mammals
Birds
Reptiles
Non-'Fish'
Listed Species
Estuarine
Marine
Abrolhos
Habitats
Estuarine
Marine
Abrolhos
Ecosystems
West Coast Bioregion
Ecological Assets
WEST COAST ECOSYSTEM MANAGEMENT FIGURE 6 Component tree showing the ecological assets identified and separately assessed for the West Coast Bioregion.
Climate
External Drivers Current Risk Status
Climate HIGH (long term)
Some climate change information has been taken into account in the rock lobster stock assessment process but further information is required to examine potential impacts on this bioregion.
Introduced Pests and Diseases
External Drivers Current Risk Status
Introduced Pests LOW
Introduced Diseases LOW
Port monitoring plans have been implemented targeting high risk port locations. These designs have been developed in line with the National System for introduced marine pest monitoring. The introduced species Didemnum perlucidum has recently been detected at the Abrolhos Islands.
Captured Species
Finfish
Estuarine
Captured Species
Aquatic zone Ecological Risk
Finfish Estuarine HIGH (non-fishing)
There is concern for some indicator fish stocks within estuaries in the West Coast Bioregion mainly due to external (non-fishing) factors (e.g. poor water quality and other environmental factors).
Nearshore
Captured Species
Aquatic zone Ecological Risk
Finfish Nearshore SIGNIFICANT
With the increasing concerns for Australian herring, tailor and whiting in the nearshore regions, additional activities are being undertaken to assess these stocks and to develop methods to measure shore-based fishing catch and effort.

WEST COAST BIOREGION
31 STATUS REPORTS OF THE FISHERIES AND AQUATIC RESOURCES OF WESTERN AUSTRALIA 2015/16
Inshore (20-250m depth) and Offshore (>250m depth) Demersal
Captured Species
Aquatic zone Ecological Risk
Finfish Inshore and Offshore Demersal
MODERATE
Following assessments of the inshore demersal indicator species (dhufish, pink snapper, baldchin groper), management actions were implemented to reduce both the commercial and recreational catch levels by 50% of their 2005/06 levels. Based on level 3 assessments of indicator stocks in 2013, this resource is now considered to be in a recovery phase.
While the deep-water indicator species are vulnerable to overfishing, current catch levels are low and therefore the stocks are not at risk. However, long term management arrangements for fishing in these depths, particularly for the recreational sector are still being finalised.
Pelagic
Captured species
Aquatic zone Ecological Risk
Finfish Pelagic LOW
There is minimal capture of pelagic fish in this bioregion.
Invertebrates
Crustaceans
Captured species
Aquatic zone Ecological Risk
Crustaceans (Crabs)
Estuarine/Nearshore HIGH
Crustaceans (Lobsters)
Inshore LOW
Crustaceans (Prawns)
Inshore LOW
The stocks of crabs in Cockburn Sound have now recovered and the fishery has re-opened. Assessment of other crab stocks in this region (e.g. Peel/Harvey) has been completed and all are considered to be in an adequate state and fishing levels are acceptable.
The stock levels of western rock lobster and prawns are both currently at appropriate levels. The strong management that was applied to the rock lobster fishery has ensured that the lobster spawning stock is currently at record high levels despite on-going
relatively low puerulus recruitment over the past 6 seasons.
Molluscs
Captured species Aquatic zone Ecological Risk
Molluscs (Abalone)
Nearshore HIGH
Molluscs (Scallops)
Inshore HIGH
The stocks of abalone are conservatively managed with strong management controls on both commercial and recreational fishers. However, the marine heat wave in 2010/11 caused the almost total loss of Roes abalone in the Kalbarri region and that region has consequently been closed since 2011/12.
The stock of scallops is considered environmentally limited with the Abrolhos Island fishery closed and no fishing occurring in the Mid-West Trawl Fishery.
Listed species
A variety of endangered, threatened and protected1
(ETP) species can be found within the West Coast Bioregion, including cetaceans, sealions, elasmobranchs, seahorses and pipefish and sea/shore birds. These species are protected by various international agreements and national and state legislation. Primary pieces of legislation include the Commonwealth Environment Protection and Biodiversity Conservation Act 1999, the Western Australian Wildlife Conservation Act 1950, and the Fish Resources Management Act 1994.
Fish
Listed species Ecological Risk
Fish MODERATE
Grey nurse shark (Carcharias taurus) is protected under State and Commonwealth legislation throughout this and all bioregions. Blue groper (Rottnest Island), cobbler (Swan Canning)and baldchin groper (Abrolhos Islands FHPA between 1 Nov and 31 Jan) cannot be landed by commercial or recreational fishers in the particular areas and periods given parentheses.
1 It must be noted that merely being on the listed species list does not automatically indicate that a species is either threatened or endangered.

WEST COAST BIOREGION
DEPARTMENT OF FISHERIES 32
Non-Fish
Listed species Ecological Risk
Mammals MODERATE
Birds and Reptiles LOW
The only identified risk to bird species was to little penguins from boat strikes and non-fishing activities.
The West Coast Bioregion lies to the south of most marine turtles’ distributions and, thus, there are minimal risks to turtles from fishing activities within this bioregion. The leatherback turtle, which is relatively more common in temperate latitudes, is rarely encountered in continental shelf waters, where the majority of fishing activities occur. Therefore, fishing is also considered to pose a low risk to this species. In addition, the small trawl fishery that operates around the Abrolhos Islands uses bycatch reduction devices, which are effective at minimising the capture of turtles.
Sea lion exclusion devices have now been implemented for rock lobster pots near Australian sea lion breeding colonies. Demersal gillnet fishing effort, which has historically been responsible for a very small number sea lion captures, has been reduced to less than 10% of its peak level in the late 1980s. Regulated modifications rock lobster fishing gear configuration during humpback and southern right whales’ northerly winter migration, have successfully reduced entanglement rates by more than 65% in recent years. Thus, risks to mammals from fishing activities in the West Coast Bioregion have decreased in recent years (but are not yet considered to be low).
Habitats and Ecosystems Due to the counter-acting Leeuwin and Capes currents, the West Coast Bioregion has the unique characteristic of containing tropical, sub-tropical and temperate ecosystems.
The key habitats occurring in depths of less than 40 m (where the vast majority of relevant fisheries resources are located and fishing activities are undertaken in this bioregion) include:
Algae: Along the WCB, algae attach to intertidal and subtidal rocky substrata and in turn, are habitat to a variety of organisms. Algal assemblages contribute to marine nutrient and carbon cycling are also an important as a food source, nursery grounds and shelter for a variety of organisms. Along the WCB, there is a gradual transition from a subtropical flora
of the Abrolhos Islands and north of Geraldton to a cold-temperate flora found along the southwest corner and south coast of WA. Macroalgae along the southwestern and southern coasts of Australia are very diverse, with a high level of endemism.
Sand: The majority of seabed of the WCB is composed of soft, unconsolidated sediments. These sediments provide an important habitat for microalgae and benthic infauna.
Seagrasses: In temperate WA, seagrasses occupy approx. 20 000 km2 of shallow coastal and grow predominantly on sand from 1 – 35 m depth, but also on deep rock to over 50 m deep. Seagrasses provide of habitat for many fish and crustacean species, stabilise of coastal sediments and prevent of coastal erosion. In addition seagrasses are also important for primary production, CO2 uptake and nutrient cycling. The diversity of seagrasses in temperate south-western Australia is the highest for any temperate region, with 17 species within WCB and SCB combined.
Corals: Due to the cool temperate waters corals are not common in the WCB with the exception of the Abrolhos Islands, which are located offshore and are more exposed to the warm Leeuwin Current. The Abrolhos Islands are well-known for their high species diversity, coral reefs and unique mixture of temperate and tropical species. Currently there are 184 known coral species at the Abrolhos. Elsewhere in the WCB corals occur in patches around offshore islands, usually comprised of only a few species.
Sponges: In southwestern Australia, sponges are found in areas where algae are less dominant, which includes areas deeper than 30 m and caves. As they are sessile filter-feeders, sponges flourish in areas of high current, although large sponges are also found in calmer deeper waters. In areas with an absence of reef-building corals, sponges function as large epibenthos that form the three-dimensional structure of subtidal reefs providing shelter for other organisms, such as worms, crustaceans, echinoderms, molluscs and fish.
Habitats
Habitats Aquatic zone Current Risk Status
West Coast Habitat
Estuarine SIGNIFICANT (non-fishing)
West Coast Habitat
Marine LOW
Abrolhos Islands
Marine MODERATE

WEST COAST BIOREGION
33 STATUS REPORTS OF THE FISHERIES AND AQUATIC RESOURCES OF WESTERN AUSTRALIA 2015/16
The West Coast is a microtidal, relatively high-energy area, with clear water and few rivers. The coastline is characterised by long beaches with occasional limestone cliffs and headlands, with offshore limestone islands and reef complexes. There are numerous protected marine areas in the West Coast (West Coast Overview Figure 5). Spatial zoning restricts activities within these areas including preventing trawling.
The Peel Harvey Estuary habitats are under pressure due to poor water quality as a result of farming, canal development and urbanisation in the surrounding catchment. A benthic habitat monitoring program is planned to quantify impacts of recreational crabbing as a part of the MSC assessment process. Cockburn Sound which contains large areas of seagrass has been mined for shell sand since 1972. The permitted areas for mining have been increasingly restricted and regulated since the commencement of mining operations.
The main fisheries in the Central West Coast involve fishing gear which has minimal impacts to the benthic habitats. These include: western rock lobster which uses traps, Roes abalone which are hand collected and several fin fisheries that mainly use lines.
Due to the unique diversity of tropical and temperate habitats, the Abrolhos Islands were gazetted as WA’s first Fish Habitat Protection Area (FHPA) and have been placed on the National Estate Register. Due to this, the risks to Abrolhos Islands habitats are assessed separately to the bioregion as a whole.
The main activities at the Abrolhos are commercial rock lobster potting and line fishing and recreational fishing and diving. The Department has a long term coral reef monitoring program at the Abrolhos to detect potential impacts from human use and natural influences. A significant coral bleaching event was observed during the marine heat wave event in 2011 (Abdo et al. 2012)
1.
There are 45 public moorings installed at the Abrolhos Islands, distributed around the different island groups, to minimise impacts of anchoring to the benthic habitats. The commercial scallop fishery (which is currently closed) also operates away from coral reef habitats, predominately in areas of sand.
1Abdo DA, Bellchambers LM, Evans SN. 2012. Turning up the Heat: Increasing Temperature and Coral Bleaching at the High Latitude Coral Reefs of the Houtman Abrolhos Islands. PLoS ONE 7(8): e43878.
Ecosystems
Ecosystem Aquatic zone Current Risk Status
West Coast Estuarine SIGNIFICANT (non-fishing)
West Coast Marine MODERATE
Abrolhos Islands
Marine MODERATE
The estuarine ecosystems within this bioregion have been identified as being at significant risk, due to external factors (water quality issues due to high nutrient runoff from surrounding catchment) which have the potential to affect fish and other communities. Poor water quality within the Peel–Harvey and Swan–Canning estuaries and mass mortality events in Cockburn Sound are of particular concern.
An assessment of the community structure and trophic level of all commercially caught fish species over the past 30 years found no evidence of systematic changes that could be evidence of an unacceptable impact on this ecosystem (Hall and Wise, 2011)2. Continued monitoring of a deep water closed area will allow evaluation of potential ecosystem impacts of lobster fishing in deeper water ecosystems.
The Abrolhos Islands is noted for its high species diversity, which is attributed to the relatively equal mix of temperate and tropical species. Due to the uniqueness of the AIE in the West Coast Bioregion, it is assessed separately to the bioregion as a whole.
The Abrolhos Islands are protected within a ‘Fish Habitat Protection Area’, and are not considered to be at unacceptable risk from fisheries related activities. The first significant bleaching of corals was observed during the marine heat wave event along the Western Australian coast in 2011 (Abdo et
al. 2012)1 , with the impact of this event being
monitored as part of an ongoing monitoring program run by the Department. The program also includes monitoring of key invertebrate species, and the community structure of finfish within and outside of non-fishing areas.
2 Hall NG, and Wise BS. 2011. Development of an ecosystem approach to the
monitoring and management of Western Australian fisheries. FRDC Report – Project
2005/063. Fisheries Research Report, No. 215. Department of Fisheries, Western
Australia. 112 pp.

WEST COAST BIOREGION
DEPARTMENT OF FISHERIES 34
WEST COAST ROCK LOBSTER RESOURCE STATUS
REPORT 2016 S. de Lestang and M. Rossbach
OVERVIEWThe West Coast Rock Lobster Managed Fishery
(WCRLMF) targets the western rock lobster,
(Panulirus Cygnus), on the west coast of Western
Australia between Shark Bay and Cape Leeuwin by
both the commercial and recreational sector for
which formal IFM allocations have been
determined.
The commercial fishery was one of the first limited
entry fisheries in the world and for over 20 years
utilised a sophisticated Individual Transferrable
Effort system based on the number of allowable
baited pots. In 2010/11 the fishery began the
transition to an Individually Transferable Quota
(ITQ) fishery and now has a harvest strategy that
uses maximum economic yield as its management
target (DoF, 2014). This fishery has historically
been Australia’s most valuable single species wild
capture fishery and, in 2000, became the first
fishery in the world to achieve Marine Stewardship
Council (MSC) Certification. In 2012 it was the first
to be certified by MSC for the third time. The
commercial fishing season now begins on the 15
January each year and runs 12 months.
The recreational fishery extends from 15 October
each year until the following 30 June. Licenced
recreational fishers are allowed to each use two
baited pots or hand collection by diving to collect
legal sized and reproductive condition lobsters up
to the bag or boat based limit.
SUMMARY FEATURES 2016
Fishery Performance Commercial Recreational
Total Catch 2015 6086 t 267-394 t
Fishing Level Acceptable Acceptable
Stock/Resource Performance
Stock Status Assessment Indicators
Western Rock Lobster Sustainable - Adequate Annual: Integrated Model, Egg Production
EBFM Performance Asset Level Asset Level
Bycatch Low Risk Listed Species Negligible Risk
Habitat Low Risk Ecosystem Low Risk
Social
High Amenity
Low Risk
Economic GVP ($423 million)-Moderate Risk
Governance Review of Harvest Strategy External Drivers Moderate Risk
CATCH AND LANDINGS
The total landings of western rock lobster in 2015
from the WCRLMF were 6416 t. The commercial
catch was 6086 t compared to an allowable catch
of 6090 t (TACC of 6000 plus drip loss). The
recreational catch was estimated to be between
274-394 t compared to the TARC of 404 t (Western
Rock Lobster Figure 1).

WEST COAST BIOREGION
35 STATUS REPORTS OF THE FISHERIES AND AQUATIC RESOURCES OF WESTERN AUSTRALIA 2015/16
WESTERN ROCK LOBSTER FIGURE 1. Total landings by fishery (and combined) for western rock lobster.
WESTERN ROCK LOBSTER FIGURE 2. Levels of puerulus settlement in four regions of the fishery from 1968 until
2015.

WEST COAST BIOREGION
DEPARTMENT OF FISHERIES 36
WESTERN ROCK LOBSTER FIGURE 3. Modelled estimates (black) and projections (dotted line) of egg production
for the four breeding stock management areas based on a TACC of 6300 t. 75% CI is denoted in grey. Horizontal
lines represent the threshold (orange) and limit (red) reference points for breeding stock levels in each breeding
stock management area.
INDICATOR SPECIES ASSESSMENTS AND
STOCK STATUS
Western rock lobster - (Sustainable-
Adequate)
Western rock lobster (WRL) is considered a single
management unit in the West Coast Bioregion and
the same genetic stock extends into the South
Coast Bioregion (see de Lestang et al., 2016 - WRL
RAR 2016 for further details).
http://www.fish.wa.gov.au/Documents/wamsc_re
ports/wamsc_report_no_9.pdf
Fishery-independent egg production indices at all
sites are well above long-term levels and above
threshold reference levels indicating that the
biomass and egg production in all locations of the
fishery is at record high levels since the mid-1970s.
The breeding stock is therefore considered
adequate.
Fishery-independent recruitment (puerulus)
monitoring indicates that the current puerulus
settlement is continuing its recent pattern of being
just below its historic average (Western Rock
Lobster Figure 2).
The integrated population model indicates that a
continuation of fishing at similar or slightly higher
TACCs (e.g. 6300 t) over the coming five year

WEST COAST BIOREGION
37 STATUS REPORTS OF THE FISHERIES AND AQUATIC RESOURCES OF WESTERN AUSTRALIA 2015/16
period will continue to result in increasing biomass
and catch rates (see WRL RAR section 9.3.14 and
Western Rock Lobster Figure 3).
BYCATCH AND PROTECTED SPECIES
INTERACTIONS The main by-catch species landed in the WCRLMF
are octopus, champagne crabs (CC) and baldchin
grouper (BG). Octopus contribute most to total
by-catch landings with 10.2 t in 2015 and only
incidental landings of the other species being
recorded (1.1 and 1.5 t for CC and BG,
respectively).
The WCMRLF may interact with a number of
protected species with substantial improvements
having been achieved during the past decade (see
WRL EAR section 4).
To mitigate the risk to juvenile Australian sea lions
(ASL) all pots fished within designated sea lion
areas are now fitted with devices to stop the
accidental drowning of ASL. Since their
implementation there have been no records of
drowned ASL.
During the whale migration season (May – October
inclusive) all pots must comply with mitigation
measures aimed at reducing the entanglement of
migrating whales (see WRL EAR section 4). This
has resulted in a significant (80%) reduction in
reported whale entanglements. There were two
entanglements reported in 2015.
Turtles can also get caught in the float rigs of
lobster pots. In 2015 no turtles were reported to
have been entangled in lobster fishing gear.
HABITAT AND ECOSYSTEM
INTERACTIONS
While WRL may use a range of habitats throughout
their life-cycle, including shallow water reefs and
adjacent seagrass beds as juveniles, or un-
vegetated areas during their migratory phase
(‘whites’), the algal covered limestone reefs form
the habitat for the majority of the population.
WRL are an omnivorous generalist feeder, with a
diet that consists on a variety of invertebrate,
algae, carrion and bait. Results from monitoring in
areas closed and open to WRL fishing, established
to examine the potential ecosystem effects of WRL
removal, suggest that lobsters do not play a
keystone role in ecosystem functioning (see WRL
EAR section 6.2).
SOCIAL AND ECONOMIC OUTCOMES
Social The commercial rock lobster fishery is important
for regional employment with over 230
commercial vessels operating in 2015 with catch
handled by four main processing establishments.
The rock lobster fishery is also a major recreational
activity and provides a significant social benefit to
the Western Australian community with over
50,000 recreational fishers obtained rock lobster
licences in 2015. At current high stock levels there
is low risk to the social amenity.
Economic
The estimated average price across all processors
and all zones of the fishery received by commercial
fishers for the western rock lobster in 2015 was
$69.52/kg. This was an increase on the $60.40/kg
paid in 2014, and may be due to better fishing
practices and a stronger export market and
relatively lower Australian dollar. The increased
beach price with a slightly higher TACC resulted in
the overall value of the fishery increasing to $420
million. As the majority of landed lobsters are
exported to a single market (China) this represents
a moderate risk.
GOVERNANCE SYSTEM
Allowable Catch Tolerance Levels The landed commercial catch of 6086 was very
close to the Total Allowable Commercial Catch
(TACC) of 6000 t plus 1.5% for water loss (= 6090
t) and therefore the catch level was acceptable.
The upper end of the estimate of recreational
catch (274-394 t) was also close to the TARC of 404
t and was therefore also considered acceptable.
Harvest Strategy
A common Harvest Strategy and Decision Rules
(DoF, 2014) are used to set catch limits for both
commercial and recreational sectors on an annual
basis. The HSDR have a primary sustainability
objective to maintain egg production at
sustainable levels and a secondary economic
objective to target maximising the profitability of
the fishery i.e. at Maximum Economic Yield (MEY)
levels. The upper limit of the MEY assessment is
currently used to determine the upper limit of the
annual Total Allowable Catch (TAC) as this is the

WEST COAST BIOREGION
DEPARTMENT OF FISHERIES 38
basis of setting the Total Allowable Recreational
Catch (TARC).
Modelled future projections of the fishery and
MEY analysis indicates that a small (5 – 10%)
increase in TAC will move the commercial fishery
towards MEY and maintain healthy levels of egg
production. As such the commercial fishery has
requested an increase in the TACC from 6000 t in
2016 to 6300 t in 2017.
Compliance
The majority of enforcement effort is applied to
ensure that fishers’ catches are within their quota
entitlement.
Consultation
Consultation occurs between the Department and
the commercial sector either through the Western
Rock Lobster Council or the Annual Management
Meetings convened by the Western Australian
Fishing Industry Council. Consultation with
Recfishwest and other interested stakeholders is
conducted through specific meetings and the
Department’s website.
Management Initiatives
Consultation with the commercial industry and
Recfishwest on the review of the HSDR will begin
in 2017. This process will aim to incorporate some
of the outcomes from a recent FRDC project which
examined the current TAC setting methodology.
EXTERNAL DRIVERS (Moderate Risk)
The variations in western rock lobster recruitment
to the fishery are largely a result of variable levels
of puerulus settlement 3-4 year previously.
Catches are also dependent upon the
environmental conditions at the time of fishing.
Investigation into the puerulus downturn in 2007-
2009 have identified that when the spawning
started early (temperature driven) and was
coupled with low numbers of winter storms during
the larval phase, the puerulus settlement was
significantly lower.
At a longer time scale, western rock lobsters have
been rated a high risk to the effects of climate
change as many aspects of its life history are highly
sensitive to environmental conditions (Caputi et
al., 2010).
The economic performance of the fishery is
strongly affected by the value of the Australian
dollar (affecting the price of lobsters), fuel and
labour costs and status of the Chinese economy as
China imports nearly all of the western rock
lobsters.
REFERENCES Caputi N, Melville-Smith R, de Lestang S, Pearce P, and Feng M. 2010. The effect of climate change on the western rock lobster (Panulirus cygnus) fishery of Western Australia. Canadian Journal of Fish and Aquatic Sciences, 67, 85-96.
de Lestang S, Caputi N, and How J. 2016. Western Australian Marine Stewardship Council Report Series No. 9: Resource Assessment Report: Western Rock Lobster Resource of Western Australia. Department of Fisheries, Western Australia.
DOF. 2014. West Coast Rock Lobster Harvest Strategy and Control Rules 2014 – 2019. Fisheries Management Paper, no. 264.
Thompson AP, Hanley JR, and Johnson MS. 1996. Genetic structure of the western rock lobster, Panulirus cygnus, with the benefit of hindsight. Marine and Freshwater Research, 47: 889–896.

WEST COAST BIOREGION
39 STATUS REPORTS OF THE FISHERIES AND AQUATIC RESOURCES OF WESTERN AUSTRALIA 2015/16
WEST COAST ROE’S ABALONE RESOURCE STATUS
REPORT 2016 L. Strain, J. Brown and S. Walters
OVERVIEW
The Roe’s abalone (Haliotis roei) fishery is a dive
and wade fishery, operating in shallow coastal
waters along WA’s western and southern coasts.
The commercial Roe’s abalone fishery is managed
primarily through Total Allowable Commercial
Catches (TACCs), which are set annually for each of
the six management areas and allocated as
Individually Transferable Quotas (ITQs).
The recreational fishery is divided into three zones:
Zone 1 (Western Zone - including Perth
metropolitan area), Zone 2 (Northern Zone) and
Zone 3 (Southern Zone), with management
arrangements that include a specific abalone
recreational fishing licence, size limits, daily bag
and possession limits, temporal and spatial
closures, and a Total Allowable Recreational Catch
(TARC) in the Western Zone. Further details on the
fishery can be sourced from Hart et al. (2017).
SUMMARY FEATURES 2016
Fishery Performance Commercial Recreational
Total Catch 2015 51 t 15 - 25 t Perth Metro Area; 14 t Other
Fishing Level Acceptable Acceptable
Stock/Resource Performance
Stock Status Assessment Indicators
Roe’s abalone Sustainable - Adequate (some areas)
Annual: Catch, Catch Rates, Surveys
EBFM Performance Asset Level Asset Level
Bycatch Negligible Risk Listed Species Negligible Risk
Habitat Negligible Risk Ecosystem Negligible Risk
Social High Amenity
High Risk
Economic GVP - $1.2 million
High Risk
Governance TAC review (Area 7 / Zone 1) MSC full assessment underway
External Drivers High - Extreme Risk
CATCH AND LANDINGS
In 2015 the total commercial catch was 51 t whole
weight, a 4% increase from 2014 (49 t) and only
59% of the 87 t whole weight TACC (Roe’s Abalone
Figure 1). The commercial catch was less than the
TACC in Area 1 (0% caught), Area 2 (61% caught),
Area 5 (28% caught) and Area 6 (22% caught),
which was primarily driven by economic reasons
(low value of catch and few viable markets), high
cost of accessing these areas and prevailing
weather conditions (Area 6). Area 7 (Perth
metropolitan fishery) was the only management
area that fishers caught the entire TACC, while
Area 8 is still closed.
The total recreational catch of Roe’s abalone in
2015 was 34.4 t whole weight, which represents
about 40% of the total Roe’s abalone catch (Roe’s
Abalone Figure 1). The recreational catch includes
15 – 25 t (20.4 t) from the Perth metropolitan
stocks, and an estimate of 14 t for the rest of the
state (Western Zone excluding the Perth
metropolitan stocks and Southern Zone) derived
from a 2007 phone diary survey. The Perth
metropolitan fishery catch level was similar to that
taken in the last 4 years.

WEST COAST BIOREGION
DEPARTMENT OF FISHERIES 40
ROE’S ABALONE FIGURE 1. Roe’s abalone commercial and recreational catch (t, whole weight) by season as
recorded against the nearest calendar year.
INDICATOR SPECIES ASSESSMENTS AND
STOCK STATUS
Roe’s abalone (Sustainable-Adequate for
some areas) Roe’s abalone are found in commercial quantities
from the WA/SA border to Shark Bay. Evidence
suggests the existence of one single Roe’s abalone
population across this entire range but with three
adaptive populations (Sandoval-Castillo et al.
2015). The size at sexual maturity is approximately
40 mm shell length and the legal minimum length
for Roe’s abalone is 60 mm in most parts of the
fishery, which based on growth rates, protects 1 to
2 breeding year classes (see Hart et al. 2017).
The stock status is assessed using commercial and
recreational catch and effort, and fishery-
independent sampling. Trends in stock indicators
were used to determine the 2016 TACC for each
management area, and the TARC for Zone 1 of the
recreational fishery.
Area 1 (near WA/SA border): There was no fishing
in 2015. This area is a marginal part of the fishery
in a remote location making it uneconomical for
fishers given current market conditions.
Area 2 (Esperance): The catch in 2015 was 11 t
whole weight of the 18 t TACC. The standardised
catch per unit effort (SCPUE) has been gradually
declining since 2010 but it is above the threshold
reference level.
Area 5 (Albany): The catch in 2015 was 5.6 t whole
weight of the 20 t TACC. The SCPUE has reduced
slightly in the last three years but it is still above
the threshold reference level.
Area 6 (Capes): The catch in 2015 was 2.6 t whole
weight of the 12 t TACC. The SCPUE in 2015 was
above the threshold reference level and within the
historical range, but due to the prevailing weather
conditions resulting in low catch there is a degree
of uncertainty around the SCPUE estimate.
Area 8 (Kalbarri): Closed since the 2011/12 season
due to catastrophic mortality following the 2011
marine heat wave. With no evidence of natural
recovery, a restocking project has been initiated.
Perth Metropolitan Roe’s Abalone Fishery (Area
7/Zone 1): The commercial catch in 2015 was 31.7
t of the 32 t TACC, which was 4 t less than the
average historical catch/TACC (1999-2013). The
SCPUE in Area 7 has declined since 2005 but it is
still above the threshold reference level and the
TACC was set using the stock prediction model
(DoF 2017). The recreational catch estimate was
15 – 25 t (20.4 t) whole weight and has been
managed to the 20 t (± 2 t) TARC for the last 5
years. Despite the reduced recreational catch
through this period, the catch rates and mean
Roe’s abalone whole weight caught are still within
historical ranges.
Fishery-independent surveys indicate that the
density of harvest-sized (commercial) Roe’s

WEST COAST BIOREGION
41 STATUS REPORTS OF THE FISHERIES AND AQUATIC RESOURCES OF WESTERN AUSTRALIA 2015/16
abalone has declined in both subtidal and platform
habitats, and across both fished and unfished
areas over the last decade (Roe’s Abalone Figure
2a and b). The density of harvest-sized animals on
the reef platform declined by more than 80% from
2003 to 2012 but has since remained stable,
whereas in the reef subtidal habitat the density is
currently at the lowest recorded level (Roe’s
Abalone Figure 2a). Significantly, the levels of
decline have been even greater in areas where no
fishing occurs suggesting these declines are not
being generated by fishing (Roe’s Abalone Figure
2b). The trend in declining density is also present
in Age 1+ (17 – 32 mm) animals post marine heat
wave, when the recruitment density declined by
80% between 2010 and 2013, with 2012 – 2016
being the five lowest years on record (Roe’s
Abalone Figure 2c).
a)
b)
c)
ROE’S ABALONE FIGURE 2. Density of Roe’s abalone in the Perth metropolitan fishery (Area 7/Zone 1) from
fishery-independent surveys. a) Density of Roe’s abalone (71 mm+) in the subtidal and platform fished areas, b)
Density of Roe’s abalone (71 mm+) in the fished and unfished areas, c) Density of Roe’s 1+ abalone (17 – 32
mm) in the fished and unfished areas.
BYCATCH AND PROTECTED SPECIES
INTERACTIONS (Negligible Risk) Divers have the ability to target abalone of choice
(species, sizes and quality of abalone) and do not
inadvertently harvest bycatch in their normal
fishing activities. The only potential listed species
interaction is with the white shark (Carcharodon
carcharias), with some divers adopting the ‘shark
shield’ technology.
WEST COAST BIOREGION
DEPARTMENT OF FISHERIES 42
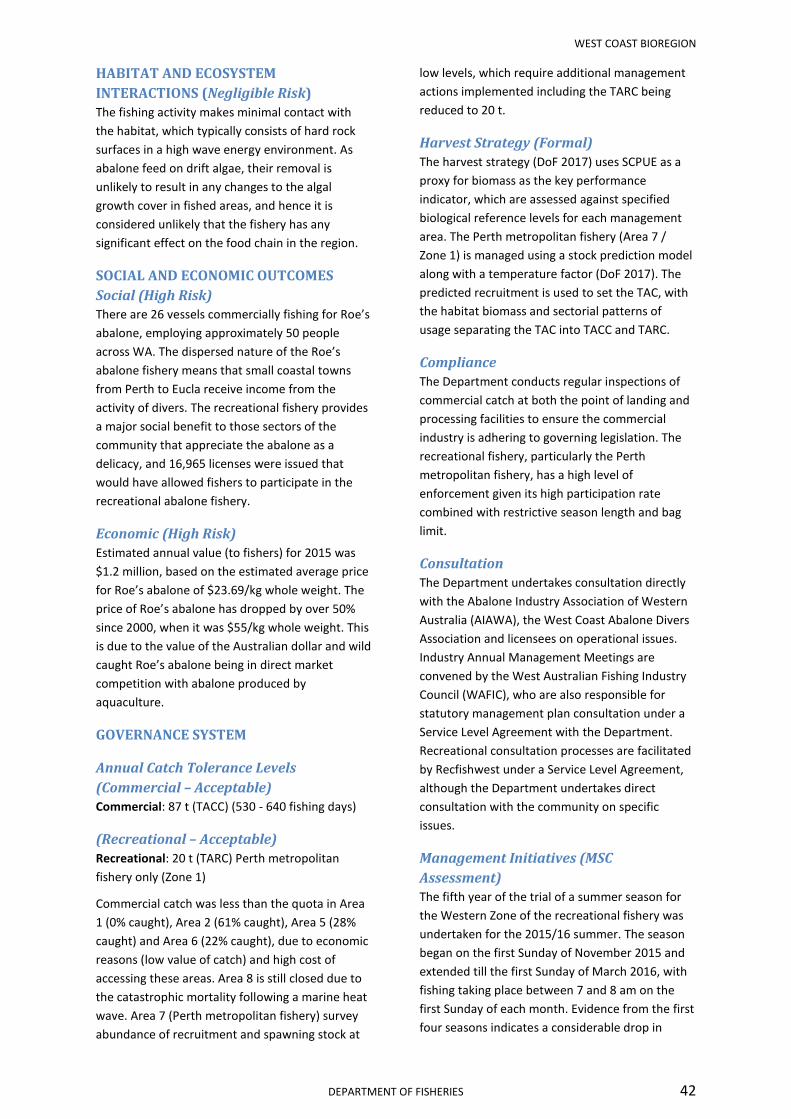
HABITAT AND ECOSYSTEM
INTERACTIONS (Negligible Risk)
The fishing activity makes minimal contact with
the habitat, which typically consists of hard rock
surfaces in a high wave energy environment. As
abalone feed on drift algae, their removal is
unlikely to result in any changes to the algal
growth cover in fished areas, and hence it is
considered unlikely that the fishery has any
significant effect on the food chain in the region.
SOCIAL AND ECONOMIC OUTCOMES
Social (High Risk) There are 26 vessels commercially fishing for Roe’s
abalone, employing approximately 50 people
across WA. The dispersed nature of the Roe’s
abalone fishery means that small coastal towns
from Perth to Eucla receive income from the
activity of divers. The recreational fishery provides
a major social benefit to those sectors of the
community that appreciate the abalone as a
delicacy, and 16,965 licenses were issued that
would have allowed fishers to participate in the
recreational abalone fishery.
Economic (High Risk)
Estimated annual value (to fishers) for 2015 was
$1.2 million, based on the estimated average price
for Roe’s abalone of $23.69/kg whole weight. The
price of Roe’s abalone has dropped by over 50%
since 2000, when it was $55/kg whole weight. This
is due to the value of the Australian dollar and wild
caught Roe’s abalone being in direct market
competition with abalone produced by
aquaculture.
GOVERNANCE SYSTEM
Annual Catch Tolerance Levels
(Commercial – Acceptable)
Commercial: 87 t (TACC) (530 - 640 fishing days)
(Recreational – Acceptable)
Recreational: 20 t (TARC) Perth metropolitan
fishery only (Zone 1)
Commercial catch was less than the quota in Area
1 (0% caught), Area 2 (61% caught), Area 5 (28%
caught) and Area 6 (22% caught), due to economic
reasons (low value of catch) and high cost of
accessing these areas. Area 8 is still closed due to
the catastrophic mortality following a marine heat
wave. Area 7 (Perth metropolitan fishery) survey
abundance of recruitment and spawning stock at
low levels, which require additional management
actions implemented including the TARC being
reduced to 20 t.
Harvest Strategy (Formal)
The harvest strategy (DoF 2017) uses SCPUE as a
proxy for biomass as the key performance
indicator, which are assessed against specified
biological reference levels for each management
area. The Perth metropolitan fishery (Area 7 /
Zone 1) is managed using a stock prediction model
along with a temperature factor (DoF 2017). The
predicted recruitment is used to set the TAC, with
the habitat biomass and sectorial patterns of
usage separating the TAC into TACC and TARC.
Compliance
The Department conducts regular inspections of
commercial catch at both the point of landing and
processing facilities to ensure the commercial
industry is adhering to governing legislation. The
recreational fishery, particularly the Perth
metropolitan fishery, has a high level of
enforcement given its high participation rate
combined with restrictive season length and bag
limit.
Consultation
The Department undertakes consultation directly
with the Abalone Industry Association of Western
Australia (AIAWA), the West Coast Abalone Divers
Association and licensees on operational issues.
Industry Annual Management Meetings are
convened by the West Australian Fishing Industry
Council (WAFIC), who are also responsible for
statutory management plan consultation under a
Service Level Agreement with the Department.
Recreational consultation processes are facilitated
by Recfishwest under a Service Level Agreement,
although the Department undertakes direct
consultation with the community on specific
issues.
Management Initiatives (MSC
Assessment) The fifth year of the trial of a summer season for
the Western Zone of the recreational fishery was
undertaken for the 2015/16 summer. The season
began on the first Sunday of November 2015 and
extended till the first Sunday of March 2016, with
fishing taking place between 7 and 8 am on the
first Sunday of each month. Evidence from the first
four seasons indicates a considerable drop in

WEST COAST BIOREGION
43 STATUS REPORTS OF THE FISHERIES AND AQUATIC RESOURCES OF WESTERN AUSTRALIA 2015/16
effort due primarily to poor weather conditions,
despite a relatively constant number of licenses.
For the 2015/16 season, the same number of
fishing days and the reduced daily bag limit of 15
(from 20) abalone per person was maintained
from the previous season. The objective of
continuing the reduced bag limit is to maintain low
catches so as to promote an increase in density on
the platform habitats, which have experienced
significant declines in the last decade (Roe’s
Abalone Figure 2a). The commercial Roe’s abalone
fishery is currently undergoing full MSC
assessment (https://www.msc.org/track-a-
fishery/fisheries-in-the-program/in-
assessment/Indian-ocean/Western-Australia-
abalone-fishery/Western-Australia-abalone-
fishery).
EXTERNAL DRIVERS (High-Extreme Risk)
During the summer of 2010/11, the West Coast
experienced a marine heat wave such that in the
area north of Kalbarri mortalities on Roe’s abalone
were estimated at 99.9%, and a complete closure
of the commercial and recreational fisheries was
implemented. The heat wave also affected the
Perth metropolitan stock but to a lesser extent.
Annual weather conditions have a significant
effect on catch rates and total catch of
recreational fishers. The small size of Roe’s
abalone mean it is in direct competition with
hatchery-produced abalone and therefore, there
has been a decline in beach price and overall
economic value during the last decade.
REFERENCES DoF. 2017. Abalone Resource of Western Australia Harvest Strategy 2016 - 2021. Fisheries Management Paper, No. 283.
Department of Fisheries, Western Australia, 36pp.
Hart A, Strain L, Hesp A, Fisher E, Webster F, Brand-Gardner S, and Walters S. 2017.Marine Stewardship Council Full
Assessment Report Western Australian Abalone Managed Fishery.Department of Fisheries, Western Australia, 288pp.
Sandoval-Castillo J, Robinson N, Strain L, Hart A, and Beheregaray LB. 2015. Use of next generation DNA technologies for
revealing the genetic impact of fisheries restocking and ranching. Australian Seafood CRC Report, No. 2012/714. Flinders
University, Adelaide, 47pp.

WEST COAST BIOREGION
DEPARTMENT OF FISHERIES 44
WEST COAST BLUE SWIMMER CRAB RESOURCE STATUS
REPORT 2016 D. Johnston, R. Marks and J. O’Malley
OVERVIEW
Blue swimmer crabs (Portunus armatus) are found
along the entire Western Australian coast (<50 m).
The commercial crab fisheries within the West
Coast Bioregion are the Cockburn Sound Crab
Managed Fishery, the Warnbro Sound Crab
Managed Fishery, Area 1 (Swan-Canning Estuary)
and Area 2 (Peel-Harvey Estuary) of the West
Coast Estuarine Managed Fishery and Area 1
(Comet Bay) and Area 2 (Mandurah to Bunbury) of
the Mandurah to Bunbury Developing Crab
Fishery. Commercial crab fishers currently use
purpose-designed crab traps. For more detailed
descriptions of the crab fisheries see Johnston et
al., 2015a.
Blue swimmer crabs represent the most important
recreationally fished inshore species in the
southwest of WA in terms of participation rate
centred largely on the estuaries and coastal
embayments from Geographe Bay to the Swan
River and Cockburn Sound using either drop nets,
scoop nets or diving. Management arrangements
for the commercial and recreational fisheries
include minimum size, protection of breeding
females, seasonal closures with effort controls for
the commercial fishery.
Both the commercial and recreational Peel-Harvey
crab fisheries attained MSC Certification in 2016
(see Johnston et al., 2015b for full details).
SUMMARY FEATURES 2016
Fishery Performance Commercial Recreational
Total Catch 2015 116 t 64 t (Boat survey May 13-Apr 14)
Fishing Level Cockburn Sound: Closed Peel-Harvey: Acceptable Other fisheries: Acceptable
Cockburn Sound: Closed Peel-Harvey: Acceptable Other fisheries: Acceptable
Stock/Resource Performance
Stock Status Assessment Indicators
Cockburn Sound
Peel-Harvey
Other SW
Environmentally Limited
Sustainable – Adequate
Sustainable - Adequate
Level 4 Direct Survey
Level 2 Catch Rates
Level 2 Catch Rates
EBFM Performance Asset Level Asset Level
Bycatch Negligible Risk Listed Species Negligible Risk
Habitat Low Risk Ecosystem Low Risk
Social
High Amenity
Moderate-High Risk
Economic GVP Level 2 ($1-5 million)
Moderate-High Risk
Governance Management Review Underway
External Drivers Moderate- High Risk
CATCH AND LANDINGS
Commercial Sector
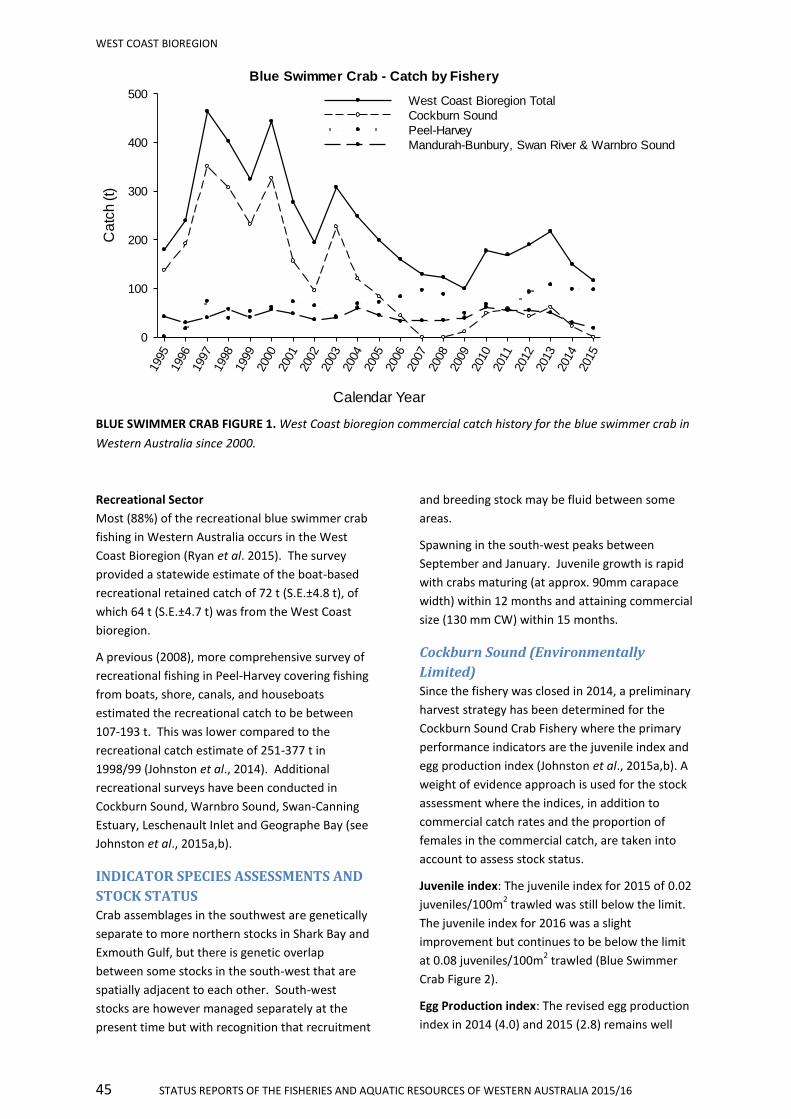
The total commercial catch from the West Coast
Bioregion in 2015 was 116 t. This represents a
22% decrease on the 149 t taken in 2014, primarily
due to the closures of Cockburn Sound and
Warnbro Sound and cessation of fishing in Area 2
of the Mandurah to Bunbury Developing Crab
Fishery (Blue Swimmer Crab Figure 1).
WEST COAST BIOREGION
45 STATUS REPORTS OF THE FISHERIES AND AQUATIC RESOURCES OF WESTERN AUSTRALIA 2015/16
BLUE SWIMMER CRAB FIGURE 1. West Coast bioregion commercial catch history for the blue swimmer crab in
Western Australia since 2000.
Recreational Sector
Most (88%) of the recreational blue swimmer crab
fishing in Western Australia occurs in the West
Coast Bioregion (Ryan et al. 2015). The survey
provided a statewide estimate of the boat-based
recreational retained catch of 72 t (S.E.±4.8 t), of
which 64 t (S.E.±4.7 t) was from the West Coast
bioregion.
A previous (2008), more comprehensive survey of
recreational fishing in Peel-Harvey covering fishing
from boats, shore, canals, and houseboats
estimated the recreational catch to be between
107-193 t. This was lower compared to the
recreational catch estimate of 251-377 t in
1998/99 (Johnston et al., 2014). Additional
recreational surveys have been conducted in
Cockburn Sound, Warnbro Sound, Swan-Canning
Estuary, Leschenault Inlet and Geographe Bay (see
Johnston et al., 2015a,b).
INDICATOR SPECIES ASSESSMENTS AND
STOCK STATUS
Crab assemblages in the southwest are genetically
separate to more northern stocks in Shark Bay and
Exmouth Gulf, but there is genetic overlap
between some stocks in the south-west that are
spatially adjacent to each other. South-west
stocks are however managed separately at the
present time but with recognition that recruitment
and breeding stock may be fluid between some
areas.
Spawning in the south-west peaks between
September and January. Juvenile growth is rapid
with crabs maturing (at approx. 90mm carapace
width) within 12 months and attaining commercial
size (130 mm CW) within 15 months.
Cockburn Sound (Environmentally
Limited) Since the fishery was closed in 2014, a preliminary
harvest strategy has been determined for the
Cockburn Sound Crab Fishery where the primary
performance indicators are the juvenile index and
egg production index (Johnston et al., 2015a,b). A
weight of evidence approach is used for the stock
assessment where the indices, in addition to
commercial catch rates and the proportion of
females in the commercial catch, are taken into
account to assess stock status.
Juvenile index: The juvenile index for 2015 of 0.02
juveniles/100m2 trawled was still below the limit.
The juvenile index for 2016 was a slight
improvement but continues to be below the limit
at 0.08 juveniles/100m2 trawled (Blue Swimmer
Crab Figure 2).
Egg Production index: The revised egg production
index in 2014 (4.0) and 2015 (2.8) remains well
Blue Swimmer Crab - Catch by Fishery
Calendar Year
1995
1996
1997
1998
1999
2000
2001
2002
2003
2004
2005
2006
2007
2008
2009
2010
2011
2012
2013
2014
2015
Ca
tch (
t)
0
100
200
300
400
500West Coast Bioregion Total
Cockburn Sound
Peel-Harvey
Mandurah-Bunbury, Swan River & Warnbro Sound

WEST COAST BIOREGION
DEPARTMENT OF FISHERIES 46
below the proposed threshold level of 12, (based
on the stock-recruitment relationship) outlined
within the draft harvest strategy and the fishery
remains closed.
Reasons for the stock decline being investigated
include combined effects of reduced levels of
primary productivity within Cockburn Sound,
changes in water temperature, increased
predation and the negative effects of density
dependent growth which appears to have had an
effect on the proportion of berried females. The
declines in abundance are therefore substantially
attributable to environmental changes, rather than
fishing, consequently the stock is classified as
Environmentally Limited.
BLUE SWIMMER CRAB FIGURE 2. Annual standardised index of juvenile (0+) blue swimmer crabs in Cockburn
Sound calculated using data from juvenile research trawl conducted in April, May and June of each year. The
index units are numbers of juveniles/100m2 trawled. The associated reference points (target, threshold and
limit) for the preliminary harvest strategy and the 95% confidence intervals are shown.
Peel-Harvey Estuary (Sustainable Adequate)
The commercial catch and effort from the Peel-
Harvey Estuary for the 2014/15 fishing season was
97 t from 69,888 trap lifts which are both very
similar to 2013/14 (Blue Swimmer Crab Figure 3).
Since the complete gear conversion from nets to
traps in 2000/01, annual commercial catch rates
have fluctuated between 0.8 and 1.7 kg/trap lift,
but have generally remained above 1 kg/trap lift.
The nominal annual catch rate for 2014/15 in the
Peel-Harvey Estuary was 1.4 kg/trap lift (West
Coast Blue Swimmer Crab Figure 3). The
standardised catch rate of 1.3 kg/traplift for the
2014/15 fishing season was well above the harvest
strategy threshold of 0.7 kg/traplift, indicating the
stock is currently being fished at sustainable levels.
On the basis of this evidence, the crab stock in the
Peel Harvey is classified as Sustainable.
WEST COAST BIOREGION
47 STATUS REPORTS OF THE FISHERIES AND AQUATIC RESOURCES OF WESTERN AUSTRALIA 2015/16
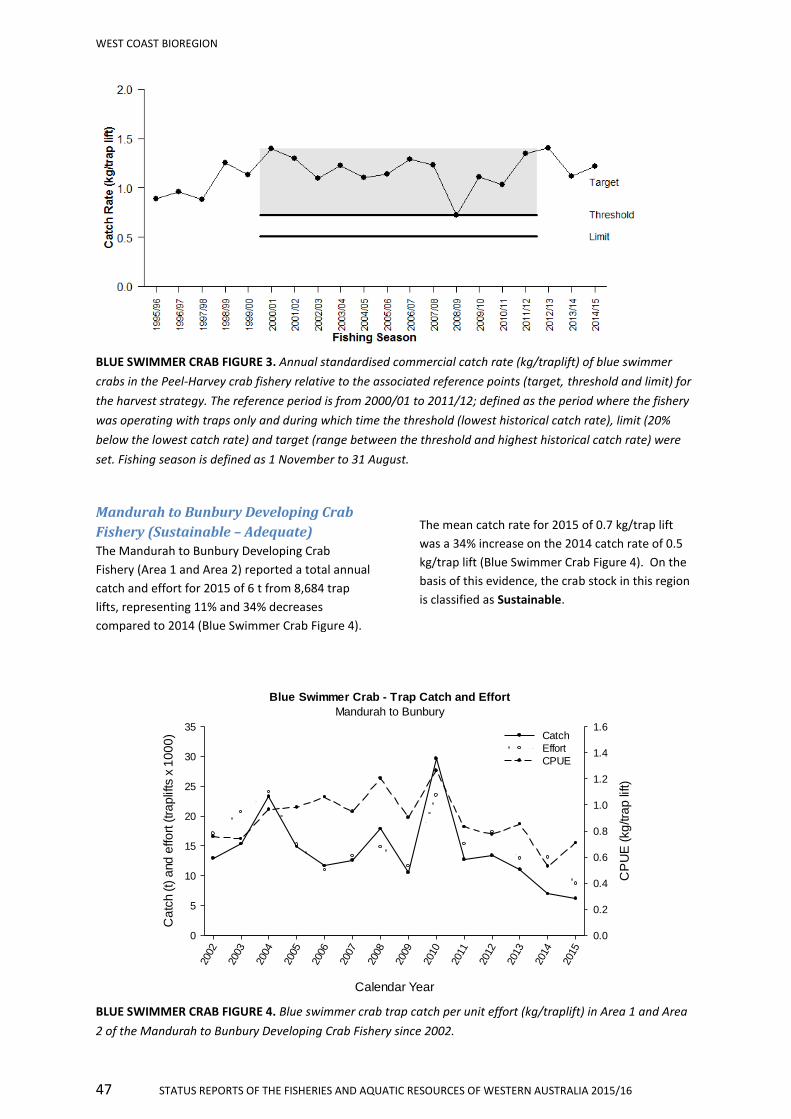
BLUE SWIMMER CRAB FIGURE 3. Annual standardised commercial catch rate (kg/traplift) of blue swimmer
crabs in the Peel-Harvey crab fishery relative to the associated reference points (target, threshold and limit) for
the harvest strategy. The reference period is from 2000/01 to 2011/12; defined as the period where the fishery
was operating with traps only and during which time the threshold (lowest historical catch rate), limit (20%
below the lowest catch rate) and target (range between the threshold and highest historical catch rate) were
set. Fishing season is defined as 1 November to 31 August.
Mandurah to Bunbury Developing Crab
Fishery (Sustainable – Adequate) The Mandurah to Bunbury Developing Crab
Fishery (Area 1 and Area 2) reported a total annual
catch and effort for 2015 of 6 t from 8,684 trap
lifts, representing 11% and 34% decreases
compared to 2014 (Blue Swimmer Crab Figure 4).
The mean catch rate for 2015 of 0.7 kg/trap lift
was a 34% increase on the 2014 catch rate of 0.5
kg/trap lift (Blue Swimmer Crab Figure 4). On the
basis of this evidence, the crab stock in this region
is classified as Sustainable.
Blue Swimmer Crab - Trap Catch and Effort
Mandurah to Bunbury
Calendar Year
2002
2003
2004
2005
2006
2007
2008
2009
2010
2011
2012
2013
2014
2015
Ca
tch (
t) a
nd
effo
rt (
tra
plif
ts x
10
00
)
0
5
10
15
20
25
30
35
CP
UE
(kg
/tra
p li
ft)
0.0
0.2
0.4
0.6
0.8
1.0
1.2
1.4
1.6Catch
Effort
CPUE
BLUE SWIMMER CRAB FIGURE 4. Blue swimmer crab trap catch per unit effort (kg/traplift) in Area 1 and Area
2 of the Mandurah to Bunbury Developing Crab Fishery since 2002.

WEST COAST BIOREGION
DEPARTMENT OF FISHERIES 48
BYCATCH Crab pots are purpose-designed to minimise the
capture of non-target species and are therefore an
inefficient way to capture fish. The low number of
fish caught and returned poses a negligible risk to
these stocks.
PROTECTED SPECIES INTERACTIONS
The crab trap longline system is conducted in a
manner that avoids mortality of, or injuries to,
endangered, threatened or protected species and
avoids or minimises impacts on threatened
ecological communities and are therefore
considered a low risk.
HABITAT
Retrieval of traps may result in minor dragging
across the mostly sandy substrate. The small
amount of living seagrass removed, results in
minimal habitat damage and hence trapping poses
a low risk to benthic habitats. The potential
impacts of wading on near shore habitats by the
recreational fishers who scoop net in the Peel-
Harvey Estuary is currently being assessed.
ECOSYSTEM INTERACTIONS
As the commercial take of crabs represents a
relatively small portion of the biomass, which is
effectively renewed annually and subject to high
levels of natural variation in abundance, secondary
food chain effects are likely to be minimal in these
fisheries and are a low risk to the ecosystem.
SOCIAL AND ECONOMIC OUTCOMES
Social
West Coast blue swimmer crab fisheries provide a
high social amenity to recreational fishing and
diving and to consumers via commercial crab
supply to markets and restaurants. During 2015,
approximately 20 people were employed as
skippers and crew on vessels targeting blue
swimmer crabs in the West Coast Bioregion. Blue
swimmer crabs provide a highly popular
recreational fishery, particularly in the Swan River,
Cockburn Sound, Warnbro Sound, the Peel-Harvey
Estuary and the Geographe Bay region, where they
dominate the inshore recreational catch. They are
the highest captured recreational species.
Economic The commercial blue swimmer crab catch in the
West Coast Bioregion for 2015 had an estimated
gross value of product (GVP) of approximately
$0.62 million, an increase on the $0.78 million in
2014 (level 2 $1-5 million). Most of the catch from
the West Coast Bioregion was sold through local
markets. Price data was generated by collecting
monthly returns recording prices paid to fishers by
fish processors, a weighted average price is then
calculated for the financial year from the monthly
data collected and for 2015 were set at $5.36 per
kg.
GOVERNANCE SYSTEM
Allowable Catch Tolerance Levels
Cockburn Sound: Under review
Peel Harvey: 45 - 107 tonnes
Other West Coast fisheries: Under review
A catch range for Cockburn Sound crabs will need
to be developed when the management
arrangements and stock levels have stabilised.
The acceptable catch range for Peel Harvey is now
determined to be within the last 10 years of catch
values. The other west coast crab fisheries are yet
to develop a sufficiently stable catch history or set
of management arrangements to develop a
definitive catch range.
Harvest Strategy
Cockburn Sound: Closed
A preliminary harvest strategy has been
determined for the Cockburn Sound Crab Fishery
where the primary performance indicators are the
juvenile index and egg production index.
As these indicators are below the limit levels, the
fishery will remain closed.
Peel Harvey:
A harvest strategy has been determined for the
Peel-Harvey Crab Fishery (Johnston et al., 2015 b)
where the primary performance indicator is
standardised annual catch rate with the reference
period between 2000/01 and 2011/12.
As the indicator was above the threshold, no
changes to the management will occur for the
2017 season.
WEST COAST BIOREGION
49 STATUS REPORTS OF THE FISHERIES AND AQUATIC RESOURCES OF WESTERN AUSTRALIA 2015/16
Other West Coast Fisheries:
A preliminary harvest strategy has been
determined for Area 1 and Area 2 of the
Mandurah to Bunbury Developing Crab Fishery
where the primary performance indicator is
nominal annual catch rate using the reference
period for Area 1 Comet Bay is between 2005/06
and 2011/12, and for Area 2 Mandurah-Bunbury
between 2004/05 and 2011/12.
As the indicator was above the threshold, no
changes to the management will occur for the
2017 season.
Compliance
Current risks to enforcement are low for West
Coast crab fisheries. However, the Peel-Harvey
Estuary has a high level of enforcement risk as it
has the highest level of non-compliance in the
State, particularly for undersize crabs being taken
and during night-time periods.
Consultation
Commercial The Department undertakes consultation directly
with licensees on operational issues and processes
and is responsible for the statutory management
plan consultation. Industry Annual Management
Meetings are convened by the Western Australian
Fishing Industry Council (WAFIC), who are also
responsible for statutory management plan
consultation under a Service Level Agreement with
the Department.
Recreational Consultation processes are now facilitated by
Recfishwest under a Service Level Agreement
although the Department undertakes direct
consultation with the community on specific
issues.
Management Initiatives
A southwest crab fishery management review is
being undertaken during 2016/17 with the aim of
increasing protection to female breeding stock.
Potential options include extending or introducing
season closures and increasing minimum size to
provide a greater buffer to female breeding stock.
EXTERNAL DRIVERS Levels of recruitment to many of the crab fisheries
fluctuate considerably, mainly due to
environmental influences (e.g. water
temperature), both on spawning success and larval
survival through to recruitment. The climate
change implications associated with these
environmental variables are also under
consideration. The effect of the heat wave in the
summer of 2010/11 and above average water
temperatures on the following two summers on
the spawning and juvenile phase of the crabs is
being investigated for Cockburn Sound (and
adjacent coastal areas), as well as the cause of the
low proportion of berried females in the 2012/13.
These temperature changes have also resulted in
the increased abundance of crabs in the South
Coast estuaries. Blue swimmer crabs were rated a
high risk to climate change due to their sensitivity
to water temperature changes. Temperature
appears to be an important factor contributing to
the decline of the Cockburn Sound Crab Fishery.
REFERENCES
Johnston D, Chandrapavan A, Wise B, and Caputi N. 2014. Assessment of blue swimmer crab recruitment and breeding stock levels in the Peel-Harvey Estuary and status of the Mandurah to Bunbury developing crab fishery. Fisheries Research Report, No. 258.
Johnston D, Evans R, Foster M, Oliver R, and Blay N. 2015a. West Coast Blue Swimmer Crab Fishery Status Report, in: Fletcher WJ, and Santoro K. (eds) Status reports of the fisheries and aquatic resources of Western Australia 2014/15: State of the Fisheries, Western Australian Department of Fisheries, 62–70.
Johnston DJ, Smith KA, Brown JI, Travaille KL, Crowe F, Oliver RK, and Fisher EA. 2015b. Western Australian Marine Stewardship Council Report, Series No 3: West Coast Estuarine Managed Fishery (Area 2: Peel-Harvey) & Peel-Harvey Estuary Blue Swimmer Crab Recreational Fishery. Department of Fisheries, Western Australia. 284 pp.
Ryan KL, Hall NG, Lai EK, Smallwood CB, Taylor SM, and Wise BS. 2015. State-wide survey of boat-based recreational fishing in Western Australia 2013/14. Fisheries Research Report, No. 268, Department of Fisheries, Western Australia.
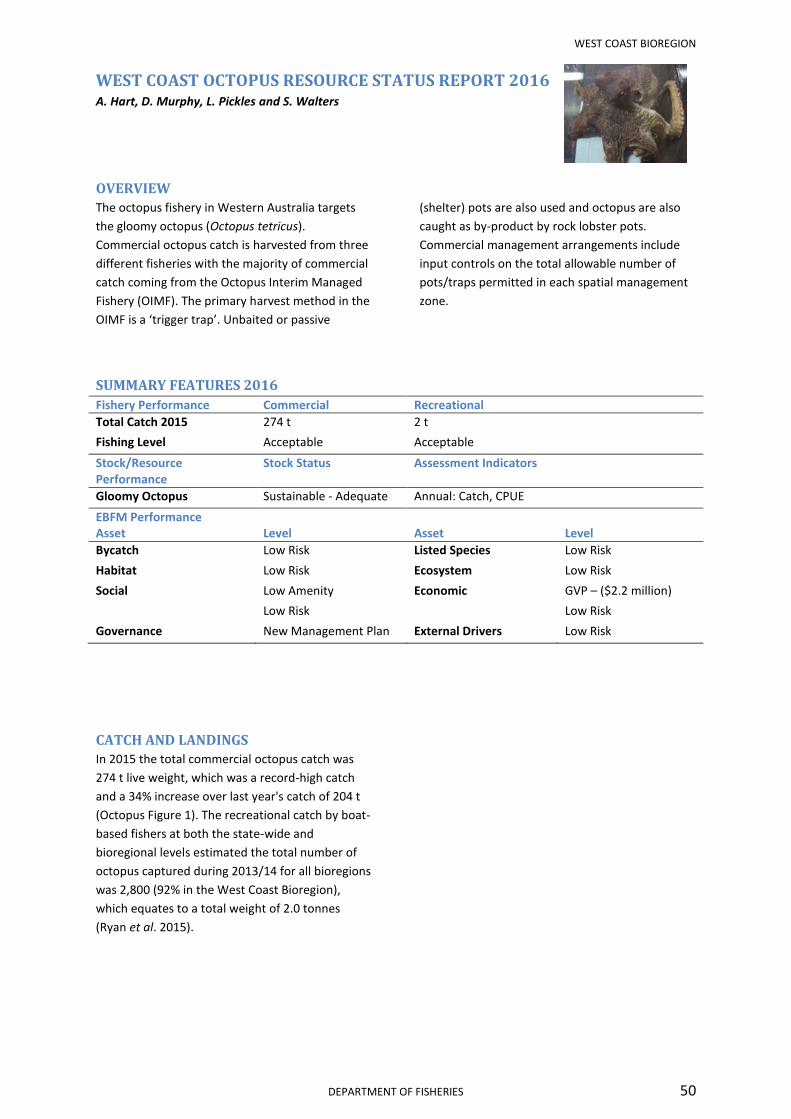
WEST COAST BIOREGION
DEPARTMENT OF FISHERIES 50
WEST COAST OCTOPUS RESOURCE STATUS REPORT 2016 A. Hart, D. Murphy, L. Pickles and S. Walters
OVERVIEW
The octopus fishery in Western Australia targets
the gloomy octopus (Octopus tetricus).
Commercial octopus catch is harvested from three
different fisheries with the majority of commercial
catch coming from the Octopus Interim Managed
Fishery (OIMF). The primary harvest method in the
OIMF is a ‘trigger trap’. Unbaited or passive
(shelter) pots are also used and octopus are also
caught as by-product by rock lobster pots.
Commercial management arrangements include
input controls on the total allowable number of
pots/traps permitted in each spatial management
zone.
SUMMARY FEATURES 2016
Fishery Performance Commercial Recreational
Total Catch 2015 274 t 2 t
Fishing Level Acceptable Acceptable
Stock/Resource Performance
Stock Status Assessment Indicators
Gloomy Octopus Sustainable - Adequate Annual: Catch, CPUE
EBFM Performance Asset Level Asset Level
Bycatch Low Risk Listed Species Low Risk
Habitat Low Risk Ecosystem Low Risk
Social Low Amenity
Low Risk
Economic GVP – ($2.2 million)
Low Risk
Governance New Management Plan External Drivers Low Risk
CATCH AND LANDINGS In 2015 the total commercial octopus catch was
274 t live weight, which was a record-high catch
and a 34% increase over last year's catch of 204 t
(Octopus Figure 1). The recreational catch by boat-
based fishers at both the state-wide and
bioregional levels estimated the total number of
octopus captured during 2013/14 for all bioregions
was 2,800 (92% in the West Coast Bioregion),
which equates to a total weight of 2.0 tonnes
(Ryan et al. 2015).

WEST COAST BIOREGION
51 STATUS REPORTS OF THE FISHERIES AND AQUATIC RESOURCES OF WESTERN AUSTRALIA 2015/16
OCTOPUS FIGURE 1. Commercial catch (t) of Octopus tetricus in Western Australia since 1990. WCRLF (West
Coast Rock Lobster Fishery), CSLPF (Cockburn Sound Line and Pot), OIMF (Octopus Interim Managed Fishery)
and Other, which is bycatch from trawl and miscellaneous pot fisheries.
INDICATOR SPECIES ASSESSMENTS AND
STOCK STATUS
Gloomy octopus (Sustainable-Adequate) Octopus tetricus was subject to a recent
comprehensive stock assessment which looked at
biology, fishing efficiency and stock abundance
and distribution (Hart et al. 2016). The overall
conclusion was that the stock is highly productive,
with an average maximum age of 1.5 years, as well
as abundant and widely distributed along the West
and South Coast of Western Australia. The
estimated area of fished habitat (507 km2) was
found to be only a minor percentage (~2%) of the
total estimated habitat area of >30,000 km2 (Hart
et al. 2016). The current catch of 274 t is
considerably lower than the estimate of
sustainable harvest derived by Hart et al. (2016),
which was in the range of 800 – 2200 tonnes.
Consequently the breeding stock is considered to
be adequate.
BYCATCH AND PROTECTED SPECIES INTERACTIONS (Low Risk) The selective method of fishing used results in a
minimal level of bycatch of other species. In 2015
there were no reported entanglements with
whales. This compares favourably with 2014 when
there were two reported whale entanglements in
octopus fishing gear. Fishers have adopted gear
changes to mitigate entanglements, which
includes setting pots on longlines, and using
weighted ropes that hang vertically in the water
column.
HABITAT AND ECOSYSTEM INTERACTIONS
Habitat effects (Low Risk) In the CSLPF and OIMF, octopus-specific pots are
set in similar habitats to those fished in the
WCRLF, as well as sandy and seagrass areas,
particularly in Cockburn Sound. These are not
expected to impact on benthic habitats as the soak
times are at long intervals, averaging 10 days in
the OIMF and 15-20 days in the CSLP. Rock lobster
potting in the WCRLF occurs primarily on sand
areas around robust limestone reef habitats
covered with coralline and macro-algae, and these
habitats are considered resistant to lobster potting
due to the hard nature of the bottom substrate
(see WCRLF report for full details).
Food chain effects (Low Risk) This fishery harvests only a small amount of
octopus per annum. The effect from this
harvesting on the rest of the ecosystem, given that
the catch is spread over a wide region, is likely to
be insignificant.
SOCIAL AND ECONOMIC OUTCOMES
Social (Low Risk) Each dedicated octopus fishing vessel employs
between 2 and 4 people. In 2015, ~ 200 vessels
caught octopus, although the vast majority of

WEST COAST BIOREGION
DEPARTMENT OF FISHERIES 52
these landings were small (< 100 kg), as they were
bycatch in the WCRLF. Within the octopus specific
fisheries, 4 vessels fished in the CSLP, and 14
vessels in the OIMF. There is also a substantial
processing and value-added component to the
octopus catch with factories in Fremantle and
Geraldton.
Economic (Low Risk) The estimated annual value for 2015 was $2.2
million based on the total catch of 274 t and an
average product price of $8.13 /kg live weight.
GOVERNANCE SYSTEM
Annual Catch Tolerance Range
(Acceptable)
Under previous commercial fishing effort levels,
the target catch range for octopus was 50-250 t,
this level has been exceeded in 2016 due to
expansion of the fishery and additional pot
allocations in late 2015. The Fishery is currently in
a new development phase and the allowable catch
range will be reviewed in 2016 and 2017.
Harvest Strategy
The initial performance measures for the fishery
relate to breeding stock maintenance as indicated
by catches remaining in the range 50 – 250 t and
catch rate remaining above 70 kg/day in the OIMF
sector. Current catch rate is around 250 kg/day,
however both these measures are being reviewed
in light of the developing nature of the fishery. The
main performance indicator for the proposed new
harvest strategy will be a standardised catch per
unit effort (SCPUE) in kg/pot lift, which accounts
for environmental and efficiency changes in the
fishery, and has been increasing since 2013
(Octopus Figure 2).
OCTOPUS FIGURE 2. Standardised catch per unit effort (SCPUE) (±95% CL) in kg / pot (kg in live weight) of
octopus tetricus.
Compliance
There are no significant issues but it is important
to highlight the importance of timely logbook data
from fishers to reflect current status of the fishery.
Consultation
The Department undertakes consultation directly
with licensees on operational issues. Industry
Annual Management Meetings are convened by
the Western Australian Fishing Industry Council
(WAFIC), who are also responsible for statutory
management plan consultation under a Service
Level Agreement with the Department.
Consultation processes are now facilitated by
Recfishwest under a Service Level Agreement with

WEST COAST BIOREGION
53 STATUS REPORTS OF THE FISHERIES AND AQUATIC RESOURCES OF WESTERN AUSTRALIA 2015/16
the Department, although the Department
undertakes direct consultation with the
community on specific issues.
Management Initiatives (New
Management Plan) The Department has developed formal
management arrangements for the OIMF.
Following the conclusion of an independent panel
process on access and allocation, an Interim
Management Plan for the OIMF was gazetted in
2015.
The Cockburn Sound (Line and Pot) Limited Entry
Fishery Notice 1995 was reviewed following the
Minister for Fisheries’ decision on octopus pot
entitlement allocation in the CSLPF. Amendments
to the Cockburn Sound (Line and Pot) Limited
Entry Fishery Notice 1995 were made on 1 May
2015 to introduce an octopus pot scheme of
entitlement.
EXTERNAL DRIVERS (Low Risk)
Cephalopods in general, including octopus, are
known to be subject to large environmentally-
driven fluctuations in abundance. Octopus was
rated as a medium-low risk to climate change.
The move of the rock lobster fishery from an
effort-controlled fishery to a catch quota fishery,
coupled with significant effort reductions, will
ensure the octopus catch in the WCRL fishery
remains a low % of the overall catch.
REFERENCES Hart AM, Leporati SC, Marriott RJ, and Murphy D. 2016. Innovative development of the Octopus (cf) tetricus fishery in Western Australia. FRDC Project No 2010/200. Fisheries Research Report, No. 270. Department of Fisheries, Western Australia. 120pp.
Ryan KL, Hall NG, Lai EK, Smallwood CB, Taylor SM, Wise BS. 2015. State-wide survey of boat-based recreational fishing in Western Australia 2013/14. Fisheries Research Report, No. 268. Department of Fisheries, Western Australia. 208pp.

WEST COAST BIOREGION
DEPARTMENT OF FISHERIES 54
WEST COAST NEARSHORE AND ESTUARINE FINFISH
RESOURCE STATUS REPORT 2016 K. Smith and M. Holtz
OVERVIEW
In the West Coast Bioregion (WCB) nearshore and
estuarine finfish are targeted by beach-based
fishers and boat-based fishers operating in shallow
water. The main recreational method is line
fishing. The main commercial methods are haul,
beach seine and gill netting. Fishery landings of
nearshore species include whitebait (Hyperlophus
vittatus), western Australian salmon (Arripis
truttaceus), Australian herring (Arripis georgianus),
southern school whiting (Sillago bassensis),
yellowfin whiting (Sillago schombergkii), yelloweye
mullet (Aldrichetta forsteri), tailor (Pomatomus
saltatrix), southern garfish (Hyporhamphus
melanochir), silver trevally (Pseudocaranx
georgianus) and King George whiting (Sillaginodes
punctata). Landings of estuarine finfish are mainly
sea mullet (Mugil cephalus), estuary cobbler
(Cnidoglanis macrocephalus) and black bream
(Acanthopagrus butcheri).
Five commercial fisheries target nearshore and/or
estuarine finfish in the WCB. Four estuaries are
open to commercial fishing. The Peel-Harvey
Estuary commercial fishery (Area 2 of the West
Coast Estuarine Managed Fishery) received Marine
Stewardship Council (MSC) certification in June
2016 (see Department of Fisheries 2015, Johnston
et al. 2015 for full details).
SUMMARY FEATURES 2016
Fishery Performance Commercial Recreational
Total Catch 2015 371 t 78 t (boat-based only)
Fishing Level Acceptable Acceptable
Stock/Resource Performance
Stock Status Assessment Indicators
Nearshore Inadequate Annual: Catch, Catch Rate;
Periodic: Fishing mortality, SPR
Estuarine Sustainable - Adequate Annual: Catch, Catch Rate
EBFM Performance Asset Level Asset Level
Bycatch Low Risk Listed Species Negligible Risk
Habitat Negligible Risk Ecosystem Low Risk (from fishing)
Social High Amenity
Moderate Risk
Economic GVP Level 2 ($1-5 million)
Moderate Risk
Governance Harvest strategy for herring under development
External Drivers High Risk (habitat degradation, climate change)

WEST COAST BIOREGION
55 STATUS REPORTS OF THE FISHERIES AND AQUATIC RESOURCES OF WESTERN AUSTRALIA 2015/16
CATCH AND LANDINGS
In 2015, the total commercial catch of nearshore
and estuarine finfish in the WCB was 371 t,
comprising 217 t from ocean waters and 154 t
from estuaries (Nearshore and Estuarine Finfish
Table 1). The commercial catch was taken by five
fisheries: West Coast Estuarine Managed Fishery,
West Coast Beach Bait Managed Fishery, Cockburn
Sound (Fish Net) Managed Fishery, South West
Coast Salmon Managed Fishery and the South
West Beach Seine Fishery.
The total recreational catch was not estimated in
2015 due to lack of information about the shore-
based recreational sector, which takes a significant
proportion of the catch of these species. The
boat-based recreational catch of nearshore and
estuarine finfish in the WCB was estimated to be
78 t in the most recent survey in 2013/14 (Ryan et
al. 2015).
NEARSHORE AND ESTUARINE FINFISH TABLE 1. Total catches of finfish in commercial fisheries in nearshore
and estuarine waters in West Coast Bioregion in previous five years.
Species Scientific name 2011 2012 2013 2014 2015
Sea mullet Mugil cephalus 77.7 103.7 100.1 123.4 143.4
Whitebait Hyperlophus vittatus 34.8 65.7 18.6 63.5 61.2
Western Australian salmon Arripis truttaceus 6.3 47.1 92.7 60.1 37.9
Australian herring Arripis georgianus 37.2 28.5 47.1 46.6 49.0
Yellowfin whiting Sillago schombergkii 17.9 18.4 24.1 36.6 46.5
Yelloweye mullet Aldrichetta forsteri 16.2 22.6 18.6 19.8 6.3
Tailor Pomatomus saltatrix 7.2 9.0 14.2 10.5 9.8
Southern garfish Hyporamphus melanochir 19.2 5.8 4.3 4.8 2.4
Estuary cobbler Cnidoglanis macrocephalus 7.4 5.2 1.8 0.2 1.3
King George whiting SIllaginodes punctata 5.1 3.7 2.0 0.9 0.8
Trevallies Pseudocaranx spp. 2.3 2.3 2.8 2.2 1.7
Other finfish
15.1 14.0 24.7 11.7 10.5
Total
246.5 325.4 346.4 378.4 370.8
INDICATOR SPECIES ASSESSMENTS AND
STOCK STATUS The status of each stock is assessed using a weight-
of-evidence approach that considers all available
information about the stock. For level 3
assessments, performance indicators now include
both spawning potential ratio (SPR) and fishing
mortality (F).
Australian herring (Sustainable-
Recovering)
Australian herring comprise a single breeding stock
across southern Australia, which spawns in
Western Australia (WA) (Smith and Brown 2014).
The species is caught by commercial and
recreational fisheries in WA and South Australia,
with negligible quantities also taken in Victoria
(Smith et al. 2013a).
In 2015, the total WA commercial catch was 72 t,
the lowest since the 1940s (Nearshore and
Estuarine Finfish Figure 1). The South Coast
Estuarine Managed Fishery, Cockburn Sound (Fish
Net) Managed Fishery and South West Beach Seine
Fishery reported most of the commercial catch in
2015. Estimated boat-based recreational catches
of herring declined from 29 t (± 3 t) in 2011/12 to
16 t (±2 t) 2013/14 (Ryan et al. 2015). The current
shore-based recreational catch is unknown.
SPR is now the key indicator of stock status; with F
used as one of the lines of evidence in Level 3
assessments. SPR has been below the limit
reference level of 20% since 2009/10 (Department
of Fisheries in prep). A recovery plan has been
implemented for this stock. On this basis, the
Australian herring stock is classified as recovering.

WEST COAST BIOREGION
DEPARTMENT OF FISHERIES 56
NEARSHORE AND ESTUARINE FINFISH FIGURE 1. Total commercial catches of Australian herring, 1976 to
2015.
Southern garfish (Perth metropolitan
zone) (Inadequate)
Southern garfish ranges across southern Australia
from WA (Lancelin) to New South Wales (Eden).
Population structure is complex. Semi-discrete
populations can arise over small distances (<60
km) due to the low rates of movement/dispersal
by individual fish (Smith et al. 2016). In the WCB,
the main fishing area is the Perth metropolitan
zone, particularly Cockburn Sound. Garfish in this
area are likely to have limited connectivity with
populations further south (e.g. in Geographe Bay).
Total commercial landings in the WCB peaked at
44 t in 1999 and then steadily declined, reaching
an historical low of 2 t in 2015. Partial estimates of
shore-based recreational catch are available for
the Perth area, April-June only. The April-June
catch was estimated to be >5 t in 2010, but <0.5 t
in subsequent years (Smallwood et al. 2012). In
the WCB, the total boat-based recreational catch
was estimated to be 2-5 t per year in 2005/06,
2008/09, 2009/10, and 2011/12, but declined to
<1 t in the most recent survey in 2013/14 (Ryan et
al. 2015, Smith et al. 2016).
The SPR had declined from 40% in 1998 to be
approximately equal to the limit reference level of
20% in 2010/11 (Smith et al. 2016). Commercial
catch rates have been declining since 1996 (Figure
2), including a sharp decline after the 2011
‘heatwave’ event, and further declines during
2012-2015. The trends suggest a substantial
decline in stock level since the late 1990s. The
current spawning biomass is likely to be <20% of
the unfished level and therefore the southern
garfish stock in this region is classified as
inadequate.
NEARSHORE AND ESTUARINE FINFISH FIGURE 2. Standardised commercial and recreational catch rates of
southern garfish in Cockburn Sound.
Year
1980 1985 1990 1995 2000 2005 2010 2015
An
nu
al ca
tch
(t)
0
500
1000
1500 Total WA South Coast BioregionWest Coast Bioregion
Year
1996 1998 2000 2002 2004 2006 2008 2010 2012 2014
Com
merc
ial catc
hra
te (
kg/d
ay)
0
100
200
Recre
atio
nal c
atc
hra
te (fis
h/h
our)
0.0
0.2
0.4
0.6

WEST COAST BIOREGION
57 STATUS REPORTS OF THE FISHERIES AND AQUATIC RESOURCES OF WESTERN AUSTRALIA 2015/16
Sea mullet (Sustainable-Adequate) Sea mullet occurs in all WA Bioregions. It was
formerly regarded as a single species with a global
distribution but sea mullet along the west and east
coasts of Australia are now regarded as at least
two distinct species (Krück et al. 2013). Sea mullet
within each WA Bioregion are currently regarded
as discrete breeding stocks.
In the WCB, the majority (60-70% p.a.) of
commercial landings are taken in Peel-Harvey
Estuary. Recent commercial landings are low
compared to historical levels due to effort
reductions. Since 2000, landings have been
relatively stable and ranged from 77 t (in 2011) to
143 t (in 2015) (Table 1). The boat-based
recreational catch is estimated to be <1 t (Ryan et
al. 2015) and, whilst the current recreational
shore-based catch is not known, it is believed to be
low.
The Peel-Harvey standardised commercial catch
rate has been stable since the 1970s, suggesting a
relatively stable WCB stock level over a long
period. On the basis of this evidence, the sea
mullet stock in this region is classified as
adequate.
Yellowfin whiting (Sustainable-Adequate)
Yellowfin whiting occurs in WA from Exmouth to
Albany and based on known life history and
behaviour traits, the ‘southern’ (WCB and South
Coast Bioregion) and ‘northern’ (Gascoyne Coast
Bioregion) populations of this species are currently
regarded as separate stocks.
The majority (>95%) of commercial landings of the
southern stock occur in the WCB. The West Coast
Estuarine Managed Fishery (WCEMF) takes 50%
of these landings each year, with the South West
Beach Seine Fishery contributing significant
amounts in some years. The commercial catch in
the Peel-Harvey Estuary (i.e. Area 2 of the WCEMF)
has rapidly increased in the past 3 years, from 10 t
in 2012 to 30 t in 2015. In 2015, the total
commercial catch was 49 t.
The total recreational catch is unknown due to lack
of information about the shore-based sector which
is believed to take almost all recreational landings
of this species (Brown et al. 2013). Anecdotal
reports suggest a recent increase in the
recreational catch also occurred in the Peel Harvey
region. The boat-based recreational catch is
estimated to be very low (<1 t) (Ryan et al. 2015).
Preliminary findings from a level 3 assessment
indicate that the higher catches in recent years are
due to strong recruitment. Catches in both sectors
are expected to decline and return to more typical
levels in the next few years as the influence of the
recruitment event wanes. On the basis of this
evidence, the yellowfin whiting stock in this region
is classified as adequate.
King George whiting (Sustainable-
Adequate) King George whiting ranges across southern
Australia from WA (Jurien Bay) to New South
Wales (Jervis Bay). It is believed that that a
separate breeding stock occurs in WA (Jenkins et
al. 2016.
In WA, the majority of landings are taken
recreationally. The current shore-based
recreational catch is unknown, but likely to be
smaller than the boat-based recreational catch
(Brown et al. 2013). Estimated boat-based
recreational catches were 27 t (±4 t) in 2011/12
and 22 t (±4 t) in 2013/14 (Ryan et al. 2015). In
those years, the total commercial catch was 15 t
and 14 t, respectively. In 2015, the total
commercial catch was 23 t. The catch level can
fluctuate markedly in response to recruitment
variations.
A level 3 assessment in 2010-2012 indicated that F
was moderate in inshore waters where juveniles
occur, but low in offshore waters where adults
occur (Fisher et al. 2014). SPR was estimated to be
around the target level of 40%. The total catch
(commercial plus recreational) in 2015 is likely to
be higher than in 2010-2012, due to recruitment
variations, but still within the historical range.
Thus, overfishing is unlikely to be occurring and
the current spawning biomass is likely to be at a
similar level to that estimated in 2010-2012. On
the basis of this evidence, the King George whiting
breeding stock is classified as adequate.
Whitebait (Sustainable-Adequate)
In WA, whitebait has been reported from Kalbarri
southwards, but most commonly between Perth
and Cape Naturaliste. The range appears to have
contracted over the past 1-2 decades in response
to environmental changes, and the stock is now
WEST COAST BIOREGION
DEPARTMENT OF FISHERIES 58
mainly found in the Bunbury area. Whitebait
usually inhabits coastal waters within 10 km of the
shore and has traditionally been targeted by
commercial beach-based haul netting (Gaughan et
al. 1996). Recreational landings are negligible.
Since 2003/04, virtually all commercial landings
have been reported in the Bunbury area by the
SWBSF. Landings followed a relatively stable trend
(i.e. non-directional) from the late 1980s until
2009/10. Since then, relatively low catches have
been reported that are likely due to low stock
abundance. Whitebait has a lifespan of only 3-4
years, and so catches are strongly driven by
recruitment variability. The 2011 heatwave event
along the west coast appears to have resulted in
spawning failure in winter 2011, and led to
exceptionally low catches and catch rates in
2012/13 and 2013/14 (Nearshore and Estuarine
Finfish Table 1). The increase in total catch to 97 t
in 2014/15 suggests that the breeding stock is
adequate.
Tailor (Adequate)
In WA, tailor occurs from Onslow to Esperance and
is believed to constitute a single stock over this
range (Smith et al. 2013b). In 2015, the total
commercial catch of tailor was 20 t (Nearshore and
Estuarine Finfish Table 1). Approximately half of
this catch was taken in the WCB, with most of the
remainder in the Gascoyne Coast Bioregion (see
Inner Shark Bay Scalefish Status Report) and a
small amount in the South Coast Bioregion. In the
WCB, the total commercial catch has typically
been less than 20 t per year since records
commenced in 1912. The catch was 10 t in 2015,
with the majority taken in the Peel-Harvey Estuary.
The current recreational catch is unknown due to
lack of information about the shore-based sector,
which is believed to take a larger catch share of
tailor than the boat-based sector (Smith et al.
2013b). Estimated boat-based recreational
catches were 14 t (±4 t) in 2011/12 and 6 t (±1 t) in
2013/14 (Ryan et al. 2015). Most of the
recreational catch of tailor is taken in the WCB.
The catch rate of tailor fluctuates markedly in
response to recruitment variations, which are
linked to environmental factors. Catch rates and
juvenile recruitment are monitored annually in the
Perth area. A level 2 assessment in 2012 indicated
that stock status was acceptable (Smith et al.
2013b). Current catch, catch rate and recruitment
levels are within the recent historical range,
indicating that overfishing is unlikely to be
occurring and the current stock status remains
adequate.
Estuarine cobbler (Peel-Harvey-
Adequate) In WA, cobbler occurs in ocean and estuarine
waters but is mainly caught by commercial fishers
in estuaries. Landings by recreational fishers are
believed to be negligible. Each estuary hosts a
discrete stock of cobbler, which is genetically
distinct to other estuarine populations and also
distinct to cobbler populations in adjacent ocean
waters.
Since 1996, annual landings of cobbler in the WCB
have ranged from <1 t to 10 t. Almost all WCB
commercial landings occurred in the Peel-Harvey
Estuary. In 2015, approximately 1 t of cobbler was
reported from this estuary. Commercial landings of
cobbler in the Peel-Harvey Estuary are now
managed under a Harvest Strategy, which uses
catch and catch rate as indicators of fishery
performance (DoF 2015). Both catch and catch
rate were within the target range in 2015,
indicating a low fishing impact on this stock. On
the basis of this evidence, the cobbler breeding
stock in this estuary is classified as adequate.
Black bream (Swan Canning-Adequate) Black bream is a true estuarine species, spending
its entire life cycle in these waters. Each estuary
hosts a discrete stock of black bream, which is
genetically distinct to other estuarine populations.
Most estuaries and coastal lagoons in south-
western WA host a black bream population.
In the WCB, this species is mainly taken
recreationally. Estimated boat-based recreational
catches of black bream were 3.1 t (±0.9 t) in
2011/12 and 1.1 t (±0.3 t) in 2013/14 (Ryan et al.
2015). The current shore-based recreational catch
is unknown, but is believed to be larger than the
boat-based recreational catch.
In the Swan-Canning Estuary, recreational and
commercial catch rates suggested an increase in
black bream availability between 1990 and 2000,
followed by a slight decline from 2000 to 2006
(Smith 2006). Voluntary recreational logbook
fisher catch rates suggest stable availability from

WEST COAST BIOREGION
59 STATUS REPORTS OF THE FISHERIES AND AQUATIC RESOURCES OF WESTERN AUSTRALIA 2015/16
2004 to 2015. On the basis of this evidence, the
cobbler stock in the Swan-Canning Estuary is
classified as adequate.
Perth herring (Environmentally Limited)
Perth herring is endemic to the WCB, where a
single breeding stock is believed to occur. Stock
level was assessed via commercial catch rate
trends in the Swan-Canning Estuary until cessation
of fishing for this species in 2007 (Smith 2006).
Swan-Canning catch rates suggested a major
decline in the stock after 1980, which is attributed
to historical overfishing and environmental
degradation in estuaries (Smith 2006). Limited
fishery-independent evidence suggests regional
abundance remains low compared to historical
levels. The Peel-Harvey Estuary is now the only
area where this species is caught commercially,
albeit in low quantities. Landings by recreational
fishers are negligible.
Perth herring is anadromous (i.e. spawns in rivers
then migrates back to ocean waters after
spawning). Low spawning success due to
environmental degradation in the upper reaches
of WCB estuaries and low rainfall is believed to be
the main cause of ongoing low stock abundance.
Commercial landings within the Peel-Harvey
Estuary are managed under a Harvest Strategy,
which specifies a limited annual catch (<2.7 t) for
this vulnerable species (Department of Fisheries
2015). The catch was below this target level in
2015, indicating a low fishing impact on the stock.
On the basis of this evidence, the Perth herring
stock is classified as environmentally limited.
BYCATCH AND PROTECTED SPECIES
INTERACTIONS
Bycatch: The small-scale commercial finfish
fisheries in nearshore and estuarine waters mainly
use gill, seine and haul nets that are deployed in a
targeted manner. Few non-target species are
taken. Mesh size regulations ensure that target
species caught by these methods are within an
appropriate size range. Minimal discarding occurs
because virtually all fish taken can be retained and
marketed. Recreational fishers mainly use line-
based methods in nearshore and estuarine waters.
This method can result in the capture and release
of a significant number of non-target species and
undersized fish. The risks associated with post-
release mortality vary considerably among species.
In general, fish in nearshore and estuarine waters
are captured from shallow depths and suffer less
barotrauma-related injuries than deep water
species and so bycatch species are at low risk.
Protected Species: Interactions with listed species
by the fishing gear used in these commercial
fisheries are negligible. Estuarine birds have been
known to interact with fishing nets, but none have
been reported in recent years and the risk to their
populations is negligible. Commercial fishers are
required to report all interactions with listed
species. Recreational fishers using line-fishing
methods are unlikely to capture listed species and
interactions are expected to be a negligible risk.
HABITAT AND ECOSYSTEM
INTERACTIONS Habitat: The operation of gillnets and haul nets
over predominantly sand and mud bottoms is
unlikely to have any impact on these habitats in
estuaries and nearshore waters. Similarly, the line
fishing methods used by recreational fishers have
a negligible impact on the bottom substrates.
Anchoring by recreational fishing vessels may have
localised impacts on habitats such as seagrass and
reefs. Hence there is a negligible risk to benthic
habitats.
Ecosystem: Whitebait in Warnbro Sound is a key
prey item for little penguins (Eudyptula minor) and
whitebait availability may affect their breeding
success (Cannell et al. 2012). Major fluctuations in
whitebait abundance are believed to be primarily
due to environmental factors. Current levels of
commercial effort are historically low, and so
whitebait removals by fishing pose a low risk to
local penguins.
SOCIAL AND ECONOMIC OUTCOMES
Social
The nearshore and estuarine recreational fisheries
of the WCB provide a high social amenity for the
WA community. This Bioregion hosts the main
population centres and these resources are very
accessible to shore-based and small vessel
recreational fishers. There is currently a moderate
risk to these values.
In the WCB, there were 31 commercial fishers
employed (either part or full time) in nearshore
and estuarine fisheries in 2015, largely supplying
fresh fish to meet demand for locally-caught
product.

WEST COAST BIOREGION
DEPARTMENT OF FISHERIES 60
Economic Estimated annual value (to fishers) for 2015: Level
2 ($1 to 5 million).
GOVERNANCE SYSTEM
Allowable Catch Tolerance Levels
West Coast Estuarine Managed Fishery (Peel-
Harvey Estuary only):
Finfish caught commercially in the Peel-Harvey
Estuary are managed according to a Harvest
Strategy which uses catches and catch rates as
indicators of fishery performance (Department of
Fisheries 2015). In 2015, the catches of sea
mullet and yellowfin whiting exceeded their
threshold reference levels (70 t and 14t,
respectively). The Department reviewed the risks
posed by these catch levels and determined that
they were acceptable.
Cockburn Sound (Fish Net) Managed Fishery:
The catch in 2015 was below the tolerance range
of 30 – 112 tonnes (finfish only). The catch has
been below this range for 8 of the past 10 years.
This range was based on annual landings by a
higher number of vessels than are currently
operating. A single vessel now operates in this
fishery and catch data cannot be reported for
confidentiality reasons.
Australian herring fisheries:
The commercial catch tolerance range is 50-179
tonnes. This range represents the minimum and
maximum total annual catches by ‘minor’ herring
fisheries (i.e. excluding G-trap net fishery) over the
period 2000-2014. The 2015 catch was 72 t, which
was acceptable. The current catch tolerance range
used to assess annual recreational fishery
performance is based on boat-based catches
remaining below the estimated 2013/14 state-
wide catch of herring, i.e. <16 t. The next catch
estimate (2015/16) for this sector will be available
in 2017.
Whitebait:
The catch tolerance range is 60-275 tonnes. The
catch in 2014/15 was 97 t and was therefore
acceptable.
Harvest Strategy
This resource is harvested using a constant
exploitation approach, where the annual catch
taken varies in proportion to variations in the stock
abundance. Indicator species are used to
determine the status of the resource. All indicator
species are assessed annually based on catch
and/or catch rate trends, where data is available
(noting that recreational fishery data is limited for
these stocks). Additionally, higher level
assessments are periodically undertaken for some
stocks. A formal harvest strategy exists for finfish
captured commercially within the Peel-Harvey
Estuary. A draft Harvest Strategy for Australian
herring was released for public comment in 2016.
A formal harvest strategy is not currently in place
for the remainder of this resource.
Compliance
The Department undertakes regular compliance
inspections to ensure fishing is being undertaken
in accordance with the governing legislation and
runs education programs with various stakeholder
groups to increase the levels of voluntary
compliance.
Consultation The Department undertakes consultation directly
with licensees on operational issues. Industry
Management Meetings are convened by the West
Australian Fishing Industry Council (WAFIC), who
are also responsible for statutory management
plan consultation under a Service Level Agreement
with the Department. Consultation with the
recreational sector is undertaken via the peak
representative body, Recfishwest, and/or the
Department’s website when documents are
released for public comment.
Management Initiatives In response to Australian herring stock
sustainability concerns, the commercial herring ‘G-
trap’ fishery was closed, and the herring
recreational bag limit was reduced from 30 to 12,
effective from 1 March 2015. A draft Harvest
Strategy for Australian herring was released for
public comment in 2016.
Consultation with peak sector bodies is currently
being undertaken to determine the management
response to address concerns about the
sustainability of southern garfish in the
Metropolitan zone.
EXTERNAL DRIVERS (High Risk)
Annual variations in coastal currents (particularly
the Leeuwin and Capes Currents) appear to
WEST COAST BIOREGION
61 STATUS REPORTS OF THE FISHERIES AND AQUATIC RESOURCES OF WESTERN AUSTRALIA 2015/16
influence the spawning and recruitment patterns
of species such as whitebait, tailor, Australian
herring and western Australian salmon (Lenanton
et al. 2009).
Changes in environmental variables such as ocean
temperature, currents, winds, nutrient supply,
rainfall, ocean chemistry and extreme weather
conditions are expected to have major impacts on
marine ecosystems. These impacts are expected
to create both difficulties and opportunities for
fisheries.
In 2011, a ‘heatwave’ event in coastal waters of
south-western WA altered the distribution (e.g.
tropical species occurring in temperate waters)
and behaviour (e.g. spawning activity, migration)
of many nearshore finfish species, which appears
to have affected the abundance of these species in
2011 and in subsequent years (Caputi et al. 2014).
WCB estuaries are highly modified, and often
degraded environments and the impacts of
environmental factors on estuarine fish are likely
to be at least as important as fishing pressure.
Impacts in estuaries are most pronounced among
‘estuarine-dependent’ species, i.e. those that rely
on estuarine habitats for spawning, feeding and/or
nursery areas (e.g. cobbler, Perth herring, black
bream).
Fluctuating market demand is a significant factor
affecting the annual commercial catch level of
many species.

WEST COAST BIOREGION
DEPARTMENT OF FISHERIES 62
REFERENCES Brown J, Dowling C, Hesp A, Smith K, and Molony B. 2013. Status of nearshore finfish stocks in southwestern Western
Australia. Part 3: Whiting (Sillaginidae). Fisheries Research Report, No. 248. Department of Fisheries, Western Australia.
128pp.
Cannell BL, Chambers LE, Wooller RD, and Bradley JS. 2012. Poorer breeding by little penguins near Perth, Western
Australia is correlated with above average sea surface temperatures and a stronger Leeuwin Current. Marine and
Freshwater Research 63:914-925.
Caputi N, Jackson G, and Pearce A. 2014. The marine heat wave off Western Australia during the summer of 2010/11 – 2
years on. Fisheries Research Report, No. 250. Department of Fisheries, Western Australia. 40pp.
Chubb CF, Hall NG, Lenanton RCJ, and Potter IC. 1984. The fishery for Perth herring, Nematolosa vlaminghi (Munro).
Department of Fisheries and Wildlife Western Australia.
Department of Fisheries. 2015. Finfish Resources of the Peel-Harvey Estuary Harvest Strategy 2015 – 2020. Version 1.0.
West Coast Estuarine Managed Fishery (Area 2). May 2015. Fisheries Management Paper No. 274. Department of
Fisheries, Western Australia. 28pp.
Department of Fisheries (in prep). Australian Herring Resource Harvest Strategy 2016 – 2021. Fisheries Management
Paper No. xxx. Department of Fisheries, Western Australia. 27pp.
Fisher EA, Hesp SA, Hall NG, and Sulin EH. 2014. Predicting the impacts of shifting recreational fishing effort towards
inshore species. FRDC Project No. 2010/001. Fisheries Research and Development Corporation.
Gaughan D, Fletcher WJ, Tregonning RJ, and Goh J. 1996. Aspects of the biology and stock assessment of the whitebait,
Hyperophus vittatus, in south western Australia. Fisheries Research Report, No. 108. Department of Fisheries, Western
Australia. 127pp.
Jenkins GP, Hamer PA, Kent JA, Kemp J, Sherman CDH, and Fowler AJ. 2016. Spawning sources, movement patterns, and
nursery area replenishment of spawning populations of King George Whiting in south-eastern Australia — closing the life
history loop, Fisheries Research and Development Corporation Final Report, Deakin, Canberra.
Lenanton RC, Caputi N, Kangas M, and Craine M. 2009. The ongoing influence of the Leeuwin Current on economically
important fish and invertebrates off temperate Western Australia – has it changed? Journal of the Royal Society of Western
Australia 92: 111–127.
Ryan KL, Hall NG, Lai EK, Smallwood CB, Taylor SM, and Wise BS. 2015. State-wide survey of boat-based recreational fishing
in Western Australia 2013/14. Fisheries Research Report, No. 268. Department of Fisheries, Western Australia. 208pp.
Smallwood CB, Pollock KH, Wise BS, Hall NG, and Gaughan DJ. 2012. Expanding Aerial–Roving Surveys to Include Counts of Shore-Based Recreational Fishers from Remotely Operated Cameras: Benefits, Limitations, and Cost Effectiveness. North American Journal of Fisheries Management, 32:1265-1276.
Smith KA. 2006. Review of fishery resources and status of key fishery stocks in the Swan-Canning Estuary. Fisheries
Research Report, 156. Department of Fisheries, Perth. 84pp.
Smith K, and Brown J. 2014. Biological synopsis of Australian herring (Arripis georgianus). Fisheries Research Report, No.
251. Department of Fisheries, Western Australia. 40pp.
Smith K, Brown J, Lewis P, Dowling C, Howard A, Lenanton R, and Molony B. 2013a. Status of nearshore finfish stocks in
south-western Western Australia, Part 1: Australian herring. Fisheries Research Report, No. 246. Department of Fisheries,
Western Australia. 200pp.
Smith K, Lewis P, Brown J, Dowling C, Howard A, Lenanton R, and Molony B. 2013b. Status of nearshore finfish stocks in
south-western Western Australia, Part 2: Tailor. Fisheries Research Report, No. 247. Department of Fisheries, Western
Australia. 112pp.
Smith K, Dowling C, Mountford S, Hesp A, Howard A, and Brown J. 2016. Status of southern garfish (Hyporhamphus
melanochir) in Cockburn Sound, Western Australia. Fisheries Research Report, No. 271, Department of Fisheries, Western
Australia. 139pp.

WEST COAST BIOREGION
63 STATUS REPORTS OF THE FISHERIES AND AQUATIC RESOURCES OF WESTERN AUSTRALIA 2015/16
WEST COAST SMALL PELAGIC SCALEFISH RESOURCE
STATUS REPORT 2016 J. Norriss and G. Baudains
OVERVIEW
The five species comprising the west coast small
pelagic scalefish resource are tropical sardine
(scaly mackerel, Sardinella lemuru), pilchard
(Sardinops sagax), Australian anchovy (Engraulis
australis), yellowtail scad (Trachurus
novaezelandiae) and maray (Etrumeus teres). They
are taken predominantly by the quota based West
Coast Purse Seine Fishery (WCPSF) using purse
seine gear in waters between Ningaloo and Cape
Leeuwin which includes three separate zones -
Northern Development (22° 00’S to 31° 00’S),
Perth Metropolitan (31° 00’S to 33° 00’S) and
Southern Development Zone (33° 00’S to Cape
Leeuwin). The WCPSF is also entitled to take Perth
herring (Nematalosa vlaminghi), which forms part
of the West Coast Nearshore and Estuarine Finfish
Resource, but has not done so since 1997.
SUMMARY FEATURES 2016
Fishery Performance Commercial Recreational
Total Catch 2015 1,253 t <1 t (2013/14)
Fishing Level Acceptable Acceptable
Stock/Resource Performance
Stock Status Assessment Indicators
West Coast Small pelagic Sustainable - Adequate Biology and total catch
EBFM Performance Asset Level Asset Level
Bycatch Negligible Risk Listed Species Low Risk
Habitat Negligible Risk Ecosystem Low Risk
Social Low Amenity
Low Risk
Economic GVP ($1-5 million)
Low Risk
Governance Stable External Drivers Low Risk
CATCH AND LANDINGS
The total combined catch of the six species that
can be taken by the WCPSF in 2015 was 1,253 t, of
which 96% was tropical sardine, the remainder
being pilchards and yellowtail scad (West Coast
Small Pelagic Scalefish Figure 1). Tropical sardines
have dominated the catch since pilchards suffered
mass mortality events in 1995 and 1998/99 caused
by a herpesvirus.
INDICATOR SPECIES ASSESSMENTS AND
STOCK STATUS
Tropical sardine (Sustainable-Adequate)
Tropical sardines are a small pelagic species that
feed by filtering plankton, living for up to seven
years and reaching a maximum size of about 21 cm
FL on the WA west coast (Gaughan and Mitchell
2000). The WCPSF operates at the southern limit
of the species distribution in WA. Analysis of
otolith chemistry showed no evidence for the
existence of separate stocks between Carnarvon
and Fremantle, where they appear to be highly
mobile resulting in a patchy but widespread
distribution.

WEST COAST BIOREGION
DEPARTMENT OF FISHERIES 64
Year
1990 1995 2000 2005 2010 2015
Ca
tch, to
nne
s
0
1000
2000
3000
4000
5000
6000
PilchardsTropical sardineTotal, all species
WEST COAST SMALL PELAGIC SCALEFISH FIGURE 1. Time series of total annual catch of tropical sardines,
pilchards and the total for all six species combined in the WCPSF since 1990.
The WCPS catch of tropical sardines in 2015 was
1,209 t, a 15% increase from 2014 and a
continuation of an upward trend in recent years,
though well below historical high levels (West
Coast Small Pelagic Scalefish Figure 1). The limited
spatial distribution of fishing effort for what
appears to be a highly mobile species suggests that
only a small proportion of a widespread stock is
being targeted. Catches are therefore considered
sustainable and the biological stock adequate.
Pilchard (Sustainable-Adequate)
The pilchard is a small, low trophic level pelagic
species that feeds by filtering plankton. Longevity
is up to 9 years and the maximum size is 200-250
mm SL.
The high pilchard catch in the 1990s, primarily
from the Perth Metropolitan Zone, declined
precipitously during the mid to late 1990s
following two mass mortality events (West Coast
Small Pelagic Scalefish Figure 1). While the stock
had recovered by the mid-2000s (see below),
catches have remained low since then as the
WCPSF has transitioned to take mostly tropical
sardine.
Population modelling, based on spawning biomass
estimates (from egg surveys), catch-at-age and
catch data, suggested that by the mid-2000s the
stock had recovered from the 1998/99 mass
mortality event. The mid-2000s exploitation rate
for the WA west coast stock was less than 5 per
cent (around 400 t) of the estimated spawning
biomass of approximately 25,000 t. Since 2007 the
total annual catch has never exceeded 100 t. The
current exploitation rate is therefore unlikely to
cause the stock to become recruitment overfished.
The biological stock is therefore considered
adequate.
BYCATCH AND PROTECTED SPECIES
INTERACTIONS
The species available for capture in the WCPSF is
restricted by the West Coast Purse Seine Limited
Entry Fishery Notice 1989. Small quantities of
bycatch species are sometimes captured
incidentally, but this occurs infrequently and the
majority are released from the net unharmed.
Interactions with endangered, threated and
protected species must be reported to the
Department of Fisheries on Catch and Effort
Statistics returns that must be lodged monthly.
There is no evidence to indicate any significant
interactions with these species.

WEST COAST BIOREGION
65 STATUS REPORTS OF THE FISHERIES AND AQUATIC RESOURCES OF WESTERN AUSTRALIA 2015/16
HABITAT AND ECOSYSTEM
INTERACTIONS
Purse seine nets are pelagic in nature, with no
impact on benthic habitats during normal
operations. On rare occasions nets may be
deployed in shallow waters and come into contact
with sensitive habitats such as seagrass beds. The
light structure of the net is expected to cause
minimal damage to benthic habits when this
occurs, and would be kept to a small, localised
area. The WCPSF is therefore considered to be a
negligible risk to these habitats.
SOCIAL AND ECONOMIC OUTCOMES
Social Local employment was provided by 7 active
vessels as well as local processing factories. The
only small pelagic species detected by recent
surveys of boat-based recreational fishing was a
small total catch of yellowtail scad.
Economic A small proportion of the catch is sold for human
consumption but the large majority for bait,
aquaculture feed or pet food. The estimated gross
value of product (GVP) for the WCPSF in 2015 was
level 2 ($1-5 million). There is currently a low level
of risk to this level of return.
GOVERNANCE SYSTEM
Allowable Catch Tolerance Levels
Currently, a notional combined Total Allowable
Catch (TAC), covering both the Perth metropolitan
fishery and the Southern Development Zone, is set
for pilchards and another for other small pelagic
species. For the 2014/15 licensing period (1 April
2014 – 31 March 2015) the notional TAC was
2,328 t for pilchards and a separate TAC of 672 t
for other small pelagic species (including
Sardinella) was in place. Reaching or exceeding
the notional TACs will trigger a management
response.
Harvest Strategy
No formal harvest strategy has been developed for
the WCPSF.
Compliance Compliance is monitored via aerial patrols and
both at-sea and on-land inspections.
Consultation
Consultation with licensees occurs directly on
operational issues and through industry Annual
General Meetings convened by the West
Australian Fishing Industry Council (WAFIC), who
are responsible for statutory management plan
consultation under a Service Level Agreement with
the Department.
Management Initiatives/Outlook Status
A stable management outlook is envisaged for the
WCPSF. Stocks will continue to be monitored
principally through Level 1 (catch based)
assessments.
EXTERNAL DRIVERS
Climate change is likely to be facilitating a
southward shift in the natural distribution of both
pilchards and tropical sardine.
REFERENCES Gaughan D, Craine M, Stephenson P, Leary T, and Lewis P. 2008. Regrowth of pilchard (Sardinops sagax) stocks off southern WA following the mass mortality event of 1998/99. Final FRDC Report – Project 2000/135. Fisheries Research Report, No. 176, Department of Fisheries, Western Australia, 82p.
Gaughan DJ, and Mitchell RWD. 2000. The biology and stock assessment of the tropical sardine, Sardinella lemuru, off the
mid-west coast of Australia. Final Report, FRDC Project 95/037. Fisheries Research Report, No. 119, Department of
Fisheries, Western Australia, 136p.

WEST COAST BIOREGION
DEPARTMENT OF FISHERIES 66
WEST COAST DEMERSAL SCALEFISH RESOURCE
STATUS REPORT 2016 D. Fairclough and M. Holtz
OVERVIEW
The West Coast Demersal Scalefish Resource
(WCDSR) comprises over 100 species in inshore
(20-250 m deep) and offshore (>250 m) demersal
habitats of the West Coast Bioregion (WCB), which
are exploited by both commercial and recreational
(including charter) boat-based line fishers. The
indicator species for inshore waters include West
Australian dhufish (Glaucosoma hebraicum),
snapper (Chrysophrys auratus), redthroat emperor
(Lethrinus miniatus), bight redfish (Centroberyx
gerrardi) and baldchin groper (Choerodon
rubescens), while the proposed indicators for
offshore waters include hapuku (Polyprion
oxygenios), blue-eye trevalla (Hyperoglyphe
antarctica) and eightbar grouper (Hyporthodus
octofasciatus) (see DoF 2011).
Following identification of overfishing of the
inshore demersal resource, the current
management arrangements designed to recover
stocks were progressively introduced between late
2007 and early 2010. These include maintaining
the retained catches of all sectors below 50% of
their 2005/06 catch benchmarks in order to reduce
fishing mortality rates (F) of indicator species to
below the threshold reference point and to meet a
formal IFM sectoral allocation decision.
To achieve these management goals each of the
commercial fisheries authorised to land demersal
scalefish in the WCB have individual management
plans with access, gear, area and entitlement
limitations. Similarly, boat-based recreational and
charter fishers are licensed and managed by
input/output controls including a closed season.
For further details see the West Coast Demersal
Scalefish Resource Assessment Report (in prep)
and SAFS (2016).
SUMMARY FEATURES 2016
Fishery Performance Commercial Recreational
Total Catch 2015 283 t 184-211 t
Fishing Level Acceptable (≤ 450 t) Acceptable (≤ 250 t)
Stock/Resource Performance
Stock Status Assessment Indicators
Inshore Demersal Sustainable -Recovering
Annual: Catch
Periodic: Fishing mortality, SPR
Offshore Demersal Sustainable - Adequate Annual: Catch
EBFM Performance Asset Level Asset Level
Bycatch Low Risk Listed Species Negligible Risk
Habitat Negligible Risk Ecosystem Low Risk
Social High Amenity
Moderate Risk
Economic GVP Level 2 ($1-5 million)
Moderate Risk
Governance Stable External Drivers Moderate Risk
CATCH AND LANDINGS
The total catch of all species in 2015 by the main
commercial fishery, the West Coast Demersal
Scalefish Interim Managed Fishery (WCDSIMF),
was 271 t, of which, 246 t comprised demersal
species. Other commercial fisheries in the WCB
(during 2015 or 2014/15; Temperate Demersal
Gillnet and Demersal Longline fisheries; Cockburn
Sound Line and Pot Managed Fishery, South-west
Trawl Managed Fishery, West Coast Rock Lobster
Managed Fishery) landed a total of 36 t of
demersal species, taken mostly by the temperate
demersal gillnet/longline fisheries.
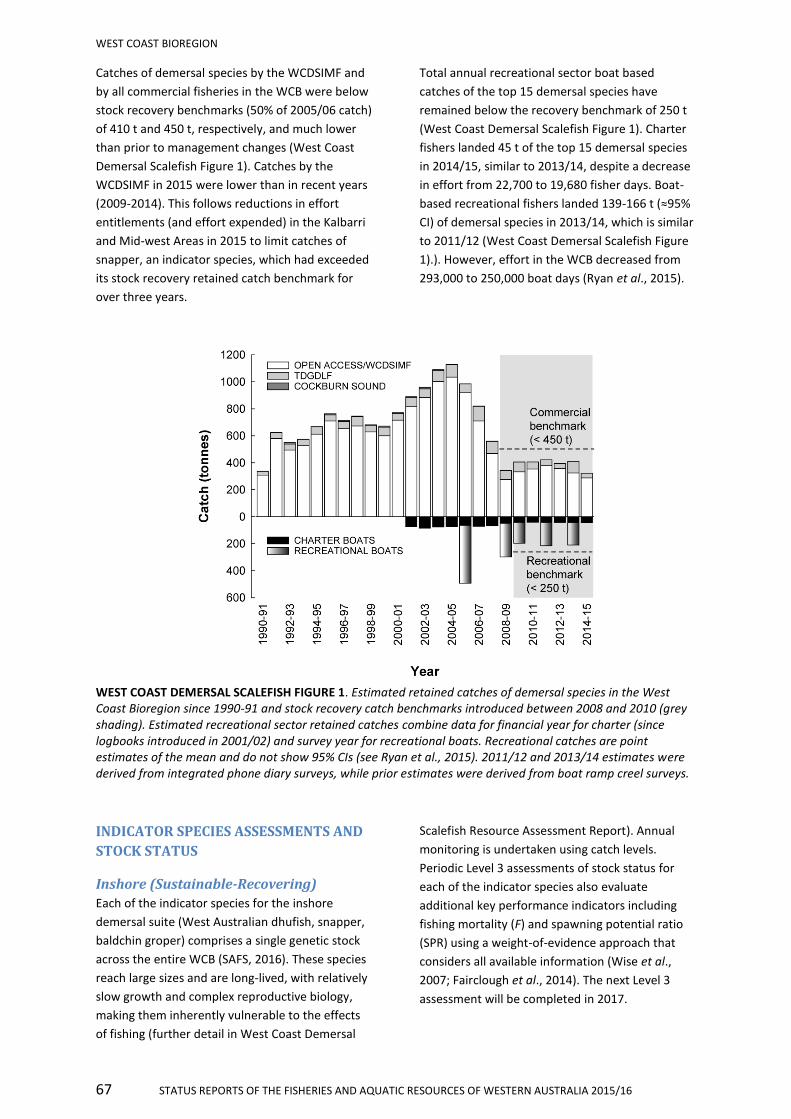
WEST COAST BIOREGION
67 STATUS REPORTS OF THE FISHERIES AND AQUATIC RESOURCES OF WESTERN AUSTRALIA 2015/16
Catches of demersal species by the WCDSIMF and
by all commercial fisheries in the WCB were below
stock recovery benchmarks (50% of 2005/06 catch)
of 410 t and 450 t, respectively, and much lower
than prior to management changes (West Coast
Demersal Scalefish Figure 1). Catches by the
WCDSIMF in 2015 were lower than in recent years
(2009-2014). This follows reductions in effort
entitlements (and effort expended) in the Kalbarri
and Mid-west Areas in 2015 to limit catches of
snapper, an indicator species, which had exceeded
its stock recovery retained catch benchmark for
over three years.
Total annual recreational sector boat based
catches of the top 15 demersal species have
remained below the recovery benchmark of 250 t
(West Coast Demersal Scalefish Figure 1). Charter
fishers landed 45 t of the top 15 demersal species
in 2014/15, similar to 2013/14, despite a decrease
in effort from 22,700 to 19,680 fisher days. Boat-
based recreational fishers landed 139-166 t (≈95%
CI) of demersal species in 2013/14, which is similar
to 2011/12 (West Coast Demersal Scalefish Figure
1).). However, effort in the WCB decreased from
293,000 to 250,000 boat days (Ryan et al., 2015).
WEST COAST DEMERSAL SCALEFISH FIGURE 1. Estimated retained catches of demersal species in the West Coast Bioregion since 1990-91 and stock recovery catch benchmarks introduced between 2008 and 2010 (grey shading). Estimated recreational sector retained catches combine data for financial year for charter (since logbooks introduced in 2001/02) and survey year for recreational boats. Recreational catches are point estimates of the mean and do not show 95% CIs (see Ryan et al., 2015). 2011/12 and 2013/14 estimates were derived from integrated phone diary surveys, while prior estimates were derived from boat ramp creel surveys.
INDICATOR SPECIES ASSESSMENTS AND
STOCK STATUS
Inshore (Sustainable-Recovering)
Each of the indicator species for the inshore
demersal suite (West Australian dhufish, snapper,
baldchin groper) comprises a single genetic stock
across the entire WCB (SAFS, 2016). These species
reach large sizes and are long-lived, with relatively
slow growth and complex reproductive biology,
making them inherently vulnerable to the effects
of fishing (further detail in West Coast Demersal
Scalefish Resource Assessment Report). Annual
monitoring is undertaken using catch levels.
Periodic Level 3 assessments of stock status for
each of the indicator species also evaluate
additional key performance indicators including
fishing mortality (F) and spawning potential ratio
(SPR) using a weight-of-evidence approach that
considers all available information (Wise et al.,
2007; Fairclough et al., 2014). The next Level 3
assessment will be completed in 2017.

WEST COAST BIOREGION
DEPARTMENT OF FISHERIES 68
West Australian dhufish (Sustainable-
Recovering)
Retained catches of West Australian dhufish in the
WCB by all commercial fisheries, the WCDSIMF
and the recreational sector (boat-based fishers
plus charter fishers) have been at acceptable levels
(below stock recovery benchmarks) since inception
of the current management regime, i.e. < 82, 72
and 126 t, respectively (West Coast Demersal
Scalefish Figure 2a). WCDSIMF catches in the Mid-
west and South-west areas have also remained at
or below recovery benchmarks of 44 t and 19 t.
Discard/release rates of dhufish by boat-based
recreational fishers were high in 2013/14 at 66%,
mainly as a result of the capture of undersized fish.
The most recent assessment (Fairclough et al.,
2014) of F at the biological stock level, using age
composition data collected between 2008/09 and
2010/11 (during management changes) decreased
from the previous period 2005/06-2007/08 (West
Coast Demersal Scalefish Figure 2a; Fairclough et
al., 2014). However, F was still above the limit
reference point of 1.5M. Spawning potential ratio
lay between the limit (0.2) and threshold (0.3)
reference point.
The above evidence indicates that the current
level of fishing pressure, if maintained, should
allow the stock to recover from overfishing. The
biological stock is classified as recovering.
Snapper (Sustainable-Recovering) Retained catches of snapper in the WCB by all
commercial fisheries and the WCDSIMF were
above recovery benchmarks of 126 and 120 t,
respectively between 2010 and 2014. Reductions
in effort entitlements to WCDSIMF fishers in the
Kalbarri and Mid-west areas in 2015 contributed to
reducing the total catch below the benchmarks.
This was also the case for both the Kalbarri and
Mid-west areas (i.e. ≤ 65 and 43 t). Estimated total
retained catches of the recreational sector
(recreational boat-based fishers plus charter
fishers) during years of the integrated surveys of
2011/12 and 2013/14 were above the recovery
benchmark of 37 t, but within proposed 10-20%
tolerance limits (Fletcher et al. 2016). Seventy
three per cent of snapper landed in 2013/14 by
boat-based recreational fishers were
discarded/released, due mostly to being undersize
(Ryan et al. 2015).
Estimates of F at the biological stock level derived
from age composition data collected between
2008/09 and 2010/11 decreased from the previous
period 2005/06-2007/08 (West Coast Demersal
Scalefish Figure 2b; Fairclough et al., 2014).
However, F was still above the limit reference
point of 1.5M and SPR ≤ the limit (0.2).
The above evidence indicates that the current
level of exploitation should allow the stock to
recover from overfishing. The biological stock is
classified as recovering.
Baldchin groper (Sustainable-
Recovering)
Retained catches of Baldchin groper in the WCB by
all commercial fisheries, the WCDSIMF and the
recreational sector (boat-based fishers plus charter
fishers) have been at or below stock recovery
benchmarks since commencement of the current
management regime, i.e. < 22, 17 and 33 t,
respectively (West Coast Demersal Scalefish Figure
2c). About 35% of baldchin groper landed in
2013/14 by boat-based recreational fishers were
discarded/released, with the vast majority being
undersize.
Rates of F at the biological stock level, using age
composition data collected from 2008/09 to
2010/11 (i.e. during management changes)
indicated no change since the previous assessment
and were above the limit reference point of 1.5M
(West Coast Demersal Scalefish Figure 2c;
Fairclough et al., 2014). Similarly, little change was
identified in SPR, with point estimates falling
between 0.2 and 0.3.
The current level of fishing pressure should allow
the stock to recover from overfishing. The
biological stock is classified as recovering.
Offshore Demersal (Sustainable-
Adequate)
Estimated retained catches of offshore demersal
species (6-14 t) by the WCDSIMF have remained
below the nominal sustainable catch range for this
suite (20-40 t) since this fishery commenced in
2008. Offshore demersal species are rarely caught
by other state commercial fisheries, but are
sometimes caught by the Western Deepwater
Trawl Fishery (Cwth). However, recent effort and
estimated catches have remained relatively low
(e.g. since 2002: ruby snapper < 25 t, hapuku/bass
groper < 1 t, blue-eye trevalla = 0 t). The current

WEST COAST BIOREGION
69 STATUS REPORTS OF THE FISHERIES AND AQUATIC RESOURCES OF WESTERN AUSTRALIA 2015/16
level of fishing pressure is such that the biological
stocks of offshore demersal species are considered
adequate.
WEST COAST DEMERSAL SCALEFISH FIGURE 2. Estimated commercial and recreational retained catches vs 50% of 2005/06 catch benchmarks (dashed lines) for stock recovery (left column) and fishing mortality estimates vs threshold reference points (right column; Fairclough et al., 2014) for (a) West Australian dhufish, (b) snapper and (c) baldchin groper. Note recreational catches are point estimates and do not show 95% CIs (Ryan et al., 2015). 2011/12 and 203/14 estimates were derived from integrated phone diary surveys, while prior estimates were derived from boat ramp creel surveys.
BYCATCH AND PROTECTED SPECIES
INTERACTIONS
Bycatch: Line fishing for demersal species using
baited hooks is highly selective for demersal fishes.
While other species that are caught but not
normally retained during demersal fishing
activities (including inedible species, e.g. Silver
Toadfish, and small species, such as wrasses) may
not all survive, this still represents a minor impact
to their stocks and therefore a low risk.
Protected Species: Interactions with listed species
by commercial, charter and recreational fishers in
the WCDSF are minimal. Commercial WCDSIMF
and charter fishers are required to record listed
species interactions in their statutory returns.
During 2015, two grey nurse sharks were caught
by the WCDSIMF and both released alive.

WEST COAST BIOREGION
DEPARTMENT OF FISHERIES 70
In 2014/15, charter fishers caught and released
alive three grey nurse sharks, five goldspotted
rockcod and one potato rockcod. Risks to
protected species are therefore considered
negligible.
HABITAT AND ECOSYSTEM
INTERACTIONS Habitat: Line fishing is the main fishing method
used in the commercial and recreational fishery for
demersal species which has little physical impact
on the benthic environment and hence negligible
risk to benthic habitats.
Ecosystem: Hall and Wise (2011) found that while
the species composition in catches of commercial
wetline, gillnet and longline fisheries in the WCB
had changed over a 30 year timeline this may be a
function of changes in targeting or differences in
reporting methods. There was no evidence of a
decline in the trophic level or mean size in catches
and the fishery therefore represents a low risk to
the ecosystem.
SOCIAL AND ECONOMIC OUTCOMES
Social
The WCDSR provides high social amenity to
recreational fishing and diving and to consumers
via commercial fish supply to markets and
restaurants. There is currently a moderate level of
risk to these values.
The demersal resource in the WCB is highly
accessible to boat fishers with approximately
131,000 Recreational Fishing from Boat Licences
held in WA from May 2013 to April 2014. The
commercial WCDSIMF vessels operating in 2015
employed zero to four crew, excluding the skipper,
with the majority employing two crew per vessel.
Fifty three licenced charter operators fished in the
WCB in 2014/15, a decrease from 62 in 2013/14.
The number of people employed in the charter
industry has not been estimated.
Economic
The estimated gross value of product (GVP) for the
WCDSIMF in 2015 was level 2 ($1-5 million). There
is currently a moderate level of risk to this level of
return.
GOVERNANCE SYSTEM
Allowable Catch Tolerance Levels
(Acceptable)
The retained catch levels of both the commercial
and recreational sectors indicate that the fishery
performance for both sectors is considered
acceptable. Total retained catches of demersal
species by the commercial and recreational sectors
were maintained below recovery catch
benchmarks of 450 and 250 t, respectively. After
retained commercial catches of snapper in the
WCB, total WCDSIMF, Kalbarri WCDSIMF and Mid-
west WCDSIMF were above their respective
recovery catch benchmarks of 126, 120, 65 and 43
t for more than three years, management changes
reduced entitlements to the WCDSIMF Kalbarri
and Mid-west Areas at the beginning of 2015.
Retained catches were reduced to acceptable
levels (below recovery benchmarks) in 2015 in
each case.
Harvest Strategy (Under Development)
The WCDSR is currently managed using a constant
catch strategy. Although a formal harvest strategy
is not currently in place for this resource, a stock
rebuilding program is underway, whereby retained
catches are to remain < 50% of 2005/06 catches
until fishing mortality rates fall below the
threshold reference point. Proposals to define
maximum tolerance levels around the acceptable
catches and rates of decrease in F during the
recovery phase have been identified (Fletcher et
al., 2016).
Compliance
The Department undertakes regular compliance
inspections to ensure fishing is being undertaken
in accordance with the governing legislation and
runs education programs with various stakeholder
groups to increase the levels of voluntary
compliance.
Consultation
The Department undertakes consultation directly
with licensees on operational issues. Industry
Annual Management Meetings are convened by
the West Australian Fishing Industry Council
(WAFIC), who are also responsible for statutory
management plan consultation under a Service
Level Agreement with the Department.
Consultation with the recreational sector is
undertaken via the peak representative body,
WEST COAST BIOREGION
71 STATUS REPORTS OF THE FISHERIES AND AQUATIC RESOURCES OF WESTERN AUSTRALIA 2015/16
Recfishwest, and/or the Department’s website
when documents are released for public comment.
Management Initiatives (Stable)
The trial of filleting on-board commercial vessels
presented no compliance issues and will therefore
be formalised in the management plan for the
fishery. No other reviews of management are
anticipated for 2017.
EXTERNAL DRIVERS (Moderate Risk) Recruitment success of demersal species, such as
West Australian dhufish and snapper, vary
annually and are influenced in part by
environmental factors. Climate change may lead to
a range of factors (e.g. increased water
temperatures, changes in current strength) which
may influence the biology of demersal species.
Declines in demersal catch and catch rates in the
South-west Area followed an extreme event, a
marine heatwave in 2011 (Caputi et al., 2014),
which may be associated. Ongoing industrial
development in Cockburn Sound may affect the
spawning aggregation behaviour and survival of
juvenile snapper in that area.
There is some overlap of species captured in the
WCB by state fisheries and by the Commonwealth
Western Deepwater Trawl Fishery and Great
Australian Bight Trawl Sector of the Southern and
Eastern Scalefish and Shark Fishery (>200 m).
These catches are currently very small. The
Commonwealth’s proposed South-West Marine
Bioregional Plan incorporates areas that will
restrict access to fishing in parts of the WCB to the
commercial and recreational sectors.
REFERENCES Caputi N, Jackson G, and Pearce A. 2014. The marine heat wave off Western Australia during the summer of 2010/11 - 2 years on. Fisheries Research Report, No. 250. Department of Fisheries, Western Australia. 40pp.
Department of Fisheries. 2011. Resource assessment framework (RAF) for finfish resources in Western Australia. Fisheries Occasional Publication No. 85. Department of Fisheries Western Australia, Perth.
Fairclough DV, Molony BW, Crisafulli BM, Keay IS, Hesp SA, and Marriott RJ. 2014. Status of demersal finfish stocks on the west coast of Australia. Fisheries Research Report, No. 253. Department of Fisheries, Western Australia 96 pp.
Fletcher WJ, Wise BS, Joll LM, Hall NG, Fisher EA, Harry AV, Fairclough DV, Gaughan DJ, Travaille K, Molony BW, and Kangas M. 2016. Refinements to harvest strategies to enable effective implementation of Ecosystem Based Fisheries Management for the multi-sector, multi-species fisheries of Western Australia. Fisheries Research, 183: 594-608.
Hall NG, and Wise BS. 2011. Development of an ecosystem approach to the monitoring and management of Western Australian fisheries. FRDC Report – Project 2005/063. Fisheries Research Report, No. 215. Department of Fisheries, Western Australia. 112 pp.
Ryan KL, Hall NG, Lai EK, Smallwood CB, Taylor SM and Wise BS. 2015. State-wide survey of boat-based recreational fishing in Western Australia 2013/14, Fisheries Research Report, No. 268. Department of Fisheries, Western Australia, Perth.
SAFS. 2016. Status of Australian Fish Stocks. Fisheries Research and Development Corporation. Canberra. http://fish.gov.au/Reports
Wise BS, St John J, and Lenanton RC. (eds) 2007. Spatial scales of exploitation among populations of demersal scalefish: implications for management. Part 1: Stock status of the key indicator species for the demersal scalefish fishery in the West Coast Bioregion. Final report to Fisheries Research and Development Corporation on Project No. 2003/052. Fisheries Research Report, No. 163. Department of Fisheries, Western Australia.