West Central Florida MEDICAL MANUFACTURING ANALYSIS · Medical Tourism ... (SWOT) Analysis .....16...
47
MEDICAL MANUFACTURING ANALYSIS 2015 v.3 West Central Florida http://www.i75corridor.org
Transcript of West Central Florida MEDICAL MANUFACTURING ANALYSIS · Medical Tourism ... (SWOT) Analysis .....16...

MEDICAL MANUFACTURINGANALYSIS
2015 v.3
West Centra l F lor ida
http://www.i75corridor.org

Florida Medical Manufacturers ConsortiumFlorida Medical Manufacturers Consortium - The FMMC is a statewide association of medical technology firms. The FMMC exists to unite, promote, and grow the Florida medical device industry, and to enhance the business success of its member companies.
The FMMC accomplishes its mission via: networking, industry knowledge & expertise, advocacy.
http://www.floridamedtech.com

I. Introduction ........................................................................01
I-75 Medical Manufacturing Corridor Initiative .......... 02
Medical Manufacturing in West Central Florida ......... 02
Medical Tourism ...................................................................... 03
Purpose of the Analysis ........................................................ 04
II. Why we need Medical Manufacturing ........................05
Infrastructure & Logistics .................................................... 05
Workforce Skill Competency .............................................. 06
Available Undeveloped Land ............................................. 07
Data/Broadband Requirements ........................................ 08
Energy Usage and Domestic Cost Comparison .......... 10
III. Industry Profile ................................................................11
Industries ................................................................................... 11
Medical Equipment (NAICS CODE 3391) ...................... 11
Pharmaceuticals (NAICS CODE 3254) ............................. 13
Health Care and Social Assistance in West Central
Florida ......................................................................................... 13
IV. Gap/Needs (SWOT) Analysis ........................................16
Workforce & Training ............................................................ 16
Supplier Networks .................................................................. 18
Research and Innovation ..................................................... 18
Infrastructure/Site Development ..................................... 20
Trade and International Investment ............................... 22
Operational Improvement and Capital Access ........... 23
V. Economic Analysis. ...........................................................24
VI. Stragegy Recommendations ........................................28
VII. Appendix .........................................................................30
Sample Web Survey .............................................................. 30
Survey Results .......................................................................... 33
Sample Regional Website Layout ..................................... 41
Sample Rack Card .................................................................. 43
Table of Contents
version 3

An Ecosystem Analysis Supporting Regional DevelopmentThe West Central Florida Super Region consisting of the Southwest Florida and Tampa Bay Economic Development Districts (EDDs) has an urgent need for more manufacturing. In 2014, the EDDs began work on developing a Medical Manufacturing Analysis. This effort was a result in the need for diversification of the region. Recent EDA-funded investments including the CEDS, Tampa Bay Industry Cluster and Workforce Competency Study, and the Industry Cluster Analysis of Hillsborough Counties all have demonstrated the dearth of manufacturing related employment. The two EDDs submitted an joint application to leverage these existing investments to foster favorable conditions for creation of a global high-tech medical manufacturing network tailored to the central and southwestern counties in Florida by creating an Advanced Medical Manufacturing Analysis.
Diversifying the employment base in this Super Region is critical to smooth out the cyclical impacts of the dominant tourism and construction sector on the overall economy. Additionally, high
tech medical manufacturing creates significant job multipliers, helping to further diversify the employment base. The region has unlimited export potential with two major deep water ports, multiple international airports, rail, and interstate, and other essential infrastructure. A talented workforce can be provided by any one of the major universities (University of South Florida, University of Florida, University of Central Florida, Florida Gulf Coast University and the new Florida Polytech University) or colleges and technical training centers along the High Tech Corridor. The unique geography of the Gulf of Mexico provides the area a competitive advantage over other low cost regions, reducing the risk that specialized manufacturers will relocate out of the area. The region has the potential to grow High Tech Manufacturing and has a niche in Medical Manufacturing, but needs additional support to help grow and expand the sectors.
I. Introduction
1 I-75 Medical Manufacturing Coordidor

- Source: Enterprise Florida
Florida boasts the third largest medical device manufacturing industry in the US.“”
1-75 MEDICAL MANUFACTURING CORRIDOR INITIATIVE (IMMCI)The I-75 Medical Manufacturing Corridor Initiative (IMMCI)
specifically addresses NAICS Codes 3391 Medical Equipment and Supplies Manufacturing and 3254 Pharmaceutical and Medicine Manufacturing. Communities included in this Initiative rank in the top third in the nation for the key manufacturing technology. IMMCI partners have developed the following Vision and Mission to guide its efforts for expanding Medical Manufacturing in the region.
MEDICAL MANUFACTURING IN WEST CENTRAL FLORIDAThe medical field is one of the fastest growing industries in the country as the following statistics indicate:• U.S. health care expenditures were just under $3 trillion in
2013, up from $2.51 trillion in 2009. The healthcare field is projected to grow 27 percent (estimated 177,000 new jobs) over the next seven years (U.S. News).
• Florida has over 1,000 biotech, pharmaceuticals, and medical device companies. Over $1 billion is invested annually on life sciences research and development by Florida universities (Enterprise Florida).
• Florida is second in the nations in terms of FDA registered medical device manufacturing facilities (Enterprise Florida).
• Florida is third in terms of pharmaceutical and medicine manufacturing businesses (US Dept. of Labor).
• Tampa Bay and Miami are highly cost-effective locations for medical manufacturing. In Tampa Bay, it costs $24.1 million to operate a medical device manufacturing facility ($25.8 million in Miami) compared to $27.1m in Chicago, $28.6m in Boston, and over $30m in San Jose/Palo Alto and Los Angeles/Long Beach regions in California (2011 Study by Body Co.).
In terms of impacts, a 2012 study prepared by Battelle Technology Partnership Practice called, The Economic Impact of the U.S. Advanced Medical Technology Industry, identified the following items related to businesses in this field (defined as NAICS 3254, 3345, and 3391):
VisionThe I-75 Medical Manufacturing Corridor has the resources necessary to grow its existing medical manufacturers and attract new ones.
MissionIncrease the number and size of medical manufacturing companies in the reigion and the number of highly skilled jobs in this sector.
1-75 MEdical Manufacturing Corridor
Source: Southwest Florida Regional Planning Council
2I-75 Medical Manufacturing Coordidor

travel to destinations far from home, often internationally, and often to take advantage of the destination’s visitor accommodations and attractions. This travel often includes packaging all aspects of the journey—specially equipped travel arrangements, hotel rooms retrofitted for extended recovery stints, accommodations and other concierge services for attending family and others. For example, the Mayo Clinic maintains a counter at the Minneapolis-St Paul International Airport to facilitate all of the needs of incoming patients, their families and others.
Currently, the worldwide medical tourism market is estimated between to be about $100 billion with average spending of $3,500 to $5,000 per visit. As the graphic below depicts, the US is a significant provider of medical travel services. This market is expected to grow by 15-25% in the future and is another niche in which West Central Florida communities seek to specialize. Tampa Bay Regional Planning Council (TBRPC) has hired a consultant, Global Health Resources, to assess the potential for developing medical tourism in the Tampa Bay area. With input from various government agencies, tourism partners and the healthcare industry the Council will identify a potential Return on Investment associated with creating a privately led partnership to increase medical tourism to the region. By leveraging the area’s natural amenities and climate with the region’s advanced medical facilities and well known research centers, Tampa Bay is primed to become a premier destination
Florida is home to over 200
pharmaceutical and medicine
manufacturers and employs nearly
4,500 researchers, engineers,
technicians, and workers.
“ ”
• Average compensation was $84,156 (including benefits) or 1.85 times the national average. This is largely due to the intensive research required in this field.
• For 2009, Florida was the third largest state in terms of industry employment with 105,933 working in advanced medical technology.
• The industry has an employment multiplier of 3.9.
As these statistics indicate, medical
manufacturing offers great potential for the communities in which it is located. The long-term potential for this field is fueled by the aging population. The U.S. Census Bureau estimates that the population of adults aged 65 and older, numbering 44.7 million in 2013, will grow to 83.7 million by 2050 and comprise approximately 21 percent of the American population.
MEDICAL TOURISM Another related market is medical tourism. Medical tourism is a growing field for patients seeking specialized medical care to
- Enterprise Florida
3 I-75 Medical Manufacturing Coordidor

in the state. An interim report is due to the Council in December 2015 and a final report is due by March 2016.
PURPOSE OF THE ANALYSIS The Advanced Manufacturing Analysis will help counties and the respective economic development organizations by identifying key players and strategic actions required to grow and expand the manufacturing base. This determines which employment would be best suited for each county using the REMI PI+ econometric model. A regional website has been developed for utilization of these sites and marketing to economic development organizations and their respective prospects. http://www.i75corridor.org/
Florida is a preferred destination because of its natural scenic beauty and attractions.
“ ”
4I-75 Medical Manufacturing Coordidor

The medical field is one of the fastest growing industries in the country as the following statistics indicate:
• U.S. health care expenditures were just under $3 trillion in 2013, up from $2.51 trillion in 2009. The healthcare field is projected to grow 27 percent (estimated 177,000 new jobs) over the next seven years (U.S. News).
• Florida has over 1,000 biotech, pharmaceuticals, and medical device companies. Over $1 billion is invested annually on life sciences research and development by Florida universities (Enterprise Florida).
• Florida is second in the nation in terms of FDA registered medical device manufacturing facilities (Enterprise Florida). Florida is third in terms of pharmaceutical and medicine manufacturing businesses (US Dept. of Labor).
• Tampa Bay is a highly cost-effective location for medical manufacturing. In Tampa Bay, it costs $24.1 million to operate a medical device manufacturing facility compared to $27.1m in Chicago, $28.6m in Boston, and over $30m in San Jose/Palo Alto and Los Angeles/Long Beach regions in California (2011 Study by Body Co.).
In terms of impacts, a 2012 study prepared by Battelle Technology Partnership Practice called, The Economic Impact of the U.S. Advanced Medical Technology Industry, identified the following items related to businesses in this field (defined as NAICS 3254, 3345, and 3391):
• Average compensation was $84,156 (including benefits) or
1.85 times the national average. This is largely due to the intensive research required in this field.
• For 2009, Florida was the third largest state in terms of industry employment with 105,933 working in advanced medical technology.
• The industry has an employment multiplier of 3.9.
As these statistics indicate, medical manufacturing offers great potential for the communities in which it is located. The long-term potential for this field is fueled by the aging population. The U.S. Census Bureau estimates that the population of adults aged 65 and older, numbering 44.7 million in 2013, will grow to 83.7 million by 2050 and comprise approximately 21 percent of the American population. West Central Florida’s demographic makeup makes the region uniquely suited to take advantage of this increased demand.
INFRASTRUCTURE AND LOGISTICSWest Central Florida has a strong infrastructural base that is be very attractive to medical manufacturing businesses. The region has already proved that it can handle the infrastructural and logistics needs of a major medical manufacturer. Arthrex is a global medical device company with annual revenues of $1.2 billion. Arthrex is headquartered in Naples, FL with a global logistics center in Fort Myers, FL and they utilize the Southwest Florida International Airport for their shipping needs, both domestically and internationally.
II. Why We Need Medical Manufacturing
5 I-75 Medical Manufacturing Coordidor

Freight and logistics are the backbone of a successful manufacturing market. West Central Florida is supported by roadways, trains, airports, and ports. The area that makes up the West Central Florida is linked by I-75. Four major airports located in Tampa, St. Petersburg, Sarasota, and Fort Myers handle passenger and cargo operations and are supported by general aviation facilities. In addition, the Port of Manatee is the closest deep-water seaport to the Panama Canal and Port Tampa Bay is Florida’s largest cargo tonnage port.
The tables below show tonnage by airport and port in West Central Florida:Table 1. AIRPORT CARGO (TONS)
Facility 2010 2011 2012 2013 2014Tampa
International Airport
96,450 96,550 94,250 94,550 91,450
Southwest Florida
International Airport
17,084 16,270 16,915 16,078 16,735
Source: Individual Airports
Table 2. SEAPORT CARGO (TONS)Facility 2010 2011 2012 2013 2014
Port Tampa Bay 36,955,699 34,262,712 33,907,564 34,968,421 36,217,443
Port Manatee 3,370,000 2,689,000 2,288,000 2,648,000 2,028,000
Source: Individual Seaports.
Currently, 90% of the goods that come to Florida arrive by water. With the on-going expansion of the Panama Canal allowing for larger container ships, Florida ports are making improvements to handle the increased number of containers they will be receiving. For example, Port Tampa Bay is spending $20.8 million on container yard improvements. The port has also purchased larger cranes needed to unload containers from the larger ships.
West Central Florida can also provide rail service. CSXT is a Class I railroad operating the most extensive rail network in Florida. CSXT serves most of the State’s major urban areas and the seaports of Port of Tampa and Port of Jacksonville. The Seminole Gulf Railway (SGLR) is a Class III railroad with two lines in Southwestern Florida: The Fort Myers Line between Arcadia and Vanderbilt Beach and the Sarasota Line between Oneco and Venice.
WORKFORCE SKILL COMPETENCYWest Central Florida has the workforce necessary to become a major player in the medical manufacturing industry. The region has two major state universities (University of South Florida and Florida Gulf Coast University) that greatly bolster the skill level
of the region’s workforce. These universities are willing to work with local business to help fill their workforce needs. The region’s various vocational and tech colleges prepare our workforce for technical and professional jobs including those that relate to medical manufacturing. The West Central Florida workforce features the following training resources:
• The University of South Florida (USF) and Florida Gulf Coast University (FGCU) offer undergraduate programs in Biomedical Engineering with USF also offering graduate programs in the field. Bioengineers can work in the medical device and biotechnology industries, in healthcare and research, and for government agencies, such as the FDA. The Biomedical Engineering programs are accredited by the Engineering Accreditation Commission of ABET. (Additionally, USF also has a medical school).
• The region is bolstered by five State Colleges and multiple vocational schools in the area that also provide courses in related fields such as: machining, engineering technology, and computer systems. A number of the region’s Florida colleges are working with the Manufacturers Association of Florida (MAF) Center to establish manufacturing education programs and industry certifications to prepare students for manufacturing careers.
• Private universities and colleges exist in the region in addition to the technical training institutions.
• Four Florida Workforce Development Boards in the region provide tools for training workers including paid internships, on-the-job training, and classroom training funds. Each works closely with local businesses to provide the training they need to attract employees and expand (such as local machining programs at vocational training schools).
• Some employers also offer their own programs, such as Arthrex (a local medical device manufacturer), which provides a four-year accredited manufacturing apprenticeship program to train CNC machine operators. The company provides internships, co-ops, and job shadowing opportunities.
6I-75 Medical Manufacturing Coordidor

AVAILABLE UNDEVELOPED LANDThe West Central Florida consists of Collier, Lee, Charlotte, Sarasota, Hendry, Glades, Pinellas, Pasco, Hillsborough, Manatee, Citrus, and Hernando Counties. The region ranges from metropolitan coastal regions (such as Hillsborough and Pinellas) to rural inland counties (like Glades and Hendry). Counties in the southern part of the region, specifically Lee and Collier, are some of the fastest growing counties in the nation. There is available undeveloped land throughout the region that would be attractive to medical manufacturers.
Source: http://www.mathworks.com
Florida Land Cover Aggregation
7 I-75 Medical Manufacturing Coordidor

DATA/BROADBAND REQUIREMENTSRecently, broadband infrastructure has emerged as one of the primary forces driving economic development. With the rise of the global digital marketplace and the increasing availability of broadband, the importance of having scalable, high-speed broadband networks is critical to a region’s long term economic sustainability. In order to ensure that West Central Florida and its businesses, organizations, and residents are not left out of this new digital opportunity, community leaders need to identify and enhance the regional broadband infrastructures to bring value to the community and ensure the region is able to compete on a global scale. In total there are 55 broadband providers in Florida. Since 2010, Broadband Florida Initiative has been awarded $8,877,028 in federal grants for Florida’s Broadband Initiative. Another $55,902,591, accounting for 1.6% of all federal infrastructure grants, was awarded to broadband infrastructure projects in Florida. The website broadbandnow.com ranks Florida as the 9th most connected state with an average state-wide speed of 35.8 mbps. The metropolitan counties in West Central Florida are some of the highest performing in the state.
Table 1. ACCESS TO 100 MBPS BROADBAND
WEST CENTRAL FLORIDASARASOTA COUNTY 96.20%
COLLIER COUNTY 95.30%LEE COUNTY 91.70%
HILLSBOROUGH COUNTY 90.10%CHARLOTTE COUNTY 87.80%
PASCO COUNTY 85.80%MANATEE COUNTY 79.30%HENDRY COUNTY 66.40%PINELLAS COUNTY 42.80%GLADES COUNTY 20.50%CITRUS COUNTY 10.40%
HERNANDO COUNTY 0.00%
“Florida is known globally. In order to be competitive in a global marketplace, we must keep pace with technology. Our quality of life and economicdevelopment will depend on our commitment to maintaining acompetitive advantage in our broadband strategies.“
- Southwest Florida Broadband Plan: Marion Briggs, President Realtor Association of Greater Fort Myers Beach
“ ”
8I-75 Medical Manufacturing Coordidor
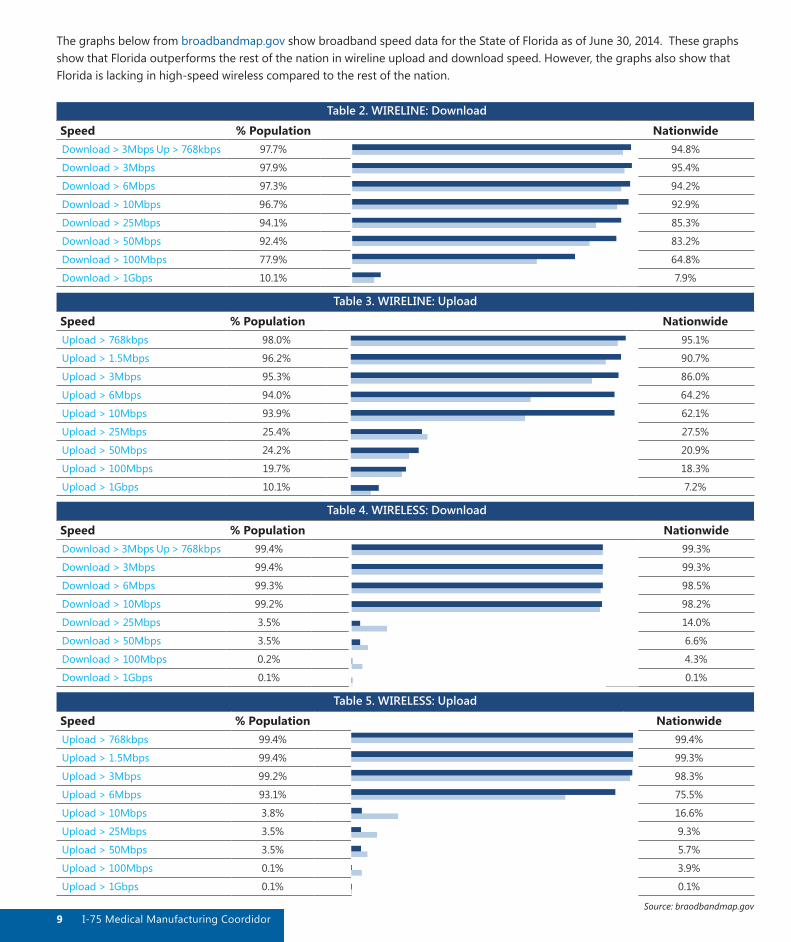
The graphs below from broadbandmap.gov show broadband speed data for the State of Florida as of June 30, 2014. These graphs show that Florida outperforms the rest of the nation in wireline upload and download speed. However, the graphs also show that Florida is lacking in high-speed wireless compared to the rest of the nation.
Table 2. WIRELINE: Download
Speed % Population NationwideDownload > 3Mbps Up > 768kbps 97.7% 94.8%
Download > 3Mbps 97.9% 95.4%
Download > 6Mbps 97.3% 94.2%
Download > 10Mbps 96.7% 92.9%
Download > 25Mbps 94.1% 85.3%
Download > 50Mbps 92.4% 83.2%
Download > 100Mbps 77.9% 64.8%
Download > 1Gbps 10.1% 7.9%
Table 3. WIRELINE: Upload
Speed % Population NationwideUpload > 768kbps 98.0% 95.1%
Upload > 1.5Mbps 96.2% 90.7%
Upload > 3Mbps 95.3% 86.0%
Upload > 6Mbps 94.0% 64.2%
Upload > 10Mbps 93.9% 62.1%
Upload > 25Mbps 25.4% 27.5%
Upload > 50Mbps 24.2% 20.9%
Upload > 100Mbps 19.7% 18.3%
Upload > 1Gbps 10.1% 7.2%
Table 4. WIRELESS: Download
Speed % Population NationwideDownload > 3Mbps Up > 768kbps 99.4% 99.3%
Download > 3Mbps 99.4% 99.3%
Download > 6Mbps 99.3% 98.5%
Download > 10Mbps 99.2% 98.2%
Download > 25Mbps 3.5% 14.0%
Download > 50Mbps 3.5% 6.6%
Download > 100Mbps 0.2% 4.3%
Download > 1Gbps 0.1% 0.1%
Table 5. WIRELESS: Upload
Speed % Population NationwideUpload > 768kbps 99.4% 99.4%
Upload > 1.5Mbps 99.4% 99.3%
Upload > 3Mbps 99.2% 98.3%
Upload > 6Mbps 93.1% 75.5%
Upload > 10Mbps 3.8% 16.6%
Upload > 25Mbps 3.5% 9.3%
Upload > 50Mbps 3.5% 5.7%
Upload > 100Mbps 0.1% 3.9%
Upload > 1Gbps 0.1% 0.1%
Source: braodbandmap.gov9 I-75 Medical Manufacturing Coordidor

ENERGY USAGE AND DOMESTIC COST COMPARISON • Florida was second only to Texas in 2014 in net electricity
generation from natural gas, which accounted for 61% of Florida’s net generation; coal accounted for almost 23%, the state’s nuclear power plants accounted for 12%, and other resources, including renewable energy, supplied the remaining electricity generation.
• Renewable energy accounted for 2.3% of Florida’s total net electricity generation in 2014, and the state ranked 10th in the nation in net generation from utility-scale solar energy.
• In part because of high air conditioning use during the hot summer months and the widespread use of electricity for home heating during the winter months, Florida’s retail electricity sales to the residential sector were second in the nation after Texas in 2014.
• A Florida facility using a gas fermentation process to produce an estimated 8 million gallons of cellulosic ethanol from citrus fruit, vegetable, and yard wastes began commercial-scale production in 2013.
• Electricity accounts for 90% of the site energy consumed by Florida households, and the annual electricity expenditures of $1,900 are 40% higher than the U.S. average, according to EIA’s Residential Energy Consumption Survey.
Table 7. Consumption & ExpendituresSummary Florida U.S. RankTotal Consumption 4,078 trillion Btu 3
Total Consumption per Capita 208 million Btu 46
Total Expenditures $66,153 million 3
Source: U.S. Energy Information Administration
Source: U.S. Energy Information Administration
Table 8. PricesTable 6. Florida Price Differences from U.S. Average, Most Recent
Source: U.S. Energy Information Administration
Table 9. Florida Energy Consumption Estimates, 2013
Source: U.S. Energy Information Administration, State Energy Data System
10I-75 Medical Manufacturing Coordidor

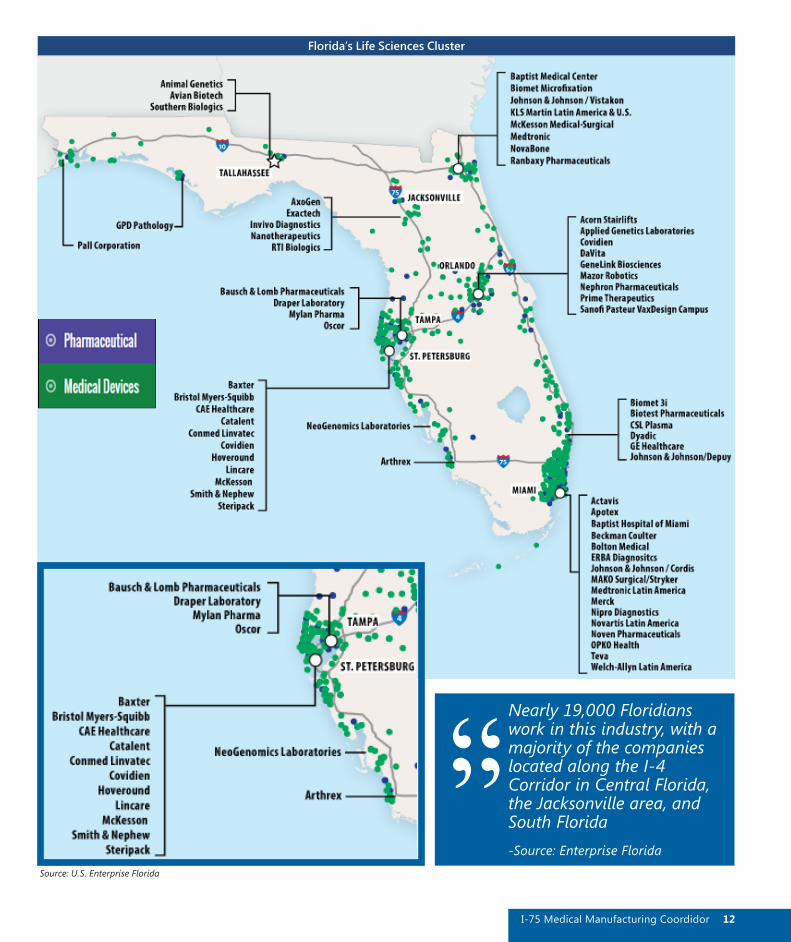
INDUSTRIESThe I-75 Medical Manufacturing Project focuses on two industries: Medical Equipment (NAICS Code 3391) and Pharmaceuticals (NAICS Code 3254). According to Enterprise Florida, Florida boasts the third largest medical device manufacturing industry in the United States. Nearly 19,000 Floridians work in the medical device manufacturing industry, with a large portion of the 620+ companies located near Miami and Tampa. Florida is also home to over 220 pharmaceutical and medicine manufacturing companies, employing roughly 4,500 workers. Notable companies along the I-75 Corridor include Arthrex, Bausch & Lomb Pharmaceuticals, Bristol Myers-Squibb, CAE Healthcare, and ConMed Linvatec.
The Tampa Bay and Southwest Florida Regional Planning Councils view Medical Equipment and Pharmaceutical Manufacturing as a key opportunity for growth in our region. The combined Tampa Bay-Southwest Florida region has a 1.64 location quotient in Medical Equipment Manufacturing (bls.gov), meaning that the industry cluster is much more concentrated in this region than the rest of the country. The Maps on the following page shows the concentration of medical device and pharmaceutical companies throughout the state of Florida and the Tampa Bay and Southwest Regions.
MEDICAL EQUIPMENT (NAICS CODE 3391) An EDA funded 2010 study by SRI International entitled Recommended Target Sectors for the Tampa Bay Region, found that the medical instrument & supplies manufacturing field had $89.4 billion in U.S. revenues
in 2010, driven by strong growth in the surgical and medical instruments, appliances, and supplies segment. Globally, medical device revenues in 2008 were estimated at $336 billion, and the market is dominated by U.S.-based companies. Relative to the global pharmaceutical market, the medical device market is half the size, but is experiencing faster growth and poses lower risks than the pharmaceutical industry because of significantly shorter development times and lower regulatory approval risk. Other industry drivers include physician demand for improved diagnostics and imaging for guidance on patient disease status and disease management. Also, the convergence of the medical device and drug industries has resulted in the development of products such as drug-eluting stents and glucose monitoring systems incorporated into insulin pumps.
The medical instruments and devices niche already has a very strong critical mass in the region, with exceptionally high employment concentrations for a number of core activities. While
III. Industry Profile
11 I-75 Medical Manufacturing Coordidor
Source: U.S. Enterprise Florida
Florida’s Life Sciences Cluster
Nearly 19,000 Floridians work in this industry, with a majority of the companies located along the I-4 Corridor in Central Florida, the Jacksonville area, and South Florida -Source: Enterprise Florida
“ ”12I-75 Medical Manufacturing Coordidor
this niche is a mature industry with a high degree of competition, many of the larger firms nationally have locations in the region, such as Baxter International, Cardinal Health, GE Medical Systems Technology, Linvatec (ConMed), Arthrex, and Smith & Nephew. The region is also home to a proportionately large number of small, niche firms in the medical instruments and device sector, manufacturing a wide range of products including orthopedic devices and surgical equipment, medical simulation equipment, ease of living/mobility aids and optical devices.
PHARMACEUTICALS (NAICS CODE 3254)The SRI International study also found that pharmaceutical and medicine manufacturing revenues had an annual growth rate of only 1.7% from 2005 to 2010. Domestically, the industry was affected by reduced
consumer spending (due to rising unemployment and reduced employer-provided health care coverage) and competition from growth in generics. The industry is also suffering from difficulty in generating a pipeline of new drugs. Consequently, the industry is looking to public and private life sciences research and development activity for new breakthroughs in understanding and developing new treatments for a large array of diseases. Globally, the pharmaceutical and medicine manufacturing market was projected to grow at a CAGR of approximately 6% from 2010 to 2012.The region is fortunate to host many strong medical-related assets within the region. It has numerous institutions conducting noteworthy, world-class research on today’s most important medical issues, such as cancer (e.g., H. Lee Moffitt Cancer Center & Research Institute) and Alzheimer’s (e.g., USF Health Byrd Alzheimer’s Institute). Under this initiative, the partners will expand their collaborative efforts to increase medical manufacturing in the region.
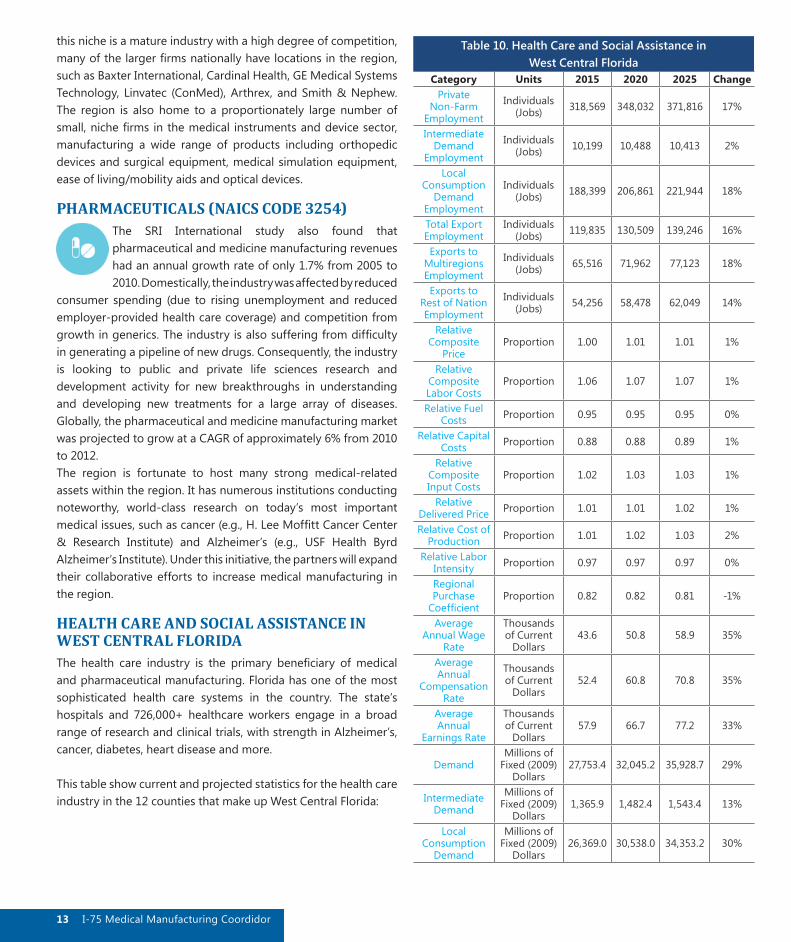
HEALTH CARE AND SOCIAL ASSISTANCE IN WEST CENTRAL FLORIDAThe health care industry is the primary beneficiary of medical and pharmaceutical manufacturing. Florida has one of the most sophisticated health care systems in the country. The state’s hospitals and 726,000+ healthcare workers engage in a broad range of research and clinical trials, with strength in Alzheimer’s, cancer, diabetes, heart disease and more.
This table show current and projected statistics for the health care industry in the 12 counties that make up West Central Florida:
Table 10. Health Care and Social Assistance in West Central Florida
Category Units 2015 2020 2025 ChangePrivate
Non-Farm Employment
Individuals (Jobs) 318,569 348,032 371,816 17%
Intermediate Demand
Employment
Individuals (Jobs) 10,199 10,488 10,413 2%
Local Consumption
Demand Employment
Individuals (Jobs) 188,399 206,861 221,944 18%
Total Export Employment
Individuals (Jobs) 119,835 130,509 139,246 16%
Exports to Multiregions Employment
Individuals (Jobs) 65,516 71,962 77,123 18%
Exports to Rest of Nation Employment
Individuals (Jobs) 54,256 58,478 62,049 14%
Relative Composite
PriceProportion 1.00 1.01 1.01 1%
Relative Composite Labor Costs
Proportion 1.06 1.07 1.07 1%
Relative Fuel Costs Proportion 0.95 0.95 0.95 0%
Relative Capital Costs Proportion 0.88 0.88 0.89 1%
Relative Composite Input Costs
Proportion 1.02 1.03 1.03 1%
Relative Delivered Price Proportion 1.01 1.01 1.02 1%
Relative Cost of Production Proportion 1.01 1.02 1.03 2%
Relative Labor Intensity Proportion 0.97 0.97 0.97 0%
Regional Purchase
CoefficientProportion 0.82 0.82 0.81 -1%
Average Annual Wage
Rate
Thousands of Current
Dollars43.6 50.8 58.9 35%
Average Annual
Compensation Rate
Thousands of Current
Dollars52.4 60.8 70.8 35%
Average Annual
Earnings Rate
Thousands of Current
Dollars57.9 66.7 77.2 33%
DemandMillions of
Fixed (2009) Dollars
27,753.4 32,045.2 35,928.7 29%
Intermediate Demand
Millions of Fixed (2009)
Dollars1,365.9 1,482.4 1,543.4 13%
Local Consumption
Demand
Millions of Fixed (2009)
Dollars26,369.0 30,538.0 34,353.2 30%
13 I-75 Medical Manufacturing Coordidor

Investment Activity Demand
Millions of Fixed (2009)
Dollars18.0 24.2 31.4 75%
Total ImportsMillions of
Fixed (2009) Dollars
5,061.3 5,905.5 6,662.5 32%
Imports from Multiregions
Millions of Fixed (2009)
Dollars2,705.8 3,145.8 3,540.7 31%
Imports from Rest of Nation
Millions of Fixed (2009)
Dollars2,346.4 2,749.3 3,110.5 33%
Imports from Rest of World
Millions of Fixed (2009)
Dollars9.1 10.5 11.4 25%
Self-SupplyMillions of
Fixed (2009) Dollars
22,692.1 26,139.7 29,266.2 29%
Total ExportsMillions of
Fixed (2009) Dollars
7,432.8 8,470.7 9,433.4 27%
Exports to Multiregions
Millions of Fixed (2009)
Dollars2,307.9 2,662.1 2,982.7 29%
Exports to Rest of Nation
Millions of Fixed (2009)
Dollars5,118.9 5,801.8 6,442.9 26%
Exports to Rest of World
Millions of Fixed (2009)
Dollars6.0 6.8 7.8 30%
OutputMillions of
Fixed (2009) Dollars
30,124.9 34,610.4 38,699.6 28%
Value-AddedMillions of
Fixed (2009) Dollars
19,361.4 22,428.1 25,338.9 31%
Wages and Salaries
Millions of Current
Dollars13,890.5 17,674.0 21,902.4 58%
CompensationMillions
of Current Dollars
16,692.7 21,164.1 26,307.5 58%
Earnings by Place of Work
Millions of Current
Dollars18,444.8 23,219.6 28,686.5 56%
Labor Productivity
Thousands of Fixed (2009) Dollars
94.6 99.5 104.1 10%
National Deflator
2009=1 (Nation) 1.09 1.17 1.28 17%
Source: Regional Economic Modeling Inc., Policy Insite+, Florida Counties, V1.7 (Build 3711)
MANUFACTURING ALONG THE I-75 CORRIDOR
Florida’s advanced manufacturing industries are diverse and include sectors producing intermediate and finished products ranging from plastics, motor vehicles, and of course medical devices. In total, Florida is home to over 18,200 manufacturers employing more than 317,000 workers. Manufacturing has the largest return on investment of all industries in Florida. Each dollar invested in manufactured goods creates an additional $1.43 of activity in other sectors. Manufacturing accounts for 85-90% of Florida’s annual exports. On average, Floridians employed in a manufacturing career earn at least $10,000 more than the average salary for all private sector jobs (rickscottforflorida.com).
This table shows the employment and average wage for the 10 largest manufacturing sectors in Florida:
Table 11. Top 10 Manufacturing Sectors in FloridaSector Employment Avg. Wage ($)
Aerospace Product and Parts 19,157 77,343Medical Equipment and Supplies 18,784 56,189Printing and Related Support Activities
17,598 38,878
Semiconductor and Electronic Components
15,947 76,878
Electronic Instruments 15,703 69,191Architectural and Structural Metals 12,153 38,679Cement and Concrete Products 10,857 45,239Plastics Products 9,173 39,976Other Miscellaneous Manufacturing 8,971 37,537Bakeries and Tortilla 8,169 31,197Source: Enterprise Florida
The table on the following page shows current and projected statistics for the manufacturing industry in the 12 counties that make up West Central Florida:
On average, Floridians employed in a manufacturing career earn at least $10,000 more than the average salary for all private sector jobs.- Source: Enterprise Florida
“ ”14I-75 Medical Manufacturing Coordidor
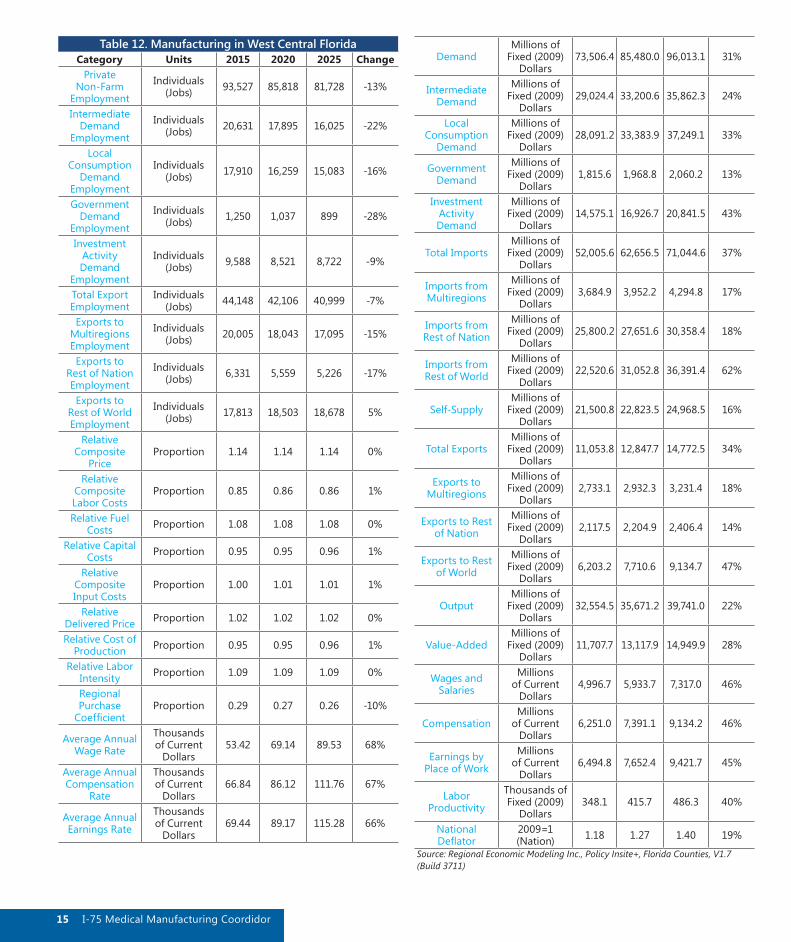
Table 12. Manufacturing in West Central FloridaCategory Units 2015 2020 2025 Change
Private Non-Farm
Employment
Individuals (Jobs) 93,527 85,818 81,728 -13%
Intermediate Demand
Employment
Individuals (Jobs) 20,631 17,895 16,025 -22%
Local Consumption
Demand Employment
Individuals (Jobs) 17,910 16,259 15,083 -16%
Government Demand
Employment
Individuals (Jobs) 1,250 1,037 899 -28%
Investment Activity Demand
Employment
Individuals (Jobs) 9,588 8,521 8,722 -9%
Total Export Employment
Individuals (Jobs) 44,148 42,106 40,999 -7%
Exports to Multiregions Employment
Individuals (Jobs) 20,005 18,043 17,095 -15%
Exports to Rest of Nation Employment
Individuals (Jobs) 6,331 5,559 5,226 -17%
Exports to Rest of World Employment
Individuals (Jobs) 17,813 18,503 18,678 5%
Relative Composite
PriceProportion 1.14 1.14 1.14 0%
Relative Composite Labor Costs
Proportion 0.85 0.86 0.86 1%
Relative Fuel Costs Proportion 1.08 1.08 1.08 0%
Relative Capital Costs Proportion 0.95 0.95 0.96 1%
Relative Composite Input Costs
Proportion 1.00 1.01 1.01 1%
Relative Delivered Price Proportion 1.02 1.02 1.02 0%
Relative Cost of Production Proportion 0.95 0.95 0.96 1%
Relative Labor Intensity Proportion 1.09 1.09 1.09 0%
Regional Purchase
CoefficientProportion 0.29 0.27 0.26 -10%
Average Annual Wage Rate
Thousands of Current
Dollars53.42 69.14 89.53 68%
Average Annual Compensation
Rate
Thousands of Current
Dollars66.84 86.12 111.76 67%
Average Annual Earnings Rate
Thousands of Current
Dollars69.44 89.17 115.28 66%
DemandMillions of
Fixed (2009) Dollars
73,506.4 85,480.0 96,013.1 31%
Intermediate Demand
Millions of Fixed (2009)
Dollars29,024.4 33,200.6 35,862.3 24%
Local Consumption
Demand
Millions of Fixed (2009)
Dollars28,091.2 33,383.9 37,249.1 33%
Government Demand
Millions of Fixed (2009)
Dollars1,815.6 1,968.8 2,060.2 13%
Investment Activity Demand
Millions of Fixed (2009)
Dollars14,575.1 16,926.7 20,841.5 43%
Total ImportsMillions of
Fixed (2009) Dollars
52,005.6 62,656.5 71,044.6 37%
Imports from Multiregions
Millions of Fixed (2009)
Dollars3,684.9 3,952.2 4,294.8 17%
Imports from Rest of Nation
Millions of Fixed (2009)
Dollars25,800.2 27,651.6 30,358.4 18%
Imports from Rest of World
Millions of Fixed (2009)
Dollars22,520.6 31,052.8 36,391.4 62%
Self-SupplyMillions of
Fixed (2009) Dollars
21,500.8 22,823.5 24,968.5 16%
Total ExportsMillions of
Fixed (2009) Dollars
11,053.8 12,847.7 14,772.5 34%
Exports to Multiregions
Millions of Fixed (2009)
Dollars2,733.1 2,932.3 3,231.4 18%
Exports to Rest of Nation
Millions of Fixed (2009)
Dollars2,117.5 2,204.9 2,406.4 14%
Exports to Rest of World
Millions of Fixed (2009)
Dollars6,203.2 7,710.6 9,134.7 47%
OutputMillions of
Fixed (2009) Dollars
32,554.5 35,671.2 39,741.0 22%
Value-AddedMillions of
Fixed (2009) Dollars
11,707.7 13,117.9 14,949.9 28%
Wages and Salaries
Millions of Current
Dollars4,996.7 5,933.7 7,317.0 46%
CompensationMillions
of Current Dollars
6,251.0 7,391.1 9,134.2 46%
Earnings by Place of Work
Millions of Current
Dollars6,494.8 7,652.4 9,421.7 45%
Labor Productivity
Thousands of Fixed (2009)
Dollars348.1 415.7 486.3 40%
National Deflator
2009=1 (Nation) 1.18 1.27 1.40 19%
Source: Regional Economic Modeling Inc., Policy Insite+, Florida Counties, V1.7 (Build 3711)
15 I-75 Medical Manufacturing Coordidor
IV. Gaps/Needs
WORKFORCE & TRAINING
CURRENT CAPABILITYIn a May 26, 2010 article “What Will Be the Hot Jobs of 2018”, the Wall Street Journal put biomedical engineering at the top of its list of “jobs of the future”. This ranking is consistent with the most recent predictions published by the US Labor Department that jobs in the field will grow by 62% from 2012 to 2020.
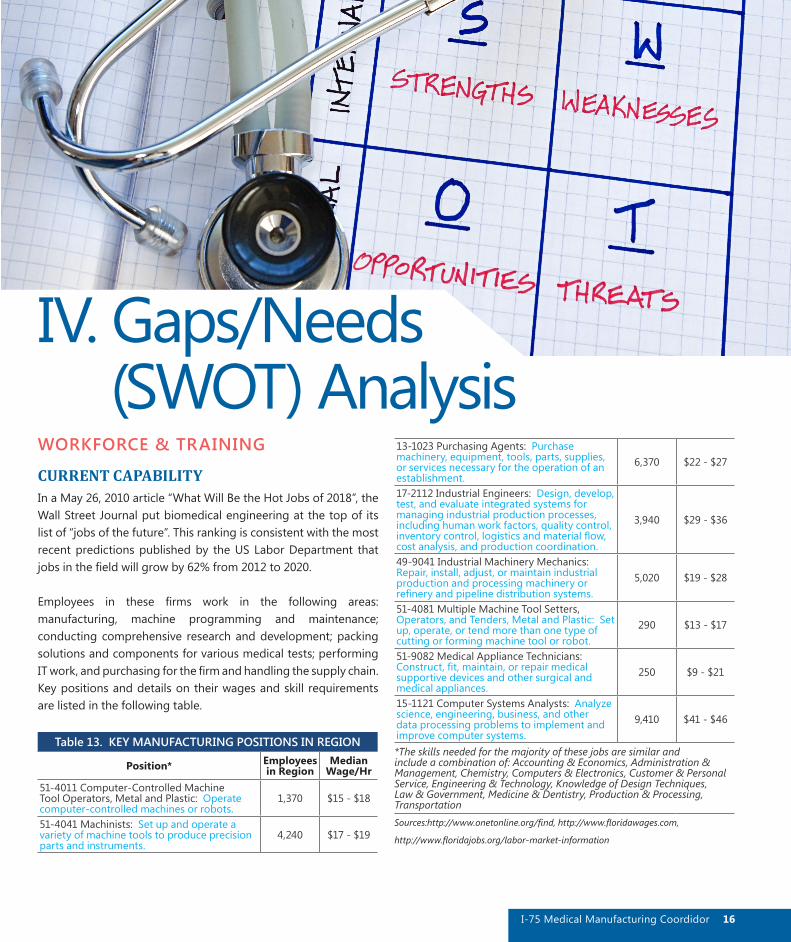
Employees in these firms work in the following areas: manufacturing, machine programming and maintenance; conducting comprehensive research and development; packing solutions and components for various medical tests; performing IT work, and purchasing for the firm and handling the supply chain. Key positions and details on their wages and skill requirements are listed in the following table.
Table 13. KEY MANUFACTURING POSITIONS IN REGION
Position* Employees in Region
Median Wage/Hr
51-4011 Computer-Controlled Machine Tool Operators, Metal and Plastic: Operate computer-controlled machines or robots.
1,370 $15 - $18
51-4041 Machinists: Set up and operate a variety of machine tools to produce precision parts and instruments.
4,240 $17 - $19
13-1023 Purchasing Agents: Purchase machinery, equipment, tools, parts, supplies, or services necessary for the operation of an establishment.
6,370 $22 - $27
17-2112 Industrial Engineers: Design, develop, test, and evaluate integrated systems for managing industrial production processes, including human work factors, quality control, inventory control, logistics and material flow, cost analysis, and production coordination.
3,940 $29 - $36
49-9041 Industrial Machinery Mechanics: Repair, install, adjust, or maintain industrial production and processing machinery or refinery and pipeline distribution systems.
5,020 $19 - $28
51-4081 Multiple Machine Tool Setters, Operators, and Tenders, Metal and Plastic: Set up, operate, or tend more than one type of cutting or forming machine tool or robot.
290 $13 - $17
51-9082 Medical Appliance Technicians: Construct, fit, maintain, or repair medical supportive devices and other surgical and medical appliances.
250 $9 - $21
15-1121 Computer Systems Analysts: Analyze science, engineering, business, and other data processing problems to implement and improve computer systems.
9,410 $41 - $46
*The skills needed for the majority of these jobs are similar and include a combination of: Accounting & Economics, Administration & Management, Chemistry, Computers & Electronics, Customer & Personal Service, Engineering & Technology, Knowledge of Design Techniques, Law & Government, Medicine & Dentistry, Production & Processing, TransportationSources:http://www.onetonline.org/find, http://www.floridawages.com,
http://www.floridajobs.org/labor-market-information
(SWOT) Analysis
16I-75 Medical Manufacturing Coordidor

CURRENT INSTITUTIONS FOR IMPROVING CAPABILITY• Florida Gulf Coast University (FGCU), University of South
Florida (USF), Florida International University (FIU) and University of Miami (UM) offer undergraduate programs in Biomedical Engineering with the latter three also offering graduate programs in the field as well. Bioengineers can work in the medical device and biotechnology industries, in healthcare and research, and for government agencies, such as the FDA. The Biomedical Engineering programs are accredited by the Engineering Accreditation Commission of ABET. (Additionally, both USF and UM have medical schools).
• The region is bolstered by eight State Colleges and multiple vocational schools in the area that also provide courses in related fields such as: machining, engineering technology, and computer systems.
• Another 24 private universities and colleges exist in the region in addition to the technical training institutions.
• Six Florida Workforce Development Boards in the region provide tools for training workers including paid internships, on-the-job training, and classroom training funds. Each works closely with local businesses to provide the training they need to attract employees and expand (such as local machining programs at vocational training schools).
• Some employers also offer their own programs, such as Arthrex (a local medical device manufacturer), which provides a four-year accredited manufacturing apprenticeship program to train CNC machine operators. The company provides internships, co-ops, and job shadowing opportunities.
An example of a collaborative group active in the region is the Manufacturing Talent Development Institute (Manufacturing TDI) offered through Polk State College. It is a public/private consortium of academic, workforce, economic development, & industry partners. The Consortium seeks to ensure that the knowledge, skills, and certifications of Florida’s manufacturing workforce are available and current. The Institute supports academic pathways for manufacturing through the development and support of accredited programs at secondary, postsecondary, and formal apprenticeship levels.
GAPS & PLANSTable 14. WORKFORCE & TRAINING SWOT ANALYSIS
Key Strengths Key Weaknesses• Strong partnership with
a variety of universities, colleges, and technical schools.
• Seven workforce development boards serving the area with funding available to develop specialized training programs if need is demonstrated. Many are already working with medical manufacturers to try to address their needs.
• Number of trainees is smaller than demand for workers.
• Lack of awareness of job potential in medical manufacturing field.
Key Opportunities Key Threats• Opportunity to expand
consortiums between businesses, post-secondary education institutions, and workforce development boards to continue to improve the type and number of locally trained employees.
• Completion of the Gateway Logistics and Manufacturing Training Center in Glades County offers potential to train more residents for jobs in manufacturing and logistics.
• Use of advanced technology requires greater training and skills.
• Training the wrong people for the jobs who do not complete the training or enter the field.
• Business demands change so rapidly that some educators have trouble adapting their curriculums to stay current.
PLANSSince having a trained, educated workforce is essential to growing and attracting businesses in these fields, IMMCI partners will focus heavily on this area. Fortunately, there are a wide variety of partners including employers, educational facilities, training providers, research institutions, economic development organizations, and others. To address this area, IMMCI partners will work on the following:
• Continue assessing the workforce needs of regional medical manufacturers and working with training partners to address those needs.
• Work with school districts to expand STEM-related programs and courses in the primary and secondary education levels, thereby increasing the number of local students entering these fields.
17 I-75 Medical Manufacturing Coordidor
SUPPLIER NETWORKS
CURRENT CAPABILITY & CURRENT INSTITUTIONSThe supplier network is a critical one for manufacturers since they must ensure the materials used in developing their end-products are safe and meet all state and federal regulations for such goods. Additionally, suppliers in the areas of machine tooling, equipment maintenance, refurbishment, component production and engineering are needed. The region has a number of manufacturing and trade associations, as well as small business development centers (SBDCs), which assist to a limited degree in these areas. These groups help businesses connect to provide services and supplies to manufacturers. Additionally, local economic development organizations and other local groups hold trade shows that help suppliers learn about and connect with possible local manufacturers that could use their products to manufacture their goods.
Another critical component is the availability of the materials and time and cost needed to transport them to the region if not made locally. Currently, a good portion of the raw materials needed for the products come from outside the region, but it is hoped that at least some of the suppliers can be relocated to the region in the future. Doing so would create jobs, reduce transportation costs for manufacturers, and reduce the environmental impact of transporting goods over longer distances.
One group that is working with manufacturers in this area is the Manufacturers Association of Florida. Created in 2006 to help improve Florida’s manufacturing climate, the organization not only helps with workforce training (as described in the previous section) but also helps in terms of advocacy and information sharing in all aspects of the manufacturing process. This includes sharing information related to suppliers and materials. The state also has a number of regional manufacturers associations.
There are also regional manufacturers associations such as the Southwest Regional Manufacturers Association (SRMA) and the Bay Area Manufacturers Association (BAMA) which has a similar role of bringing manufacturers together to share information and create a synergism that leads to an improvement in the business climate for all manufacturers. This synergistic effect saves manufacturers time and money through best practice understanding, advanced quality systems, and market development. Other regional manufacturers associations in the 13-county area include the South Florida and the Upper Tampa Bay Manufacturers Associations.
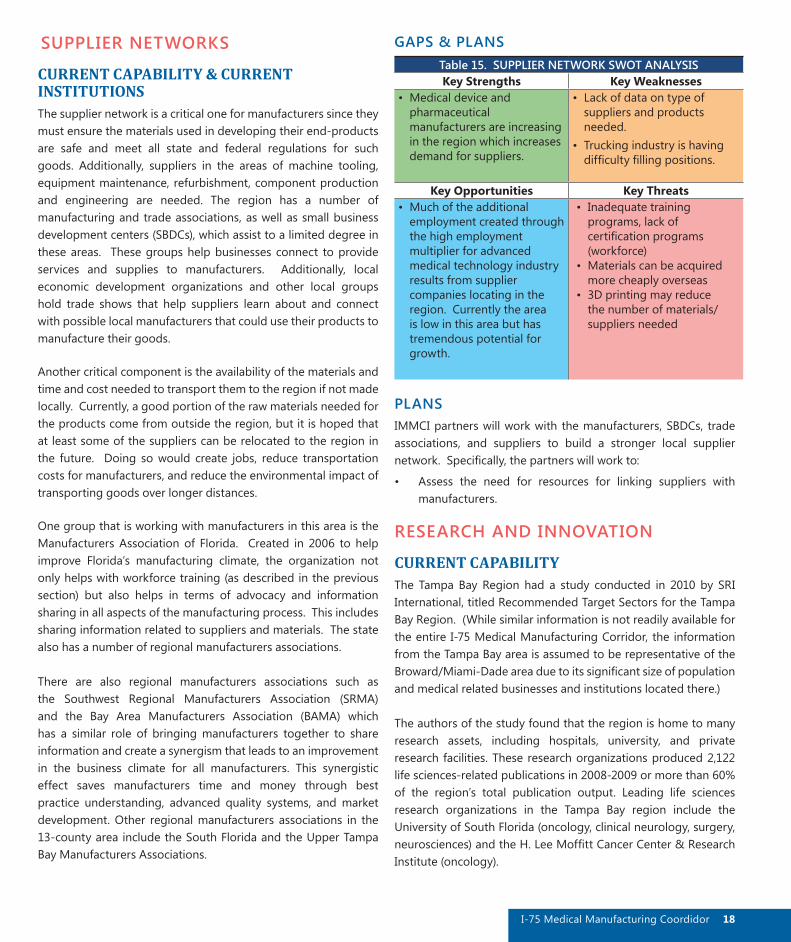
GAPS & PLANSTable 15. SUPPLIER NETWORK SWOT ANALYSISKey Strengths Key Weaknesses
• Medical device and pharmaceutical manufacturers are increasing in the region which increases demand for suppliers.
• Lack of data on type of suppliers and products needed.
• Trucking industry is having difficulty filling positions.
Key Opportunities Key Threats• Much of the additional
employment created through the high employment multiplier for advanced medical technology industry results from supplier companies locating in the region. Currently the area is low in this area but has tremendous potential for growth.
• Inadequate training programs, lack of certification programs (workforce)
• Materials can be acquired more cheaply overseas
• 3D printing may reduce the number of materials/suppliers needed
PLANSIMMCI partners will work with the manufacturers, SBDCs, trade associations, and suppliers to build a stronger local supplier network. Specifically, the partners will work to:
• Assess the need for resources for linking suppliers with manufacturers.
RESEARCH AND INNOVATION
CURRENT CAPABILITYThe Tampa Bay Region had a study conducted in 2010 by SRI International, titled Recommended Target Sectors for the Tampa Bay Region. (While similar information is not readily available for the entire I-75 Medical Manufacturing Corridor, the information from the Tampa Bay area is assumed to be representative of the Broward/Miami-Dade area due to its significant size of population and medical related businesses and institutions located there.)
The authors of the study found that the region is home to many research assets, including hospitals, university, and private research facilities. These research organizations produced 2,122 life sciences-related publications in 2008-2009 or more than 60% of the region’s total publication output. Leading life sciences research organizations in the Tampa Bay region include the University of South Florida (oncology, clinical neurology, surgery, neurosciences) and the H. Lee Moffitt Cancer Center & Research Institute (oncology).
18I-75 Medical Manufacturing Coordidor

The same study found that the Tampa Bay region is state leader in Life Sciences & Medical Services patenting activity. In 2008-2009, 227 life sciences-related patents were granted to Tampa Bay region inventors or assignees representing 44% of all life sciences patents awarded in the state during that period. University of South Florida was the leading regional organization in terms of patent activity, with a strong focus on “bio-affecting and body treating compounds” (drugs) and molecular and microbiology. The Orthopedic Development Corporation was another leading organization, producing several surgical toll-related patents.
The U.S. federal government finances close to one-third of the total R&D conducted in the country, through federal laboratories and through contracts and grants to a variety of academic, research, and business institutions. The above study found that in 2007, the University of South Florida accounted for 98% of federal science and engineering (S&E) support to universities in the Tampa Bay region, with $108 million of federal R&D support in that year.
Non-profit research organizations can also be significant beneficiaries of federal research dollars. In the Tampa Bay Region, the H. Lee Moffitt Cancer Center & Research Institute and the Jaeb Center for Health Research were the largest non-university non-profit recipients of federal R&D support in the Tampa Bay region for 2007.
Overall, the Tampa Bay region’s nonprofits received $46.2 million in federal science and engineering R&D support in 2007. This represents nearly 74% of the total funding received by nonprofits throughout the State of Florida in that year; the H. Lee Moffitt Cancer Center alone accounted for over half of the entire statewide funding.
The Small Business Innovative Research (SBIR) and Small Business Technology Transfer (STTR) awards are important federal government programs that provide funding for innovation and technology transfer and help small businesses tap into federal R&D funding resources. Administered through eleven federal agencies, SBIR provides competitive grants to entrepreneurs seeking to conduct “Phase I” research to test the technical merit and feasibility of their ideas, as well as “Phase II” prototype development to build upon initial findings. The STTR award program is similar to SBIR, but its focus is on technology transfer from nonprofit research institutions to small businesses. The STTR program was established specifically to fund cooperative research projects involving a small business and a nonprofit research institution, helping to bring ideas from the laboratory to the marketplace.
In the five-year period of 2005-2009, Tampa Bay region firms were awarded 77 SBIR and STTR awards totaling more than $28 million in research funding. SBIR/STTR activity was heavily concentrated in Pinellas County, particularly in St. Petersburg and Pinellas Park. The City of Tampa was also home to a significant level of SBIR/STTR activity.
CURRENT INSTITUTIONSSome of the region’s major research centers and research-oriented companies (as measured by publishing and patenting data) are in the Life Sciences & Medical Services cluster. Medical research in the region focuses on a broad range of topics, such as:
• Cancer (e.g., H. Lee Moffitt Cancer Center & Research Institute – which is 31st among National Cancer Institute grantees, Dattoli Cancer Center, and the Watson Clinic).
• Neurodegenerative disorders, such as Alzheimer’s and Parkinson’s (for instance, the Roskamp Institute, USF Center of Excellence for Aging & Brain Repair, USF Health Byrd Alzheimer’s Institute, and USF Suncoast Alzheimer’s & Gerontology Center).
• Diseases or conditions associated with aging (e.g., USF Center for Hospice, Palliative Care, & End-of-Life and USF Center of Excellence for Aging & Brain Repair).
• Orthopedics (for example, Florida Orthopedic Institute, Sarasota Memorial Healthcare System, Clinical Research Center, and the Southeast Spine Center and Research Institute).
• Diabetes (e.g., USF Diabetes Center and the Jaeb Center for Health Research).
• Eye and ear conditions (such as the Jaeb Center for Health Research, the Silverstein Institute, and the Center for Retina and Macular Disease).
Additionally, Miami is home to the second largest medical district in the U.S. The 250,000 square-foot University of Miami Life Science Technology Park covers 68 acres of what was formerly a brownfields site. The Park is located among six hospitals with over 3,500 beds, and contains the nation’s largest tissue bank. The district employs as many as 100,000 people, though not all in high-paying jobs. Miami’s Life Science Technology Park is 75 percent leased. Its tenants are a mix of university research facilities and medical companies at different stages sharing labs and expensive glass-wash equipment. The space, anchored by the University of Miami’s 80,000-square-foot tissue bank, is becoming a center for commercial biomedicine, a growth area in Miami.
19 I-75 Medical Manufacturing Coordidor

Located in the park is the University of Miami’s Leonard M. Miller School of Medicine which annually receives approximately $260 million from public and private agencies to conduct a broad spectrum of nationally and internationally recognized research, build state-of-the-art facilities, and support graduate students and postdoctoral trainees. Engaging in more than 2,000 ongoing projects, the researchers are working on diseases like diabetes, cancer, cardiovascular disease, stroke, autism, Alzheimer’s, and obesity. In addition to their research activities, many regional institutions also perform clinical trials or provide outpatient care and treatment in their areas of specialization, thereby increasing the local demand for medical devices, equipment and pharmaceuticals.
Florida Gulf Coast University (FGCU) is also in the process of building and further developing its Emergent Technology Institute (ETI) at Innovation in Lee County near the University adjacent to the SWFL International Airport. With a plan of becoming a research and development park for companies in the areas of renewable energy and sustainability, the ETI also offers the potential for other manufacturing research opportunities, some of which could include working with 3D printing.
FGCU also is seeking to develop a mobile medical POD that could respond to people needing acute/trauma medical care as a result of natural disasters (e.g., hurricanes or floods). The POD would be self-contained mobile vehicle that could relocate as needed to serve affected populations.
GAPS & PLANSThe current gaps in the research and innovation area include a lack of communication and sharing of information. Research is currently occurring independently with limited collaboration which could generate results and new products more rapidly.
Additionally, groups have expressed frustration with the lack of assistance available to help students or entrepreneurs get their new products to market. An incubator facility that includes this service could assist with this issue. Alternatively, support from the Accelerator Program or the Regional Innovation Clusters Program through the Small Business Administration would be beneficial.
Table 16. RESEARCH & INNOVATION SWOT ANALYSISKey Strengths Key Weaknesses
• The region includes institutions that are strong in research.
• Universities are involved in the IMCP Initiative and interested in expanding research initiatives.
• Lack of assistance to help students or young businesses get their ideas to market.
• Limited collaboration between businesses and universities.
Key Opportunities Key Threats• Florida Gulf Coast University
(FGCU)’s new Emergent Technology Institute offers great potential for new research opportunities.
• Expand number of high-quality pre-clinical and clinical trials in the region.
• Competition from other areas of the country/other universities seeking to expand in the same field.
Through this effort, IMMCI partners will facilitate efforts to increase partnerships among the region’s scientific and business communities to encourage ground-breaking, collaborative research and innovative product/service development. Additionally, the partners will work to expand the number of high-quality, competitively-priced pre-clinical/clinical trials within the region, in order to build a regional reputation that will attract researchers, companies, and patients for the region’s state-of-the-art clinical research capabilities. This will involve several activities:
• Continue building tools to promote the area for clinical trials.
• Develop new opportunities to help share information and encourage research collaboration among businesses, universities, research centers, and other key partners to fuel innovation.
• Explore opportunities to develop or expand new research facilities and make them available to newly forming businesses as well as established ones.
INFRASTRUCTURE/SITE DEVELOPMENT
CURRENT CAPABILITY & CURRENT INSTITUTIONSFreight and logistics are the backbone of a successful manufacturing market. IMMCI is supported by roadways, trains, airports, and ports. The areas that make up the IMMCI are linked by I-75, US 27, and I-95. Six major airports located in Tampa, St. Petersburg, Sarasota, Fort Myers, Miami and Fort Lauderdale
20I-75 Medical Manufacturing Coordidor

handle most of the passenger and cargo operations and are supported by 10 general aviation facilities. One proposed strategy is the completion of the Gateway Logistics and Manufacturing Training Center in Glades County which will help facilitate the distribution of goods going through Florida’s airports and ports. Another involves development of the Airglades Industrial Park and Airport in Hendry County as an alternative destination for airport cargo headed for the heavily-used Miami or Fort Lauderdale airports.
South Florida is at the southern tip of the United States and its proximity to South America provides an advantage for exporting. The major seaports on the Southeast coast of Florida are Port Miami known as the cargo gateway of the Americas and Port Everglades located in Fort Lauderdale, which is a leading U.S. container port. In addition, the Port of Manatee is the closest deep-water seaport to the Panama Canal and Port Tampa Bay is Florida’s largest cargo tonnage port.
The tables below show tonnage by airport and port in the I-75 Medical Manufacturing Corridor. Together, the airports in the I-75 Medical Manufacturing Corridor handle 89% of the state’s air cargo and the ports handle 70% of the state’s ship cargo.
Table 17. Airport Cargo (Tons)Facility 2010 2011 2012 2013 2014Miami
International Airport
2,024,032 2,030,793 2,127,772 2,144,445 2,203,726
Fort Lauderdale-Hollywood
International Airport
98,088 96,187 97,059 84,132 85,945
Tampa International
Airport96,450 96,550 94,250 94,550 91,450
Southwest Florida
International Airport
17,084 16,270 16,915 16,078 16,735
Source: Individual Airports.
Table 18. Seaport Cargo (Tons)Facility 2010 2011 2012 2013 2014
Port Miami 7,389,165 8,222,374 8,108,450 7,980,527 N/APort
Everglades 22,452,473 22,116,275 22,087,515 21,640,144 N/A
Port Tampa Bay 36,955,699 34,262,712 33,907,564 34,968,421 36,217,443
Port Manatee 3,370,000 2,689,000 2,288,000 2,648,000 2,028,000Source: Individual Seaports.
Currently, 90% of the goods that come to Florida arrive by water. With the on-going expansion of the Panama Canal allowing for larger container ships, Florida ports are making improvements to handle the increased number of containers they will be receiving. For example, Port Tampa Bay is spending $20.8 million on container yard improvements while the Port Miami Expansion and Improvements will run $2 billion including a $1 billion tunnel that will double truck capacity to and from the port by avoiding downtown traffic. Both ports have also purchased larger cranes needed to unload containers from the larger ships.
Three major rail lines, the FEC, CSX and SGLR traverse IMMCI. The FEC is a Class II regional railroad operating between Jacksonville and Miami. The IRIS NE Connection will tie the FEC and the South Florida Rail Corridor railways in Miami-Dade County to accommodate existing and projected freight movement. CSXT is a Class I railroad operating the most extensive rail network in Florida. CSXT serves most of the State’s major urban areas and the seaports of Port of Tampa and Port of Jacksonville. The Seminole Gulf Railway (SGLR) is a Class III railroad with two lines in Southwestern Florida: The Fort Myers Line between Arcadia and Vanderbilt Beach and the Sarasota Line between Oneco and Venice.
Another critical form of infrastructure involves technology. Recently, broadband infrastructure has emerged as one of the primary forces driving economic development. With the rise of the global digital marketplace and the increasing availability of broadband, the importance of having scalable, high-speed broadband networks is critical to a region’s long term economic sustainability. In order to ensure that South Florida and its businesses, organizations, and residents are not left out of this new digital opportunity, community leaders need to identify and enhance the regional broadband infrastructures to bring value to the community and ensure the region is able to compete on a global scale.
Some areas of the region also lack basic items sought by new businesses. For example, some counties, such as Pinellas, have a shortage of shovel-ready parcels that are both well situated and sized for new manufacturing businesses. Vacant, underutilized, and underperforming parcels designated as Brownfield Areas or Sites provide a unique opportunity to locate Medical Manufacturing and related facilities. EPA and the Florida Department of Environmental Protection support and advocate the redevelopment of “Brownfields to Health Fields.” Local economic development organizations are continuing to address these needs on an individual basis.
21 I-75 Medical Manufacturing Coordidor

GAPS & PLANSTable 19. INFRASTRUCTURE/SITE DEVELOPMENT SWOT
ANALYSISKey Strengths Key Weaknesses
• The region is well served by airports, ports, rail and highways for the movement of goods.
• Three-phase power is not always available for key manufacturing sites requiring more expensive alternatives.
• Broadband is not readily available in all locations.
• Some businesses have difficulty working with local governments.
Key Opportunities Key Threats• Ideal location for exporting
goods to Central and South America.
• Expansion of Panama Canal and IMMCI ports will make importing and exporting easier and more cost effective.
• The Gateway Logistics and Manufacturing Training Center will assist with freight movement.
• Brownfield sites can be revitalized using EPA funds to provide shovel-ready sites for new or expanding manufacturers.
• Competition from other communities that provide more shovel-ready sites with good infrastructure.
The IMMCI partners, along with the local Metropolitan Planning Organizations (MPOs) which handle the majority of the transportation planning and funding initiatives in the area, will be active participants in the development and implementation of the above plans to address critical transportation needs in the region as they relate to the mobility of goods.
TRADE AND INTERNATIONAL INVESTMENT
CURRENT CAPABILITY & CURRENT INSTITUTIONSOne example of the many companies in the I-75 Medical Manufacturing Corridor that are exporting is Arthrex, Inc. The company manufactures more than 8,000 medical devices, has 1,900 employees in Southwest Florida, exports to more
than 100 countries, and has reported annual revenue of $1.2 billion. The corporate headquarters is in Naples, Florida, and the global logistics center is located in Fort Myers, Florida, near the international airport (Workforce Now: A Regional Research Initiative, 2013, by staff of Florida Gulf Coast University, Edison State College, and Hodges University.)
The region has many other companies that are exporting their products outside the United States. One tool to help them is the Foreign Trade Zone which fosters a business environment for companies to receive, store and distribute products duty-free. Having the ability to defer, reduce or eliminate customs costs lowers costs and allows business to be more competitive globally. FTZ’s also provide domestic benefits for “maintaining large dollar value inventories subject to State and local ad valorem taxes.” (Port Miami, Foreign Trade Zone About)
To help businesses with exporting, many economic development organizations in the region, have recently started using the U.S. Department of Commerce’s Federal Gold Key Services. This program offers an efficient way to meet pre-screened potential international business partners, whether the company is seeking an agent, a distributor or a joint-venture partner. Individual meetings are arranged with most taking place at the U.S. Embassy in the host country.
Additionally, the state’s economic development office, Enterprise Florida, has International Trade Offices throughout the state, two of which are located in the I-75 Medical Manufacturing Corridor (Miami and Tampa). Their services include helping a company determine its readiness for international trade and its target markets for its products or services, assisting with market research and information on channels of distribution in target markets, and introductions to one or more of Enterprise Florida’s 13 International Offices.
GAPS & PLANSAs stated earlier, the medical instrument & supplies manufacturing field had $89.4 billion in U.S. revenues in 2010, yet globally, medical device revenues in 2008 were estimated at $336 billion. The global market is currently dominated by U.S. based companies, but many US companies have not fully exploited opportunities that lie outside the borders of the United States.
22I-75 Medical Manufacturing Coordidor

Table 20. TRADE & INTERNATIONAL INVESTMENT SWOT ANALYSIS
Key Strengths Key Weaknesses• Location is ideal for
exporting.• Infrastructure for exporting
expanding is strong and expanding.
• Local companies new to exporting often need help getting started and need more customized support.
Key Opportunities Key Threats• Two of Enterprise Florida’s
International Trade Offices are located in the region.
• IMMCI faces competition from other areas that may be able to produce products cheaper.
Through this initiative, IMMCI partners seek to increase the export of goods. Specific activities include:• Connecting local businesses with services offered by local
and state organizations to help increase export activity.
• Continue to work with local economic development organizations, Enterprise Florida, and Department of Commerce to attend international trade shows and/or trade missions to introduce local businesses to new markets and to attract foreign companies to south Florida.
OPERATIONAL IMPROVEMENT AND CAPITAL ACCESS
CURRENT CAPABILITY & CURRENT INSTITUTIONSThe state of Florida and the local communities offer a number of programs to help businesses in the area of capital and/or property tax exemptions. Some of the programs offered through Enterprise Florida at the state level and the local economic development organizations include: the Qualified Target Industry Tax Refund, Capital Investment Tax Credit, High Impact Performance Incentive Grant, Economic Development Transportation Fund, Rural & Urban Incentives, Enterprise Zone Incentives, Brownfield Incentives and Local Government Distressed Area Matching Grant Program.
Two other local forms of local capital assistance include Industrial Development Revenue Bonds (IDRBs) and Growth Capital Funds. The IDRBs are tax-exempt bonds to help businesses finance facility construction and related costs at an interest rate typically two or three percent below conventional financing rates.
The other source is Growth Capital Funds, one of which is the Tamiami Angel Fund I, LLC (“TAFI” or “the Fund”). TAFI, Southwest Florida’s first Angel Fund, is a formal fund of growth capital organized to invest in Florida-based early stage through expansion stage companies. A similar fund is Fusion Pointe, anonprofit venture development organization based in Southwest Florida, focused on dramatically increasing the number of high quality, investment-ready companies in Southwest Florida. The state offers the Florida Venture Capital Program to provide funding to emerging Florida companies (or companies locating in Florida) with perceived long-term growth potential.
Additionally, there are a number of incubator and small business development programs in the region that help primarily new businesses form and get established. They are, however, a viable resource for all businesses and an excellent opportunity to share information on resources, best practices, and other beneficial tools.
GAPS & PLANSDespite the above programs, many businesses still face challenges in accessing much needed capital to either get started or to expand their operations and/or facilities. Funding through lenders remains tight and difficult to obtain. Additionally, the sharing of information on best practices and innovation is done in a limited fashion.
Table 21. OPERATIONAL IMPROVEMENT & CAPITAL ACCESS SWOT ANALYSIS
Key Strengths Key Weaknesses• Florida and local
governments offer a variety of incentive programs for larger businesses seeking to locate or expand in Florida.
• Resources for small, new businesses are extremely limited.
Key Opportunities Key Threats• Opportunity exists to create a
specialized growth or venture capital fund that would assist businesses involved in medical manufacturing.
• Stricter lending practices and requirements have reduced access to capital.
23 I-75 Medical Manufacturing Coordidor
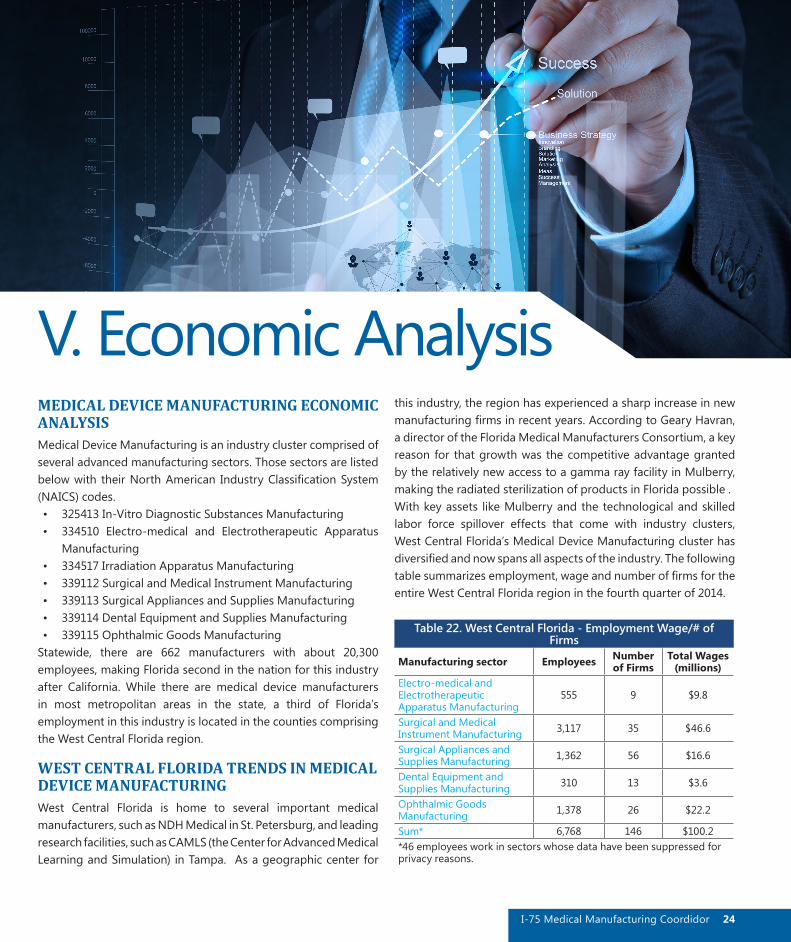
V. Economic AnalysisMEDICAL DEVICE MANUFACTURING ECONOMIC ANALYSISMedical Device Manufacturing is an industry cluster comprised of several advanced manufacturing sectors. Those sectors are listed below with their North American Industry Classification System (NAICS) codes. • 325413 In-Vitro Diagnostic Substances Manufacturing• 334510 Electro-medical and Electrotherapeutic Apparatus
Manufacturing• 334517 Irradiation Apparatus Manufacturing• 339112 Surgical and Medical Instrument Manufacturing• 339113 Surgical Appliances and Supplies Manufacturing• 339114 Dental Equipment and Supplies Manufacturing• 339115 Ophthalmic Goods Manufacturing
Statewide, there are 662 manufacturers with about 20,300 employees, making Florida second in the nation for this industry after California. While there are medical device manufacturers in most metropolitan areas in the state, a third of Florida’s employment in this industry is located in the counties comprising the West Central Florida region.
WEST CENTRAL FLORIDA TRENDS IN MEDICAL DEVICE MANUFACTURINGWest Central Florida is home to several important medical manufacturers, such as NDH Medical in St. Petersburg, and leading research facilities, such as CAMLS (the Center for Advanced Medical Learning and Simulation) in Tampa. As a geographic center for
this industry, the region has experienced a sharp increase in new manufacturing firms in recent years. According to Geary Havran, a director of the Florida Medical Manufacturers Consortium, a key reason for that growth was the competitive advantage granted by the relatively new access to a gamma ray facility in Mulberry, making the radiated sterilization of products in Florida possible . With key assets like Mulberry and the technological and skilled labor force spillover effects that come with industry clusters, West Central Florida’s Medical Device Manufacturing cluster has diversified and now spans all aspects of the industry. The following table summarizes employment, wage and number of firms for the entire West Central Florida region in the fourth quarter of 2014.
Table 22. West Central Florida - Employment Wage/# of Firms
Manufacturing sector Employees Number of Firms
Total Wages (millions)
Electro-medical and Electrotherapeutic Apparatus Manufacturing
555 9 $9.8
Surgical and Medical Instrument Manufacturing 3,117 35 $46.6
Surgical Appliances and Supplies Manufacturing 1,362 56 $16.6
Dental Equipment and Supplies Manufacturing 310 13 $3.6
Ophthalmic Goods Manufacturing 1,378 26 $22.2
Sum* 6,768 146 $100.2*46 employees work in sectors whose data have been suppressed for privacy reasons.
24I-75 Medical Manufacturing Coordidor

EMPLOYMENT TREND: a slow recovery since 2008Even though Medical Device Manufacturing is one of West Central Florida’s most innovative and important industries, employment has only averaged 6,292 employees per year since 2004. As with most industries, employment dropped sharply with the Great Recession between 2008 and 2010, losing a thousand jobs out of a total of 6,816 employees. Statewide, employment dropped by another 1,488 jobs in the same period and statewide employment in the industry is still lagging its high water mark in 2008. As the chart below depicts, employment growth has been steady since 2010 but has not yet reached 2008’s high.
WAGE TREND: Consistent growth over average wage changesWages in medical device manufacturing have been consistently higher than the average regional wage for all industries in each year since 2004, varying between 150 percent and 170 percent of the average regional wage. Indeed, as the following chart depicts, medical device wages remained high and even increased during the Recession, while the average regional wage stagnated. Since 2010, medical device wages have consistently been at least 170 percent of the average regional wage.
FIRMS AND EMPLOYMENT PER FIRM: More firms, but leaner staffingBetween the 2008 recession and 2010, the number of firms in medical manufacturing decreased slightly—from 122 to 117. As of Q4 2014, there are 146 manufacturers, the largest number ever. Per firm employment, however, clearly shows a long term trend to smaller staffing.
25 I-75 Medical Manufacturing Coordidor

THE INVERTED RELATIONSHIP BETWEEN WAGES AND FIRM SIZE: Efficiency gains?When firms gain efficiencies they often shed employment and retain staff with higher wages. In our region wages have increased over the past ten years by 12 percent while average firm size has decreased from 56 in 2006 to 46 employees to 2014, or a 19 percent drop. A simple Pearson’s R correlation analysis between firm size and wages produces a correlation of -.96, confirming that there is a seesaw relationship between the two variables. However, a follow up analysis of employment and wage data using linear regression failed to show a clear dependent relationship of firm size on wages. Consequently, there may be other reasons for this observation than any causal link between rising wages and falling employment.
GEOGRAPHIC EMPLOYMENT CONCENTRATION TREND: Spreading across West FloridaMedical Device manufacturing has become more geographically diverse since 2004, when over 74 percent of all jobs were in Pinellas, and Sarasota, Hillsborough and Manatee counties had respectively 6, 7 and 8 percent of the employment. By 2014, Pinellas’ share of all jobs had slipped to 46 percent, while Collier, Hillsborough, and Manatee counties held 16, 18 and 10 percent of the jobs respectively.
The following table presents the Q4 2014 distribution of firms and total wages by county within the West Central Florida region.
Table. 23Row Labels Total Employment Total Wages (Mil $)
Charlotte 1 Suppressed
Citrus 4 Suppressed
Collier 1,092 14.4
Hernando 13 Suppressed
Hillsborough 1,236 21.9
Lee 117 16.5
Manatee 655 77.5
Pasco 56 82.3
Pinellas 3,137 45.8
Sarasota 457 76.0
Grand Total 6768 100.2
While the 2008 recession removed a small number of firms, more jobs were lost by firm layoffs. Unless new firms invest in the region there is unlikely to be substantial job growth beyond manpower
replacement or substantial increase in demand for products made in the region, given the relatively low average firm size.
ECONOMIC IMPACTSWhile employment in medical device manufacturing is substantial, its total economic impact on the greater region and the entire state of Florida is significantly more than its direct employment. Using a counterfactual analysis method in REMI PI+, we calculated the economic impact of medical device manufacturing on both the West Central Florida economy and the state economy. As shown in the table below, the total statewide employment impacts of West Central medical device manufacturing exceed twenty-one thousand. The industry also produces two billion dollars in Gross State Product and over a billion dollars in personal income.
Table. 24West Central Florida Florida
Medical Device Employment
6,768 ---
Indirect Employment 12,463 14,616Total Employment 19,231 21,384Gross Regional/State Product ($ M)
1,848 2,022
Personal Income ($ M) 1,059 1,171
The following pie-chart depicts the share of indirect jobs by industry generated by medical device manufacturing. For example, for every 100 jobs created in medical device manufacturing, 9 jobs are created in education and health services and 16 jobs are created in professional services and information.
Indirect Jobs by Industry

Table. #CONCLUSIONSMedical Device manufacturing is growing in West Central Florida, with nearly half of all related employment in the manufacture of surgical and medical instruments. Not only is employment growing, but there are more firms in the industry than ever before and wages easily exceed the state’s Qualified Tax Incentive requirements for wages of 115 percent of the prevailing state or regional wage. While manufacturers have left some areas there are more firms in more counties of the region than ever before. However, even as the number of firms has reached an all-time high, employment per firm is not especially high—about 46 per firm currently—and the average per firm employment has shrunk in recent years.
Nevertheless, economic development officials continue to cultivate medical device manufacturing in the state. In 2013, the state legislature provided a sales tax exemption on manufacturing equipment. In 2013, industry leaders were pursuing an initiative with the federal government to end a 2.3 excise tax on medical devices2. While it is not directly related, there are concurrent efforts to spur the development of medical tourism in the Tampa Bay area, the heart of the state’s medical device manufacturing industry. Those efforts will also include integration with sports and human performance and medical training. As regional efforts to develop the region’s medical tourism industry coalesce, an increase in local medical meetings may help showcase the region’s medical device manufacturing capabilities as well.
i “Momentum builds for Florida’s medical device makers.” Robert Trigaux. Tampa Bay Times. May 4, 2013.
ii Ibid.
Á Advanced Manufacturing for Florida’s future: Permanently eliminating the manufacturing sales tax, that is otherwise set to expire in 2017, will ensure manufacturing remains a stable and growing pillar of Florida’s economy. ÁManufacturing has the largest return on investment of all industries in Florida. Each dollar invested in manufactured goods creates $1.43 of activity in other sectors ÁManufacturing accounts for 85-90% of Florida’s exports
- Source: Enterprise Florida
There are more than 6,500 medical device companies in the US, more than 80% of medical device companies have fewer than 50 employees and many have little or no sales revenue - Source: selectusa.commerce.gov
“
27 I-75 Medical Manufacturing Coordidor

VI. Strategy
Table 25. Strategy Recommendations
Strategy Metrics Timescale of Metrics & Frequency of Updates Data Sources
Workforce & TrainingStrategy 1: Form consortiums to bring businesses, educators, workforce development boards, and others together to address workforce development needs and adapt curriculums quickly as business needs change.
• Number of new training programs created or modified to meet business needs.
• Number of people trained and hired under new programs.
• Average wage of new-hires.
Metric is on-going/long-term.Frequency:• Complete Coalition formation by
December 2016.• Provide assessments annually on
trainees, new hires, and wages.
• Data collected by workforce trainers and Workforce Development Boards.
Strategy 2: Increase marketing of training and jobs for manufacturing businesses to increase number of trainees and job applicants.
• Percent increase in trainees in programs and in applicants for manufacturing jobs.
Metric is short term.Frequency:• Bi-annual assessments for first
three years. Re-assess after three years to determine need to continue.
• Data collected by workforce trainers and Workforce Development Boards.
Strategy 3: Complete Gateway Logistics & Manufacturing Center in Glades County to expand training programs and distribution networks.
• Completion of facility. • Number of students trained and
placed in jobs.• Average wage of new-hires.• Number of new distribution
businesses located there.• Amount of private investment by
businesses.
Metric includes short-term (facility completion) and long-term (business attraction).Frequency:• Complete facility by December
2018 with annual updates on progress.
• Continue attracting new businesses for next 5-10 years with annual updates on progress, job creation, and private investment.
• Data collected by Glades County, Glades County EDC, and facility operators.
• Data collected by workforce trainers and Workforce Development Boards.
Strategy 4: Encourage focused development in Hillsborough County’s Economic Development Areas
• The Hillsborough Planning Commission identified 9 potential areas for five fields—two of which (biotechnology and medical devices, and medicine and medical management are especially relevant)
• Metric is ongoing and based on build out of EDA sites.
• Data collected by Hillsborough County
Strategy 5: Encourage development of Pinellas County’s Airco site with a medical manufacturing park
• Completion of facility. • Recruitment of firms.• Average wage of new-hires.• Number of new distribution
businesses located there.• Amount of private investment by
businesses.
• Metric includes short-term (facility completion) and long-term (business attraction).
• Data collected by Pinellas County, and facility operators.
• Data collected by workforce trainers and Workforce Development Boards.
Recommendations
28I-75 Medical Manufacturing Coordidor

Strategy Metrics Timescale of Metrics & Frequency of Updates Data Sources
Supplier NetworkStrategy 6: Conduct interviews of 20-40 local medical manufacturing firms to identify specific needs. Based on interviews set self-supply benchmarks for region.
• Number of interviews completed and needs identified.
• Number of programs created or amended to address identified needs.
• Self-supply benchmarks.
Metric is short-term with periodic updates.Frequency:• Surveys completed by December
2016 and updated every 2-3 years thereafter.
• Annual measurement against self-supply benchmarks.
• Data collected by RPCs as they compile data from the surveys.
• Data compiled by RPCs, local economic development organizations, and local manufacturing businesses.
Research & InnovationStrategy 7: Assist Florida Gulf Coast University with development of its Emergent Technologies Institute for the development of new technologies for manufacturing.
• Number of new start-ups created and/or new marketable technologies developed.
• Number of high-paying jobs created.
• Amount of private investment.
Metric is mid-term for completion of facility and then on-going.Frequency:• Completion of facility with annual
updates on progress.• Annual assessments regarding
start-ups, new technologies, number of jobs created, and private investment.
• Data collected by FGCU for all metrics.
Strategy 8: Work with CAMLS and University of South Florida to identify new initiatives to help medical manufacturing grow
• Number of new studies• Number of new jobs created• Amount of private investment
• Metric is long term for development of multiple initiatives
• Data collected by CAMLS, USF and other partners
Strategy 9: Investigate the Return on Investment for developing a Public-Private Partnership for medical tourism.
• Increase in medical tourism in area.
• Amount of private investment by health care groups for clinical trials.
Metric is short-term (plan development) then on-going (marketing).Frequency:• Annual assessments regarding
plan development and implementation.
• Annual assessments on increase in clinical trials, medical tourism, and private investment.
• Data collected by sources that track clinical trials by area.
• Data collected by clinical trial providers.
• Surveys conducted related to medical tourism.
Infrastructure/Site DevelopmentStrategy 10: Improvements to I-275 in Tampa area and to I-75 in Sarasota Manatee to improve flow of traffic and goods.
• Reduced congestion in each area. Metric is mid-term.Frequency:• Annual updates on construction
progress.• Once facility opens, annual
monitoring of traffic flow through newly improved areas.
• Data from Florida Department of Transportation (FDOT) and Tampa Bay Area Regional Transportation Authority (TBARTA)
Trade/International Investment & Operational Improvement/Capital AccessStrategy 11: Increase promotion of local resources such as venture capital funds and small business development centers to new and existing businesses to help them form and grow.
• Increase in use of services. • Increase in number of new
businesses created.
Metric is on-going.Frequency: • Annual assessments to determine
increase over baseline data.
• Data collected by venture capital funds, small business development centers and other groups with resources to grow businesses.
29 I-75 Medical Manufacturing Coordidor

VII. AppendixTable. #
SAMPLE WEB SURVEY
30I-75 Medical Manufacturing Coordidor

SAMPLE WEB SURVEY CONTINUED
31 I-75 Medical Manufacturing Coordidor
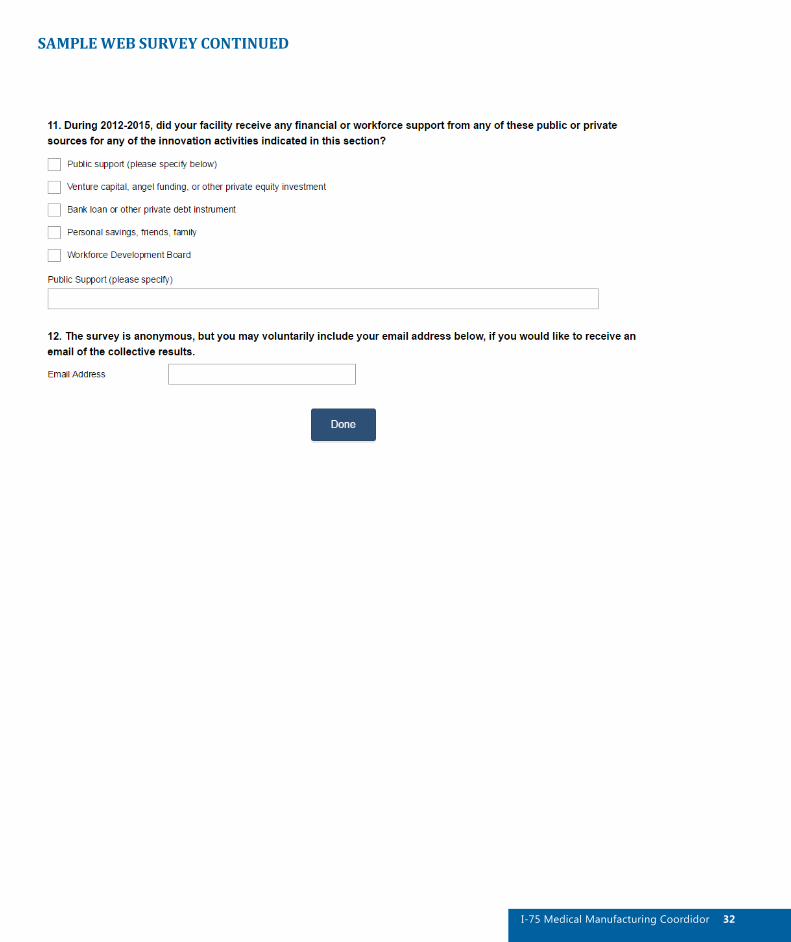
SAMPLE WEB SURVEY CONTINUED
32I-75 Medical Manufacturing Coordidor

SURVEY RESULTS
Q1.
Q2.
33 I-75 Medical Manufacturing Coordidor

SURVEY RESULTS CONTINUED
Q3.
Q4.
34I-75 Medical Manufacturing Coordidor
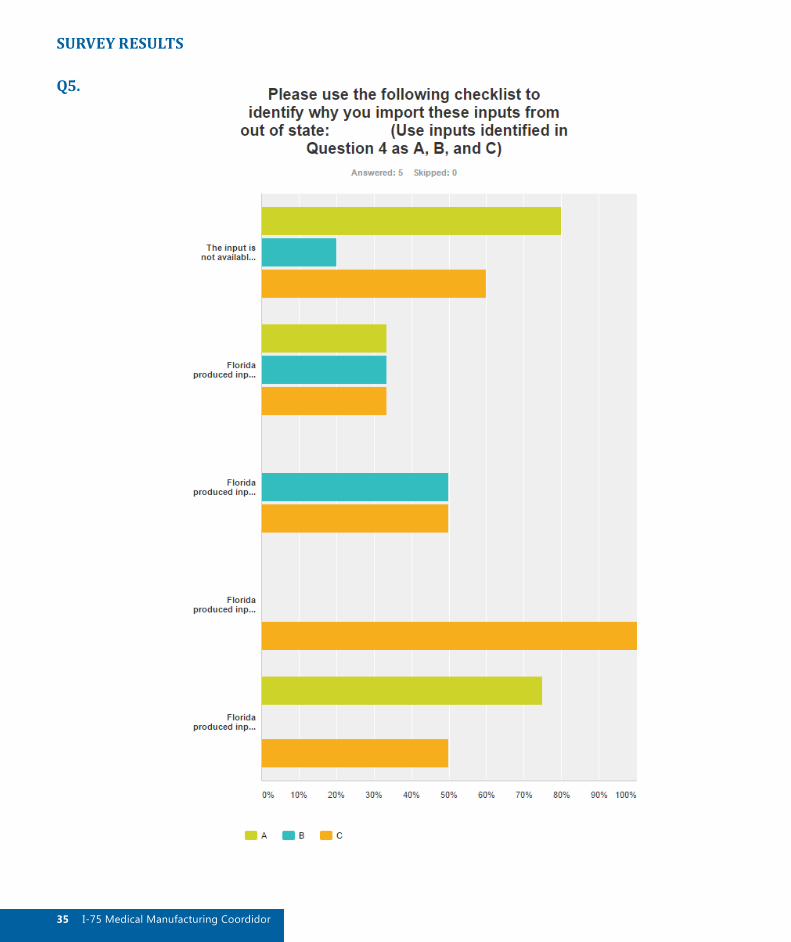
SURVEY RESULTS
Q5.
35 I-75 Medical Manufacturing Coordidor

SURVEY RESULTS CONTINUED
Q6.
36I-75 Medical Manufacturing Coordidor

SURVEY RESULTS
Q7.
Q8.
37 I-75 Medical Manufacturing Coordidor

SURVEY RESULTS CONTINUED
Q9.
Q10.
38I-75 Medical Manufacturing Coordidor

SURVEY RESULTS
Q11.
39 I-75 Medical Manufacturing Coordidor

SURVEY RESULTS CONTINUED
Q12.
40I-75 Medical Manufacturing Coordidor

SAMPLE REGIONAL WEBSITE
41 I-75 Medical Manufacturing Coordidor
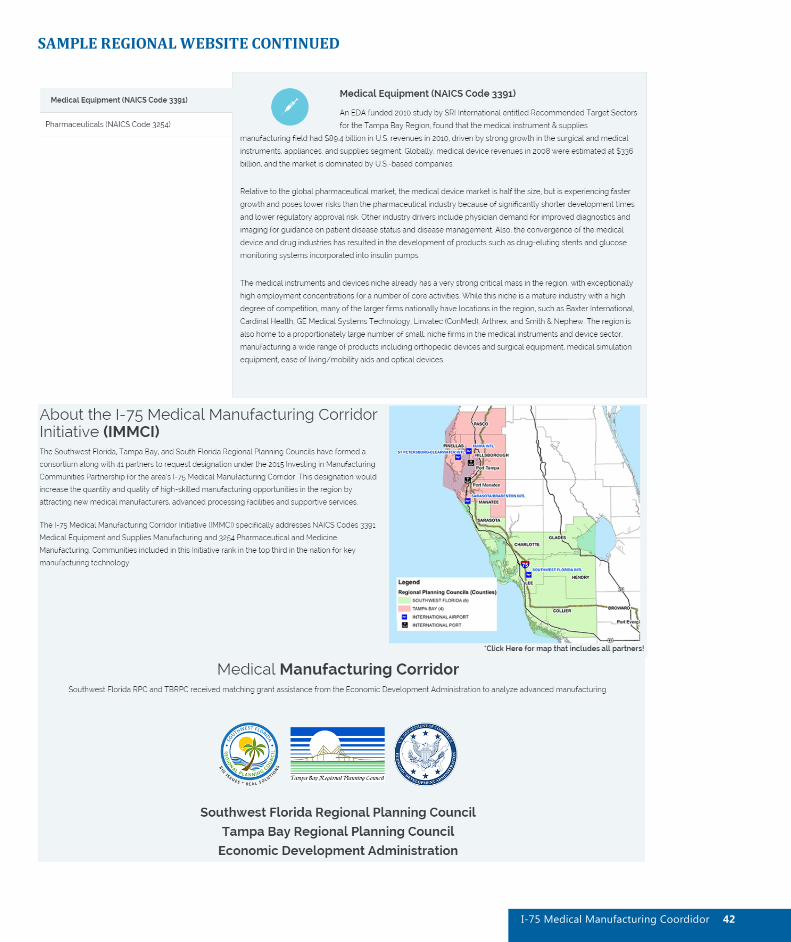
SAMPLE REGIONAL WEBSITE CONTINUED
42I-75 Medical Manufacturing Coordidor

Table. #SAMPLE RACK CARD/BROCHURE
43 I-75 Medical Manufacturing Coordidor

Created Pursuant to a Grant from the U.S. Department of Commerce, Economic Development Administration
West Central FloridaMedical Manufacturing Analysis
Tampa Bay Regional Planning CouncilSouthwest Florida Regional Planning Council
September 2015