Wells Fargo Securities Industrial Conference · Wells Fargo Securities Industrial Conference June...
29
Wells Fargo Securities Industrial Conference June 15, 2010 James A. Squires Executive Vice President Finance and CFO Norfolk Southern Corporation
-
Upload
trinhduong -
Category
Documents
-
view
217 -
download
0
Transcript of Wells Fargo Securities Industrial Conference · Wells Fargo Securities Industrial Conference June...

Wells Fargo Securities Industrial ConferenceJune 15, 2010
James A. SquiresExecutive Vice President Finance and CFONorfolk Southern Corporation


The Thoroughbred of Transportation

First Quarter Highlights2010 vs. 20092010 vs. 2009
Favorable (Unfavorable)
% Chg.
Income From Railway Operations $555 Mill. 45%
Net Income $257 Mill. 45%
Diluted Earnings Per Share $0.68 45%
Operating Ratio 75.2% 6%

Productivity ScorecardFirst Quarter 2010 vs 2009First Quarter 2010 vs. 2009
• Carload Volume 9%
• Crew Starts -1%
• Railroad Employees -7%p y
• GTMs per Employee 17%
GTMs per Gallon 4%• GTMs per Gallon 4%
• GTMs per Train Hour 2%

2010 Year-Over-Year Volumes
19%
25% 26%
19%
2%5%
January February March April May
Source: AAR
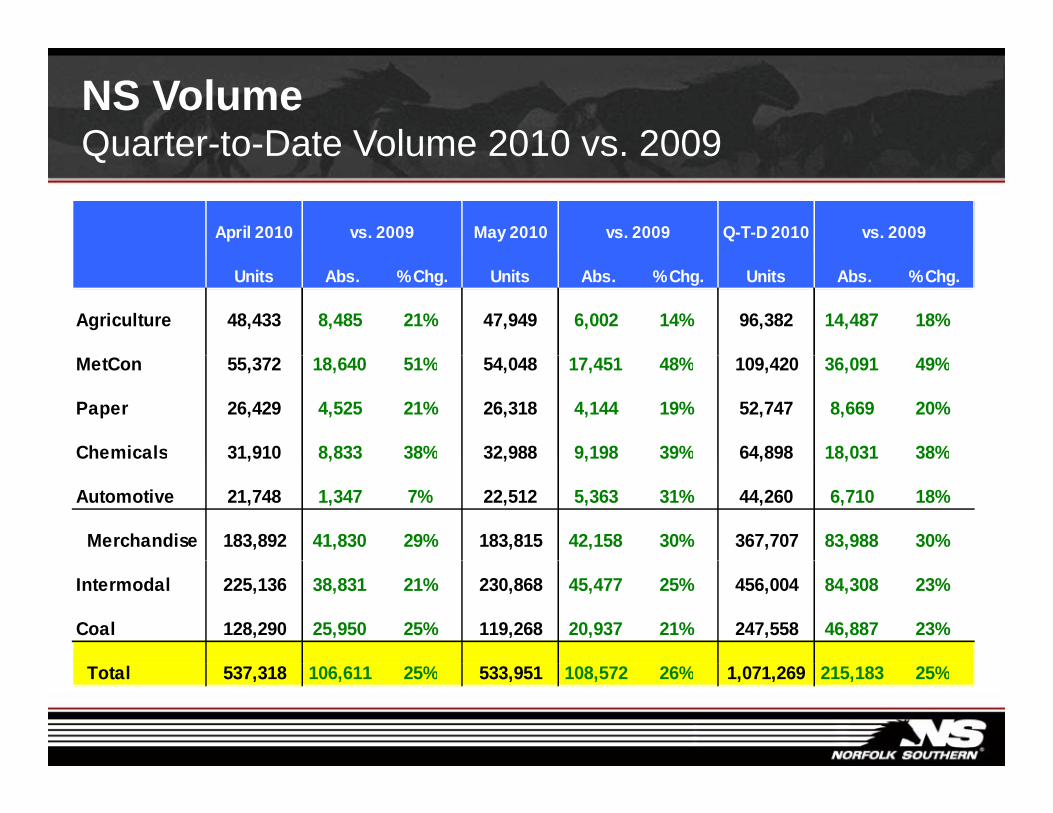
NS VolumeQuarter-to-Date Volume 2010 vs 2009Quarter to Date Volume 2010 vs. 2009
April 2010 May 2010 Q-T-D 2010vs. 2009 vs. 2009vs. 2009
Units Abs. % Chg. Units Abs. % Chg. Units Abs. % Chg.
Agriculture 48,433 8,485 21% 47,949 6,002 14% 96,382 14,487 18%
MetCon 55,372 18,640 51% 54,048 17,451 48% 109,420 36,091 49%
Paper 26,429 4,525 21% 26,318 4,144 19% 52,747 8,669 20%
Chemicals 31,910 8,833 38% 32,988 9,198 39% 64,898 18,031 38%Chemicals 31,910 8,833 38% 32,988 9,198 39% 64,898 18,031 38%
Automotive 21,748 1,347 7% 22,512 5,363 31% 44,260 6,710 18%
Merchandise 183,892 41,830 29% 183,815 42,158 30% 367,707 83,988 30%
Intermodal 225,136 38,831 21% 230,868 45,477 25% 456,004 84,308 23%
Coal 128,290 25,950 25% 119,268 20,937 21% 247,558 46,887 23%
Total 537,318 106,611 25% 533,951 108,572 26% 1,071,269 215,183 25%

Productivity ScorecardSecond Quarter Through May 2010 vs. 2009
Crew Starts
Carload Volume +25%
+10%
Railroad Employees
Crew Starts
-1%
GTMs per Gallon
GTMs per Employee +29%
+8%
GTMs per Train Hour
GTMs per Gallon
+5%
8%
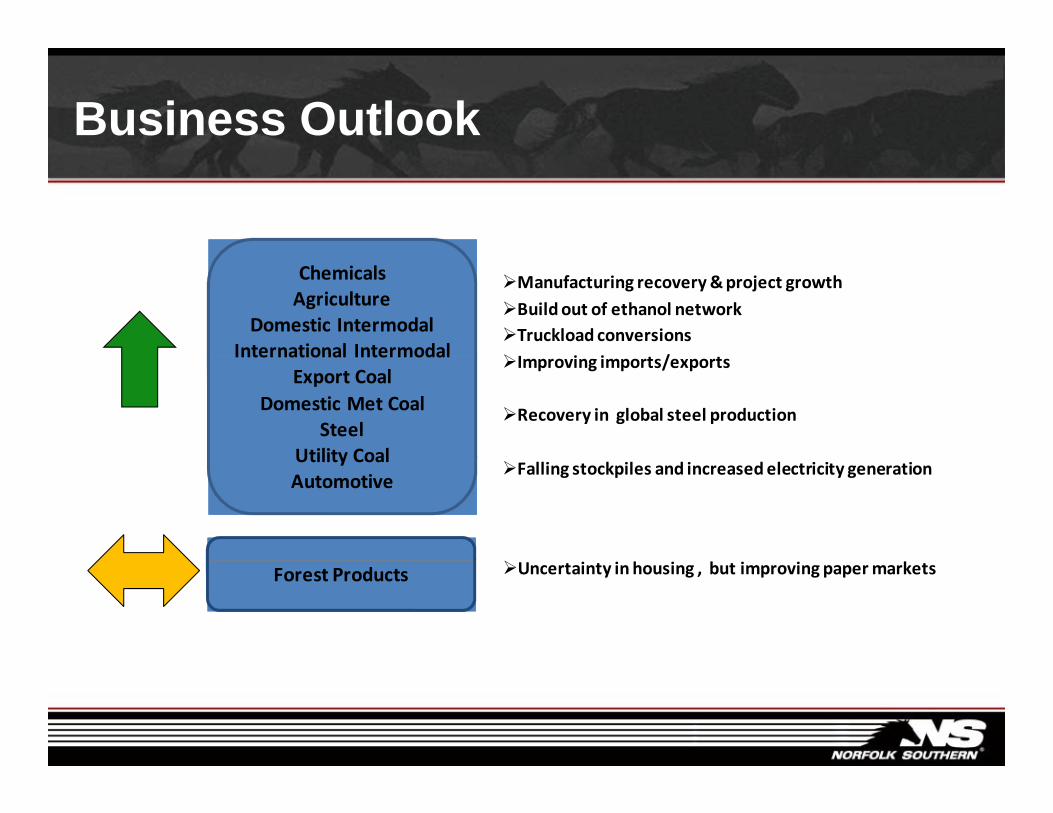
Business Outlook
ChemicalsAgriculture
Domestic IntermodalInternational Intermodal
Manufacturing recovery & project growthBuild out of ethanol networkTruckload conversions i i /International Intermodal
Export CoalDomestic Met Coal
SteelUtility Coal
Improving imports/exports
Recovery in global steel production
Utility CoalAutomotive
Falling stockpiles and increased electricity generation
Forest Products Uncertainty in housing , but improving paper markets

Strengthening the Franchise
S f t P f• Safety Performance• Service Consistency and Reliability• Operating Efficiency• Corridor StrategyCorridor Strategy• Innovative Technology
C h Fl• Cash Flow

Strengthening the Franchise
C id St t• Corridor Strategy• Innovative Technology• Cash Flow
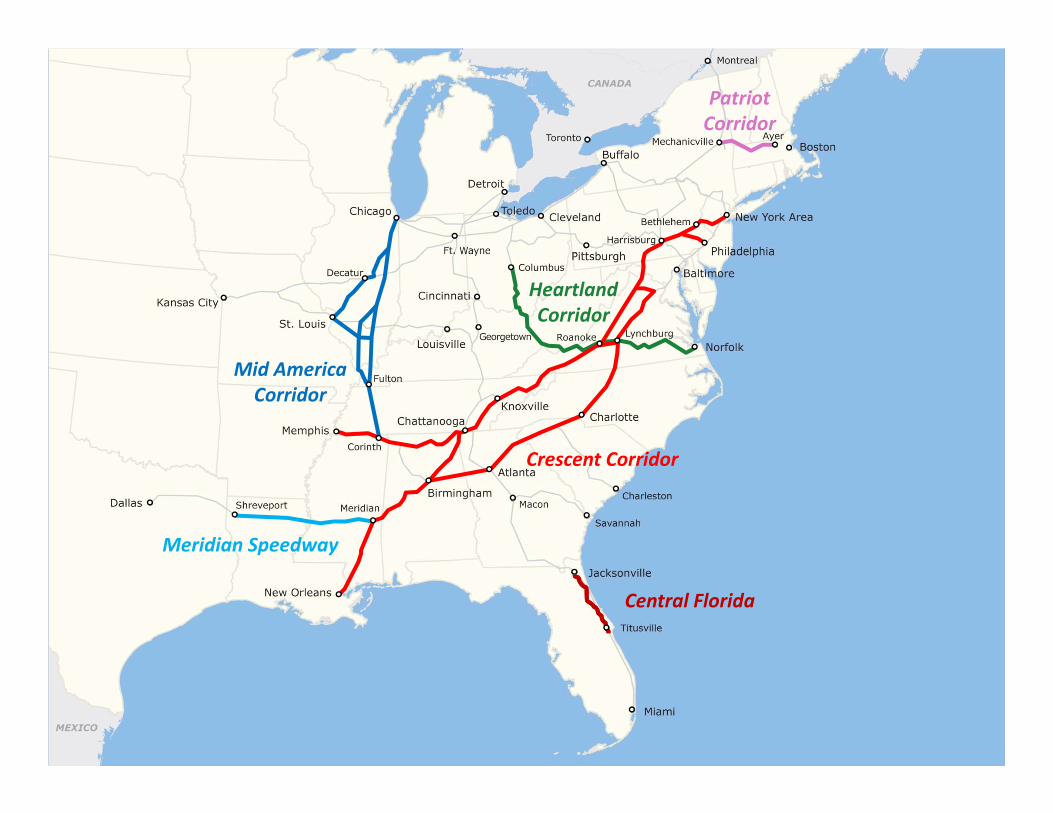
Patriot Corridor
HeartlandCorridor
Mid AmericaCorridor
Crescent Corridor
Meridian Speedway
Crescent Corridor
Central Florida

Strengthening the Franchise
C id St t• Corridor Strategy• Innovative Technology• Cash Flow
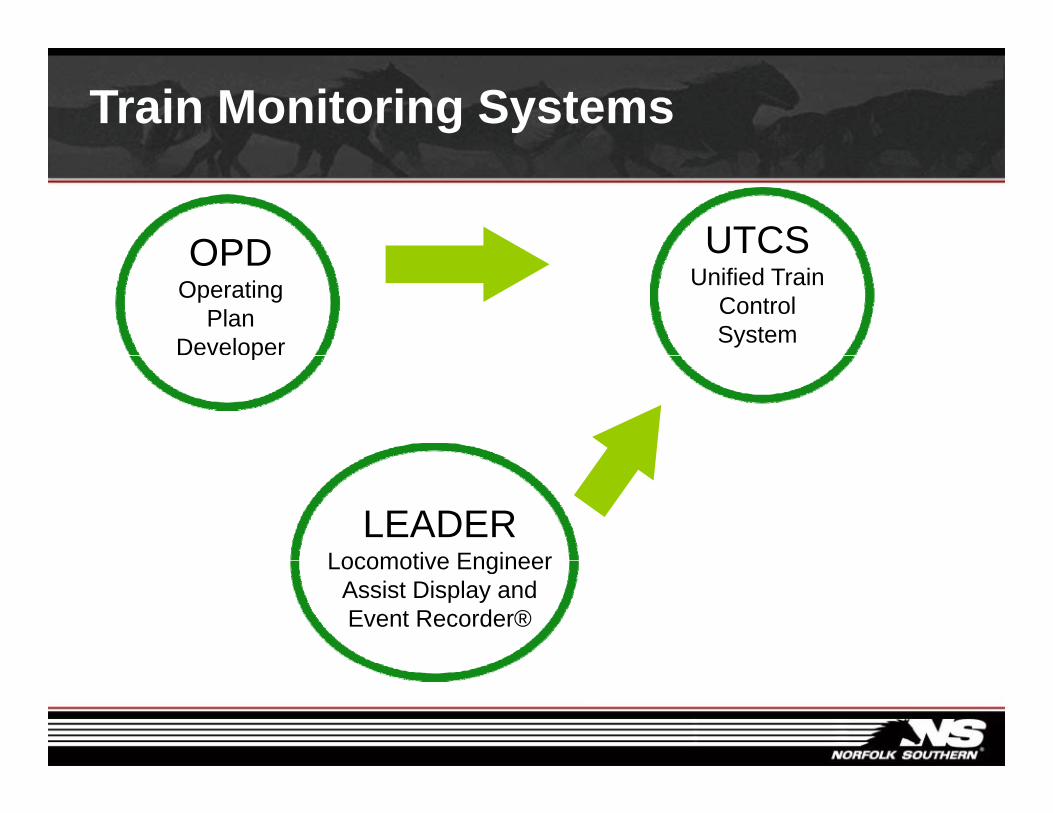
Train Monitoring Systems
OPD UTCSOPDOperating
Plan Developer
UTCSUnified Train
Control Systemp
LEADERLocomotive EngineerLocomotive Engineer
Assist Display and Event Recorder®

Operating Plan Developer
Traffic
Pl
Metrics
ReportsPlan
History
ABCGIS
MapsScenario
Mgmt
ABC
Editors Interfaces
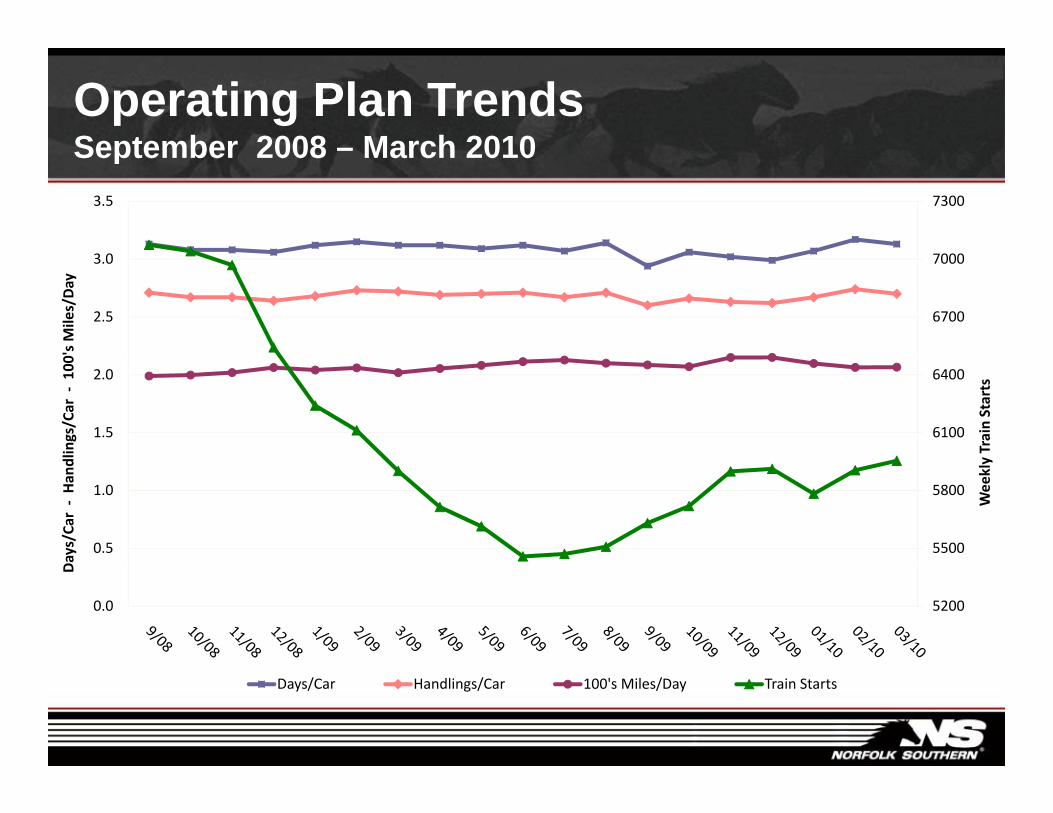
Operating Plan TrendsSeptember 2008 – March 2010September 2008 – March 2010
73003.5
6700
7000
2.5
3.0
's M
iles/Day
6100
6400
1.5
2.0
y Train Starts
lings/Car ‐
100
5500
5800
0.5
1.0
Weekly
ays/Ca
r ‐Han
d
52000.0
Da
Days/Car Handlings/Car 100's Miles/Day Train Starts

UTCS – Two Components
Base Dispatching System
RailEdge® Movement Planner

UTCS – RailEdge® Movement Planner
RailEdge® Movement PlannerAn optimized Network Solution An optimized Network SolutionOperational Objectives Constraints
Early
Late
Movement Plan Real-time Status

UTCS – Features

LEADER
NS
NS
Work Together
Conserve Energy
Eliminate unnecessary braking
and throttle use
AchieveGolden
Runand throttle use Run


LEADER Display Screen

Strengthening the Franchise
C id St t• Corridor Strategy• Innovative Technology• Cash Flow

Free Cash Flow Generation*($ Millions)($ Millions)
$1,080 $1,028 $992$1,157
$561
2005 2006 2007 2008 2009
* Free Cash Flow as used here is defined as cash provided by operating activities minus property additions. Please see reconciliation to GAAP posted on our web site.

Annual Dividend Per Share
$0 96
$1.22$1.36 $1.36
$0.68
$0.96
$0.24 $0.26 $0.30$0.36
$0.48
2001 2002 2003 2004 2005 2006 2007 2008 2009 2010Indicated
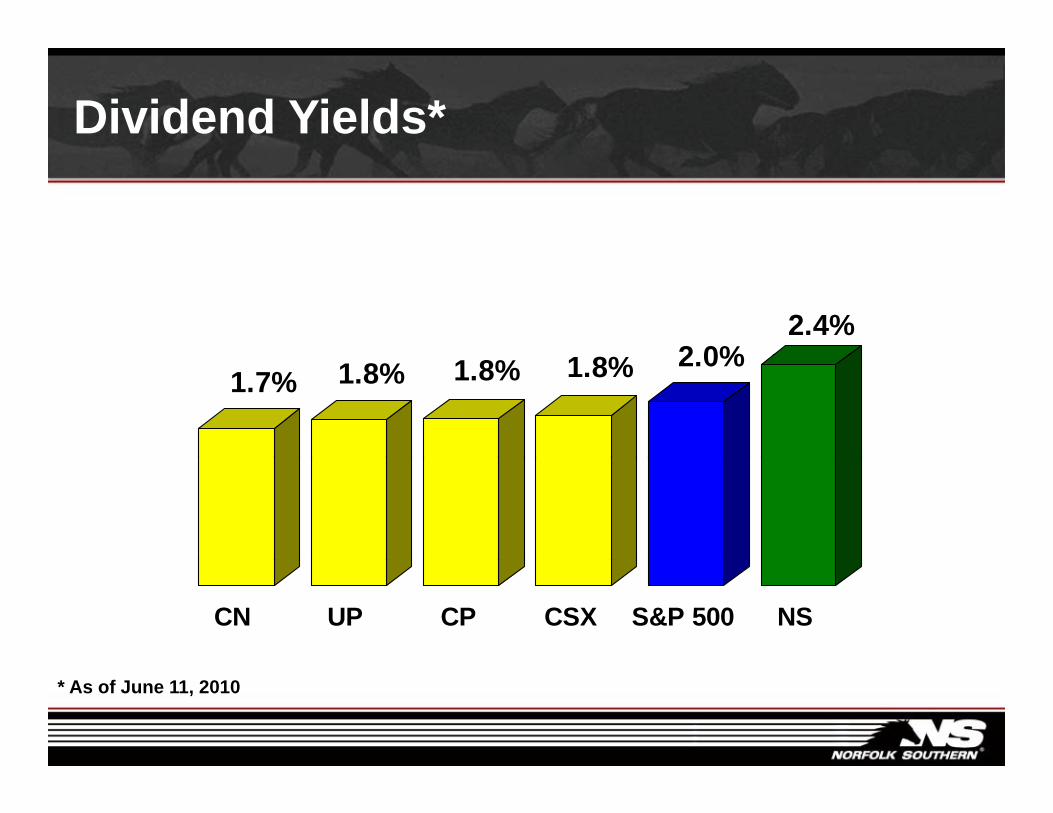
Dividend Yields*
2 0%2.4%
1.7% 1.8% 1.8% 1.8% 2.0%
CN UP CP CSX S&P 500 NS
* As of June 11, 2010

Share Repurchases*($ Millions)($ Millions)
$1,196 $1,128$964
$ ,
$0$87
2006 2007 2008 2009 2010** As of June 11, 2010
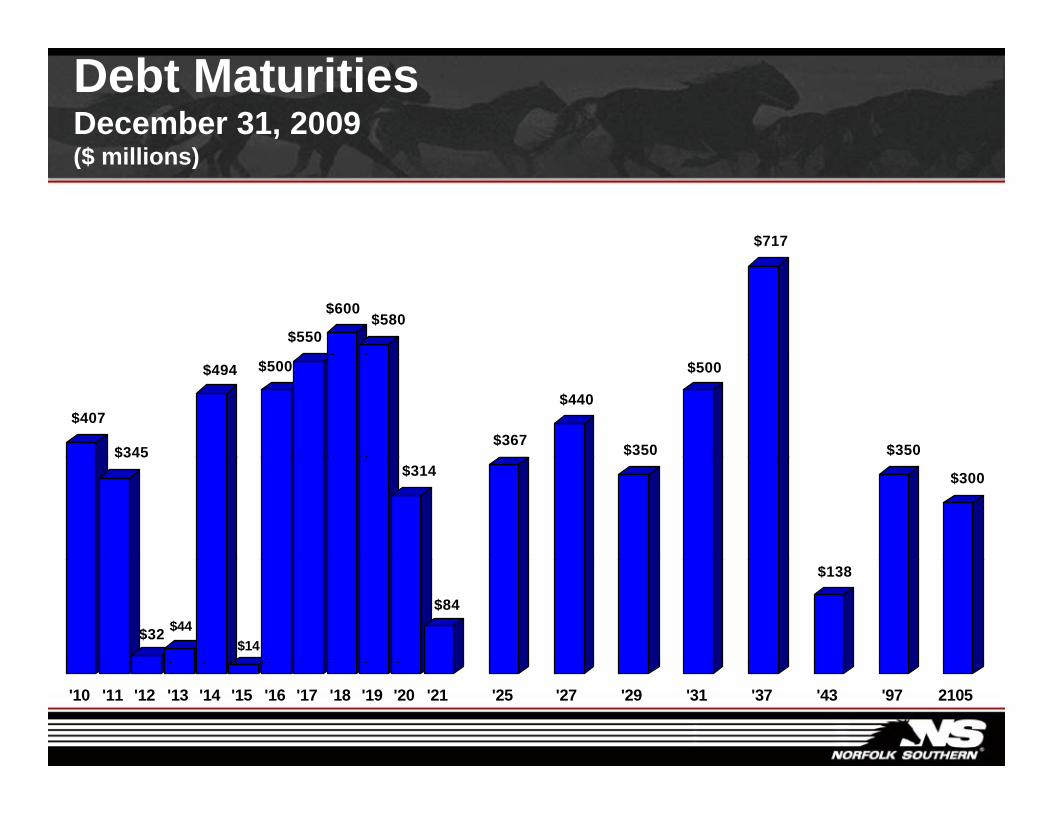
Debt MaturitiesDecember 31, 2009($ illi )($ millions)
$717
$550
$600$580
$407
$345
$494 $500
$367
$440
$350
$500
$350$$314 $300
$32 $44$14
$84
$138
'10 '11 '12 '13 '14 '15 '16 '17 '18 '19 '20 '21 '25 '27 '29 '31 '37 '43 '97 2105
Engine of the Future