WELLMAP, a FORTRAN computer program for the generation … · WELLMAP, a FORTRAN computer program...
30
DEPARTMENT OF THE INTERIOR U.S. GEOLOGICAL SURVEY WELLMAP, a FORTRAN computer program for the generation of maps of specified geographic areas with a variety of well symbols available to depict the current status of given oil and gas drilling. By E.G. Boyce, Jr., and Robert M. Turner Open-File Report 83-155 "This report is preliminary and has not been reviewed for conformity with U.S. Geological Survey editorial standards. (Any use of trade names is for descriptive purposes only and does not imply endorsement by the USGS.)" 1983
Transcript of WELLMAP, a FORTRAN computer program for the generation … · WELLMAP, a FORTRAN computer program...

DEPARTMENT OF THE INTERIOR
U.S. GEOLOGICAL SURVEY
WELLMAP, a FORTRAN computer program for the generation of maps of
specified geographic areas with a variety of well symbols
available to depict the current status of given oil and gas
drilling.
By E.G. Boyce, Jr., and Robert M. Turner
Open-File Report 83-155
"This report is preliminary and has not been reviewed for conformity with U.S. Geological Survey editorial standards. (Any use of trade names is for descriptive purposes only and does not imply endorsement by the USGS.)"
1983
CONTENTS
Scope and purpose ........................... 1
Acknowledgements ........................... 1
Computer restrictions ......................... 2
Program limitations .......................... 2
Input data .............................. 3
Design and usage ........................... 4
Additional well information ...................... 5
APPENDICES
Appendix A Links ........................... 6
Appendix 8 Sample Terminal Session .................. 7
Appendix C Coastline and Political Files ............... 8
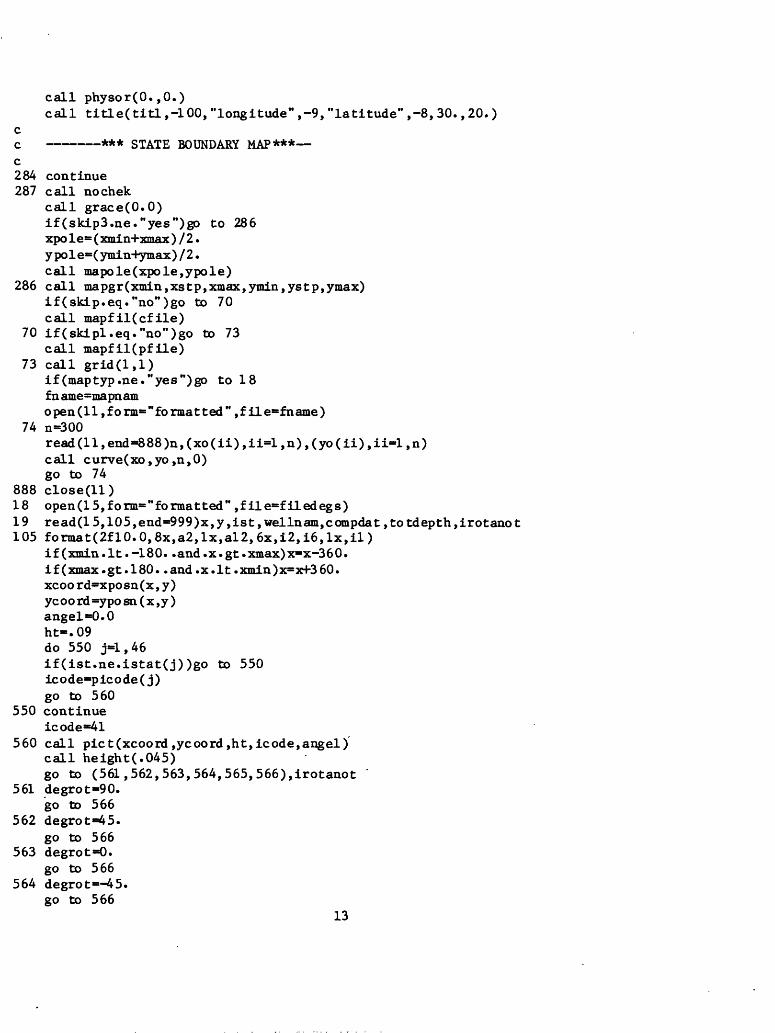
Appendix D WELLMAP Program Listing .................. 9
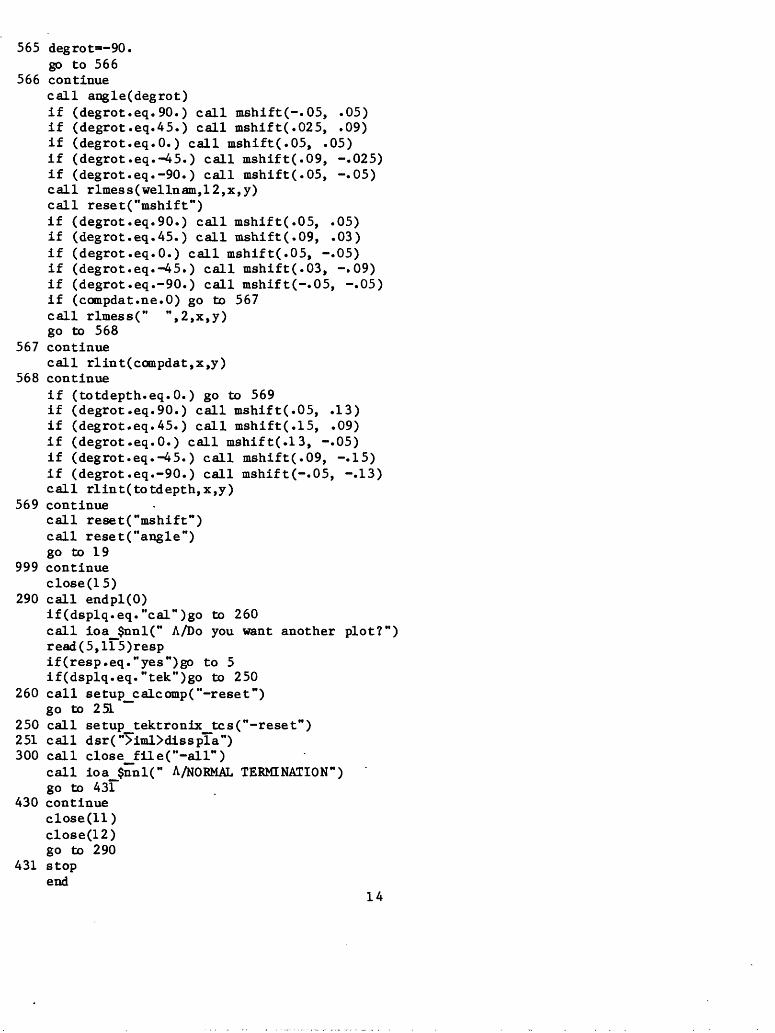
Appendix E GRASPWELL Program Listing ................. 15
Appendix F Available Projections ................... 21
Appendix G Subroutines Employed ................... 23
ii

Introduction
This paper will describe the WELLMAP program and give the information
needed to use the program effectively.
WELLMAP was written to enable the user to plot oil and gas well data on a
geographic base map as an aid in data evaluation and presentation. Prior
to its existence, well information was transferred to a map by tedious and
time-consuming manual effort. With industry rapidly expanding and new
data coming in constantly, manual methods proved insufficient. The ability
to select a geographic "window" and view the amount of drilling which has
already taken place is readily achieved through WELLMAP. The WELLMAP
program is based in part on the Mappit program for data display (Turner,
in preparation). The WELLMAP program employs the subroutine "PICT" (Cukro-
wicz, 1980) to produce annotations providing some descriptive information
as to the name, completion date, and total depth of the plotted hole. The
plot may be previewed on a Tektronix screen to verify map results although
when satisfactory output is obtained, a plot may be generated. See figures
1, 2 and 3 for sample input and output*
WELLMAP has provided a means for viewing raw data which truly simplifies
the tasks of examining and viewing the most current information available.
This report instructs the potential user in the use of WELLMAP, from the
time data are received until the map is plotted.
Acknowledgements
The well-symbol-plotting routine PICT was written by Ron Cukrowicz of
the Cities Services Company. He may be contacted at:
Cities Services Company Room 215 -Roger Building Box 300 Tulsa, Oklahoma 74102
tel: (918) 561-3217
1

15.
15.
14.
15.
12.
11.
14.
15.
16.
16.
18.
17.
583
167
250
000
039
208
000
708
083
267
258
133
36.
36.
36.
37.
44.
43.
42.
40.
37.
40.
40.
38.
792
850
700
978
958
789
000
942
933
933
922
917
51
06
08
21
21
00
07
53
02
55
01
17
Hole-1
Hole-2
Hole-3
Hole-4
Hole-5
Hole-6
Hole-7
Hole-8
Hole-9
Hole-10
Hole-11
Hole-12
78
82
79
76
75
72
68
55
59
73
80
77
10035
9628
8220
10202
7356
10220
9871
5004
7310
9929
12050
8432
3
2
1
3
5
4
3
4
3
3
3
3
Figure 1. Sample WELLMAP input.
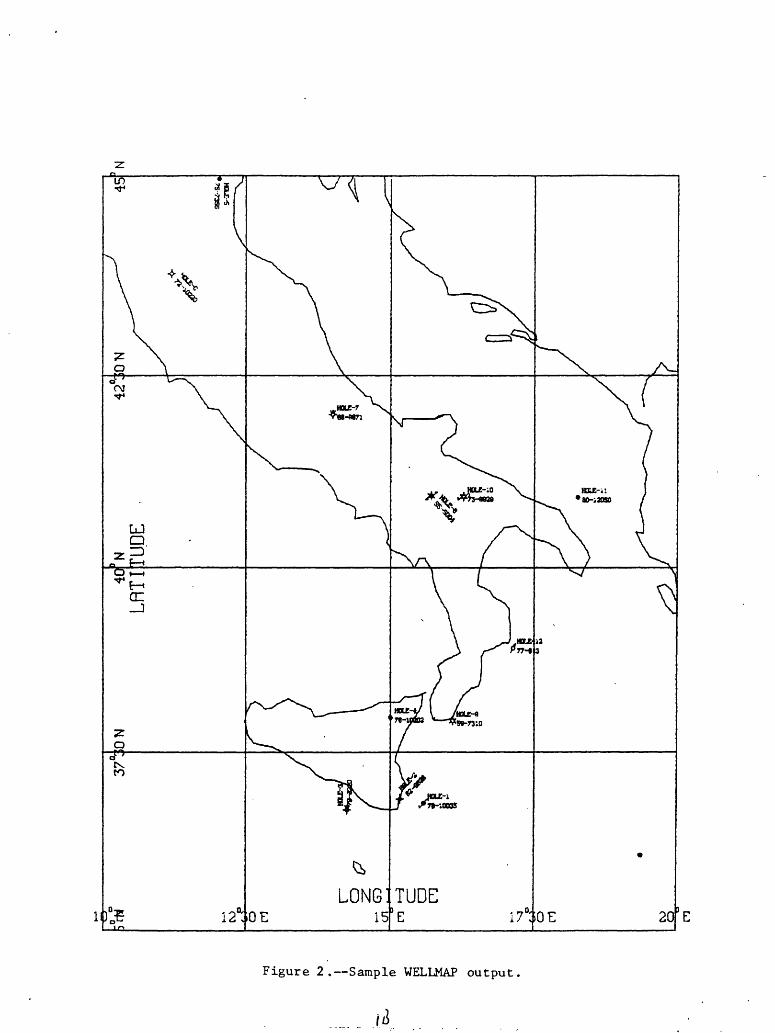
Figure 2. Sample WELLMAP output.

xj
^.
Locati
on
~ J^
Oil
sh
ow
AT
B
uu
t-in
oil
w
ell
C
)
~~5B
T~
IX
^
T51
, 54
D
oubl
e sp
ace
06,
26,
36
^L
D
ep
lete
d
oil
w
ell
V
>/
T
V"
__
G
as
show
-^
^ft
/
^_O
il
-.,-
ell
01,
21,
24,
31,
34
41,
44
07,
27,
37,
67,
57
Dry
w
ell
/"
V
Su
spen
ded
oiT
Gas
w
ell
S
-^
&*-
s
02,
22,
25,
32,
35,
62
00,
60
10,
11,
13,
14,
16,
18
Shut-
in o
il
& g
as w
ell
I )
Su
spen
ded
g
as
Oil
an
il
gas
well
'/^^
"^
03,
23,
33
53
12,
15,
17
L.\
A
ll
oth
52,
55
Oth
er
08,
28,
38,
68
her
^^
Oil
an
d
^as
shot;
S
hut-
in
iras
w
ell
Fig
ure
3.
Well
sy
mbo
ls
and
corr
espondin
g st
atu
s co
des
.

We would also like to commend the late Nancy A. Wright for her efforts
in the initial development of WELLMAP. Her diligence and research was
instrumental in the conception of the WELLMAP program.
Computer restrictions
The WELLMAP program was written for the Honeywell Multics system and
is designed for interactive use. The program incorporates several system
subroutines which render it machine dependent. Refer to Appendix G for a
list of these subroutines. It was written to be used in conjunction with
either a CALCOMP plotter or a Tektronix screen display and, therefore, one
of these must be used in plot production. As a minimum, the user must
know the "login" procedure for the Honeywell Multics System and how to
link to WELLMAP and the various files required with WELLMAP for execution.
Refer to Appendix A for instructions regarding the necessary links and the
proper commands to obtain them.
Program limitations
WELLMAP was written for use on the Honeywell Multics computer located in
Reston, Virginia, and utilizes several pieces of software which may not be
available elsewhere. These are:
DISSPLA - a proprietary package employed for the purpose
of plotting all coastline and political
boundaries as well as the map border, title,
grid, and axis labels.
TEKTRONIX - The "prevuu" routines make DISSPLA compatible
with the Tektronix hardware thereby allowing
the user to preview the plot before generating
a CALCOMP plot.
2
CALCOMP - software giving DISSPLA the ability to
interface with the CALCOMP plotter.
Input data
Input to WELLMAP is by a Multics segment created through GRASP, the
Geologic Retrieval And Synopsis Program (Bowen, 1976). GRASP is a retrieval
system which has its own command language and rules of operation providing
interactive access to a pre-existing data base. Therefore, the user must
either have access to a GRASP data base, have knowledge of how to create
one, or already have a data input segment in his/her working directory.
Assuming enough information is available, the user may enter data into a
segment via a text editor prior to the invocation of the program. The
name of this file may be no more than eight characters in length. The
input format is as follows:
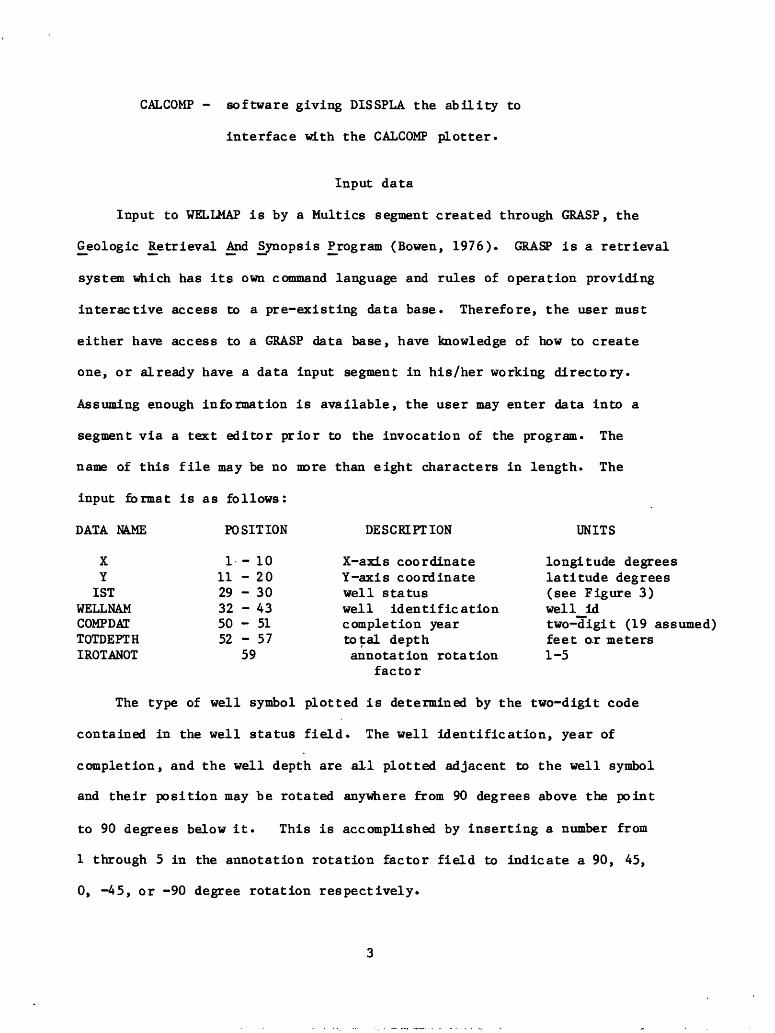
DATA NAME POSITION DESCRIPTION UNITS
X 1-10 X-axis coordinate longitude degreesY 11-20 Y-axis coordinate latitude degrees
1ST 29 - 30 well status (see Figure 3)WELLNAM 32 - 43 well identification well_idCOMPDAT 50 - 51 completion year two-digit (19 assumed)TOTDEPTH 52-57 total depth feet ox metersIROTANOT 59 annotation rotation 1-5
factor
The type of well symbol plotted is determined by the two-digit code
contained in the well status field. The well identification, year of
completion, and the well depth are all plotted adjacent to the well symbol
and their position may be rotated anywhere from 90 degrees above the point
to 90 degrees below it. This is accomplished by inserting a number from
1 through 5 in the annotation rotation factor field to indicate a 90, 45,
0, -45, or -90 degree rotation respectively.

Coordinates of west longitude and south latitude are defined as being
negative as a means of distinguishing between hemispheres* These longitudes
and latitudes are the "X" and "Y" values listed above.
Design and usage
After linking to WELLMAP as described in Appendix A, enter "WELLMAP"
to initiate execution. The WELLMAP program will then request the transmission
rate of the terminal currently being used. You will then be asked whether
the output is to be directed to a Tektronix screen, a CALCOMP plotter or a
Multics segment entitled "pfile". If a CALCOMP plot is desired, the tape
should have already been taken to the computer room; otherwise a message
to this effect is issued and the execution is terminated*
Once these preliminaries are established, you are prompted for a
projection type* The various projections available are listed in Appendix
F along with their appropriate explanations. For some of the more distorted
projections, a calculation to cause the projection center to be at the map
center may be required. This feature is accounted for and is accomplished
by answering "yes" when so prompted. The default is the Greenwich-equator
intersection. Next you will be requested to supply a title for the map.
The response may contain as many as 48 characters and will appear in upper
case letters on the map, regardless of the form in which it was entered.
You will then be asked whether a state map with county boundaries is
desired. If so, enter the postal abbreviation (first letter upper case,
second letter lower case) of the state to be mapped. An additional prompt
is issued to enable you to select a geographic window of your own choice.
In this case, you must enter the range of longitude, from the minimum to
the maximum, as well as the interval number of degrees between grid lines.
This same information is then required for the range of latitude and grid
4
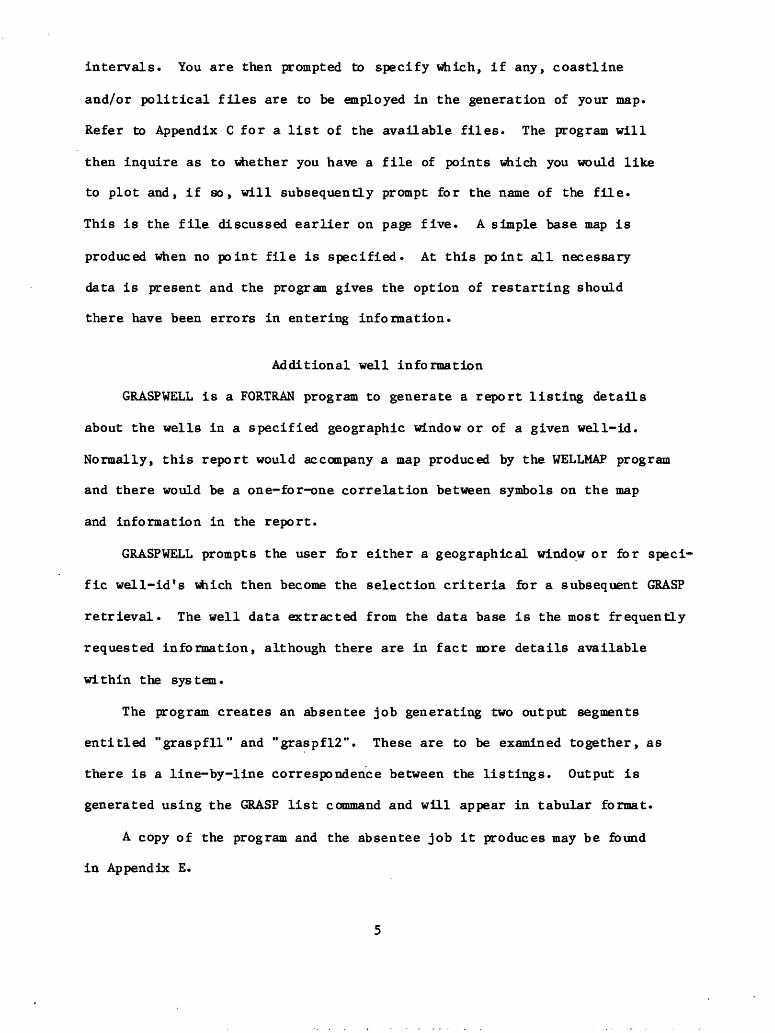
intervals. You are then prompted to specify which, if any, coastline
and/or political files are to be employed in the generation of your map.
Refer to Appendix C for a list of the available files. The program will
then inquire as to whether you have a file of points which you would like
to plot and, if so, will subsequently prompt for the name of the file.
This is the file discussed earlier on page five. A simple base map is
produced when no point file is specified. At this point all necessary
data is present and the program gives the option of restarting should
there have been errors in entering information.
Additional well information
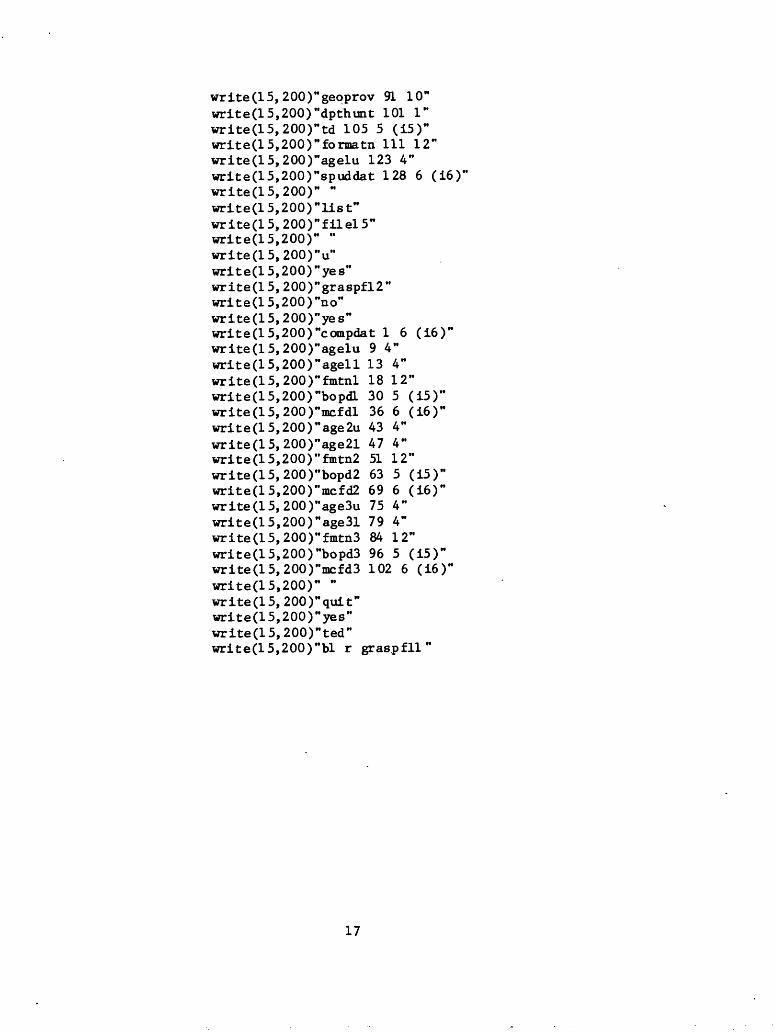
GRASPWELL is a FORTRAN program to generate a report listing details
about the wells in a specified geographic window or of a given well-id.
Normally, this report would accompany a map produced by the WELLMAP program
and there would be a one-for-one correlation between symbols on the map
and information in the report.
GRASPWELL prompts the user for either a geographical window or for speci
fic well-id's vftiich then become the selection criteria for a subsequent GRASP
retrieval. The well data extracted from the data base is the most frequently
requested information, although there are in fact more details available
within the system.
The program creates an absentee job generating two output segments
entitled "graspfll" and "graspfl2". These are to be examined together, as
there is a line-by-line correspondence between the listings. Output is
generated using the GRASP list command and will appear in tabular format.
A copy of the program and the absentee job it produces may be found
in Appendix E.

Appendix A
- Links -
Enter "link" followed by:
>ud dX)RA>l ibr ary>WEL LMAP
>uddX)RA>library>asso c
>uddX)RA>library>closer
>uddX)RA>lib rary >s tatvrado
>uddX)RA>library>grasp
>uddX)RA>lib r ary >pic t
>uddX)RA>library>Ak
through
>uddX)RA>library>Wy
- Search Rules -
Enter "asr" (assign search rules) followed by:
>mr82 fortran -be >system library unbundled
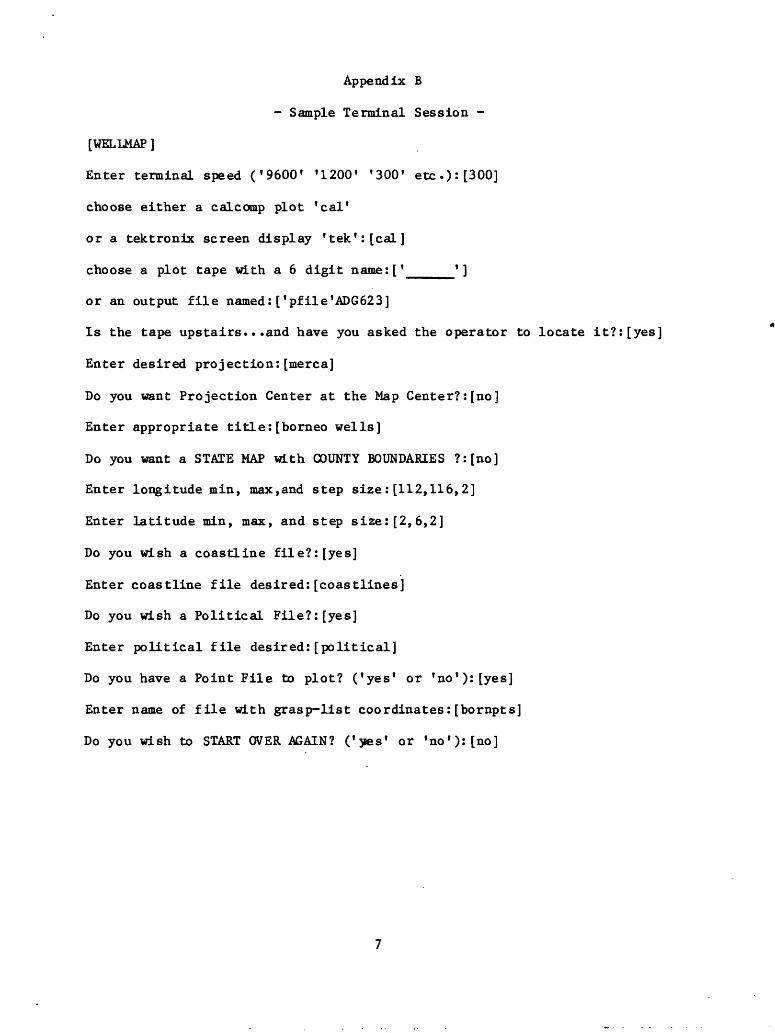
Appendix B
- Sample Terminal Session -
[WELLMAP]
Enter terminal speed ( f 9600 f '1200' '300' etc.):[300]
choose either a calcomp plot 'cal'
or a tektronix screen display f tek':[cal]
choose a plot tape with a 6 digit name:[ f ____f ]
or an output file named:['pfile'ADG623]
Is the tape upstairs...and have you asked the operator to locate it?:[yes]
Enter desired projection:[merca]
Do you want Projection Center at the Map Center?:[no]
Enter appropriate title:[borneo wells]
Do you want a STATE MAP with COUNTY BOUNDARIES ?:[no]
Enter longitude min, max,and step size:[112,116,2]
Enter latitude min, max, and step size:[2,6,2]
Do you wish a coastline file?: [yes]
Enter coastline file desired:[coastlines]
Do you wish a Political File?:[yes]
Enter political file desired:[political]
Do you have a Point File to plot? ('yes* or f no'):[yes]
Enter name of file with grasp-list coordinates:[bornpts]
Do you wish to START OVER AGAIN? ('jes' or 'no'): [no]

Appendix C
- Coastline and Political Files
Coastline Files: 'MAPDTA'
'HERSHEY '
f AFRICA 1
f ANTARCTIC f
'ASIA 1
'AUSTRALASIA'
'EUROPE'
'NORTH AMERICA'
'SOUTH AMERICA'
'COASTLINES' (of the world)
Political Files: 'PAFRICA'
'PASIA'
'PAUSTRAIASIA'
'PNORTH AMERICA'
'PSOUTH AMERICA'
'POLITICAL' (of the world)
'USTATESx' (x - 0 thru 9,
0 - best resolution)
All files are described in the DISSPLA manual.
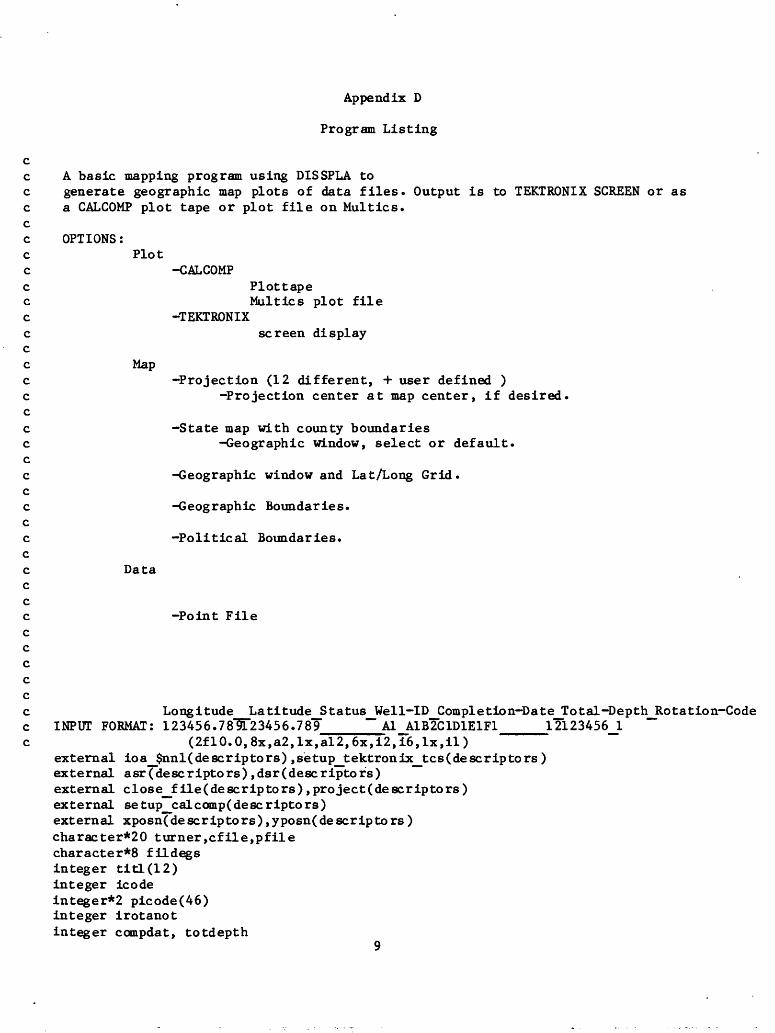
Appendix D
Program Listing
cc A basic mapping program using DISSPLA toc generate geographic map plots of data files. Output is to TEKTRONIX SCREEN or asc a CALCOMP plot tape or plot file on Multics.cc OPTIONS:c Plotc -CALCOMPc Plottapec Multics plot filec -TEKTRONIXc screen displaycc Mapc -Projection (12 different, + user defined )c -Projection center at map center, if desired.cc -State map with county boundariesc -Geographic window, select or default.cc -Geographic window and Lat/Long Grid.cc -Geographic Boundaries.cc -Political Boundaries.cc Dataccc -Point Filecccccc Longitude Latitude_Status_Well-ID__Completion-Date_Total-Depth__Rotation-Codec INPUT FORMAT: 123456.783T23456.789______A1_A1B2C1D1E1F1____12123456J.c (2flO.O,8x,a2,lx,al2,6x,i2,i6,lx,il)
external ioa_J>nnl( descriptors) , setup_tektronix__tcs(de scrip to rs )external asr(desc ripto rs),dsr(desc ripto rs)external close__f ile( descriptors) , project (descriptors)external setup__calcomp(descriptors)external xposn(descriptors),yposn(descriptors)character*20 turner,cfile,pfilecharacter*8 fildegsinteger titl(12)integer icodeinteger*2 picode(46)integer irotanotinteger compdat, totdepth
9
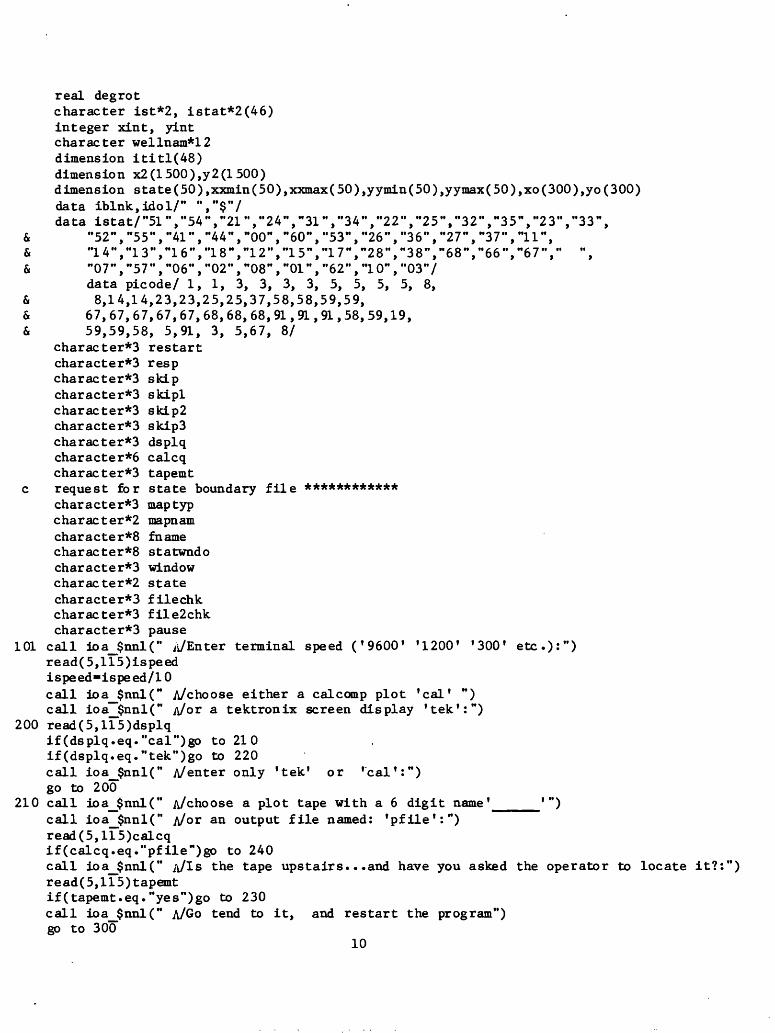
real degrotcharacter ist*2, istat*2(46) integer xint, yint character wellnam*12 dimension ititl(48) dimension x2(1500),y2(1500)dimension state(50),xxmin(50),xxmax(50),yymin(50),yymax(50),xo(300),yo(300) data iblnk,idol/" ","$"/data istat/"51","54","21","24","31","34","22","25","32","35","23","33",
& "52","55","41","44","00","60","53","26","36","27","37","11", & "14","13","16","18","12","15","17","28","38","68","66","67"," ", & "07","57","06","02","08","01","62", '10","03"/
data picode/ 1, 1, 3, 3, 3, 3, 5, 5, 5, 5, 8, & 8,14,14,23,23,25,25,37,58,58,59,59, & 67,67,67,67,67,68,68,68,91,91,91,58,59,19, & 59,59,58, 5,91, 3, 5,67, 8/
character*3 restart character*3 resp character*3 skip character*3 skipl character*3 skip2 character*3 skip3 character*3 dsplq character*6 calcq character*3 tapemt
c request for state boundary file ************ character*3 maptyp character*2 mapnam character*8 fname character*8 statwndo character*3 window character*2 state character*3 filechk character*3 file2chk character*3 pause
101 call ioa_$nnl(" A/Enter terminal speed ( t 9600 l '1200' '300' etc.):") read(5,115)ispeed ispeed=ispeed/10call ioa_$nnl(" A/choose either a calcomp plot 'cal 1 ") call ioa_$nnl(" A/or a tektronix screen display 'tek':")
200 read(5,115)dsplqif(dsplq.eq."cal")go to 21 0 if(dsplq.eq."tek")go to 220call ioa_$nnl(" A/enter only 'tek 1 or 'cal 1 :") go to 200
210 call ioa_$nnl(" A/choose a plot tape with a 6 digit name 1 ____'") call ioa_$nnl(" A/or an output file named: 'pfile':") read(5,115)calcq if(calcq.eq."pfile")go to 240call ioa_$nnl(" A/Is the tape upstairs...and have you asked the operator to locate it?:") read(5,115)tapemt if(tapemt.eq."yes")go to 230call ioa_$nnl(" A/Go tend to it, and restart the program") go to 300
10

230 call setup_calcomp("-un","16","-tp","-nm",calcq)go to 245
240 call setup_calcomp("-im","16","-fl","-nm","pfile") 245 call asr(">iml>disspla")
call calcmp(16)call inch30call page(30.,30.)call nobrdrgo to 5
220 call setup__tektronix__tcs4 call asr(">iml>disspla")
call nhance(ispeed)5 call ioa_$nnl(" A/Enter desired projection:")
read(5,100)turnercall nochekcall grace(O.O)call ioa_$nnl(" AA>o you want Projection Center at the Map Center?:")read(5,115)skip3
100 format(a20)skip="yes tiskipi»"yes"call ioa_$nnl(" A/Enter appropriate title:")read(5,110)ititl
110 fonaat(48al)1-48do 112 i=l,48if(ititl(l).ne.iblnk) go to 113
112 1=1-1113 1=1+1
ititl(l)=idolencode(titl,110)ititl
cc *** SELECT STATE MAP WITH COUNTY BOUNDARIES *** c
111 call ioa__$nnl(" A/Do you want a STATE MAP with COUNTY BOUNDARIES ?:")read(5,115)maptypif(maptyp.ne."yes")go to 114print,"A single state at a time can be mapped; Select the state using the "print,"TWO LETTER postal abbreviation, with ONLY the First Letter CAPITALIZED"
8 call ioa_$nnl(" A/Enter Abbreviation of the State desired ,(2 char.) ,(i.e. Az = Arizona):")read(5,115)mapnam
cc *** SELECT GEOGRAPHIC WINDOW FROM STATE FILE *** c
open(15,form="formatted", file="statwndo")do 9 i=l,48
6 read(15,7,end=99)state(i),xxmin(i),xxmax(i),yymin(i),yymax(i)7 format(a2,2f4.0,2f3.0)
if(mapnam.eq.state(i))go to 10 9 continue
close(15)go to 99
11

10 continueclose(15)print, "State* ",state(i), tf window= M ,xxmin(i)," ",xxmax(i), tf ",yymin(i), tf ",yymax(i)call ioa_j$nnl(" A/Do you wish to select your own Geographic Window?:")read(5,115)windowif(window.eq."yes")go to 114skip="no"skipl="no"xstp=2ystp=2
cc *** Assign Default Window *** c
xmin=xxmin(i)xmax=xxmax(i)ymin=yymin(i)ymax^yymax( i )go to 65
99 print /'ABBREVIATION ERROR"print ,"Use POSTAL ABBREVIATION"go to 8
114 call ioa_$nnl(" A/Enter longitude min, max, and step size:") read(5,115)xmin,xmax,xstp
115 format(v)call ioa $nnl(" A/Enter latitude min, max, and step size:")read(5,115)ymin,ymax,ystp
50 call ioa_$nnl(" A/Do you wish a coastline file?:")read(5,115)skipif(skip.eq."no")go to 55call ioa_$nnl(" A/Enter coastline file desired:")read(5,100)cfile
55 call ioa_$nnl(" A/Do you wish a Political File?:")read(5,115)skiplif(skipl.eq."no")go to 65
60 call ioa_$nnl(" A/Enter political file desired:")read(5,100)pfile
65 call ioa_$nnl(" A/Do you have a Point File to plot? ('yes 1 or 'no'):")read(5,115)skip2if(skip2.eq."no")go to 600
600 if(skip2.eq."no")go to 280call ioa_$nnl(" A/Enter name of file with grasp-list coordinates:")read(5,120)fildegs
207 call ioa_$nnl(" A/Do You Wish To -START OVER AGAIN? ('yes' or 'no'):")read(5,115)restartif(restart.eq."yes")go to 101
120 format(a8) 280 if(dsplq.eq."cal")go to 285
call projct(turner)call physor(0.,0.)call title(titl,-100,"longitude",9,"latitude",8,8.,6.0)goto 284
285 call projet(turner)12
call physor(0.,0.)call title(titl,-100,"longitude",-9,"latitude",-8,30.,20.)
cc *** STATE BOUNDARY MAP*** c284 continue 287 call nochek
call grace(O.O)if(skip3.ne."yes")go to 286xpole=(xmin+xmax)/2.y pol e=( ymin-Hymax) / 2.call mapole(xpole,ypole)
286 call mapgr(xmin,xstp,xmax,ymin,ystp,ymax)if(skip.eq."no")go to 70call mapfil(cfile)
70 if(skipl.eq."no")go to 73call mapfil(pfile)
73 call grid(l,l)if(maptyp.ne."yes")go to 18fn ame=mapnamopen(ll,form= M fo matted",file=fname)
74 n=300read(ll,end=888)n,(xo(ii),ii=l,n),(yo(ii),ii=l,n) call curve(xo,yo,n,0) go to 74
888 close(ll)18 open(15,form="formatted",file=filedegs)19 read(15,105,end=999)x,y,ist,wellnam,compdat,totdepth,irotanot 105 format(2flO.O,8x,a2,lx,al2,6x,i2,i6,lx,il)
if(xmin.lt.-180..and.x.gt.xmax)x=x-360.if(xmax.gt.180..and.x.lt.xmin)x=x+360.xcoord=xposn(x,y)ycoo rd =ypo sn ( x ,y )angel =0.0ht=.09do 550 j=l,46if(ist.ne.istat(j))go to 550icode=picode(j)go to 560
550 continueicode*41
560 call pict(xcoord ,ycoord,ht,icode,angel) call height(.045) go to (561,562,563,564,565,566),irotanot
561 degrot=90. go to 566
562 degrot«45. go to 566
563 degrot=0. go to 566
564 degrot=-45. go to 566
13
565 degrot=-90. go to 566
566 continuecall angle(degrot)if (degrot.eq.90.) call mshift(-.05, .05)if (degrot.eq.45.) call mshift(.025, .09)if (degrot.eq.O.) call mshift(.05, .05)if (degrot.eq.-45.) call mshift(.09, -.025)if (degrot.eq.-90.) call mshift(.05, -.05)call rlmess(wellnam,12,x,y)call reset("mshift")if (degrot.eq.90.) call mshift(.05, .05)if (degrot.eq.45.) call mshift(.09, .03)if (degrot.eq.O.) call mshift(.05, -.05)if (degrot.eq.-45.) call mshift(.03, -.09)if (degrot.eq.-90.) call mshift(-.05, -.05)if (compdat.ne.O) go to 567call rlmess(" ",2,x,y)go to 568
567 continuecall rlint(compdat,x,y)
568 continueif (totdepth.eq.O.) go to 569 if (degrot.eq.90.) call mshift(.05, .13) if (degrot.eq.45.) call mshift(.15, .09) if (degrot.eq.O.) call mshift(.13, -.05) if (degrot.eq.-45.) call mshift(.09, -.15) if (degrot.eq.-90.) call mshift(-.05, -.13) call rlint(totdepth,x,y)
569 continuecall reset("mshift")call reset("angle")go to 19
999 continueclose(15)
290 call endpl(O)if(dsplq.eq."cal")go to 260call ioa_$nnl(" A/Do you want another plot?")read(5,115)respif(resp.eq."yes")go to 5if(dsplq.eq."tek")go to 250
260 call setup_calcomp("-reset")go to 25L
250 call setup_tektronix_tcs("-reset")251 call dsr(">iml>disspla") 300 call close_file("-all")
call ioa_$nnl(" A/NORMAL TERMINATION")go to 431
430 continue close(ll) close(12) go to 290
431 stop end
14

Appendix E
GRASPWELL
%global ansi77;external ioa_$nnl( descriptors)character wellid*12(100)character alpha*26character*3 answercharacter*3 windowcharacter*! hemins, hemiewcharacter string*!26, aorb*A, concat*!real xmin, xmax, ymin, ymaxdata alpha/"abcdefghijklmnopqrstuvwxyz"/data string/126*" "/data aorb/".or."/
100 format("long be ",f!0.3,",",fl0.3) 150 formatC'lat be " ,f!0.3, "," ,f!0.3) 200 format(v)300 formatC'wellid eq ",a!2) 400 format(a!2)
call ioa__("You are given the option of specifying a geographic window")call ioa_("or individual well id's which will become the basis for a GRASP")call loa__("retrieval to provide details on those wells specified.")call ioa__$nnl(" A/Would you like information about all wells")call ioa__$nnl(" A/within a specific geographical window ?:")
1 read(5,200)windowif (window.ne."yes") go to 10call loa_$nnl(" A/Enter the range of longitude and hemisphere(E or W) (min, max, hemis.):")read(5,200)xmin,xmax,hemiewcall ioa__$nnl(" A/Enter the range of latitude and hemisphere(N or S) (min, max, hemis.):")read(5,200)ymin,ymax,heminsgo to 30
10 if (window.ne."no") go to 20 i = 1j - 0
11 call ioa_$nnl(" A/Enter desired 'well-id 1 :") read(5,400)wellid(i) concat « alpha(i:i) i - i + 1if (j.eq.O) go to 14 string(j+l:j44) - aorb string(j+5:j+5) » concatj - J + 5
12 call loa $nnl(" A/Would you like to enter another well-id ?:")13 read(5,2TTO)answer
if (answer.eq."yes") go to 11 if (answer.eq."no") go to 30 call loa_$nnl(" A/Enter only 'yes' or 'no':")
go to 12 14 j - 1
s tr ing ( j: j ) a=concat15

go to 12 20 call ioa__$nnl(" A/Enter only 'yes* or 'no 1 :")
go to 1 30 write(15,200)"&attach"
write(15,200)"cwd wellmap"write(l5,200)"grasp"write(15,200)"defi"write(15,200)"read lldefi"write(15,200) tf "write(15,200)"cond"if (window.eq."no") go to 40write(15,100)xmin,xmaxwrite(l5,200)"longew cs ",hemiewwrite(15,150)ymin,ymaxwrite(15,200)"latns cs ",heminswrite(15,200)" "write(15,200)"logi"write(15,200)"a.and.b.and.c.and.d"write(15,200)"sear"write(15,200)" "write(15,200)"file!5"go to 60
40 i - i - 1do 50 n-l,iwrite(15,300)wellid(n)
50 continuewrite(15,200)" "write(15,200)"logi"write(15,200)stringwrite(15,200)"sear"write(15,200)" "write(15,200)"file!5"
60 write(15,200)"list"write(15,200)"filel5"write(15,200)" "write(l 5,200)"u"write(15,200)"yes"write(l5,200)"graspfll"write(15,200)"no"write(15,200)"uniqid 1 15"write(l5,200)"country 17 4"write(15,200)"situati 23 1"write(15,200)"wellid 26 12"write(15,200)"wellnam 40 16"write(15,200)"wellno 57 3 (13)"write(15,200)"longew 62 1"write(15,200)"longdeg 65 3 (13)"write(15,200)"longmin 69 2 (12)"write(15,200)"longsec 72 3 (13)"write(15,200)"latns 77 1"write(15,200)"latdeg 80 2 (12)"write(15,200)"latmin 83 2 (12)"write(15,200)"latsec 86 3 (13)"
16
write(15,200)"geqprov 91 10" write(15,200)"dpthunt 101 1" write(15,200)"td 105 5 (15)" write(15,200)"formatn 111 12" write(15,200) ifagelu 123 A" write(15,200)"spuddat 128 6 (16)' write(15,200)" " write(15,200)"list" write(15,200)"filel5" write(15,200)" " write(15, 200)"u" write(15,200)"yes" write(15,200)"graspf!2" write(15,200)"no" write(15, 200)"yes" write(15,200)"compdat 1 6 (16)" write(15,200)"agelu 9 A" write(15,200)"agell 13 A" write(15,200)"fmtnl 18 12" write(l5,200)"bopdl 30 5 (15)" write(15,200)"mcfdl 36 6 (16)" write(15,200)"age2u A3 A" write(15,200)"age21 A7 A" write(15,200)"fmtn2 51 12" write(15,200)"bopd2 63 5 (15)" write(15,200)"mcfd2 69 6 (16)" write(15, 200)"age3u 75 A" write(15,200)"age31 79 A" write(15,200)"fmtn3 8A 12" write(15,200)"bopd3 96 5 (15)" write(15,200)"mcfd3 102 6 (16)" write(15,200)" " write(15, 200)"quit" write(15,200)"yes" write(15,200)"ted" write(15,200)"bl r graspfll"
17

wri
te(l
5,2
00)"
li"
wrl
te(1
5,2
00)"
S
E "
wrl
te(1
5,2
00)"
CO
UNTR
Y I
WEL
L W
ELL
/ LO
NG
ITU
DED
tc
E
GEOL
D
PTH
. T
OT
. AG
E SP
UD
"w
rlte
(15,2
00)"
U
NIQ
UE
ID
CODE
T
. W
ELL
ID
NAM
E N
O.
W D
EG.M
IN.S
ECN
tc
.SE
C
PROV
U
NIT
D
PTH
.FO
RM
ATI
ON
CO
DE
DA
TE"
wri
te(1
5,
200)"
"
wrl
te(1
5,2
00)"
tf"
wrl
te(1
5,2
00)"
w g
rasp
fll"
wrl
te(1
5,2
00)"
b2
r
gra
spfl
2"
wrl
te(1
5,2
00)"
ll"
wrl
te(1
5,2
00)"
A
GE
TE
ST
ON
E B
AR
REL
S TH
OU
S A
GE
TE
ST
TWO
BA
RR
ELS
THO
UT
tc
THR
EE
BA
RR
ELS
TH
OU
S" wrl
te(1
5,2
00
)"C
OM
PL
. PE
R
CU
.FT
PE
R
CU
.FT
wrl
te(1
5,2
00
)"D
AT
E
UPP
ER
LO
WER
FR
MTN
DA
Y D
AY
U
PPE
R
LOW
ER
FRM
TN
DA
Y
DA
YE
tcR
FR
MTN
wrl
te(1
5,2
00)"
"
H
wri
te(1
5,2
00
)"tf
" 00
w
rlte
(15,2
00)"
w g
rasp
f!2"
wrl
te(1
5,2
00
)"q"
wrl
te(1
5,2
00)"
lpg
ou
t"99
st
op
end
Output from GRASPWELL
&attachcwd wellmapgraspdefiread lldefi
condlong be 118.000, 120.000longew cs Elat be 10.000, 12.000latns cs N
log!a.and .b .and .c .and .dsear
f 11 el 5 list f 11 el 5
yesgraspfllnouniqid 1 15country 17 4situati 23 1
well id 26 12 wellnam 40 16 wellno 57 3 (i3) longew 62 1 longdeg 65 3 (i3) longmin 69 2 (i2) longsec 72 3 (i3) latns 77 1 latdeg 80 2 (i2) latmin 83 2 (12) latsec 86 3 (i3) geoprov 91 10 dpthunt 101 1 td 105 5 (i5) formatn 111 12 agelu 123 4 spuddat 128 6 (16)
listfile!5u
19

yes
gra
spf!
2no y
esco
mpd
at
1 6
(16)
agel
u
9 4
/ ag
ell
13
4fm
tnl
18 1
2bo
pdl
30
5 (1
5)
mcf
dl
36
6 (1
6)
age2
u 43
4
age2
1 47
4
fmtn
2 51
12
bopd
2 63
5
(15)
mcf
d2
69
6 (1
6)
age3
u 75
4
age3
1 79
4
N>
fmtn
3 84
12
0
bo
pd3
96
5 (1
5)
mcf
d3
102
6 (1
6)
quit
yes
ted
bl
r gra
spfl
l11
S E
NCO
UN
TRY
I
WEL
L W
ELL
/ L
ON
GIT
UD
E
/ L
AT
ITU
DE
L
D
PTH
. T
OT
. A
GE
SPU
DU
NIQ
UE
ID
COD
E T
. W
ELL
ID
NA
ME
NO
. W
DE
G.M
IN.S
EC
S
DE
G.M
IN.S
V
UN
IT
DPT
H.F
OR
MA
TIO
N
COD
E D
ATE
lo
gout
tfgra
spfl
l b2
r
gra
sp£12
11A
GE
TE
ST
ON
E B
AR
REL
S TH
OU
S A
GE
TE
ST
TWO
BA
RR
ELS
THO
US
AG
E T
EST
T
E
BA
RR
ELS
THO
US
CO
MPL
. D
ATE
U
PPE
R
LOW
ER
FRM
TN
DA
Y
DA
Y
UPP
ER
LO
WER
FR
MTN
D
AY
D
AY
U
PPE
R
LOW
ER
Dtc
AY
D
AY
tf
w
g
rasp
f!2
q
logou
t

Appen
dix
F
- A
vail
able
P
roje
cti
on
s -
Cy
lin
dri
cal
Pro
jecti
on
s **
*
a)
Cy
lin
dri
cal
Equid
ista
nt
(CY
LIN
) -
do
es not
pro
ject
data
but
rath
er
dis
pla
ys
coord
inate
sas
th
ey are
. It
chec
ks
lim
its
for
vali
dit
y
and is
u
sefu
l if
li
mit
s are
calc
ula
ted
an
d th
ere
is
p
ote
nti
al
err
or
in sp
ecif
icati
on
.
b)
Mer
cato
r (M
ERC
A)
- A
t all
p
oin
ts
the
scale
is
th
e
sam
e in
all
dir
ecti
ons
but
do
es n
ot
ex
pre
ss
the
vari
an
ce
of
the
separa
tion of
lin
es of
lati
tud
e
and
longit
ude
there
by
g
ivin
g th
e il
lusio
n
of
enla
rged are
as
tow
ard
th
e
po
les*
c)
Ex
act
Cy
lin
dri
cal
Equid
ista
nt
(EX
AC
T)
- S
imil
ar
to
(A)
exce
pt
that
coord
inate
s are
fu
lly
corr
ecte
d
for
ell
ipti
c!t
y
of
the eart
h
and
are
sc
ale
d at
a const
ant
facto
r bas
ed
on la
titu
de
and
longit
ude at
the
map
cen
ter-
to
i-1
d)
Co
rrec
ted
Mer
cato
r (C
OR
RE
) -
Sim
ilar
to
(B)
exce
pt
that
wh
erea
s lo
ngit
ude
lines
are
sti
llse
para
ted
by
a
co
nst
an
t fa
cto
r,
the lo
cal
lati
tud
e
scale
is
corr
ecte
d
at
all
p
oin
ts
for
ell
ipti
cit
y
of
the glo
be.
Ell
ipti
cal
Pro
jecti
on
s **
*
a)
Moll
wei
de
(MD
LLW
) an
eq
ual
are
a m
ap w
ith
para
llel
lines of
const
ant
lati
tude w
hil
eth
e m
eri
dia
ns
(longit
ude)
app
ear
as ell
ipses
equall
y
spac
ed at
the
equato
r.
Dis
tort
ion is
gre
at
near
the
pole
s*
b)
Ait
off
(H
amm
ers)
P
roje
cti
on
(AIT
OF
) -
an
equal
are
a
pro
jecti
on
but
is
not
as
bad
lyd
isto
rted
nea
r th
e pole
s as
th
e M
oll
wei
de.
L
ati
tude li
nes
are
neit
her
para
llel
nor
str
aig
ht,
eq
uall
y
spac
ed only
at
the
map
cen
ter
whil
e m
erid
ians
are
equall
y
spac
ed
at
the
equato
r.
c)
San
son
(Fla
mst
eed
) S
inuso
idal
(SA
NSO
) -
an
equal
are
a
pro
jecti
on
w
ith str
aig
ht,
para
llel
and
equall
y
spac
ed
lin
es
of
const
ant
lati
tude w
hil
e
longit
ude li
nes
are
eq
uall
y
spac
ed at
the
equat
or*
D
isto
rtio
n is
se
vere
n
ear
the
edges
an
d
po
les
d)
Sim
ple
E
llip
tical
(EL
LIP
) -
rese
mb
les
Moll
wei
de
ver
y clo
sely
b
ut
is n
ot
equal
are
aan
d h
as
the
featu
re th
at
lati
tud
e
and
longit
ude
obey
a
sim
ple
eq
uat
ion it
is
thu
s poss
ible
to
re
late
coord
inate
s fr
om
the
pro
jecte
d
data
wit
h
accu
racy
w
ith
ou
t a
fin
e
mes
h gri
d.
Conic
al
Pro
jecti
ons
***
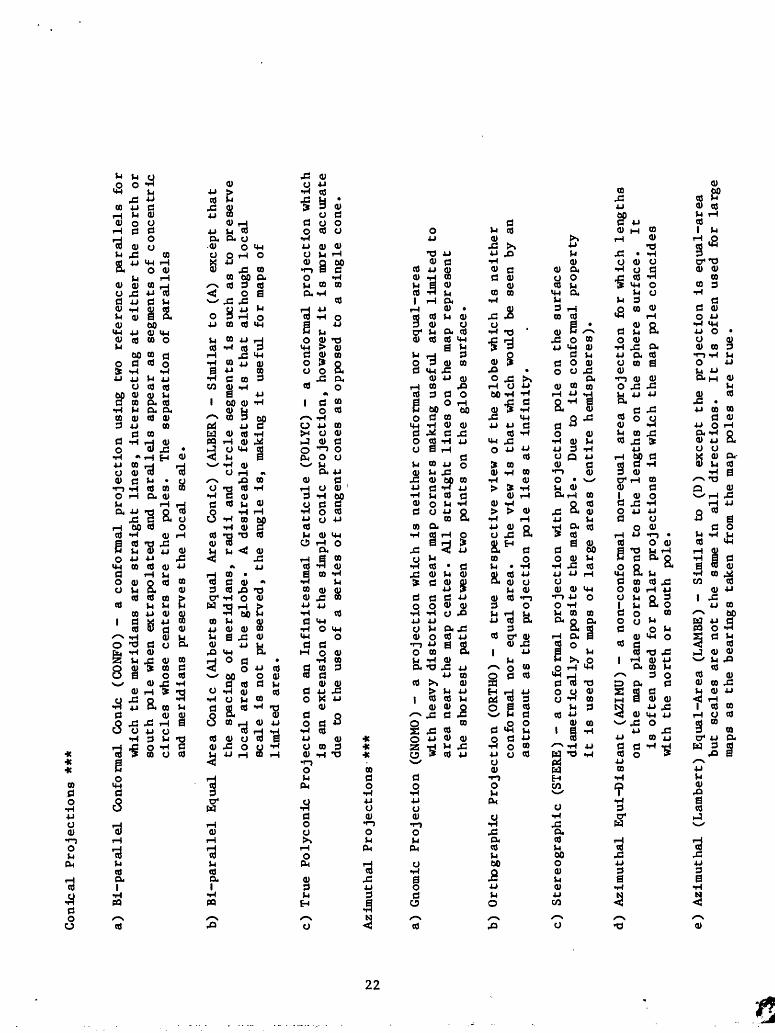
a)
Si-
para
llel
Con
form
al
Con
ic
(CO
NFO
) -
a co
nfo
rmal
pro
jecti
on
usi
ng
two
refe
rence
p
ara
llels
fo
rw
hich
th
e m
erid
ian
s ar
e st
raig
ht
lines,
in
ters
ecti
ng
at
eit
her
the
no
rth
or
south
pole
whe
n ex
trap
ola
ted
an
d para
llels
ap
pea
r as
se
gmen
ts of
concentr
ic
cir
cle
s w
hose
cente
rs
are
the
po
les.
T
he
separa
tion
of
para
llels
an
d m
erid
ians
pre
serv
es
the
local
scale
.
b)
Bi-
para
llel
Equ
al
Are
a C
oni
c (A
lber
ts
Equ
al
Are
a C
onic
) (A
LBER
) -
Sim
ilar
to
(A
) ex
cept
that
the
spac
ing
o
f m
erid
ians,
ra
dii
an
d cir
cle
se
gm
ents
is
su
ch as
to
pre
serv
e lo
cal
area
on
th
e glo
be.
A
desi
reab
le
featu
re is
th
at
alth
ough l
ocal
scale
is
n
ot
pre
serv
ed,
the
angle
is
, m
akin
g it
use
ful
for
map
s of
lim
ited are
a.
c)
Tru
e P
oly
conic
P
roje
cti
on
on
an
In
fin
itesi
mal
Gra
ticu
le
(PO
LYC
) -
a co
nfo
rmal
pro
jecti
on w
hich
is
an
exte
nsi
on
of
the
sim
ple
co
nic
pro
jecti
on,
how
ever
it
is
m
ore
accu
rate
du
e to
th
e us
e of
a se
ries
of
tangen
t co
nes
as
opp
osed
to
a
single
co
ne.
Azi
mut
hal
Pro
jecti
ons
***
a)
Gno
mic
P
roje
cti
on
(G
NO
MO
) -
a pro
jecti
on w
hic
h is
neit
her
confo
rmal
nor
equal-
are
aw
ith
hea
vy dis
tort
ion n
ear
map
corn
ers
mak
ing
use
ful
area
li
mit
ed to
are
a n
ear
the
map
cente
r.
All
st
raig
ht
lines
on
the
map
repre
sent
the
short
est
pat
h
betw
een
two
poin
ts o
n th
e g
lob
e su
rface.
b)
Ort
hog
raphic
P
roje
cti
on
(O
RTH
O)
- a
true
pers
pecti
ve v
iew
of
the
glo
be
whi
ch is
n
eit
her
confo
rmal
n
or
equal
are
a.
The
vi
ew i
s th
at
whi
ch
wou
ld
be
seen
by
an
ast
ron
au
t as
th
e p
roje
cti
on
p
ole
li
es at
infi
nit
y.
c)
Ste
reogra
phic
(S
TE
RE
) -
a co
nfo
rmal
pro
jecti
on
wit
h pro
jecti
on
pole
on
the
surf
ace
dia
metr
icall
y o
pposi
te
the
map
pole
. D
ue
to it
s
confo
rmal
pro
per
ty
it is
use
d
for
map
s o
f la
rge are
as
(enti
re
hem
isp
her
es).
d)
Azi
muth
al
Equi-
Dis
tant
(AZI
MU
) -
a non-c
onfo
rmal
non-e
qual
ar
ea pro
jecti
on
for
whi
ch l
ength
son
th
e m
ap
pla
ne
corr
esp
on
d
to
the
length
s on
th
e sp
her
e su
rface.
Itis
oft
en
used
fo
r pola
r pro
jecti
ons
in w
hich
th
e m
ap
po
le coin
cid
es
wit
h th
e n
ort
h o
r so
uth
pole
.
e)
Azi
muth
al
(Lam
ber
t)
Equal
-Are
a (L
AM
BE)
-
Sim
ilar
to
(D
) ex
cep
t th
e pro
jecti
on is
equal-
are
abut
scale
s ar
e n
ot
the
sam
e in
all
d
irecti
on
s.
It is
o
ften
use
d
for
larg
e m
aps
as
the
bea
rin
gs
taken
fr
om
the
map
pole
s ar
e tr
ue.

Appendix G
- Subroutines Employed-
A. setup__calcomp and setup_tektronix__tcs
Used to prepare the program to interface with standard CALCOMP and
Tektronix-supplied software.
B. ioa_$nnl
Is an entry point to the ioa__subroutine and is used to format the data
string entered at the terminal and write the resulting string to the user
output switch.
C. add__search_rules(asr) and delete__search_rules(dsr)
Used to modify the current "search rules" established by the users
start__up.ec or those acquired by default as well as to reset them upon
termination.
D. close_file
Closes specified Fortran files opened by the program.
23

Bibliography
Bowen, R.W., Botbol, J.M, 1976, GRASP: The Geologic Retrieval and Synopsis
Program, a portable data retrieval system: U.S. Geological Survey Professional
Paper 966.
Cukrowicz, Ron, 1980, PICT: a subprogram of the GEO/PLOT system for plotting
oil and gas well symbols: Cities Services Company internal report, May.
Turner, Robert M., Mappit: a user-oriented program for display of point and
line data on geographic base maps: U.S.Geological Survey Open-File Report,
(in preparation).
24