Wellman Field Case History - CO2 & ROZ … 11 - 13, 2013 Wellman Field Case History 2 Midland, Texas...
24
December 11 - 13, 2013 Wellman Field Case History Midland, Texas Presented at the 19 th Annual CO2 Flooding Conference Bruce Howard – VP Engineering Trinity EOR, LLC
-
Upload
doankhuong -
Category
Documents
-
view
214 -
download
0
Transcript of Wellman Field Case History - CO2 & ROZ … 11 - 13, 2013 Wellman Field Case History 2 Midland, Texas...

December 11 - 13, 2013
Wellman Field Case History
2
Midland, Texas
Presented at the 19th Annual CO2 Flooding Conference
Bruce Howard – VP Engineering
Trinity EOR, LLC

Wellman Field Case History
Locator Map and Geologic Overview
Reservoir Properties Summary
Primary Flood Summary
Secondary Flood Summary
Tertiary Flood
Overview of Process
Brief History
Forecasting Production
Well work Overview
Future Plans
Summary / Conclusions
2
Presentation Outline
Wellman Unit Locator Map
3
22
[TRINITY TO INSERT MAP SHOWING
HIGH LEVEL LOCATION OF WELLMAN] Wellman
Unit
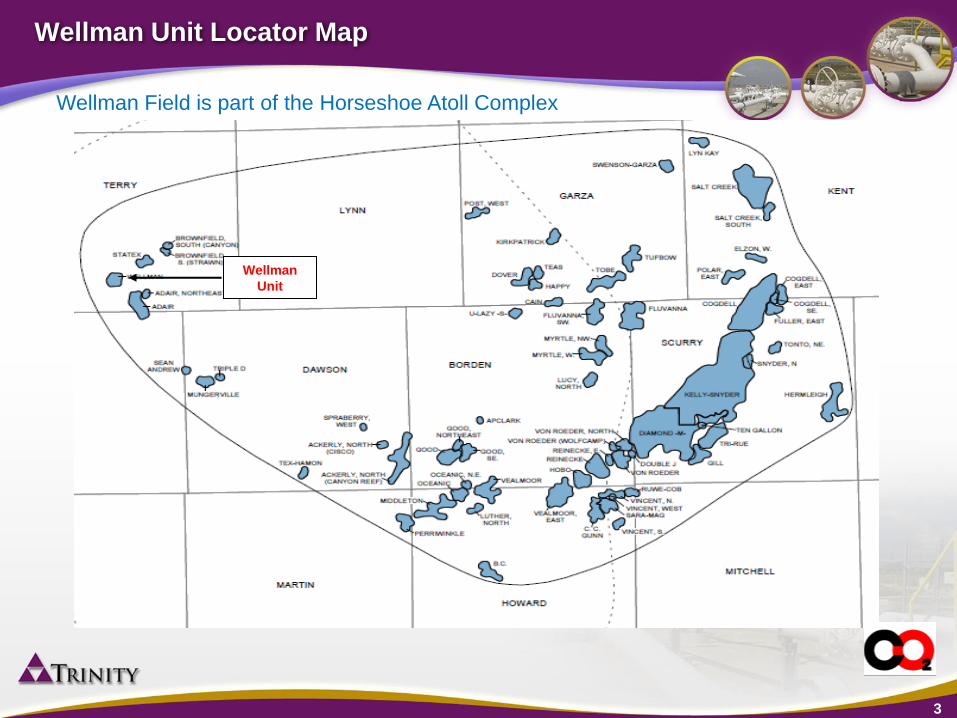
Wellman Field is part of the Horseshoe Atoll Complex

Pinnacle Reef structure of 2100 Acres
Wolfcamp / Cisco formation at a depth
of approximately 9200’ - 10,000’
Limestone with a 8.5% average
porosity and an OOIP of 127 MMSTB
Extensive exposure and erosion
Vugular porosity is a large part of the
storage and delivery system
Evidence of widespread fracturing
Fracture porosity is a small part of the
storage but a large part of the delivery
system
Some sections of intercrystalline
porosity
Intercrystalline porosity is a small part
of the storage and delivery system
Two main pinnacles with vertical relief
of over 800’
Limited active Permian /Pennsylvanian
water drive
4
26
N S
E
W
Wellman Field Geological Summary

Wellman Field Reservoir Properties Summary
Original Oil in Place = 127 MMSTB
Original O/W Contact = -6680’ ss
Maximum Oil Column Thickness = 824’
Average Porosity = 8.5%
Initial Water Saturation = 20%
Residual Oil Saturation to Water = 35%
Average Core Permeability = 135 md
Initial Reservoir Pressure = 4105 psi, Oil Bubblepoint = 1250 psi
Initial Reservoir Temperature = 151o F
Initial Oil Gravity = 43.5 API, Water Specific Gravity = 1.13
Initial Oil Formation Volume Factor = 1.3, Initial Solution Gas Oil Ratio = 405 Scf/STB
Initial Oil Viscosity = 0.43 cp, MMP (100% CO2) = 1600 +/- 50 psi
Vertical Core Flood Oil Saturation to CO2 < 10%
5

1
10
100
1,000
10,000
1950 1955 1960 1965 1970 1975 1980
DA
ILY
RA
TE
S
Oil BOPD
Produced TotGas MCFPD
Produced Water BWPD
HCGOR
Oil Recovery
Avg Resv Pressure
Wellman Field Primary Production History
Primary production started
in 1950 unitized in 1978
Reservoir pressure initially
dropped from 4105 to 3000
psi until the 3000 B/D Oil
allowable was established
The allowable lowered to
1500 B/D and pressure
slowly increased to 3100
psi
The allowable was
increased to 7500 B/D in
1966 reservoir pressure
dropped below the 1250
psi bubblepoint by 1976
Field producing GOR
remained fairly low
High vertical permeability
likely caused a secondary
gas cap to form
Recovery during this
period was 33% of OOIP
6
6000 BOPD Initial Peak Rate
3000 then 1500 BOPD Allowable
Allowable Lifted

Wellman Field Secondary Production Summary
Started makeup water
injection 6/1979 with 4
wells below OWC
Pressure increased
from 1050 to 1600 psi
by 1983 (end of
Waterflood Only
Period)
Field remained at top
allowable of 9300
BOPD for most of this
period
Bottom water flood
moved the Oil Water
contact from -6680’ to
-6300’ss
Incremental recovery
during this period was
11% of OOIP (44%
P+S)
Calculated volumetric
sweep efficiency of
93%
7
10
100
1,000
1,000
10,000
100,000
1979 1980 1981 1982 1983
HC
GO
R,
Reco
very
% O
OIP
DA
ILY
RA
TE
S,
B/D
MC
F/D
Oil BOPD
Produced TotGas MCFPD
Produced Water BWPD
Water Inj BWIPD
Avg Resrv Press
HCGOR
Oil Recovery

Wellman Unit Vertical CO2 Flood Overview
8
Overview Vertical CO2 Flood
Vertical CO2 flood where CO2 is injected
into the top of the structure and
mobilizes waterflood residual oil from the
rock as the CO2 contact moves down
through the formation creating an oil-
column between the CO2 (above) and
water (below)
Producing wells are completed near the
oil-column and then recompleted deeper
over time, as the CO2-oil contact is
moved deeper
Oil production is expected to continue to
grow as the oil column is thickened and
additional temporarily abandoned wells
are returned to production
Wellman’s performance and geology has
been well-documented by the EOR
industry and is considered one of the
best performing CO2 floods on record
― SPE papers 11129, 22898 and 48948
23
100
1,000
10,000
100,000
100
1,000
10,000
100,000
1983 1984 1985 1986 1987 1988 1989 1990 1991 1992 1993 1994 1995 1996 1997 1998 1999 2000 2001 2002 2003 2004 2005 2006 2007 2008 2009 2010 2011 2012 2013 2014
Oil R
ate
, H
C G
OR
, R
eco
very
% O
OIP
Daily W
ate
r an
d C
O2 R
ate
s
Produced TotGas MCFPD CO2 Purchase MCFPD
Produced Water BWPD Water Inj BWIPD
CO2 Inj MCFPD CO2 Sales MCFPD
Oil Recovery Oil BOPD
Avg Reserv Press
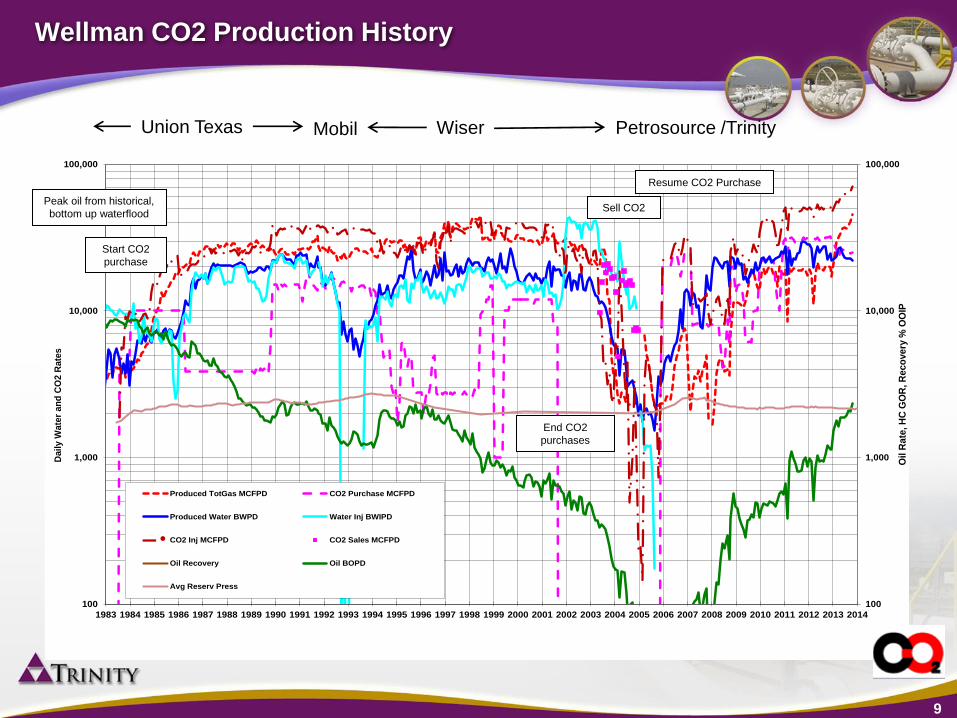
Wellman CO2 Production History
9
Peak oil from historical,
bottom up waterflood
End CO2
purchases
Sell CO2
Resume CO2 Purchase
Union Texas Mobil Wiser Petrosource /Trinity
Start CO2
purchase

10
100
1,000
10,000
100
1,000
10,000
100,000
2004 2005 2006 2007 2008 2009 2010 2011 2012 2013 2014
Oil R
ate
, H
C G
OR
, R
eco
very
% O
OIP
Daily W
ate
r an
d C
O2 R
ate
s
Produced TotGas MCFPD CO2 Purchase MCFPD
Produced Water BWPD Water Inj BWIPD
CO2 Inj MCFPD CO2 Sales MCFPD
Oil BOPD Oil Recovery
Wellman Recent CO2 Production History
10

Wellman Calculated Contact History
11
26
Nearing maximum column thickness
Current OWC -6510’ Initial CO2
Injection
CO2 Blow
down
CO2 Purchases

Brief Wellman CO2 Teritiary Flood History
Started in 1983 by Union Texas with 3 Crestal Injectors
CO2 Purchase rates ranged 4 - 15 MMcf/D, averaging 8.2 MMcf/D
Recycled CO2 rates varied from 3 - 27 MMcf/D, averaging 18 MMcf/D
Oil production dropped during this period from 8500 to 2000 BOPD, averaging 4440 BOPD
Active water injection in the reef drove the O/W up from -6300’ to -6150’ ss
Sporadic and ineffective completions limited ability to produce the oil column
Oil column during this period shrank from 400’ to 20’
Operated by Mobil from 9/1991 to 10/1993
CO2 purchase rates ranged 15 - 18 MMcf/D, averaging 16 MMcf/D
Recycled CO2 rates varied from 23 -27 MMcf/D, averaging 25 MMcf/D
Oil production dropped during this period from 2000 to 1200 BOPD, averaging 1480 BOPD
Water Re-injection continued and the O/W moved down from -6150’ to -6250’ ss
Little to no well work was done to recomplete producers into the oil column
Oil column during this period grew slightly from 20’ to 25’
12

Brief Wellman CO2 Tertiary Flood History
Operated by Wiser Oil Co from 10/1993 until 3/2005
CO2 Purchase rates ranged 5 - 15 MMCFPD until 10/2001 when purchase was stopped, 6.8 MMcf/D average
CO2 Production rates ranged 2 - 21 MMCFPD during CO2 blown down from 5/2003 to 3/2005, 3.4 MMcf/D average
Oil production dropped during this period varied from 50 to 2200 BOPD, averaging 1100 BOPD
The O/W contact moved from -6300’ to -6380’ ss until CO2 blowdown, where it ended at -6314’
Wiser was active working over many wells during this period
Oil column during this period shrank from 25’ to 0’
Operated by Petrosource / Sandridge / Trinity from 3/2005 until Present
CO2 blowdown was immediately stopped and CO2 purchases resumed
Oil production increased during this period from 17 to 2300 BOPD, averaging 1100 BOPD
The O/W contact lowered from -6380’ to -6510’ ss with higher CO2 purchase volumes and disposal of all produced water
Over 16 producers have been returned to production
Over 50 Plugdowns have been successfully executed since 2006
Oil Column during this period has grown from 0’ to 45’
o This thicker oil column has allowed for much higher per well rates
o The “average” oil column producer at Wellman now makes over 200 BOPD
13

Wellman Performance Model
14
26
Tank Model – Primary Inputs
Producing well count
CO2 purchases
Water withdrawal
Waterflood Residual Oil Sat, Sorw = Srw = 0.35
CO2 Flood Residual Oil Sat, Sorc = 0.105
Reservoir Pressure current 2200 psi
Pore volume vs Depth
Tank Model – Primary Calculations
CO2 contact depth
Water contact depth
Oil column thickness
Oil column correlations used
o BOE/d per well
o Total GOR
o BW/d per well
Oil, water and gas production forecast, SPE 22898
o Vo = (Sorw – Sorc) iCO2 BCO2 / (Bo ΔS)
o ΔS = (1- Srw – Sorc)
Correlations used as model inputs have proven very reliable
0
10
20
30
40
50
60
70
80
90
100
110
120
130
140
150
160
170
180
190
200
0 10 20 30 40 50 60
Oil P
rod
ucti
on
Ra
te (B
OP
D/w
ell)
Estimated Oil Column Thickness (feet)
Oil Column Thickness vs Oil Rate Per Well
Forecast 1983-1990 1991-1997 2006-Present

Wellman Modeled Forecast vs Actuals
15
Highly accurate tank model relative to historic results
10
100
1,000
10,000
2000 2002 2004 2006 2008 2010 2012 2014 2016 2018 2020
Wellman Unit - Planned 2015 Plant Start
Produced Oil BOPD Oil Forecast
Actual performance has confirmed
the tank model accurately
forecasts future production rates
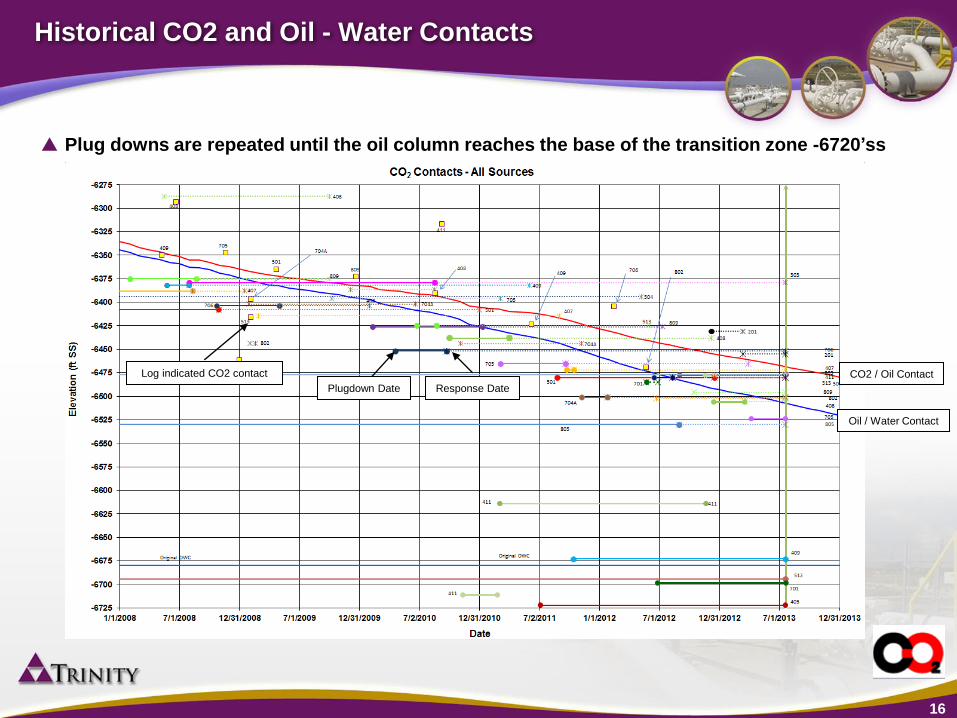
Historical CO2 and Oil - Water Contacts
16
Plug downs are repeated until the oil column reaches the base of the transition zone -6720’ss
Log indicated CO2 contact
Plugdown Date Response Date
CO2 / Oil Contact
Oil / Water Contact
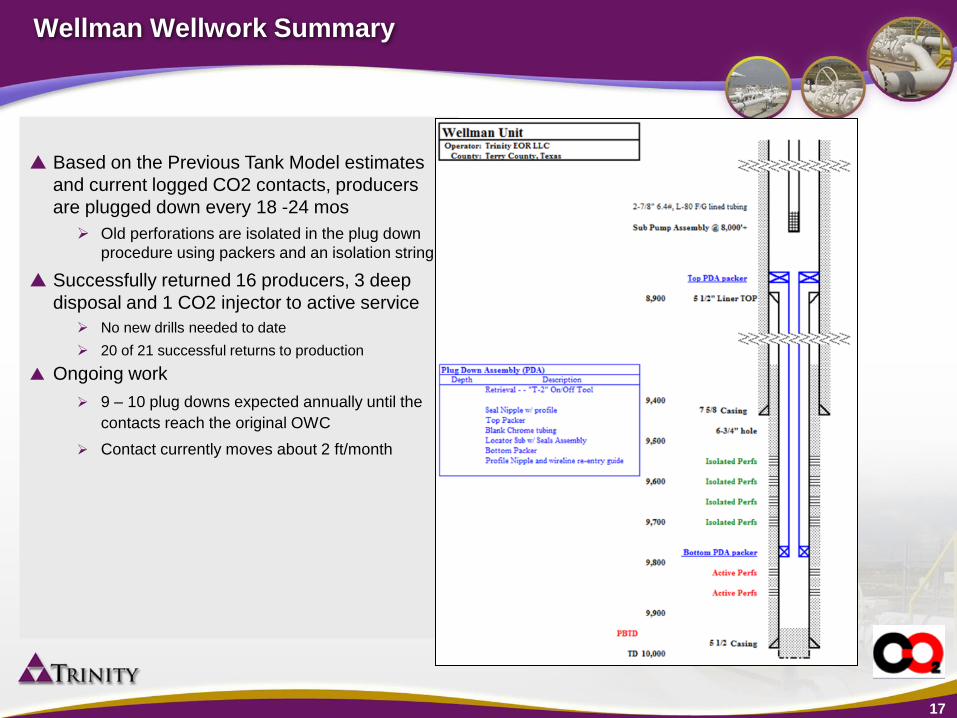
Wellman Wellwork Summary
17
30
Based on the Previous Tank Model estimates
and current logged CO2 contacts, producers
are plugged down every 18 -24 mos
Old perforations are isolated in the plug down
procedure using packers and an isolation string
Successfully returned 16 producers, 3 deep
disposal and 1 CO2 injector to active service
No new drills needed to date
20 of 21 successful returns to production
Ongoing work
9 – 10 plug downs expected annually until the
contacts reach the original OWC
Contact currently moves about 2 ft/month

Wellman Unit Operations Overview
18
In service – April 2011
Design Capacity – 4,000 BOPD | 40,000 BWPD | 50 MMcf/d
Wellman Central Tank Battery
22

Wellman Unit Future Plans
Compression expansion complete by March 2014
Return all required Wells to Production / Injection by December 2015
NGL Recovery Plant complete by January 2015
19

Wellman Unit Future Plans, Compression Expansion
20
Recycle Compression
22
Current Capacity of 45 MMcf/d
Expanding to 50 MMcf/d by March 2014

Wellman Future Plans, Return to Production
21
Successfully returned 16 producers,
3 deep disposal and 1 CO2 injector
to active service
No new drills needed to date
20 of 21 successful returns to
production
19 of 28 total wells planned for
reactivation completed to date
9 additional wells are scheduled for
return to production to complete
project development (4) in 2013, (3)
in 2014, (2) in 2015
22
14
39
21
13
22
12
08
66-
0866-
08
66-
-66
80
- 6680
-6
68
0
08
66-
OW
C
SWD
SWD
SWD
SWD
SWD
G
G
G
SWD
SWD
G
202
Edwards 1Edwards 1A
507
406 503405 505
602512407
510
404502
302W
403601
410 504
513411
408
508401301
402501
506303
CO Scales 1409511
809
201
801
804
Scales 1701 703705
810 706204
704A
704203
805802702
807A808101 803
807
806
Lyons 1
509
405-ST
203-ST
408-ST
409-ST
510-ST
805-ST
807-ST
Burnett 1
801-ST Proposed
FEET
0 1,000
AFE prepared
SWD Deep
SWD Shallow
monitor well
Return to Production Candidate
Water Withdrawal well
CO2 injector
oil well
PETRA 7/19/2013 3:56:01 PM
Most Wellman well work substantially completed

Wellman Unit Future Plans NGL Plant
22
19
Finalizing the evaluation of construction
and design options for the installation of
a 50 MMcf/d inlet capacity NGL plant to
process rich Wellman NGL stream
currently being re-injected
Add on to our existing recycle compression
scheme, taking the gas stream from the
2nd stage discharge and returning to the 3rd
stage suction
Designed to maximize the recovery of the
C4+ and provide C5+ for crude blending
for sale into the crude line.
A truck rack with NGL bullets will be
constructed
NGL sales line is also being evaluated
3rd party owned and operated with fee
taken as a percentage of the production
Expected max NGL rate of over 1000 B/D
1st Stage 2nd Stage 3rd Stage
NGL Recovery
Plant
CO2 Rich Gas
to Re-injection
(~1700 psi)
Inlet Gas
from Battery
(~160 psi)
NGL
Sales
Stabilized NGL
to Crude Sales
Plant Bypass Valve

Wellman Unit Summary / Conclusions
The Wolfcamp Reservoir in Wellman has performed in almost a tank like manner under
Water and CO2 flooding
A world class reservoir that will recover almost 80% of OOIP
Almost all capital investment has been made reach over 3000 BOPD and 1000 Bbl NGL /
Day in 2015
The field will have almost new facilities
Almost all required producing wells have been returned to production
Trinity has a good track record of plugging down to stay in the oil column
23

Wellman Unit Acknowledgments
Thanks to the Following Trinity Team Members for making this possible
Trinity Management Team for Permission to share the story
Greg West and John Milam – Architects of the current flood strategy
Jerry Metcalf and his Field Team – Amazing track record in a difficult environment
Dean Soderstrom – Senior Project Engineer, Bob Altany – Senior Geologist
Bill Harryman – Senior Engineering Technician
24