We’ll help you get there
67
We’ll help you get there CREDIT UNION 20 11 annual report
Transcript of We’ll help you get there

We’ll help you get there
C R E D I T U N I O N
2011
annual report

1
TABLE OF CONTENTS
Message from Board of Directors’ President and CEO .................................................................................. 2
Dedicated to our members ............................................................................................................................ 4
Board of Directors .......................................................................................................................................... 5
Management discussion and analysis ........................................................................................................... 6
Management of risk ..................................................................................................................................... 19
Management’s responsibility ....................................................................................................................... 22
Independent auditors’ report ........................................................................................................................ 23
Consolidated financial statements ............................................................................................................... 24
Notes to the consolidated financial statements ............................................................................................ 29
Credit Union Deposit Guarantee Corporation .............................................................................................. 64
Officers and branch locations ...................................................................................................................... 65

2
MESSAGE FROM THE PRESIDENT, BOARD OF DIRECTORS AND FROM THE CHIEF
EXECUTIVE OFFICER It is our privilege to present TCU Financial Group Credit Union’s 2011 Annual Report on behalf of
your Board of Directors.
Delivering to our Members
Amidst a very challenging global economic environment, TCU Financial Group Credit Union
(TCU) accomplished market leading growth on both sides of the balance sheet, and solid financial
results in 2011. It was indeed a very exceptional year for TCU as we delivered value to our members
on many levels.
We enhanced our online banking delivery channel with the introduction of time-saving, user friendly
and convenient features such as mobile banking access and form pre-population. Our suite of
products and services were also improved by the introduction of CHIP Card technology for our
MemberCards, and increased mortgage payment options which provided our members with an
opportunity to save time and money.
Our members continue to benefit from the improvements that we have made in terms of
operational efficiency. The savings from those efficiency improvements allowed us to provide great
service and competitive pricing to our members.
The Board of Directors reviewed TCU’s vision and commitment statements which contributed to
the development and introduction of a revised statement. Our new Purpose, Promise and Passion
statement, along with the Guiding Principles that were established in 2010, serve as the foundation
for all decisions made at TCU. In summary, these documents map out our commitment to provide
outstanding service and overall value to our membership.
Our team of professionals at TCU Wealth Management Inc. was proud to accomplish a milestone
achievement in 2011 by surpassing the $100 million mark of assets under administration. This is
indeed a testament to the superior advice and to the quality of financial solutions that are provided
to their clients.
Positioning for the Future
We are planning for another busy and eventful year in 2012 as we introduce new member service
technologies that will provide for increased convenience and accessibility. Extended hours of service
will be a priority consideration for later in the year. Furthermore, we are excited to be celebrating
our 60th anniversary in 2012, which coincidently has been declared the “International Year of Co-
operatives”.
3
Keys to success
Members are the heart of our business. TCU will continue to improve our offerings and continue to
find ways to differentiate TCU in the market.
One of the keys to success is continual improvement and constant innovation to take advantage of
current and new technologies. The same holds true for our business – we believe that having the
right systems in place over time will help achieve our goals. That’s why we see tremendous potential
for success in the programs and future online enhancements that TCU has in place.
Another key to our success is our culture and our staff. We have made a commitment to ensure that
TCU is a great place to work. TCU continues to ensure that our staff has the training, professional
development and resources available to remain focused on providing outstanding service and the
expertise to enable our members to realize their financial potential.
Our People
We are fortunate to have great people at TCU, who are the envy of the financial industry.
Accordingly, we would like to take this opportunity to thank all of the Board of Directors and the
Staff for their enthusiasm and contributions to our success throughout 2011. This level of
commitment and expertise will ensure that TCU will continue helping our members reach their
financial potential.
We also want to take this opportunity to acknowledge and congratulate Lyle Hislop, who retired
from the Board in 2011 after 18 years of service to TCU. Lyle served as a Board Member, Vice-
President and President, and we would like to thank him for his contribution to the Board and to
TCU’s success.
Respectfully,
Dwight Kaytor Morris Smysnuik President Chief Executive Officer
4
DEDICATED TO OUR MEMBERS
TCU Financial Group is a Saskatchewan based Credit Union providing a full suite of financial
products and services to the residents, organizations and businesses of Saskatchewan.
OUR PURPOSE
Helping you realize your financial potential.
OUR PASSION
Building a lifelong relationship with you by delivering progressive financial solutions in support of
what is important to you.
OUR PROMISE
As your trusted financial partner, we will provide you with a “value added” experience. Ultimately
we consider ourselves successful when we help you achieve your financial goals and potential. Our
tag line says it best - “We’ll help you get there”.
We add value and help you reach your financial goals by:
Providing outstanding service:
Understanding and even anticipating your needs and wowing you repeatedly with our advice & solutions
Making our products and services available to you when, where and how you want them – whether that be in branch, online, or from your mobile device
Providing products and services that are easy to understand and use
Being accountable to you
Treating you as an individual not a number
Serving you with care and respect
Offering great pricing:
Pricing is based on our relationship with you. The more business conducted with TCU, the greater your opportunity for higher earnings on investments or savings on loans.
Interest Rates and Service Charges will be competitive within the marketplace. Our rates and fees will be comparable to our competitors and at times and with certain products TCU will offer the best price in the marketplace.

5
BOARD OF DIRECTORS
In 2011, TCU’s Board of Directors consisted of ten members – four from Regina and six from
Saskatoon. The Board held six regular Board meetings, one strategic planning meeting and 20
various Board committee meetings. Our Board of Directors is committed to maintaining focus on
the members, the communities we serve and the financial sustainability of TCU Financial Group
Credit Union.
Dwight Kaytor Earl Warwick President Vice President Regina Saskatoon Term Expires: 2013 Term Expires: 2012
Kerry Bachiu Denis Caron Derwyn Crozier-Smith Jennifer Evancio Regina Saskatoon Saskatoon Regina Term Expires: 2014 Term Expires: 2014 Term Expires: 2013 Term Expires: 2013
Tony Linner Darcy McLean Helen Sukovieff Joanne Weninger Saskatoon Saskatoon Regina Saskatoon Term Expires: 2012 Term Expires: 2014 Term Expires: 2013 Term Expires: 2012

6
MANAGEMENT DISCUSSION & ANALYSIS
The Management Discussion & Analysis (MD & A) is presented to enable readers to assess material
changes in the financial conditions and operating results of TCU Financial Group Credit Union for
the year ended December 31, 2011, compared with prior years. This MD & A is prepared in
conjunction with the Consolidated Financial Statements and related Notes for the year ended
December 31, 2011, and should be read together. Unless otherwise indicated, all amounts are
expressed in Canadian dollars and have been primarily derived from the Credit Union’s annual
Consolidated Financial Statements prepared in accordance with the International Financial
Reporting Standards (IFRS). The amounts for 2010 have been restated in accordance with IFRS.
Corporate profile
TCU Financial Group Credit Union (TCU) is a Saskatchewan Credit Union regulated by The Credit
Union Act (1998) and The Credit Union Regulations (1999). TCU must also comply with the Credit
Union Deposit Guarantee Corporation’s (CUDGC) Standards of Sound Business Practices, and
with our own articles, bylaws and policies. The Board of Directors is ultimately responsible for
ensuring that TCU is managed and operated in a sound and prudent manner. TCU’s management is
responsible for managing, monitoring and controlling credit union operations in accordance with the
legislation, the standards and Board policy.
TCU’s mandate is to provide our members with a full range of financial products and services,
which includes banking and wealth management services. These products and services will be
delivered through one of the following business units of the credit union:
The Credit Union provides the traditional retail banking services and products such as consumer
and business loans, consumer and business deposit account products, ATM, and internet
banking facilities.
TCU Wealth Management Inc. is a wholly-owned subsidiary of TCU and provides wealth
management services such as mutual funds, securities brokerage, estate and financial planning.
TCU Holdings Inc. is also a wholly-owned subsidiary of TCU, and holds and manages all the
TCU buildings and land.
TCU is one of the top ten credit unions in Saskatchewan, and has assets just over $513,494,000. In
addition, TCU has assets under administration of $16,589,000 in syndicated loans. TCU Wealth
Management Inc. has assets under administration of $101,004,000.
TCU and TCU Wealth Management Inc. serves 18,800 members through four retail branch
locations in Regina and Saskatoon. Head office is located in Saskatoon.

7
GOVERNANCE
As a financial co-operative, TCU Financial Group Credit Union is governed by a Board of Directors
which is comprised of ten Directors, all of whom are independent. The functions of the Board
includes the sanctioning of strategic business plans, corporate mission, vision, values and guiding
principles; monitoring corporate performance against strategic business plans; overseeing the
operations; ensuring compliance with laws and regulations; keeping members informed regarding
plans, strategies and performance of the Credit Union; performance management and compensation
of the CEO; and other related matters as they may arise. During 2011, the Board of Directors held
six regular meetings and one strategic planning meeting.
The Board of Directors has also formed five committees to assist with the governance process.
Audit & Risk Management Committee – The purpose of this committee is to provide independent
oversight of the credit union’s operations and to ensure the accuracy, integrity, security, prudence
and legality of its financial transactions and records. Additionally, this committee works closely with
the Internal Audit & Risk Management Department to oversee the enterprise risk management
process and to ensure the adequacy of internal controls and compliance to the various regulatory
requirements. During 2011, the Audit & Risk Management Committee was comprised of five
Directors and met five times.
Governance & Policy Committee – The purpose of this committee is to ensure that an appropriate
governance structure is in place; to oversee the Board of Directors election process; and the Board
evaluation and development process. Additionally, this committee works closely with Executive
Management to formulate policies and practices to meet the needs of our members, staff and the
corporate entity. During 2011, the Governance & Policy Committee was comprised of five
Directors and met five times.
Conduct Review Committee – The purpose of this committee is to ensure the integrity and
objectivity of its directors, officers and employees. This committee monitors and reviews related
party transactions with the Credit Union to ensure they are fair to the Credit Union and that best
judgment is exercised in all matters or related party relationships as a result of real or perceived
conflict of interest. In 2011, this committee was comprised of the entire Board of Directors of TCU
Financial Group Credit Union. The Board reviews the conduct review report during the course of a
regular Board meeting.
Executive Committee – The purpose of this committee is to act in the capacity of, and on behalf of
the Board of Directors between regular or special Board meetings on all Board matters except those
which the board may not, in compliance with legislative requirements, delegate. Additionally, this
committee sets the Board of Director’s regular meeting and planning meeting agendas. The

8
Executive Committee consists of the President and Vice-President of the Board of Directors and
the Chief Executive Officer. During 2011, this committee met five times.
CEO Compensation & Performance Evaluation Committee – The purpose of this committee is to
ensure that a fair, equitable and competitive compensation program is provided for the CEO.
Additionally, this committee conducts the CEO performance evaluation process and sets the
performance plan for the following year. The CEO Compensation & Performance Evaluation
Committee consists of four members of the Board of Directors which are the President, Vice-
President, Chair of the Audit & Risk Management Committee and Chair of the Governance &
Policy Committee. During 2011, this committee met five times.
MANAGEMENT STRUCTURE
In addition to the Board of Directors Committees, the management structures consist of the
following:
Executive Management – Executive Management is responsible to oversee the operation of the
Credit Union and its subsidiaries as directed through the strategic plan and policies approved by the
Board of Directors. Additionally, the Executive Management is responsible for developing processes
that identify measures, and monitor and control risks. TCU has an extensive enterprise risk
management process and reports risk management performance to the Board through the Audit &
Risk Management Committee. Executive Committee consists of the Chief Executive Officer,
Executive Manager-Retail Banking, Executive Manager-Finance & Accounting, Executive Manager-
Corporate Services, Executive Manager-Business Strategies & Innovation and the Senior Manager –
Internal Audit & Risk Management.
Asset Liability Management Committee (ALCO) – The ALCO committee is responsible for
understanding, monitoring and managing interest rate risk, liquidity risk, capital adequacy risk and
management of strategies in terms of the overall balance sheet structure focusing on achieving
financial targets and capital optimization. The ALCO Committee, which reports to the Audit & Risk
Management Committee, met seven times during 2011.
Subsidiary Companies – TCU Financial Group Credit Union has two wholly owned subsidiary
companies – TCU Wealth Management Inc. and TCU Holdings Inc. Information regarding these
two subsidiary companies is provided in a separate section in this report.
9
BUSINESS ENVIRONMENT
While the global economic outlook has become increasingly uncertain, the economy in
Saskatchewan continues to buck the trends that are happening worldwide. A number of major
economic forecasters expect that Saskatchewan will lead most provinces in economic growth for
2012 and 2013. Employers in Regina and Saskatoon expect staff levels to increase or at least stay the
same in the early part of 2012. In 2011, City of Saskatoon issued almost $1 billion in building
permits, and Regina wasn’t far behind.
TCU Financial Group Credit Union and its subsidiary companies operate primarily in the two major
markets in Saskatchewan, that being Regina and Saskatoon. The strength of the Saskatchewan
economy, and particularly the growth experienced in our two major markets, bodes well for TCU’s
future. However, we should not discount the impact of what is happening worldwide, particularly in
Europe, the United States and even some parts of Canada. The faltering economies in those regions,
and the subsequent actions of regulators and central bankers, do have a significant impact on our
operation in terms of interest rates, capital market and currency fluctuations. Add to this the fiercely
competitive environment in which we operate will mean that TCU will face challenges in 2012.
In terms of the immediate future, the Bank of Canada has reduced their economic growth forecasts
for the next two years and the International Monetary Fund expects debt as a percentage of Gross
Domestic Product (GDP) to continue to rise for the G12 and other countries through 2013. What
this means is continued instability in the financial markets, and low interest rates.
Canada is not immune to international developments, however, our economy is relatively sound as
compared to our key trading partners and our banking and financial systems is currently considered
a model for others to emulate. Of particular concern to the Bank of Canada is the growing level of
household debt as a potentially serious problem if interest rates rise.
Therefore, the inevitable question turns to determine when interest rates will rise. Ultimately, the
rate of inflation will continue to be a critically important element in the Bank of Canada’s decisions
about interest rates. Analysis of current data and the current rate of inflation, which is below the
intervention standard set by the Bank of Canada, suggest no major shift in the way monetary policy
is conducted in Canada. We anticipate that interest rates will most likely continue to be low for 2012
and even into 2013.

10
Financial performance review
TCU Financial Group
Balance sheet assets at December 31, 2011 were at $513,494,000 as compared to $436,041,000 at the
end of 2010 representing 17.76% growth, as compared to 1.71% growth in 2010. The significant
growth in assets in 2011 can be attributed to a substantial growth in member deposits.
Total balance sheet member loans at December 31, 2011 were at $390,727,000 as compared to
$341,668,000 at the end of 2010, representing 14.36% growth as compared to 8.37% growth in
2010.
Syndicated Loans under administration (TCU member loans sold to other credit unions) at
December 31, 2011 were at $16,589,000, as compared to $22,119,000 at end of 2010. The decrease is
representative of loan payments being made against the syndicated loans. In addition, TCU did not
syndicate any loans in 2011. In 2009, TCU securitized a number of mortgage loans through the
Canada Mortgage & Housing Corporation’s Canada Mortgage Bond Program administered through
Concentra Financial. The balance outstanding at December 31, 2011 was $9,908,000.
TCU’s loan portfolio is weighted predominantly towards stable, lower risk personal and mortgage
loans. Mortgage loans and mortgage secured line of credit loans account for 73% of our loan
portfolio. Our commercial loan portfolio accounts for 18% of our total loan portfolio. The
following graph will provide a breakdown of our balance sheet loans portfolio. The commentary in
brackets behind each category identifies the risk rating for this group of loans.
60% 13%
3% 6%
18%
2011
Mortgage Loans (low)
Mortgage Loans - LCL (low)
Regular LCL - (low to med)
All Other Personal Loans (low to med)
Business Loans (med to high)
57%
17%
2% 6%
18%
2010
Mortgage Loans (low)
Mortgage Loans - LCL (low)
Regular LCL - (low to med)
All Other Personal Loans (low to med)
Business Loans (med to high)

11
Total balance sheet member deposits at December 31, 2011 were at $463,012,000, as compared to
$387,171,000 at the end of 2010, representing 19.59% growth as compared to 1.40% growth in 2010.
Member deposit growth substantially exceeded our expectations. A booming economy in
Saskatchewan and a very unstable and volatile financial market contributed to this significant
growth.
Most of TCU’s member deposits are concentrated in the higher rate investment type accounts. The
following graph provides the breakdown of our member deposits in the various demand and
investment products.
Liquidity
TCU’s loan to asset ratio as at December 31, 2011 was at 76.09%, as compared to 78.36% at the end
of 2010. This is below our liquidity risk management policy range of 79% to 81%.
During 2011, our loan demand was steady and resulted in an increase in our loans receivable balance
of 14.36%. We anticipate the same kind of loan activity for 2012 and are budgeting for an 11%
growth in member loans for 2012.
Acquiring deposits from our members continues to be a high priority, and will be even more so for
2012. We will need to grow our member deposits in order to meet the anticipated loan demand.
28%
9% 42%
18% 3%
2011
Demand Deposits
Investment Savings Account
Term Deposits/GICs
Registered Plans
TFSAs
27%
13% 37%
20% 3%
2010
Demand Deposits
Investment Savings Account
Term Deposits/GICs
Registered Plans
TFSAs

12
TCU may also resort to other liquidity management strategies such as syndicating some of our loan
portfolio if member deposit growth does not meet the loan demand.
TCU, along with all other Saskatchewan Credit Unions, is required to maintain 10% of their
liabilities on deposit with SaskCentral, as the manager of the provincial liquidity program. These
liquidity investments provide a safety net of liquid funds to satisfy payment obligations and to also
protect against unforeseen liquidity events. In addition to these statutory liquidity investments, TCU
also maintains an investment portfolio of other liquid investments to meet daily liquidity
requirements.
Profitability
Net profit in 2011 was just over $4,202,000, as compared to just over $2,695,000 in 2010. The net
operating income in 2011 was at $2,807,000 as compared to $2,788,000 in 2010. Financial statement
reporting standards require us to report “comprehensive income” which includes unrealized
gains/losses on investments and derivatives. In 2011, the unrealized gains/losses on investments
and derivatives calculated to a gain of just under $1,400,000 as compared to a loss of $93,000 in
2010.
In 2011, TCU wound up (sold) the majority of our SWAP instruments which generated an
additional $1,200,000 to our 2011 revenue stream.
TCU’s total annualized return on assets (ROA) for 2011 was .82% on comprehensive income, and
.55% on operating income, as compared to .62% on comprehensive income and .64% on operating
income in 2010.
Net interest margin is the total revenue received from loan and investment interest less total interest
expense paid on member deposits and provision for credit and investment losses. TCU’s net interest
margin was at 2.467% at December 31, 2011, as compared to 2.940% at the end of 2010.
Net interest margins deteriorated throughout 2011. We expect the net interest rate margin to
continue to deteriorate through 2012. The main reason for this deterioration is the continued low
interest rate environment and the very strong competitive environment for both loans and deposits.
Non-interest revenue includes revenue from sources like commissions and charges, service fees,
administration fees on syndicated loans and fixed asset income. TCU’s non-interest revenue for
2011 was at $4,945,000 as compared to $3,439,000 in 2010. The accounting for unrealized gains and
losses on investments and derivatives as indicated above accounted for the difference between 2011
and 2010.

13
Interest expense includes the interest paid to our member deposits, and interest paid on borrowed
money. The total interest expense for 2011 was just over $7,115,000 as compared to just over
$6,685,000 in 2010. The increased growth in member deposits over 2011, as well as the shift of
member deposits from the Investment Savings Account to the higher interest bearing Term
Deposits accounted for most of the difference.
Provision for loan losses increased to $703,000 in 2011 from $62,000 in 2010. TCU established a
loan loss provision of $650,000 for one commercial loan. While significant efforts are being made to
avoid this loan loss, we thought it would be prudent on our part to establish this provision at this
time. Overall, TCU’s delinquency and loan loss provisions are exceptionally low and below industry
ratios for an organization with almost a $400 million loan portfolio.
Non-interest expenses include operating expenses such as personnel, occupancy, member security,
general business and governance costs. Non-interest expenses for 2011 were at $12,525,000, as
compared to $12,408,000 in 2010, or an increase of .94%. One of our primary focuses is to grow
assets without a corresponding increase in operating expenses. In other words, we want to continue
to work towards decreasing our operating expenses as a percentage of assets. In 2011, our operating
expense to asset ratio was at 2.44% as compared to 2.85% in 2010. On all levels, in terms of
managing our operating expense, TCU was able to accomplish this exceedingly well in 2011. TCU
still maintains one of the lowest operating expense ratios for a multi-branch credit union in
Saskatchewan.
The following graph presents a breakdown of TCU’s operating expenses.
Efficiency Ratio is a calculation that determines the cost of raising $1.00 of revenue. In 2011, TCU’s
Efficiency Ratio was at 71.83%, as compared to 77.90% in 2010. In other words, it costs TCU $0.7183
60%
8% 3%
26%
3%
2011
Personnel
Occupancy Expense
Member Security
General Business
Organization
60%
8% 3%
26%
3%
2010
Personnel
Occupancy Expense
Member Security
General Business
Organization

14
to raise $1.00 of revenue in 2011. The primary reason for the difference between 2011 and 2010 was
the ability to grow our assets by 17.76% and increasing our operating expenses by only .94%. Another
one of our primary focuses is to continue to improve on our Efficiency Ratio to where it is below
70%.
Member equity and capital
Member equity and capital are the primary measurements of a credit union’s financial strength.
TCU’s capital management policy is that we will at all times remain adequately capitalized,
maintaining a prudent cushion of retained earnings and equity to protect our economic survival and
to finance new opportunities.
There are two measurements that we use in regards to capital and member equity:
1) Total capital as a percentage of risk-weighted assets – TCU’s risk weighted ratio at the end of
2011 stood at 14.12%, as compared to 14.84% in 2010. The standard as set by our regulator is
that a credit union must maintain a minimum of 8.00% of total capital as a percentage of risk
weighted assets. TCU’s internal capital management policy is for the risk weighted capital ratio
to be within the range of 10% to 12%.
2) Total capital as a percentage of total assets – TCU’s tier 1 capital to asset ratio at the end of 2011
stood at 6.84%, as compared to 7.22% in 2010. The standard as set by our regulator is that a
credit union must maintain a minimum of 5.00% of total capital as a percentage of total assets.
The primary reason for this ratio being lower than in 2010 was that our profitability was not able
to keep pace with our asset growth.
TCU’s Member Equity position as at December 31, 2011 was at $35,016,000 as compared to
$30,814,000 at the end of 2010.
Operational review
Throughout 2011, TCU implemented a number of key initiatives to enhance member service and to
position the credit union for future developments or functionality. These initiatives are as follows:
Introduced PAN Login functionality which provides additional security for our members using
the MemberDirect Internet Banking facility. As well this positions us well to introduce other on-
line type functionalities.
Introduced the increased authentication process for our MemberDirect Internet Banking facility
which provides a higher level of security for preventing Internet on-line fraud.

15
Implemented CHIP Card technology for our MemberCards, which helps to prevent fraud
activity on our member’s point of sale and ATM transactions.
Implemented e-transfer functionality which allows our members to transfer money electronically
to individuals/organizations through our MemberDirect Internet Banking facility.
Introduced the mobile banking functionality which allows members to gain access to their
accounts through their smart phone.
Continued work on the project of product simplification. TCU’s intent through this project is to
alleviate the complexity of banking and make our products and services simpler to use and
understand.
From a Corporate Culture or Human Resources perspective, TCU continues to employ strategies
and initiatives to enhance our corporate culture and to be the kind of organization that people will
want to work for. TCU Financial Group and TCU Wealth Management Inc. have an outstanding
staff complement. Focus groups and other research conducted in 2011 told us over and over again
that our employees are exceptional and provide a level of service that exceeds their expectations. We
anticipate strong competition for skilled labor, and so TCU will have to be a leader in initiating
policies that will not only engage and retain existing staff, but also make TCU companies the
employer of choice.
From a Risk Management perspective, TCU had three audits in 2011 as follows:
Our annual external audit conducted by Virtus Group Chartered Accountants. Their report is
included in this Annual Report.
On a biennial basis, Credit Union Deposit Guarantee Corporation, our regulator, conducts a
review of the Credit Union. This review, which for TCU took place in the fall of 2011, did not
identify any issues or concerns on behalf of our regulator.
We were also audited by FINTRAC (Financial Transactions Reports Analysis Centre of Canada).
This was the second audit in as many years. As with the first audit, there were no issues
identified that were of a serious nature.

16
TCU Wealth Management Inc.
TCU Wealth Management Inc. is a wholly-owned subsidiary of TCU and provides wealth
management services such as mutual funds, securities brokerage, estate and financial planning.
In 2010, TCU Financial Group Credit Union established a separate and distinct governance
structure for TCU Wealth Management Inc. This change included the establishment of a separate
and distinct Board of Directors for this subsidiary company. The new structure for the wealth
management Board of Directors consists of four categories: a) CEO of the parent company; b)
Representative of the parent company Board of Directors; c) two Board members representing
clients; and d) two Board members representing the financial industry. As a result, the Board of
Directors of TCU Wealth Management Inc. is as follows:
Morris Smysnuik – CEO, TCU Financial Group Credit Union
Helen Sukovieff – Representative of the TCU Financial Group Credit Union Board of Directors
Derwyn Crozier-Smith – Client Representative
Modest Kowal – Client Representative
Orest Bodnarchuk – Industry Representative
Linda Jijian – Industry Representative
TCU Wealth Management Inc. also has its own management structure, as follows:
Celeste Labrecque – General Manager
Jill Norrish – Senior Manager Wealth Management
TCU Wealth Management Inc. continues to be an integral part of our organization. We believe that
it will be imperative for the wealth management company to be successful in order for our
organization to sustain itself into the future as an autonomous financial intermediary. TCU Wealth
Management Inc.’s assets under administration are broken down into two categories – mutual funds
administered through Qtrade Asset Management Inc. and securities investments administered
through Qtrade Securities Inc. Total assets under administration at December 31, 2011 were at
$101,004,000 as compared to $94,808,000 at the end of 2010, representing an overall increase of
6.54% as compared to 13.39% in 2010. Qtrade Asset Management Inc. assets under administration
at December 31, 2011 were at $40,798,000 as compared to $39,338,000 at the end of 2010, or a
3.71% increase as compared to 6.61% in 2010. Qtrade Securities Inc. assets under administration at
December 31, 2011 were at $60,206,000, as compared to $55,470,000 at the end of 2010, or an
8.54% increase as compared to 18.75% in 2010.

17
The breakdown between the two categories is presented below.
Future Considerations
The Saskatchewan Credit Union system is going through a transitional phase where credit unions are
considering mergers or strategic relationships that will change the credit union landscape in
Saskatchewan. While very cognizant and always vigilant in terms of these developments, TCU
continues to work towards remaining as an autonomous credit union within the Saskatchewan
Credit Union system. This is based on the premise that Saskatchewan is, and we believe will
continue to be, the economic hotbed in Canada, and secondly, we believe that competition amongst
the credit union is a good thing for the member. Competition does not only make us sharp and
more conscientious, it also makes our competitor sharper, which is good for the member.
We expect 2012 to be a very challenging year. Interest rate margins will continue to deteriorate.
While we have budgeted for respectable growth targets in both member loans and member deposits,
it is acknowledged that attaining those targets will be challenging. We expect a very strong
competitive environment which will result in competing for deposits and loans through aggressive
pricing, which will only serve to lower interest rate margins even more.
We continue to work very hard at trying to gain efficiencies and control our operating expenses. As
indicated before, we need to grow our business without a corresponding increase in our operating
expenses. We don’t see these efficiencies coming through cutbacks or service reductions. We see
these efficiencies coming through investments in technology. In a year where we expect achieving a
high level of profitability to be a challenge, we are going to be making a very significant investment
60%
40%
2011
Qtrade Securities Inc.
Qtrade Asset Management Inc.
59%
41%
2010
Qtrade Securities Inc.
Qtrade Asset Management Inc.

18
in technology that will allow us to deliver financial products and services to our members through a
variety of delivery channels in a very effective and efficient manner. We anticipate that by the end of
2012, technology initiatives like Personal Teller Machines, video-conferencing facilities and an
enhanced and robust on-line product offering will allow TCU to grow and become sustainable into
the future while providing members with access to their financial dealings and transactions in a
manner that they request and desire.
In summary, at TCU we will dedicate our resources and efforts towards our primary goal of growing
our member deposit base on the Credit Union side, and assets under management on the Wealth
Management company side. In 2011, the Board of Directors approved our “Purpose”, “Passion”
and “Promise” statement which is based on our Eight Guiding Principles and represents the high
level direction of our credit union in terms of what members can expect of TCU when conducting
their financial transactions with us. The Eight Guiding Principles will ensure that TCU will exceed
expectations in regards to providing outstanding service levels to our members/clients; will be very
price competitive, if not the best price; will provide value added service to our members/clients and,
of course, will maintain a level of profitability and growth that will sustain our credit union into a
long term future.
In order to accomplish the direction conveyed by these guiding principles, TCU will be challenged
to use both our human resource element and technology to efficiently and effectively deliver
financial products and services to our members/clients through delivery channels that our members
want and expect. Just as we will be challenged to be more innovative in terms of effectively
delivering financial services to our members/clients, our members/clients will also be challenged to
be more accepting of innovative and newer technologies. What this means is that 2012 will not only
be a challenging year but a very exciting year as we work together to build a strong, viable and
sustainable credit union for the benefit of you, our members/clients.
In summary, we expect 2012 to be a challenging year from a financial perspective, but a very exciting
and astounding year from an innovative perspective.

19
MANAGEMENT OF RISK
Overview
TCU Financial Group Credit Union (TCU) is committed to prudently employ various risk management
strategies to mitigate the various risks that it is exposed to within the financial industry. TCU employs a risk
management framework enterprise wide (ERM) in order to enhance the management of these risks. Based on
this framework, TCU uses six categories to help define the risk exposure. These categories are:
Credit Risk
Liquidity Risk
Market (Interest Rate) Risk
Strategic Risk
Operational Risk
Legal and Regulatory Risk
TCU’s risk management framework includes:
Risk identification and classification
Risk mitigation review and assessment
Policy and procedure reviews and amendments
Compliance and audit reviews
Reporting
Senior Management is responsible in establishing the framework which will identify and classify the risks, as
well as establishing effective policies and processes to manage the risks. The Board of Directors, either
directly or through Board committees, review and approve key policies and reporting to ensure proper
oversight to the risk management process.
The Board of Directors is responsible to approve the overall business plan including any recommendations
from various committees. The Board also receives reporting from the various committees as it relates to
approvals made by those committees.
The Audit & Risk Management Committee receives direct reporting from Senior Management and is
responsible for the monitoring of the risk management framework and any recommendations to the Board as
to acceptable risk levels. The committee is also responsible to provide oversight of the external and internal
audit process and the adequacy of internal controls.
Executive and Senior Management are responsible for the implementation of strategies and policies approved
by the Board as well as reporting to the Board or specific committees to ensure proper oversight is
maintained.

20
The ALCO (Asset and Liability Management) committee consists of Executive Management and the Senior
Manager of Internal Audit & Risk Management. The committee is responsible for the monitoring of liquidity
and interest rate risk as well as overall credit exposure. This committee provides regular reporting to the
Board related to liquidity and market risk activities and capital management activities undertaken by
management.
TCU has also established an independent internal audit/quality assurance framework. Reporting from this
framework is delivered to senior management with a summary provided to the Audit & Risk Management
Committee on a quarterly basis to assist in the oversight of TCU internal controls.
Credit Risk
Credit Risk analysis includes a review of TCU loan portfolio diversity, loan policy and the ability to recover
our loans by way of member payments or the realization of security. TCU employs loan underwriting policies
and procedures based on recommended industry requirements and standards. Loan delinquency and “loan
loss write offs” continue to be maintained below industry standards and are monitored and reported to the
Board on a regular basis. Loan portfolio concentrations are also reported to the Board of Directors. The
largest percentage of our loan book remains in consumer and residential loan products with some
diversification into commercial and syndicated loans.
Liquidity Risk
Liquidity Risk analysis includes a review of strategies around member deposit acquisition and other loan
funding sources. TCU has established liquidity, capital management and asset/liability management (ALM)
policies, approved by the Board of Directors, which provide direction in managing the associated risks. Loan
syndication continues to be one strategy employed to mitigate liquidity pressures, however, acquiring member
deposits remains a key focus. Competition for deposit dollars continues to increase. Existing borrowing
facilities with SaskCentral (Concentra) also form part of the management strategy. Senior Management
develops strategies designed to attract deposit assets and non-interest revenue streams. The ALCO committee
is responsible to manage liquidity risk based on the approved policy and to provide reporting to the Board for
their oversight.
Market (Interest Rate) Risk
Market Risk analysis includes a review of market conditions, asset/liability matching and interest margin
challenges. Pressure on interest margin remains a key area of risk for TCU. In addition to the ALCO
committee, TCU has employed the services of an outside consultant to assist with our balance sheet
management including scenario simulation, stress testing based on changes in interest rates and review
possible scenarios for long term planning. Interest rate swaps are employed as one strategy to manage interest
rate risk. Senior management conducts ongoing reviews of product offerings, product delivery and product
pricing to help ensure profitability. Reporting is provided to the Board to ensure oversight.
21
Strategic Risk
Strategic Risk analysis includes a review of TCU’s brand, strategic direction, competition for members and
staffing as well as TCU’s role in the communities in which we serve. TCU has a formal planning process and
operates from a Balanced Scorecard approach reflecting 5 strategic categories including, Corporate Culture,
Members, Growth and Innovation, Finance and Risk Management. Our strategic direction is set by the Board
and reviewed at least annually. In addition, TCU has set certain benchmark metrics that if not achieved,
initiates a high level review of our strategic direction to ensure future success of the Credit Union. Annual
planning meetings with Executive Management and Directors set the direction for the Credit Union.
Executive and Senior Management are responsible to develop objectives and action plans. The Board is
responsible to review and approve the Balanced Scorecard annually. TCU actively participates in the
community both from a corporate perspective and by individual employees.
Operational Risk
Operational Risk analysis includes a review primarily of human resources and information systems as well as
internal controls and business continuity planning. Operational risk occurs when TCU is not able to develop
or deliver products and services to its’ members due to human error, inadequate or failed technical issues,
inadequate internal controls, lack of trained or qualified staff or other resources, etc. Competition remains a
key risk area and TCU’s ability to respond to operational risk issues is paramount to our success. TCU has
established policies and procedures, internal controls and compliance activities and conducts regular reviews
of these controls. Among other initiatives, attracting and retaining highly skilled and competent staff remains
a priority. Dedicating resources and initiatives to technology, information systems and alternative service
delivery channels will be a key focus in 2012. Outsourced experts are engaged where needed to ensure a high
level of knowledge and support for key initiatives. TCU has adopted a Code of Conduct for employees and
directors. TCU also requests and receives audit reports from key suppliers to ensure that these organizations
are able to remain viable partners for our organization.
Legal and Regulatory Risk
Legal and Regulatory Risk analysis includes a review of fraud and fiduciary risk exposure as well as the cost to
implement regulatory or compliance regimes and the possible effect of non compliance with laws, rules,
regulations or ethical standards. TCU has policies, procedures and internal controls in place to mitigate our
exposure to these risks as well as assist TCU in complying with laws and regulations. TCU has a designated
Compliance Officer to oversee the compliance regime. In addition, the internal audit/quality assurance
framework provides an independent assessment of the compliance regime on an annual basis. Internal
audit/quality assurance also provides ongoing assessment of internal controls. Reporting is provided to Senior
Management ongoing and to the Audit & Risk Management Committee on a quarterly basis to ensure the
Board’s oversight of the compliance and control processes.

22
MANAGEMENT’S RESPONSIBILITY To the Members of
TCU Financial Group
Management has responsibility for preparing the accompanying consolidated financial statements and
ensuring that all information in the annual report is consistent with the statements. This responsibility
includes selecting appropriate accounting principles and making objective judgments and estimates in
accordance with Canadian generally accepted accounting principles.
In discharging its responsibilities for the integrity and fairness of the consolidated financial statements and for
the accounting systems from which they are derived, management maintains the necessary system of internal
controls designed to provide assurance that transactions are authorized, assets are safeguarded and proper
records are maintained.
Ultimate responsibility for consolidated financial statements to members lies with the Board of Directors. An
Audit Committee of Directors is appointed by the Board to review financial statements in detail with
management and to report to the Board of Directors prior to their approval of the consolidated financial
statements for publication.
Independent auditors appointed by the members audit the consolidated financial statements and meet
separately with both the Audit Committee and management to review their findings. The independent
auditors report directly to the members and their report follow. The independent auditors have full and free
access to the Audit Committee to discuss their audit and their findings as to the integrity of the Credit
Union's financial reporting and the adequacy of the system of internal controls.
Chief Executive Officer Executive Manager – Finance & Accounting

23
INDEPENDENT AUDITORS’ REPORT
To the Members,
TCU Financial Group
We have audited the accompanying consolidated financial statements of TCU Financial Group which
comprise the consolidated statement of financial position as at December 31, 2011 and the consolidated
statements of income, comprehensive income, changes in members' equity and cash flows for the year then
ended, and a summary of significant accounting policies and other explanatory information.
Management's Responsibility for the Financial Statements
Management is responsible for the preparation and fair presentation of these financial statements in
accordance with Canadian generally accepted accounting principles and for such internal control as
management determines is necessary to enable the preparation of financial statements that are free from
material misstatement, whether due to fraud or error.
Auditors' Responsibility
Our responsibility is to express an opinion on these financial statements based on our audit. We conducted
our audit in accordance with Canadian generally accepted auditing standards. Those standards require that we
comply with ethical requirements and plan and perform the audit to obtain reasonable assurance about
whether the financial statements are free of material misstatement.
An audit involves performing procedures to obtain audit evidence about the amounts and disclosures in the
financial statements. The procedures selected depend on the auditor's judgment, including the assessment of
the risks of material misstatement of the financial statements, whether due to fraud or error. In making those
assessments, the auditor considers internal control relevant to the Credit Union's preparation and fair
presentation of the financial statements in order to design audit procedures that are appropriate in the
circumstances, but not for the purpose of expressing an opinion on the effectiveness of the Credit Union’s
internal control. An audit also includes evaluating the appropriateness of accounting policies used and the
reasonableness of accounting estimates made by management, as well as evaluating the overall presentation of
the financial statements.
We believe that the audit evidence we have obtained is sufficient and appropriate to provide a basis for our
audit opinion.
Opinion
In our opinion, these financial statements present fairly, in all material respects, the financial position of the
Credit Union as at December 31, 2011 and its financial performance and its cash flows for the year then
ended in accordance with Canadian generally accepted accounting principles.
March 6, 2012
Saskatoon, Saskatchewan Chartered Accountants
24
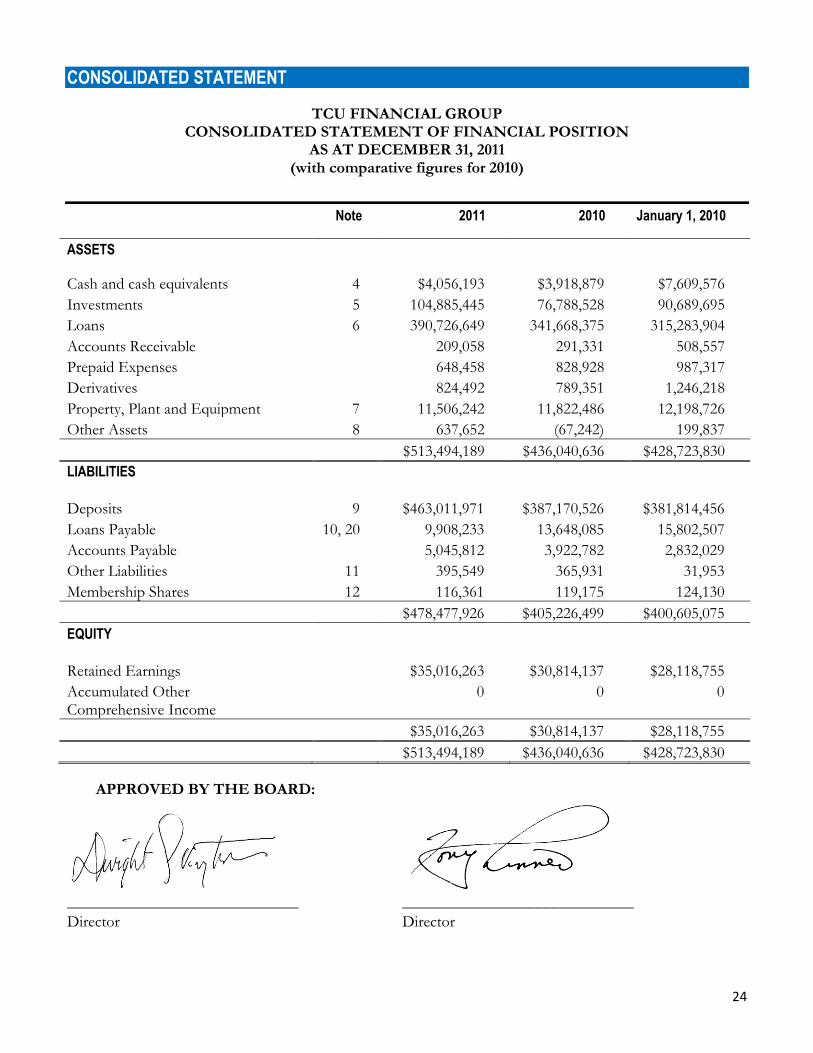
CONSOLIDATED STATEMENT
TCU FINANCIAL GROUP CONSOLIDATED STATEMENT OF FINANCIAL POSITION
AS AT DECEMBER 31, 2011 (with comparative figures for 2010)
Note 2011 2010 January 1, 2010
ASSETS
Cash and cash equivalents 4 $4,056,193 $3,918,879 $7,609,576
Investments 5 104,885,445 76,788,528 90,689,695
Loans 6 390,726,649 341,668,375 315,283,904
Accounts Receivable 209,058 291,331 508,557
Prepaid Expenses 648,458 828,928 987,317
Derivatives 824,492 789,351 1,246,218
Property, Plant and Equipment 7 11,506,242 11,822,486 12,198,726
Other Assets 8 637,652 (67,242) 199,837
$513,494,189 $436,040,636 $428,723,830
LIABILITIES
Deposits 9 $463,011,971 $387,170,526 $381,814,456
Loans Payable 10, 20 9,908,233 13,648,085 15,802,507
Accounts Payable 5,045,812 3,922,782 2,832,029
Other Liabilities 11 395,549 365,931 31,953
Membership Shares 12 116,361 119,175 124,130
$478,477,926 $405,226,499 $400,605,075
EQUITY
Retained Earnings $35,016,263 $30,814,137 $28,118,755
Accumulated Other Comprehensive Income
0 0 0
$35,016,263 $30,814,137 $28,118,755
$513,494,189 $436,040,636 $428,723,830
APPROVED BY THE BOARD:
_____________________________ _____________________________ Director Director

25
TCU FINANCIAL GROUP CONSOLIDATED STATEMENT OF INCOME FOR THE YEAR ENDED DECEMBER 31, 2011
Note 2011 2010
INTEREST INCOME
Loan Interest $16,713,928 $15,037,092 Investments 4,080,978 4,193,286
$20,794,906 $19,230,378
INTEREST EXPENSE
Deposits $6,729,173 $6,259,800 Borrowed Money 386,293 425,257
$7,115,466 $6,685,057
NET INTEREST INCOME $13,679,440 $12,545,321
Provision for credit losses 6 702,564 62,112
$12,976,876 $12,483,209
NON-INTEREST INCOME
Gains/losses – Held for Trading Instruments $1,394,766 ($93,023) Other Revenue 3,550,230 3,532,473
$4,944,996 $3,439,450
OPERATING EXPENSES
Personnel $7,497,079 $7,461,363 Security 404,089 390,074 Organizational 304,775 313,281 Occupancy 701,264 719,788 Depreciation and amortization 637,846 695,782 General Business 2,979,837 2,827,899
$12,524,890 $12,408,187
Income before income tax $5,396,982 $3,514,472 Income tax expense 18 1,194,856 819,090
NET INCOME $4,202,126 $2,695,382

26
TCU FINANCIAL GROUP CONSOLIDATED STATEMENT OF COMPREHENSIVE INCOME
FOR THE YEAR ENDED DECEMBER 31, 2011
2011 2010
NET INCOME $4,202,126 $2,695,382
OTHER COMPREHENSIVE INCOME $0 $0
TOTAL COMPREHENSIVE INCOME $4,202,126 $2,695,382

27
CONSOLIDATED STATEMENT OF CHANGES IN MEMBERS' EQUITY FOR THE YEAR ENDED DECEMBER 31, 2011
(with comparative figures for the year ended December 31, 2010)
Retained earnings
Unrealized gain/losses - AFS
financial assets
Total equity
Balance at January 1, 2010 $28,118,755 $0 $28,118,755
Total comprehensive income for the period: Net income $2,695,382 $0 $2,695,382
Other comprehensive income:
Net change in fair value of available for sale financial assets, net of tax 0 0 0
Net amount reclassified to profit and loss for available for sale financial assets, net of tax $0 $0 $0
Total other comprehensive income $0 $0 $0
Total comprehensive income for the period $2,695,382 $0 $2,695,382
Balance at December 31, 2010 $30,814,137 $0 $30,814,137
Balance at January 1, 2011 $30,814,137 $0 $30,814,137
Total comprehensive income for the period: Net income $4,202,126 $0 $4,202,126
Other comprehensive income:
Net change in fair value of available for sale financial assets, net of tax 0 0 0
Net amount reclassified to profit and loss for available for sale financial assets, net of tax $0 $0 $0
Total other comprehensive income $0 $0 $0
Total comprehensive income for the period $4,202,126 $0 $4,202,126
Balance at December 31, 2011 $35,016,263 $0 $35,016,263
28
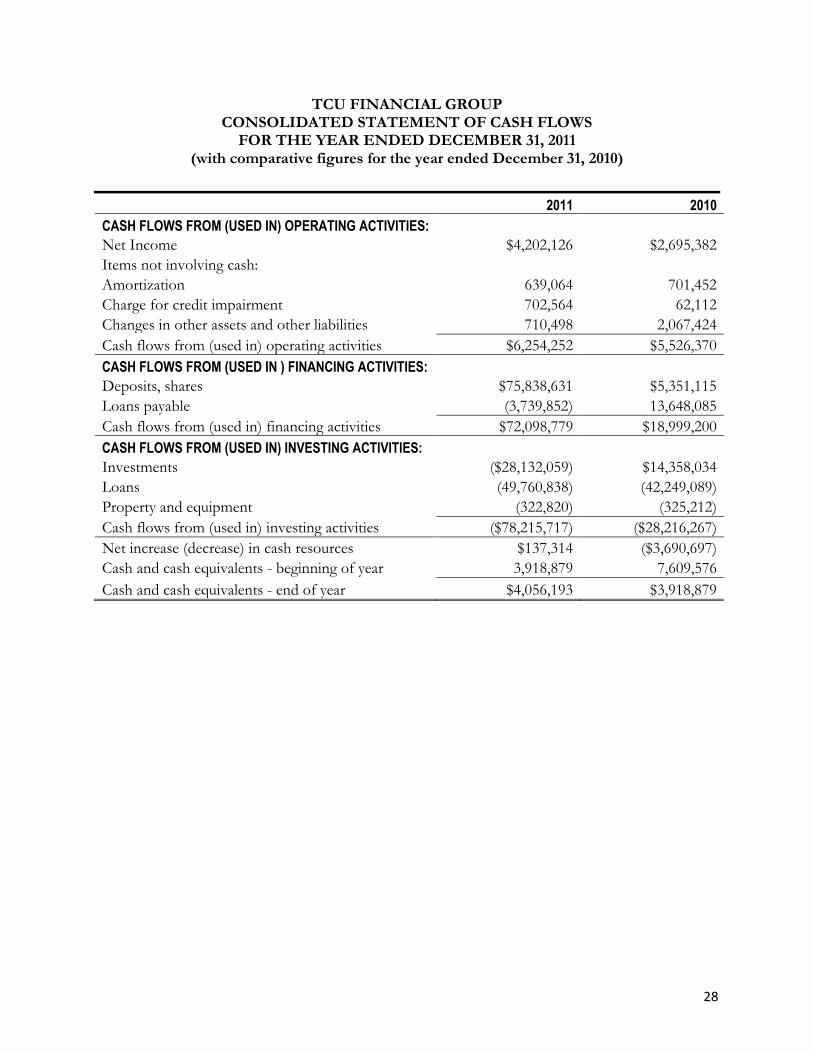
TCU FINANCIAL GROUP CONSOLIDATED STATEMENT OF CASH FLOWS
FOR THE YEAR ENDED DECEMBER 31, 2011 (with comparative figures for the year ended December 31, 2010)
2011 2010
CASH FLOWS FROM (USED IN) OPERATING ACTIVITIES: Net Income $4,202,126 $2,695,382
Items not involving cash: Amortization 639,064 701,452
Charge for credit impairment 702,564 62,112
Changes in other assets and other liabilities 710,498 2,067,424
Cash flows from (used in) operating activities $6,254,252 $5,526,370
CASH FLOWS FROM (USED IN ) FINANCING ACTIVITIES: Deposits, shares $75,838,631 $5,351,115
Loans payable (3,739,852) 13,648,085
Cash flows from (used in) financing activities $72,098,779 $18,999,200
CASH FLOWS FROM (USED IN) INVESTING ACTIVITIES: Investments ($28,132,059) $14,358,034
Loans (49,760,838) (42,249,089)
Property and equipment (322,820) (325,212)
Cash flows from (used in) investing activities ($78,215,717) ($28,216,267)
Net increase (decrease) in cash resources $137,314 ($3,690,697)
Cash and cash equivalents - beginning of year 3,918,879 7,609,576
Cash and cash equivalents - end of year $4,056,193 $3,918,879
29
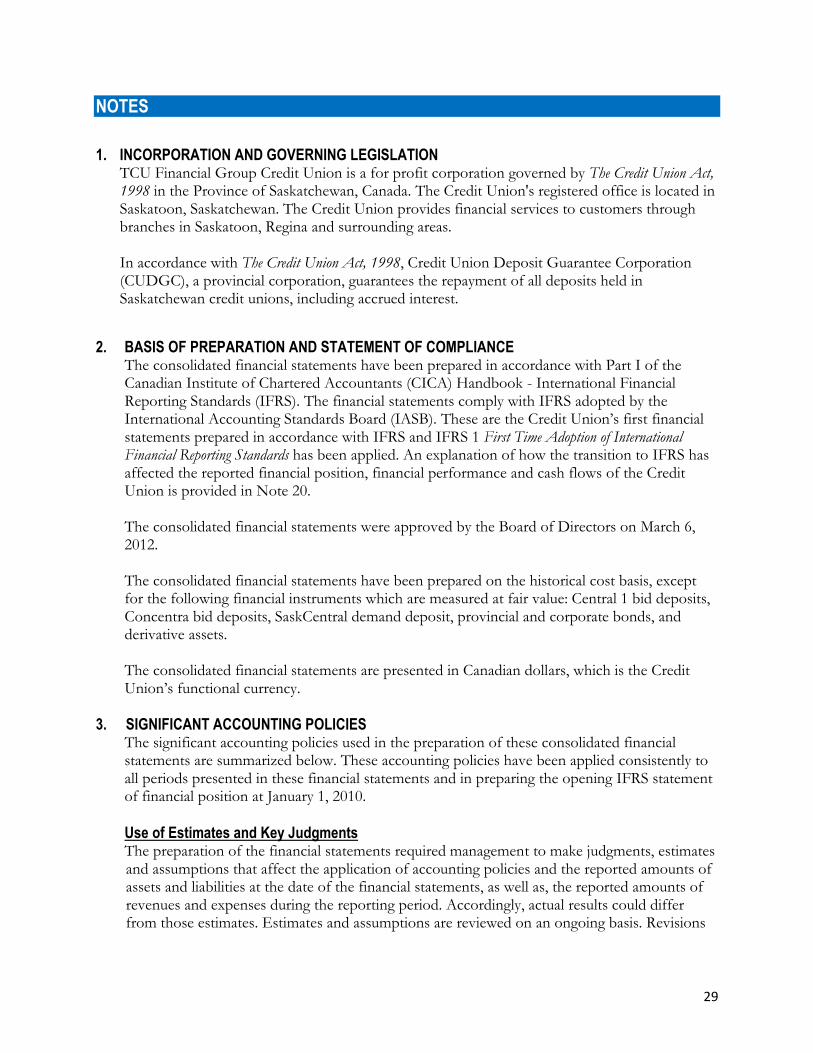
NOTES
1. INCORPORATION AND GOVERNING LEGISLATION TCU Financial Group Credit Union is a for profit corporation governed by The Credit Union Act, 1998 in the Province of Saskatchewan, Canada. The Credit Union's registered office is located in Saskatoon, Saskatchewan. The Credit Union provides financial services to customers through branches in Saskatoon, Regina and surrounding areas.
In accordance with The Credit Union Act, 1998, Credit Union Deposit Guarantee Corporation (CUDGC), a provincial corporation, guarantees the repayment of all deposits held in Saskatchewan credit unions, including accrued interest.
2. BASIS OF PREPARATION AND STATEMENT OF COMPLIANCE The consolidated financial statements have been prepared in accordance with Part I of the Canadian Institute of Chartered Accountants (CICA) Handbook - International Financial Reporting Standards (IFRS). The financial statements comply with IFRS adopted by the International Accounting Standards Board (IASB). These are the Credit Union’s first financial statements prepared in accordance with IFRS and IFRS 1 First Time Adoption of International Financial Reporting Standards has been applied. An explanation of how the transition to IFRS has affected the reported financial position, financial performance and cash flows of the Credit Union is provided in Note 20. The consolidated financial statements were approved by the Board of Directors on March 6, 2012. The consolidated financial statements have been prepared on the historical cost basis, except for the following financial instruments which are measured at fair value: Central 1 bid deposits, Concentra bid deposits, SaskCentral demand deposit, provincial and corporate bonds, and derivative assets. The consolidated financial statements are presented in Canadian dollars, which is the Credit Union’s functional currency.
3. SIGNIFICANT ACCOUNTING POLICIES The significant accounting policies used in the preparation of these consolidated financial
statements are summarized below. These accounting policies have been applied consistently to all periods presented in these financial statements and in preparing the opening IFRS statement of financial position at January 1, 2010.
Use of Estimates and Key Judgments
The preparation of the financial statements required management to make judgments, estimates and assumptions that affect the application of accounting policies and the reported amounts of assets and liabilities at the date of the financial statements, as well as, the reported amounts of revenues and expenses during the reporting period. Accordingly, actual results could differ from those estimates. Estimates and assumptions are reviewed on an ongoing basis. Revisions
30
to accounting estimates are recognized in the period in which the estimate is revised and in any future periods affected.
The most significant uses of judgments and estimates are as follows:
(i) Valuation of Financial Instruments The Credit Union determines the fair value of financial instruments for which there
is no observable market price using a variety of valuation techniques as described further in Note 3. The inputs to these models are derived from observable market data where possible, but where observable market data is not available, judgment is required to establish fair values. The judgments include consideration of liquidity and other risks affecting the specific instrument.
(ii) Allowances for Credit Losses The individual allowance component of the total allowance for impairment applies to
financial assets evaluated individually for impairment. In particular, management judgment is required to estimate the amount and timing of cash flows the Credit Union expects to receive. These estimates are based on a number of factors, including the net realizable value of any underlying collateral.
The collective allowance component covers credit losses in portfolios of loans with similar credit risk characteristics when there is objective evidence to suggest that a loss has been incurred but the individual impaired items cannot yet be identified. In assessing the collective allowance, management considers factors such as credit quality, historical loss experience and current economic conditions.
Basis of consolidation The consolidated financial statements include the financial statements of the Credit Union and
its subsidiaries. Assets, liabilities, income and expenses are included in the consolidated financial statements after eliminating intercompany transactions and balances.
Subsidiaries are entities controlled by the Credit Union. Control is achieved where the Credit Union has the power to govern the financial and operating policies of an entity so as to obtain benefits from its activities. The financial statements of subsidiaries are included in the financial statements from the date control commences until the date that control ceases. The consolidated financial statements have been prepared using uniform accounting policies for like transactions and other events in similar circumstances.
Included in the consolidated financial statements are the following entities:
Entity Percentage Ownership
TCU Wealth Management Inc. 100% TCU Holdings Inc. 100%
Financial instruments All financial instruments are initially recognized at fair value, plus transaction costs, except in
the case of financial assets and liabilities classified as fair value through profit or loss. The classification of financial instruments at initial recognition depends on the purpose and management’s intention for which the instruments were acquired and the item’s characteristics. The Credit Union uses settlement date accounting for regular way contracts when recording

31
financial asset transactions. All financial instruments are classified as fair value through profit or loss, loans and receivables, held to maturity, available for sale or other financial liabilities.
Fair value through profit or loss
Financial assets and financial liabilities are classified as fair value through profit or loss (FVTPL) when the instrument is held for trading or is designated as FVTPL by management.
A financial asset or financial liability is held for trading if:
It has been acquired principally for the purpose of selling it in the near term, or
On initial recognition, it is part of a portfolio of identified financial instruments that the Credit Union manages together and has a recent actual pattern of short term profit taking, or
It is a derivative that is not designated (or designated but not effective) as a hedging instrument.
A financial asset or financial liability other than a financial asset or financial liability held for trading may be designated as at FVTPL upon initial recognition if:
Such designation eliminates or significantly reduces a measurement or recognition inconsistency that would otherwise arise, or
The financial asset or financial liability forms part of a group of financial assets or financial liabilities or both, which is managed and its performance is evaluated on a fair value basis, in accordance with the Credit Union’s documented risk management or investment strategy, and information about the grouping is provided internally on that basis, or
It forms part of a contract containing one or more embedded derivatives. Financial assets and financial liabilities at FVTPL are stated at fair value, with any gains or losses
arising on re-measurement recognized immediately in profit or loss.
The Credit Union has classified the following financial assets and liabilities as FVTPL:
Cash and cash equivalents
Central 1 bid deposit
Concentra bid deposit
SaskCentral demand deposit
Provincial and corporate bonds
Derivatives
Loans and receivables Loans and receivables include non-derivative financial assets with fixed or determinable
payments that are not quoted in an active market and that the Credit Union does not intend to sell immediately or in the near term. Loans and receivables are subsequently measured at amortized cost using the effective interest method, less any impairment. Interest income, calculated using the effective interest rate method, is recognized in profit or loss.
The Credit Union has classified the following financial assets as loans and receivables:
Loans
Accrued interest on loans
Accounts receivables
32
Held to maturity Held to maturity financial assets are non-derivative assets with fixed or determinable payments
and fixed maturity dates that the Credit Union has the positive intention and ability to hold until the maturity date, and which are not designated as another category. Held to maturity financial assets are subsequently measured at amortized cost using the effective interest method less any impairment, with interest revenue recognized in profit or loss.
The Credit Union has classified the following financial assets as held to maturity:
SaskCentral liquidity deposits
Available for sale Available for sale financial assets are non-derivative financial assets that are designated as
available for sale and are not classified in any of the previous categories. Unquoted equity securities whose fair value cannot be reliably measured are carried at cost. All other available for sale financial assets are subsequently measured at fair value.
Interest income is recognized in profit or loss using the effective interest method. Dividend
income is recognized in profit or loss when the Credit Union becomes entitled to the dividend. Fair value changes are recognized in other comprehensive income until the investment is sold or impaired. Once sold or impaired, the cumulative gains and losses previously recognized in other comprehensive income are reclassified to profit or loss as a reclassification adjustment.
The Credit Union has classified the following financial assets as available for sale:
SaskCentral debenture
SaskCentral shares
APEX Investment Limited Partnership
Other financial liabilities Other financial liabilities are those liabilities which have not been classified as FVTPL. Other financial liabilities are subsequently measured at amortized cost using the effective interest method. Interest expense, calculated using the effective interest rate method, is recognized in profit or loss.
The Credit Union has classified the following financial liabilities as other financial liabilities:
Deposits
Loans payable
Accounts payables
Membership shares
Derivative financial instruments
Derivative financial instruments are financial contracts whose value is derived from an underlying interest rate, foreign exchange rate, equity, commodity instrument or index. In the ordinary course of business, the Credit Union enters into derivative contracts for asset/liability management. The Credit Union enters into derivative financial instruments to manage its exposure to interest rate risk, including interest rate swaps. Derivatives are initially recognized at fair value at the date that the derivative contract is entered into. It is subsequently measured at
33
fair value with changes in fair value recognized in profit or loss, unless it is designated in a qualifying hedging relationship. Derivatives may include contracts which are designated as and effective as hedges, and/or contracts which reposition the Credit Union's overall interest rate risk, credit risk and foreign exchange risk profile. The Credit Union does not use hedge accounting for derivatives.
Embedded derivatives
Derivatives embedded in other non-derivative financial instruments or other host contracts are separated from their host contracts and accounted for as separate derivatives when certain conditions are met. These conditions include: the economic characteristics and risks are not closely related to those of the host contract, a separate instrument with the same terms would meet the definition of a derivative and the combined instrument or contract is not measured at FVTPL. Embedded derivatives that are accounted for as separate derivatives are measured at fair value with changes in fair value recognized in profit or loss immediately. The Credit Union does not have any outstanding contracts or financial instruments with embedded derivatives that require separate recognition.
Effective interest method
The effective interest method is a method of calculating the amortized cost of a financial asset or financial liability and allocating interest income or interest expense over the relevant period. The effective interest rate is the rate that exactly discounts estimated future cash receipts or payments through the expected life of the financial instrument, or when appropriate, a shorter period to the net carrying amount of the financial asset or financial liability.
Transaction costs Transaction costs are incremental costs that are directly attributable to the acquisition, issue or
disposal of a financial asset or financial liability. Transaction costs include fees and commissions paid to agents, advisors, brokers and dealers, levies by regulatory agencies and securities exchanges, transfer taxes and duties. Transaction costs do not include debt premiums or discounts, financing costs or internal administrative or holding costs. The Credit Union recognizes transaction costs as part of the carrying amount of all financial instruments except those classified as at FVTPL.
Fair value of financial instruments The fair value of a financial instrument is the amount for which an asset could be exchanged, or
a liability settled, between knowledgeable, willing parties in an arm's length transaction on the measurement date. Fair values are determined by reference to quoted bid or asking prices in an active market. In the absence of an active market, the Credit Union determines fair value based on internal or external valuation models, such as discounted cash flow analysis or using observable market based inputs (bid and ask price) for instruments with similar characteristics and risk profiles.
The Credit Union classifies fair value measurement recognized in the statement of financial position using a three tier fair value hierarchy, which reflects the significance of inputs used in measuring fair value as follows:
Level 1: Quoted prices (unadjusted) are available in active markets for identical assets or liabilities.

34
Level 2: Inputs other than quoted prices in active markets (from Level 1) that are observable for the asset or liability, either directly or indirectly; and
Level 3: Valuation techniques that include significant unobservable inputs.
Fair value measurements are classified in the fair value hierarchy based on the lowest level input that is significant to that fair value measurement. This assessment requires judgment, considering factors specific to an asset or a liability and may affect placement within the fair value hierarchy.
Financial asset impairment The Credit Union assesses financial assets, other than those recorded at FVTPL, for indicators
of impairment at each reporting period. Financial assets are considered to be impaired when there is objective evidence that, as a result of one or more events that occurred after initial recognition, the estimated future cash flows of the asset have been negatively affected.
Objective evidence of impairment could include significant financial difficulty of the issuer or
counterparty, default or delinquency by the borrower, indications that the borrower will enter bankruptcy, disappearance of an active market for the security, prolonged decline in fair value of a security, or other observable data relating to a portfolio of assets such as adverse changes in the payment status of borrowers in the portfolio, or national or local economic conditions that correlate with defaults on the assets in the portfolio.
For certain categories of financial assets, such as loans, assets that are assessed not to be
impaired individually are, in addition, assessed for impairment on a collective basis. In assessing collective impairment, the Credit Union considers historical experience on similar assets in similar economic conditions.
Impairment losses on financial assets carried at amortized cost is measured as the difference
between the financial asset’s carrying amount and the present value of estimated future cash flows, discounted at the financial asset’s original effective interest rate. The carrying amount of the financial asset is reduced by the impairment loss directly for all financial assets with the exception of loans, which is reduced through the use of allowance accounts. Impairment losses are recognized in profit or loss.
When available for sale financial assets are considered impaired, cumulative gains or losses
previously recognized in other comprehensive income are reclassified to profit or loss in the period.
With the exception of available for sale equity instruments, if, in a subsequent period, the
amount of the impairment loss decreases and the decrease can be objectively related to an event occurring after the impairment loss was recognized, the previously recognized impairment loss is reversed through profit or loss to the extent that the carrying amount of the investment at the date the impairment is reversed does not exceed what the amortized cost would have been had the impairment not been recognized. Any subsequent recovery in the fair value of an impaired available for sale equity instrument is recognized in other comprehensive income.
35
Cash and cash equivalents Cash consists of cash and cash equivalents on hand and cheques in transit (net).
Investments Investments are initially measured at fair value. For investments not classified as FVTPL,
incremental transaction costs are added to the initial measurement. Subsequent measurement is determined based on the classification of the instrument.
Loans receivable Loans are initially measured at fair value plus transaction costs and subsequently at amortized
cost using the effective interest method, less any impairment. A loan is classified as impaired (doubtful) when there is no longer reasonable assurance that the principal and interest will be collected in full. The allowance is comprised of two components – individual allowances and collective allowances, calculated as follow: (i) The Credit Union records specific individual allowances based on management's regular
review and evaluation of individual loans. The estimated realizable amount represents management's best estimate of the present value of future cash flows expected to be received, discounted at the loan's effective contractual interest rate. As a practical expedient, impairment may be measured on the basis of the instrument’s fair value using an observable market price. The calculation of the present value of the estimated future cash flows of a collateralized financial asset reflects the cash flows that may result from foreclosure less costs for obtaining and selling the collateral, whether or not foreclosure is probable.
(ii) The Credit Union records collective allowances for loans with similar credit risk characteristics, that have not been individually assessed as impaired when objective evidence of impairment within the groups of loans exists, but the individually impaired loans cannot be identified. In assessing the need for collective allowances, management considers factors such as credit quality, portfolio size and economic factors. The Credit Union estimates the collective allowance for impairment using a formula based on its historical loss experience for similar groups of loans in similar economic circumstances and current economic conditions. As management identifies individually impaired loans, it assigns an individual allowance for impairment to that loan and adjusts the collective allowance accordingly.
Assets held for sale Assets are considered held for sale if their carrying amount will be recovered principally through a sale transaction rather than through continuing use. This condition is met only when the sale is highly probable and the asset is available for immediate sale in its present condition. Management must be committed to the sale, which should be expected to be completed within one year from the date of classification.

36
Property, Plant and Equipment Property, plant and equipment are reported at cost less accumulated depreciation and any
accumulated impairment losses. Depreciation is calculated using the straight line method over the estimated useful life of the related asset as follows, with the exception of land which is not depreciated:
Facilities 40 years Furniture and equipment 10 years Computer hardware 4-8 years The estimated useful lives, residual values and depreciation methods are reviewed at each year
end and adjusted if appropriate. Gains and losses on the disposal or retirement of property, plant and equipment is determined
as the difference between the sales proceeds and the carrying amount of the asset and are recorded in profit or loss in the year of disposal.
Membership shares Shares are classified as financial liabilities in accordance with their terms. Shares are redeemable
at the option of the member, either on demand or on withdrawal from membership.
Loan interest revenue Loan and lease interest revenue is recognized on the accrual basis using the effective interest rate method for all loans not classified as impaired. When a loan becomes impaired, recognition of interest income ceases when the carrying amount of the loan (including accrued interest) exceeds the estimated realizable amount of the underlying security. The amount of initial impairment and any subsequent changes are recorded through the provision for credit losses as an adjustment of the specific allowance. Fees that are an integral part of the effective interest rate of the financial instrument, including loan origination, commitment, restructuring and renegotiation fees, are capitalized as part of the related asset and amortized to interest income over the term of the loan using the effective interest method.
Investment interest revenue Investment interest income is recognized on the accrual basis using the effective interest method. Purchase premiums and discounts are amortized using the effective interest method over the term to maturity of the applicable investment.
Swap interest revenue and expenses Swap interest revenue and expenses are calculated on an accrual basis on fair value and the
result netted for reporting purposes.
Other income Other revenue is recognized in the fiscal period in which the related service is provided.

37
Foreign currency translation Transaction amounts denominated in foreign currencies are translated into Canadian dollar
equivalents at exchange rates prevailing at the transaction dates. Carrying values of monetary assets and liabilities reflect the exchange rates at the reporting date. Carrying values of non-monetary assets and liabilities measured at historical cost reflect the exchange rates at the date of the transaction. Non-monetary assets and liabilities that are measured at fair value are translated to Canadian dollars at the exchange rate at the date the fair value was determined. Translation gains and losses are included in profit or loss, except for available for sale equity instruments which are recognized in other comprehensive income.
Income taxes Income tax expense is comprised of current and deferred taxes which are recognized in profit
or loss except to the extent that it relates to items recognized directly in equity or in other comprehensive income.
Current income tax is the expected tax payable or receivable on the taxable income or loss for the year, using tax rates enacted or substantially enacted at the reporting date, and any adjustments to tax payable in respect of previous years.
Deferred income tax assets and liabilities are recognized for the future tax consequences
attributable to temporary differences between financial statement carrying amounts and amounts used for tax purposes. These amounts are measured using enacted or substantially enacted tax rates at the reporting date and re-measured annually for rate changes. Deferred income tax assets are recognized for the benefit of deductions available to be carried forward to future periods for tax purposes to the extent that it is probable that taxable profit will be available against which the deductible temporary differences can be utilized. Deferred income tax assets are reviewed at each reporting date and are reduced to the extent that is no longer probable that the related tax benefit will be realized. Any effect of the re-measurement or re-assessment is recognized in the period of change, except when they relate to items recognized directly in other comprehensive income. The Credit Union is taxed at an effective rate of 14.25% on taxable earnings eligible for that rate and at 28% on the excess balance.
Deferred taxes are offset when there is a legally enforceable right to set off current tax assets
against current tax liabilities and when they relate to income taxes levied by the same taxation authority on the same taxable entity, or for different tax entities where the Credit Union intends to settle its current tax assets and liabilities on a net basis or simultaneously.
Future accounting and reporting changes
The Canadian Accounting Standards Board (AcSB) has issued new and amended IFRS standards under Part I of the CICA Handbook which are not yet effective for the Credit Union. None of the new or amended standards have been implemented in these consolidated financial statements. The significant changes to the standards are as follows:
IFRS 9 Financial Instruments: This standard is currently under revision at this time. It is expected to impact the classification and measurement of financial assets. Effective for the 2013 financial statements.
IFRS 10 Consolidated Financial Statements: This standard establishes principles for the preparation and presentation of consolidated financial statements. Effective for the 2013

38
financial statements.
IFRS 11 Joint Arrangements: This standard affects the identification of joint arrangements and the related accounting requirements. Effective for the 2013 financial statements.
IFRS 12 Disclosure of Interests in Other Entities: This standard affects the nature and extent of disclosures regarding interests in other entities and the related risks. Effective for the 2013 financial statements.
IFRS 13 Fair Value Measurement: This standard reflects the consolidation of fair value standards into one location, including the definition of fair value, a framework for measuring fair value and prescribing disclosures about fair value measurements. Effective for the 2013 financial statements.
The Credit Union has not determined the effect, if any, of the above standards on the financial statements.
4. CASH AND CASH EQUIVALENTS
2011 2010 January 1, 2010
Cash and balances with the Credit Union $4,056,193 $3,918,879 $7,609,576
Total $4,056,193 $3,918,879 $7,609,576

39
5. INVESTMENTS
2011 2010 January 1, 2010
Loans and receivables Accrued Interest $1,130,365 $781,298 $919,480
1,130,365 781,298 919,480
Held for trading
Central 1 Bid Deposit 2,370,898 1,161,479 0 Concentra Bid Deposit 0 0 8,000,000 SaskCentral Demand Deposit 19,900,000 0 11,200,000 Provincial and Corporate Bonds 30,575,356 28,509,782 25,973,536
52,846,254 29,671,261 45,173,536
Available for sale
SaskCentral Debenture 1,940,000 1,940,000 1,940,000 SaskCentral Shares 3,919,710 3,919,710 3,919,710 Other Investments 1,170,616 947,759 908,479
7,030,326 6,807,469 6,768,179
Held to maturity SaskCentral Liquidity Deposits 43,878,500 39,528,500 37,828,500
43,878,500 39,528,500 37,828,500
$104,885,445 $76,788,528 $90,689,695
At December 31, 2011, the market value of investments classified as held to maturity is $44,350,311 (2010 - $39,683,590). Pursuant to Regulation 18(1) (a), Credit Union Central of Saskatchewan (SaskCentral) requires that the Credit Union maintain 10% of its liabilities using a prescribed formula in specified liquidity deposits in SaskCentral. The regulator of Saskatchewan Credit Unions, CUDGC requires that the Credit Union adhere to these prescribed limits and restrictions. As of December 31, 2011 the Credit Union met the requirement. At December 31, 2011, $49,189,717 (2010 - $55,383,334) of investments are expected to be recovered more than 12 months after the reporting date.

40
6. LOANS
2011
Allowances
Current Loans Impaired Loans
Specific Collective Net
Guaranteed * $97,157,716 $0 $0 $0 $97,157,716 Conventional Mortgages: -Residential & Farm 197,207,876 509,774 0 0 197,717,650 Personal Loans 35,413,178 58,535 41,414 0 35,430,299 Non-personal Loans 54,677,747 5,395,911 650,833 0 59,422,825 Line of credit, overdrafts 194,776 12,790 12,932 0 194,634 Accrued Interest 553,176 250,349 0 0 803,525
Total loans $385,204,469 $6,227,359 $705,179 $0 $390,726,649
2010
Allowances
Current Loans
Impaired Loans
Specific
Collective
Net
Guaranteed * $79,774,478 $0 $0 $0 $79,774,478 Conventional Mortgages -Residential & Farm 180,333,473 674,020 45,000 0 180,962,493 Personal Loans 30,200,081 46,132 66,092 0 30,180,121 Non-personal Loans 50,023,548 4,434 4,444 0 50,023,538 Lines of credit, overdrafts 199,924 7,463 7,553 0 199,834 Accrued Interest 526,805 1,106 0 0 527,911
Total loans $341,058,309 $733,155 $123,089 $0 $341,668,375
January 1, 2010 Allowances
Current Loans Impaired
Loans
Specific
Collective
Net
Guaranteed * $64,889,133 $0 $0 $0 $64,889,133 Conventional Mortgages -Residential & Farm 177,059,016 426,298 110,679 0 177,374,635 Personal Loans 26,731,119 57,651 36,921 0 26,751,849 Non-personal Loans 45,610,023 6,410 0 0 45,616,433 Lines of credit, overdrafts 178,792 7,531 7,788 0 178,535 Accrued Interest 472,629 689 0 0 473,318
Total loans $314,940,713 $498,579 $155,388 $0 $315,283,904
*Guaranteed loans include loans which are guaranteed or insured under programs administered by federal and provincial governments, their agents or private loan insurance companies.

41
At December 31, 2011, $146,944,059 (2010 - $129,112,978) of loans are expected to be recovered more than 12 months after the reporting date. Allowance for impaired loans 2011 2010 January 1, 2010
Individual Collective Individual
Collective Individual
Collective
Balance, beginning of year $123,089 $0 $155,387 $0 $155,387 $0 Impairment losses Recognized 702,564 0 62,112 0 0 0 Amounts written-off (120,474) 0 (94,410) 0 0 0
Balance, end of year $705,179 $0 $123,089 $0 $155,387 $0
The aging of loans, including those past due but not impaired and those that were individually impaired, as at December 31, 2011 was:
2011 2010 January 1, 2010
Performing
Impaired
Performing
Impaired
Performing
Impaired
Current $1,197,903 $4,082 $229,064 $10,185 $147,814 $214,438 31 – 60 days 670,473 39,466 335,091 16,070 373,840 3,129 61 – 90 days 341,454 3,861 141,840 0 3,660 110,658 90 – 120 days 5,000 7,500 0 8,497 10,000 721 120+ days 5,487,758 394,746 0 293,705 0 10,614
Total $7,702,588 $449,655 $705,995 $328,457 $535,314 $339,560
The Credit Union holds collateral against loans to customers in the form of interests over property, other securities over assets, and guarantees.

42
7. PROPERTY, PLANT AND EQUIPMENT
Land Facilities Computer hardware
Furniture and equipment
Total Cost
Balance at January 1, 2010 $2,479,018 $10,381,200 $1,798,725 $3,247,918 $17,906,860
Additions 0 20,951 244,571 59,691 325,212
Disposals 0 0 (2,398) (72,490) (74,888)
Balance at December 31, 2010 $2,479,018 $10,402,151 $2,040,897 $3,235,118 $18,157,184
Balance at January 1, 2011 $2,479,018 $10,402,151 $2,040,897 $3,235,118 $18,157,184 Additions 0 11,911 279,910 43,015 334,835 Disposals 0 0 (32,224) (27,718) (59,942)
Balance at December 31, 2011 $2,479,018 $10,414,062 $2,288,583 $3,250,415 $18,432,078
Balance at January 1, 2010 $0 $1,694,196 $1,631,296 $2,382,642 $5,708,134
Depreciation expense 0 306,395 166,140 223,248 695,783
Disposals 0 0 (2,398) (66,821) (69,219)
Balance at December 31, 2010 $0 $2,000,591 $1,795,038 $2,539,069 $6,334,698
Balance at January 1, 2011 $0 $2,000,591 $1,795,038 $2,539,069 $6,334,698 Depreciation expense 0 307,586 145,761 184,499 637,846 Disposals 0 0 (32,224) (14,485) (46,709)
Balance at December 31, 2011 $0 $2,308,177 $1,908,575 $2,709,084 $6,925,835
Net book value
Balance at January 1, 2010 $2,479,018 $8,687,004 $167,429 $865,275 $12,198,726
Balance at December 31, 2010 $2,479,018 $8,401,560 $245,859 $696,049 $11,822,486
Balance at December 31, 2011 $2,479,018 $8,105,885 $380,008 $541,332 $11,506,242
8. OTHER ASSETS 2011 2010 January 1, 2010
Items in transit $488,755 ($67,242) ($47,843) Foreclosed property 148,897 0 247,680
$637,652 ($67,242) $199,837
During the year, the Credit Union obtained properties with a carrying value of $148,897 (2010 - $0) by taking possession of collateral held as security. Repossessed property is sold as soon as practicable, with the proceeds used to reduce the outstanding indebtednesses. Repossessed property is classified as assets held for sale and included within other assets.

43
9. DEPOSITS 2011 2010 January 1, 2010
Demand deposits $170,166,936 $153,710,256 $154,062,852 Term deposits 193,653,232 145,214,471 145,133,214 RRSP deposits 53,814,126 50,655,146 50,394,257 RRIF deposits 25,043,551 23,402,669 22,882,274 RESP deposits 4,215,248 4,156,557 3,900,624 TFSA deposits 16,118,880 10,031,428 5,441,235
$463,011,971 $387,170,526 $381,814,456
At December 31, 2011, $155,027,056 (2010 - $127,428,269) of deposits are other than demand and expected to mature in more than 12 months after the reporting date.
10. LOANS PAYABLE The Credit Union has an authorized line of credit with SaskCentral in the amount of $8,000,000 Canadian and $100,000 US. The line of credit is secured by an assignment of book debts and funds on deposit with a interest rate structure based on the SaskCentral prime rate. At year end, the amount outstanding was $0 (2010 - $0) on the Canadian line of credit and $0 US (2010 - $0) on the US line of credit.
The Credit Union through a commercial paper funding agreement with SaskCentral can borrow up to $15,000,000. The loan bears interest at a rate equal to the RIL Commercial Paper Market Term Rate as established from time to time plus 37.5 basis points per annum. At the end of the year the amount outstanding was $0 (2010 - $0).
11. OTHER LIABILITIES
2011 2010 January 1, 2010
Deferred income $542,910 $376,557 $43,907 Deferred income tax liability (166,000) (28,063) (28,063) Unclaimed balances 18,639 17,437 16,109
$395,549 $365,931 $31,953
12. MEMBERSHIP SHARES
Membership shares are as provided for by The Credit Union Act, 1998, and administered according to the terms of the Credit Union bylaws which sets out the rights, privileges, restrictions and conditions.
The authorized share capital is unlimited in amount and consists of fully paid shares with a par value of $5 per share. These accounts are not guaranteed by CUDGC. Characteristics include permanence, freedom from mandatory charge and subordination to the rights of creditors and depositors.
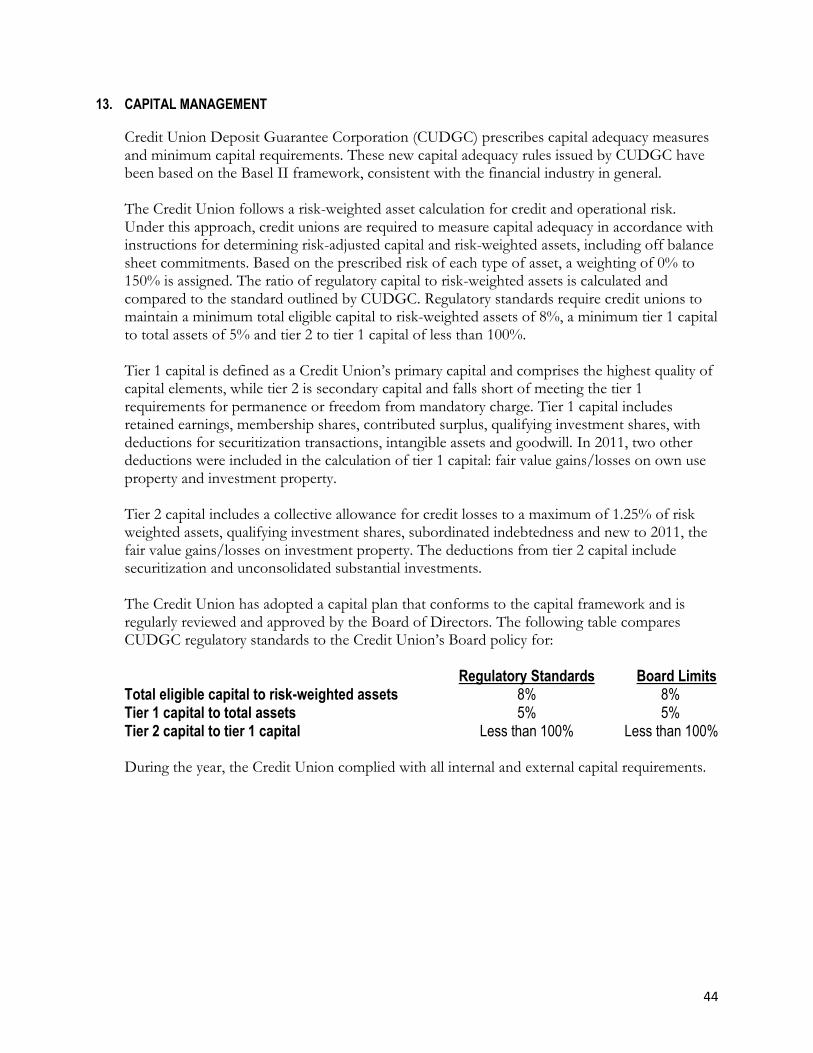
44
13. CAPITAL MANAGEMENT
Credit Union Deposit Guarantee Corporation (CUDGC) prescribes capital adequacy measures and minimum capital requirements. These new capital adequacy rules issued by CUDGC have been based on the Basel II framework, consistent with the financial industry in general.
The Credit Union follows a risk-weighted asset calculation for credit and operational risk. Under this approach, credit unions are required to measure capital adequacy in accordance with instructions for determining risk-adjusted capital and risk-weighted assets, including off balance sheet commitments. Based on the prescribed risk of each type of asset, a weighting of 0% to 150% is assigned. The ratio of regulatory capital to risk-weighted assets is calculated and compared to the standard outlined by CUDGC. Regulatory standards require credit unions to maintain a minimum total eligible capital to risk-weighted assets of 8%, a minimum tier 1 capital to total assets of 5% and tier 2 to tier 1 capital of less than 100%.
Tier 1 capital is defined as a Credit Union’s primary capital and comprises the highest quality of capital elements, while tier 2 is secondary capital and falls short of meeting the tier 1 requirements for permanence or freedom from mandatory charge. Tier 1 capital includes retained earnings, membership shares, contributed surplus, qualifying investment shares, with deductions for securitization transactions, intangible assets and goodwill. In 2011, two other deductions were included in the calculation of tier 1 capital: fair value gains/losses on own use property and investment property.
Tier 2 capital includes a collective allowance for credit losses to a maximum of 1.25% of risk weighted assets, qualifying investment shares, subordinated indebtedness and new to 2011, the fair value gains/losses on investment property. The deductions from tier 2 capital include securitization and unconsolidated substantial investments.
The Credit Union has adopted a capital plan that conforms to the capital framework and is regularly reviewed and approved by the Board of Directors. The following table compares CUDGC regulatory standards to the Credit Union’s Board policy for:
Regulatory Standards Board Limits Total eligible capital to risk-weighted assets 8% 8% Tier 1 capital to total assets 5% 5% Tier 2 capital to tier 1 capital Less than 100% Less than 100% During the year, the Credit Union complied with all internal and external capital requirements.
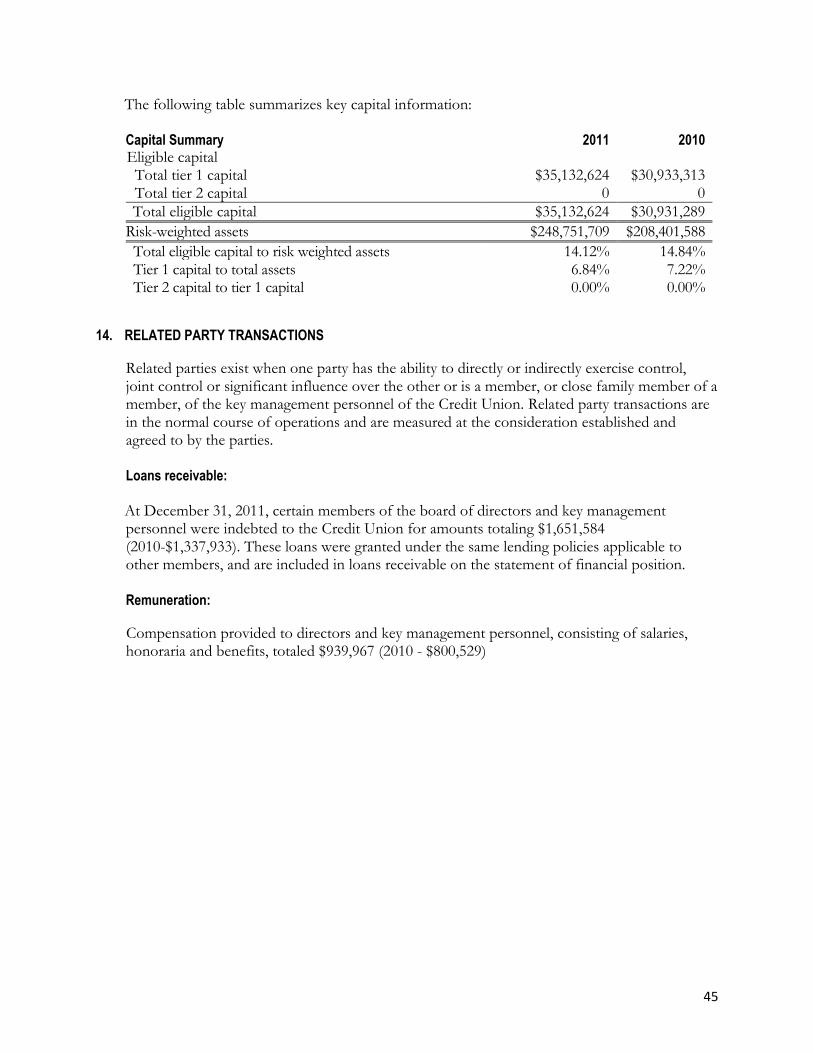
45
The following table summarizes key capital information:
Capital Summary 2011 2010 Eligible capital Total tier 1 capital $35,132,624 $30,933,313 Total tier 2 capital 0 0
Total eligible capital $35,132,624 $30,931,289
Risk-weighted assets $248,751,709 $208,401,588
Total eligible capital to risk weighted assets 14.12% 14.84% Tier 1 capital to total assets 6.84% 7.22% Tier 2 capital to tier 1 capital 0.00% 0.00%
14. RELATED PARTY TRANSACTIONS
Related parties exist when one party has the ability to directly or indirectly exercise control, joint control or significant influence over the other or is a member, or close family member of a member, of the key management personnel of the Credit Union. Related party transactions are in the normal course of operations and are measured at the consideration established and agreed to by the parties.
Loans receivable: At December 31, 2011, certain members of the board of directors and key management
personnel were indebted to the Credit Union for amounts totaling $1,651,584 (2010-$1,337,933). These loans were granted under the same lending policies applicable to other members, and are included in loans receivable on the statement of financial position.
Remuneration:
Compensation provided to directors and key management personnel, consisting of salaries, honoraria and benefits, totaled $939,967 (2010 - $800,529)

46
15. CLASSIFICATION AND FAIR VALUE OF FINANCIAL INSTRUMENTS
The following table summarizes the classification of the Credit Union’s financial instruments.
2011
Designated as
FVTPL
Held for Trading
Held to
Maturity
Loans and
Receivables
Available for
Sale
Other
Amortized Cost
Total Carrying
Amount
FINANCIAL ASSETS
Cash and cash equivalents
$4,056,193 $4,056,193
Investments 52,846,254 $43,878,500 $1,130,365 $7,030,326 104,885,445 Loans 390,726,649 390,726,649 Accounts Receivable 209,058 209,058 Derivatives 824,492 824,492
$57,726,939 $43,878,500 $392,066,072 $7,030,326 $500,701,837
FINANCIAL LIABILITIES
Deposits $463,011,971 $463,011,971 Loans Payable 9,908,233 9,908,233 Accounts Payable 4,275,284 4,275,284 Membership Shares 116,361 116,361
$477,311,849 $477,311,849

47
2010
Designated as
FVTPL
Held for Trading
Held to
Maturity
Loans and
Receivables
Available for
Sale
Other
Amortized Cost
Total Carrying
Amount
FINANCIAL ASSETS
Cash and cash equivalents
$3,918,879 $3,918,879
Investments 29,671,261 $39,528,500 $781,298 $6,807,469 76,788,528 Loans 341,668,375 341,668,375 Accounts Receivable 291,331 291,331 Derivatives 789,351 789,351
$34,379,491 $39,528,500 $342,741,004 $6,807,469 $423,456,464
FINANCIAL LIABILITIES
Deposits $387,170,526 $387,170,526 Loans Payable 13,648,085 13,648,085 Accounts Payable 3,439,197 3,439,197 Membership Shares 119,175 119,175
$404,376,983 $404,376,983

48
The following table summarizes the classification of the Credit Union’s financial instruments.
January 1, 2010
Designated as FVTPL
Held for Trading
Held to
Maturity
Loans and
Receivables
Available for
Sale
Other
Amortized Cost
Total Carrying
Amount
FINANCIAL ASSETS Cash and cash equivalents
$7,609,576 $7,609,576
Investments 45,173,536 $37,828,500 $919,480 $6,768,179 90,689,695 Loans 315,283,904 315,283,904 Accounts Receivable 508,557 508,557 Derivatives 1,246,218 1,246,218
$54,029,330 $37,828,500 $316,711,941 $6,768,179 $415,337,950
FINANCIAL LIABILITIES
Deposits $381,814,456 $381,814,456 Loans Payable 15,802,507 15,802,507 Accounts Payable 2,613,099 2,613,099 Membership Shares 124,130 124,130
$400,354,192 $400,354,192

49
15. CLASSIFICATION AND FAIR VALUE OF FINANCIAL INSTRUMENTS (continued)
The following table summarizes the carrying amount and fair values of the Credit Union’s financial instruments.
2011 2010 January 1, 2010
Carrying value Fair value Carrying value Fair value Carrying value Fair value
FINANCIAL ASSETS Cash and cash equivalents $4,056,193 $4,056,193 $3,918,879 $3,918,879 $7,609,576 $7,609,576 Investments 104,885,446 105,546,853 76,788,528 77,089,031 90,689,695 91,268,277 Loans 390,726,649 390,726,649 341,668,375 341,668,375 315,283,904 315,283,904 Accounts Receivable 209,058 209,058 291,331 291,331 508,557 508,557 Derivatives 824,492 824,492 789,351 789,351 1,246,218 1,246,218
$500,701,838 $501,363,245 $423,456,464 $423,756,967 $415,337,950 $415,916,532
FINANCIAL LIABILITIES Deposits $463,011,971 $463,011,971 $387,170,526 $387,170,526 $381,814,456 $381,814,456 Loans Payable 9,908,233 9,908,233 13,648,085 13,648,085 15,802,507 15,802,507 Accounts Payable 4,275,284 4,275,284 3,439,197 3,439,197 2,613,099 2,613,099 Membership Shares 116,361 116,361 119,175 119,175 124,130 124,130
$477,311,849 $477,311,849 $404,376,983 $404,376,983 $400,354,192 $400,354,192
The following methods and assumptions were used to estimate fair values of financial instruments: The fair values of short term financial instruments including cash, other assets, and other liabilities are approximately equal to their book values due to their short term nature. Fair values of investments are based on quoted market prices, when available, or quoted market prices of similar investments. For variable interest rate loans that re-price frequently, fair values approximate book values. Fair values of other loans are estimated using discounted cash flow calculations with market interest rates for similar groups of loans. The fair values of deposits with unspecified maturity terms are approximately equal to their carrying values. Fair values for other deposits and loans payable with specified maturity terms is estimated using discounted cash flow calculations at market interest rates for similar groups of deposits. The fair values of derivative financial instruments are estimated by reference to the appropriate current market yields with matching terms of maturity. The fair values reflect the estimated amount that the Credit Union would receive or pay to terminate the contracts at the reporting date.
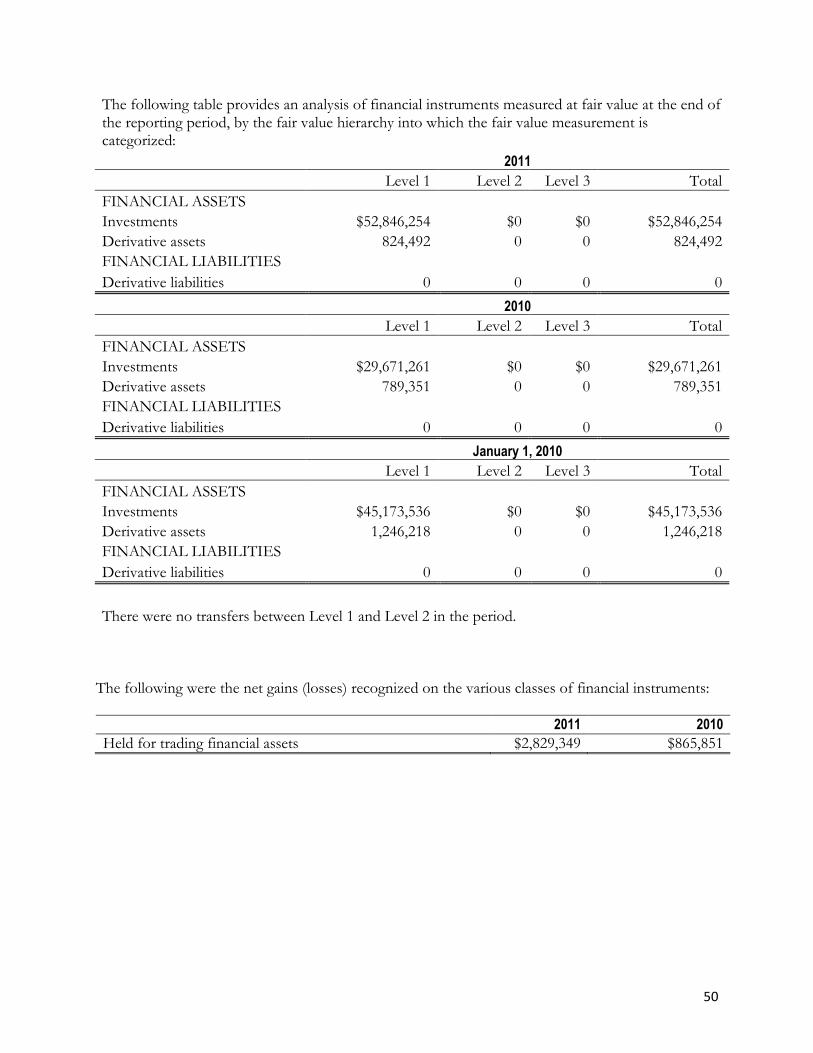
50
The following table provides an analysis of financial instruments measured at fair value at the end of the reporting period, by the fair value hierarchy into which the fair value measurement is categorized:
2011
Level 1 Level 2 Level 3 Total
FINANCIAL ASSETS Investments $52,846,254 $0 $0 $52,846,254
Derivative assets 824,492 0 0 824,492
FINANCIAL LIABILITIES Derivative liabilities 0 0 0 0
2010
Level 1 Level 2 Level 3 Total
FINANCIAL ASSETS Investments $29,671,261 $0 $0 $29,671,261
Derivative assets 789,351 0 0 789,351
FINANCIAL LIABILITIES Derivative liabilities 0 0 0 0
January 1, 2010
Level 1 Level 2 Level 3 Total
FINANCIAL ASSETS Investments $45,173,536 $0 $0 $45,173,536
Derivative assets 1,246,218 0 0 1,246,218
FINANCIAL LIABILITIES Derivative liabilities 0 0 0 0
There were no transfers between Level 1 and Level 2 in the period.
The following were the net gains (losses) recognized on the various classes of financial instruments:
2011 2010
Held for trading financial assets $2,829,349 $865,851

51
16. FINANCIAL INSTRUMENT RISK MANAGEMENT
Credit risk Credit risk is the risk of financial loss to the Credit Union if a customer or counterparty defaults
on its contractual payment obligations. Credit risk may arise from loans and receivables and principal and interest amounts due on investments.
Credit risk is managed in accordance with policies and procedures established by the Board of
Directors. In addition, CUDGC establishes standards with which the Credit Union must comply. The Credit Union's Board has established lending policies and procedures which outline the minimum standards and criteria for granting credit to borrowers. Certain types of lending are subject to an annual review process to ensure that standards continue to be met. Accounts which are deemed to be of higher than average risk are monitored more frequently. Policy and procedures also specify the type of assets which may be taken as collateral and the techniques for valuation.
The Credit Union has established credit limits for individual borrowers to manage overall credit risk of the portfolio and establish parameters for credit diversification. The maximum aggregate credit per member is limited to 25% of capital and the maximum unsecured lending limit is $50,000. The established portfolio mix limits are:
Board Objectives Actual Consumer 81% 82% Agriculture 0% 0% Commercial 19% 18%
Except as otherwise noted below, the carrying amount of the financial assets recognized in the
financial statements, which is net of impairment losses, represents the Credit Union’s maximum exposure to credit risk, without taking into account collateral or other credit enhancements held.
In addition, in the normal course of business, the Credit Union has entered into various commitments to extend credit that are not reported on the statement of financial position, including guarantees and letters of credit. The primary purpose of these contracts is to make funds available for the financing needs of customers. These are subject to normal credit standards, financial controls, risk management and monitoring procedures.
Guarantees and standby letters of credit represent irrevocable commitments that the Credit Union will make payments in the event that a customer can not meet its obligations to third parties, and they carry the same risk, recourse and collateral security requirements as loans extended to customers. Commercial letters of credit are instruments issued on behalf of a customer authorizing a third party to draw drafts on the Credit Union up to a stipulated amount subject to specific terms and conditions. The Credit Union is at risk for any drafts drawn that are not ultimately settled by the customer, but the amounts are collateralized by the goods to which they relate. Commitments to extend credit represent unutilized portions of authorizations to extend credit in the form of loans, bankers’ acceptances or letters of credit.
The amounts reported below represent the maximum credit exposure for commitments to
extend credit to the Credit Union. Many of these contracts expire without being drawn upon, thereby reducing the Credit Union’s credit risk from the maximum commitment. As many

52
commitments will expire or terminate without being funded, the amounts shown on the table below do not necessarily represent future cash requirements.
2011 2010
Undrawn lines of credit $71,321,230 $68,603,896
Letters of credit 331,500 163,500
Commitments to extend credit 41,010,890 18,102,603
Total income tax expense $112,663,620 $86,869,999
Liquidity risk Liquidity risk is the risk of financial loss to the Credit Union in the event that the Credit Union
is unable to generate or obtain the necessary cash or cash equivalents in a timely manner, at a reasonable price, to meet its financial commitments as they come due.
Liquidity risk is managed in accordance with policies and procedures established by the Board
of Directors. In addition, CUDGC establishes standards to which the Credit union must comply. The Credit Union’s primary liquidity risk policies and procedures include liquidity, capital management and asset/liability management (ALM) policies.
The Credit Union enters into transactions to purchase goods and services on credit and/or
borrow funds for which repayment is required at various maturity dates, including processing the financial transactions of borrowers and depositors. Liquidity risk is measured by reviewing the Credit Union's future cash flows for the possibility of a negative net cash flow. The contractual maturities of financial liabilities can be found within the table under interest rate risk below.

53
Market risk Market risk is the risk of loss in value of financial instruments that may arise from changes in
market factors such as interest rates, equity prices and credit spreads. The Credit Union's exposure changes depending on market conditions.
Market risk is managed in accordance with policies and procedures established by the Board of
Directors. In addition, CUDGC establishes standards to which the Credit Union must comply. The Credit Union’s primary market risk policies and procedures include the asset/liability management (ALM) policy.
The primary market risk that the Credit Union is exposed to is interest rate risk. Interest rate
risk is the potential adverse impact on the earnings due to changes in interest rates. The Credit Union’s exposure to interest rate risk arises primarily from timing differences in the re-pricing of assets and liabilities, including financial assets and liabilities with fixed and floating rates. The Credit Union's exposure to interest rate risk can be measured by the mismatch or gap, between the assets, liabilities and off balance sheet instruments scheduled to mature or re-price on particular dates. Gap analysis measures the difference between the amount of assets and liabilities that re-price in specific time periods.
To manage exposure to interest rate fluctuations and to manage asset and liability mismatch,
the Credit Union may enter into interest rate swaps. These minimize the interest rate risk and cash required to liquidate the contracts by entering into counter balancing positions. The Credit Union used interest rate swaps in the current year.

54
The table below summarizes the carrying amounts of financial instruments exposed to interest rate risk by the earlier of the contractual re-pricing/maturity dates. Re-pricing dates are based on the earlier of maturity or the contractual re-pricing date and effective interest rates, where applicable, represent the weighted average effective yield.
2011
Assets
On Demand Within 3 months
Over 3 months to 1 year
Over 1 year to 5 years Over 5 years
Non-Interest sensitive Total
Cash
$4,056,193 $0 $0 $0 $0 $0 $4,056,193
Investments 27,233,249 9,625,915 17,946,533 37,896,397 11,293,320 890,031 104,885,445
Loans
195,853,120 7,008,055 40,733,533 145,576,430 1,555,511 0 390,726,649
Other Assets 0 0 0 0 0 13,825,902 13,825,902
Total
$227,142,562 $16,633,970 $58,680,066 $183,472,827 $12,848,831 $14,715,933 $513,494,189
Liabilities Deposits
$121,069,666 $27,381,714 $97,888,748 $155,027,056 $30,000,000 $31,644,788 $463,011,971
Other Liabilities 50,482,218 0 0 0 0 0 50,482,218
Total
$171,551,884 $27,381,714 $97,888,748 $155,027,056 $30,000,000 $31,644,788 $513,494,189
On balance sheet gap $55,590,678 ($10,747,743) ($39,208,682) $28,445,771 ($17,151,169) ($16,928,855) $0
2010
Assets
On Demand Within 3 months
Over 3 months to 1 year
Over 1 year to 5 years Over 5 years
Non-Interest sensitive Total
On balance sheet gap $54,018,442 ($7,723,136) ($28,020,564) $35,024,313 ($7,875,975) ($45,423,081) $0
The above tables do not identify management’s expectations of future events where re-pricing and maturity dates differ from contractual dates.
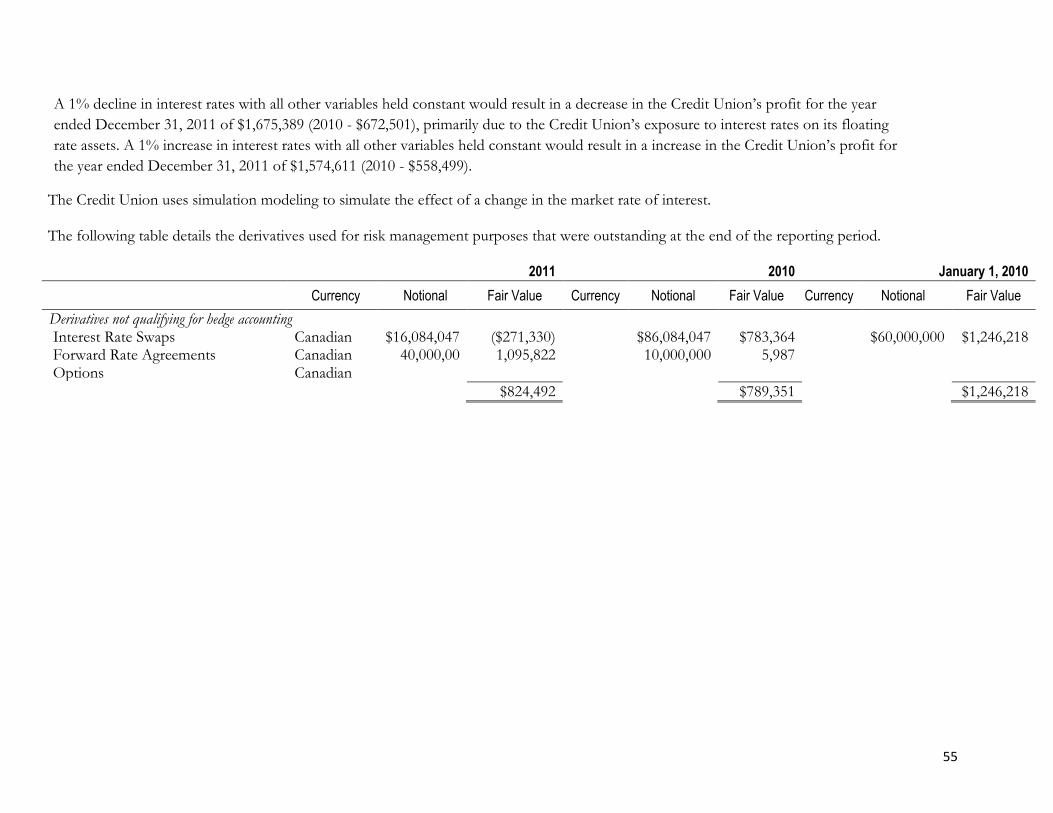
55
A 1% decline in interest rates with all other variables held constant would result in a decrease in the Credit Union’s profit for the year
ended December 31, 2011 of $1,675,389 (2010 - $672,501), primarily due to the Credit Union’s exposure to interest rates on its floating
rate assets. A 1% increase in interest rates with all other variables held constant would result in a increase in the Credit Union’s profit for
the year ended December 31, 2011 of $1,574,611 (2010 - $558,499).
The Credit Union uses simulation modeling to simulate the effect of a change in the market rate of interest. The following table details the derivatives used for risk management purposes that were outstanding at the end of the reporting period.
2011 2010 January 1, 2010
Currency Notional Fair Value Currency Notional Fair Value Currency Notional Fair Value
Derivatives not qualifying for hedge accounting Interest Rate Swaps Canadian $16,084,047 ($271,330) $86,084,047 $783,364 $60,000,000 $1,246,218 Forward Rate Agreements Canadian 40,000,00 1,095,822 10,000,000 5,987 Options Canadian
$824,492 $789,351 $1,246,218

56
17. COMMITMENTS
The Credit Union has entered into agreements expiring on various dates to the year of 2016. These agreements are for clearing services, data processing services, and sponsorship. Management believes that these obligations are part of ongoing operations and are not unduly significant to the financial results of the credit union.
18. INCOME TAXES
On January 1, 2011 the federal corporate business rate decreased to 16.5% (18% in 2010), reducing the combined federal and provincial tax rate to 28.5% (30% in 2010). The federal corporate business rate will further decrease to 15% on January 1, 2012.
Income taxes Income tax expense is comprised of:
2011 2010
Current tax expense Current period $1,332,793 $819,090
1,332,793 819,090
Deferred tax expense Origination and reversal of temporary differences (157,321) 0
Changes in tax rates and tax laws 57,375 0
Other differences (37,991) 0
(137,937) 0
Total income tax expense $1,194,856 $819,090
The income tax expense for the year can be reconciled to the accounting profit as follows:
2011 2010
Income before provision for income taxes $5,396,982 $3,513,870
Combined federal and provincial tax rate 14.25% 15.50%
Income tax expense at statutory rate 769,070 544,650
Adjusted for the effect of: Non-deductible expenses 2,863 1,034
Deferred tax expense due to change in income tax rate 57,375 0
Difference due to change in accounting policy 0 10,385
Other differences 365,548 263,021
$1,194,856 $819,090
On July 1, 2011 the Saskatchewan corporate small business rate decreased to 2% (4.5% in 2010), reducing the combined federal and provincial small business tax rate to 13% (15.50% in 2010).

57
Deferred income tax assets and liabilities recognized are attributable to the following:
2011 2010
Deferred income tax assets Other $26,676 $997
Loans 3,340 151
Non-capital loss carryforward 172,503 36,778
$202,518 $37,925
Deferred income tax liabilities Property and equipment 36,518 9,862
$36,518 $9,862
Net deferred income taxes $166,000 $28,063
2011 2010
Deferred tax assets -To be recovered within 12 months $202,518 $37,925
Deferred income tax liabilities -To be recovered after more than 12 months $36,518 $9,862
19. EMPLOYEE FUTURE BENEFITS
The Credit Union's employee future benefit program consists of a defined contribution pension plan. Credit Union contributions to the defined contribution plan are expensed as incurred.
Pension benefits of $385,924 (2010 - $376,278) were paid to defined contribution retirement plans during the year.
20. SECURITIZATION OF MORTGAGE LOAN POOLS
In 2009, the Credit Union transferred an ownership interest in specific mortgage loan receivables, through the Canadian Mortgage Bond (CMB) program, in the amount of $16,072,085. The Credit union has a retained interest in these receivables, which represents the portion of credit risk the Credit Union would be responsible for if realized. The Credit Union retains the responsibility for servicing the loans and remits collections of principle and interest to the program on a monthly basis.
The transfer of these receivables do not meet the requirements for derecognition under IFRS
and therefore, continue to be included on the statement of financial position. The financing received in exchange for the mortgage loan receivables is recorded as a loans payable. The following table shows the mortgage loan receivables balances included in our loans as compared to the respective financing payable under the CMB program.

58
2011 2010 Jan 1, 2010
Mortgage loans receivables $9,928,636 $13,664,842 $15,820,381
Financing payable 9,908,233 13,648,085 15,802,507
21. EXPLANATION OF TRANSITION TO IFRS
The Credit Union adopted IFRS effective January 1, 2011 and the consolidated financial statements for the year ended December 31, 2011 are the first annual financial statements that comply with IFRS. Prior to the adoption of IFRS, the Credit Union prepared its consolidated financial statements in accordance with Canadian generally accepted accounting principles (“Canadian GAAP”). The Credit Union’s transition date is January 1, 2010 (“transition date”) and has prepared its opening IFRS statement of financial position at that date.
The accounting policies set out in Note 3 have been applied in preparing the financial statements for the year ended December 31, 2011, the comparative information for the year ended December 31, 2010 and the opening statement of financial position at January 1, 2010.
The Credit Union has applied IFRS 1 First Time Adoption of International Financial Reporting Standards in preparing these financial statements. In preparing the opening statement of financial position, the Credit Union has adjusted amounts previously reported in financial statements prepared in accordance with previous Canadian GAAP. An explanation of how the transition from previous Canadian GAAP to IFRS has effected the Credit Union’s financial position, financial performance and cash flows is set out in the following tables and notes.
Elected exemptions IFRS 1 allows first time adopters certain exemptions from the general requirement to apply
IFRSs with are effective for December 2011 year ends on a retroactive basis. The Credit Union has applied the following elective exemptions:
Business combinations: IFRS 1 allows a first time adopter to elect not to apply IFRS 3 Business Combinations retrospectively to business combinations that occurred before the date of transition. The Credit Union has taken advantage of this election and has not applied IFRS 3 to business combinations that occurred prior to January 1, 2010.
Borrowing costs: The Credit Union has elected not to apply IAS 23 Borrowing Costs to qualifying assets acquired, produced or constructed with a capitalization commencement date prior to the date of transition.
Mandatory exceptions to retrospective application
IFRS 1 requires that first time adopters use the following mandatory exceptions from full retrospective application:
Estimates: Hindsight was not used to rerate or revise estimates. Accordingly, the estimates previously made by the Credit Union under previous Canadian GAAP were not revised for application of IFRS except where necessary to reflect any differences in accounting policies.
Derecognition of financial assets and financial liabilities: The Credit Union has applied the derecognition requirements of IAS 39 Financial Instruments: Recognition and Measurement prospectively for transactions occurring on or after January 1, 2004.

59
21. EXPLANATION OF TRANSITION TO IFRS Effect of transition The following table sets out a reconciliation of total equity under previous Canadian GAAP as at January 1, 2010 and December 31, 2010 to total equity under IFRS:
Effect of transition
The following table sets out a reconciliation of total equity under previous Canadian GAAP as at January 1, 2010 and December 31, 2010 to total equity under IFRS:
As at
For the Year Ended
Note January 1, 2010 December 31, 2010
Total equity under Canadian GAAP $27,447,334 $30,142,114
Transitional Adjustments: General loan allowance (b) 670,000 670,000
Canada Mortgage Bond Program (a) 1,421 2,023
671,421 672,023
Total adjustment to equity 671,421 672,023
Total equity under IFRS $28,118,755 $30,814,137
The following table sets out a reconciliation of total comprehensive income for the year ended December 31, 2010 under previous Canadian GAAP to total comprehensive income under IFRS for the same period:
As at
For the Year Ended
Note December 31, 2010
Total comprehensive income under previous Canadian GAAP $2,694,780
Transitional Adjustments: Canada Mortgage Bond Program (a) 602
Total adjustment to equity 602
Total equity under IFRS $2,695,382
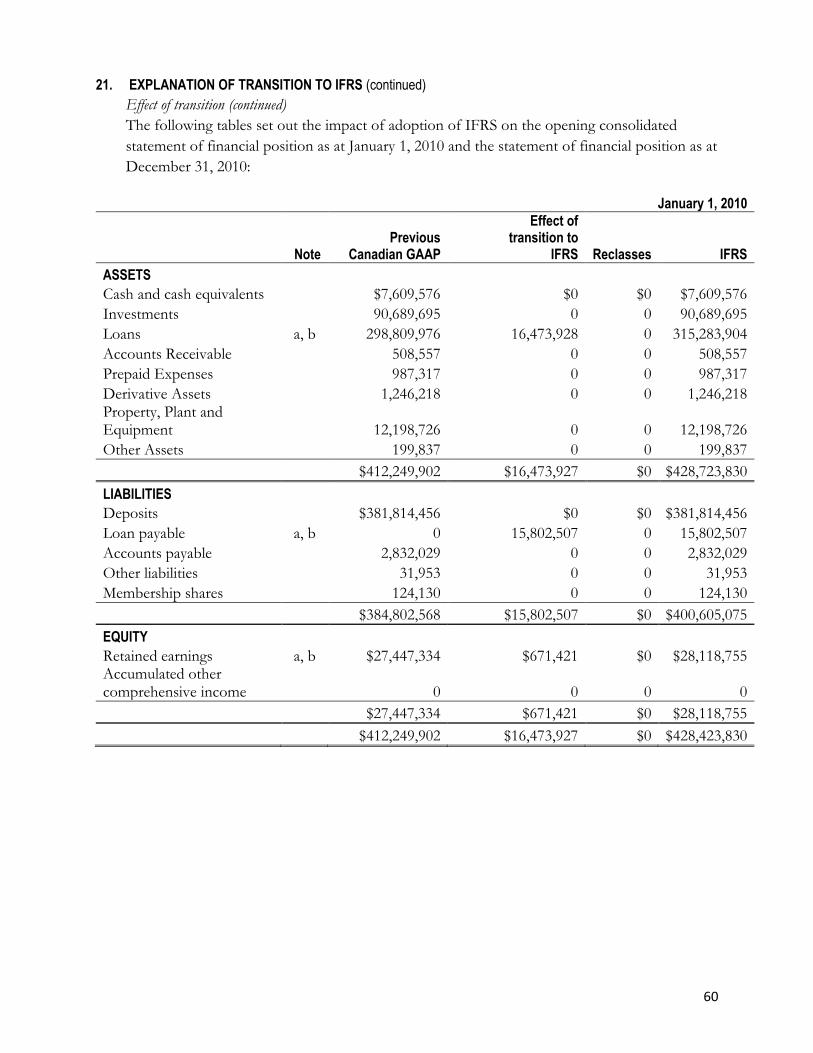
60
21. EXPLANATION OF TRANSITION TO IFRS (continued)
Effect of transition (continued)
The following tables set out the impact of adoption of IFRS on the opening consolidated
statement of financial position as at January 1, 2010 and the statement of financial position as at
December 31, 2010:
January 1, 2010
Note
Previous Canadian GAAP
Effect of transition to
IFRS Reclasses IFRS ASSETS
Cash and cash equivalents
$7,609,576 $0 $0 $7,609,576
Investments
90,689,695 0 0 90,689,695
Loans a, b 298,809,976 16,473,928 0 315,283,904
Accounts Receivable
508,557 0 0 508,557
Prepaid Expenses
987,317 0 0 987,317
Derivative Assets
1,246,218 0 0 1,246,218 Property, Plant and Equipment
12,198,726 0 0 12,198,726
Other Assets
199,837 0 0 199,837
$412,249,902 $16,473,927 $0 $428,723,830
LIABILITIES Deposits
$381,814,456 $0 $0 $381,814,456
Loan payable a, b 0 15,802,507 0 15,802,507
Accounts payable
2,832,029 0 0 2,832,029
Other liabilities
31,953 0 0 31,953
Membership shares
124,130 0 0 124,130
$384,802,568 $15,802,507 $0 $400,605,075
EQUITY Retained earnings a, b $27,447,334 $671,421 $0 $28,118,755
Accumulated other comprehensive income
0 0 0 0
$27,447,334 $671,421 $0 $28,118,755
$412,249,902 $16,473,927 $0 $428,423,830

61
21. EXPLANATION OF TRANSITION TO IFRS (continued)
Effect of transition (continued)
December 31, 2010
Note
Previous
Canadian GAAP
Effect of transition to
IFRS
Reclasses
IFRS
ASSETS Cash and cash equivalents
$3,918,879 $0 $0 $3,918,879
Investments
76,788,528 0 0 76,788,528
Loans a, b 327,348,267 14,320,108 0 341,668,375
Accounts Receivable
291,331 0 0 291,331
Prepaid Expenses
828,928 0 0 828,928
Derivative Assets
789,351 0 0 789,351 Property, Plant and Equipment
11,822,486 0 0 11,822,486
Other Assets
(67,242) 0 0 (67,242)
$421,720,528 $14,320,108 $0 $436,040,636
LIABILITIES Deposits
$387,170,526 $0 $0 $387,170,526
Loan payable a, b 0 13,648,085 0 13,648,085
Accounts payable
3,922,782 0 0 3,922,782
Other liabilities
365,931 0 0 365,931
Membership shares
119,175 0 0 119,175
$391,578,414 $13,648,085 $0 $405,226,499
EQUITY Retained earnings a, b $30,142,114 $672,023 $0 $30,814,137
Accumulated other comprehensive income
0 0 0 0
$30,142,114 $672,023 $0 $30,814,137
$421,720,528 $14,320,108 $0 $436,040,636
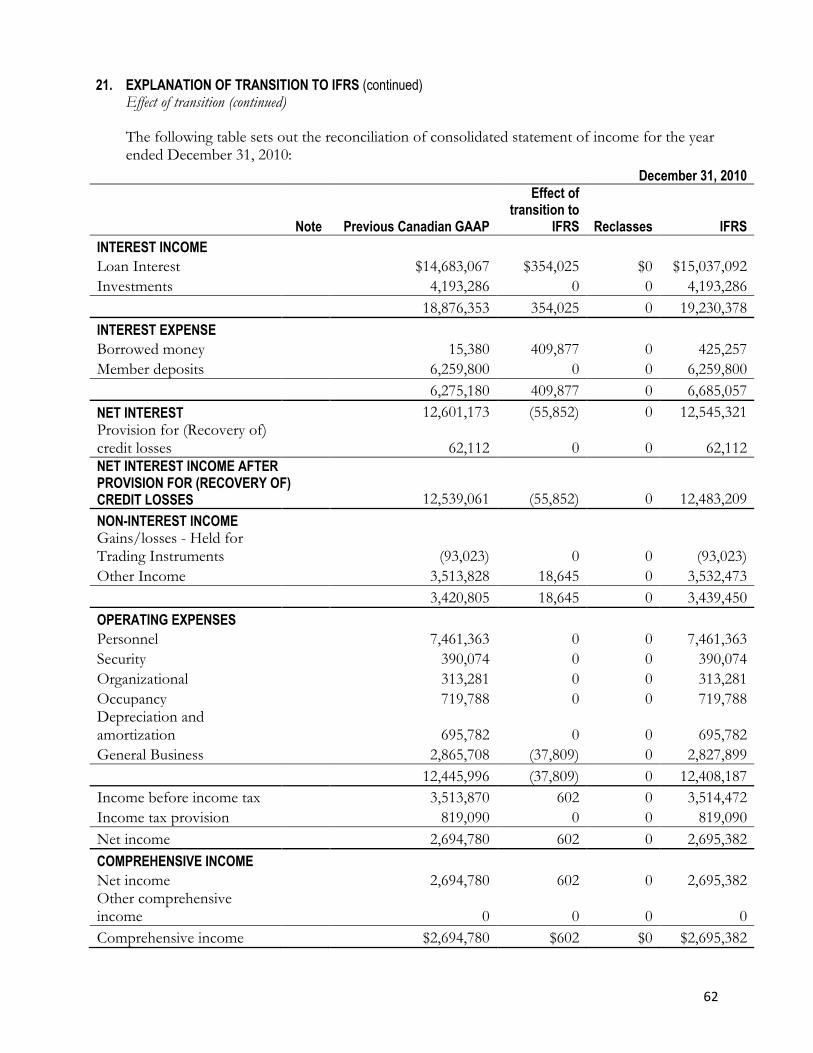
62
21. EXPLANATION OF TRANSITION TO IFRS (continued) Effect of transition (continued) The following table sets out the reconciliation of consolidated statement of income for the year ended December 31, 2010:
December 31, 2010
Note Previous Canadian GAAP
Effect of transition to
IFRS Reclasses IFRS
INTEREST INCOME Loan Interest
$14,683,067 $354,025 $0 $15,037,092
Investments
4,193,286 0 0 4,193,286
18,876,353 354,025 0 19,230,378
INTEREST EXPENSE Borrowed money
15,380 409,877 0 425,257
Member deposits
6,259,800 0 0 6,259,800
6,275,180 409,877 0 6,685,057
NET INTEREST
12,601,173 (55,852) 0 12,545,321 Provision for (Recovery of) credit losses
62,112 0 0 62,112
NET INTEREST INCOME AFTER PROVISION FOR (RECOVERY OF) CREDIT LOSSES 12,539,061 (55,852) 0 12,483,209
NON-INTEREST INCOME Gains/losses - Held for
Trading Instruments
(93,023) 0 0 (93,023)
Other Income
3,513,828 18,645 0 3,532,473
3,420,805 18,645 0 3,439,450
OPERATING EXPENSES Personnel
7,461,363 0 0 7,461,363
Security
390,074 0 0 390,074
Organizational
313,281 0 0 313,281
Occupancy
719,788 0 0 719,788 Depreciation and amortization
695,782 0 0 695,782
General Business
2,865,708 (37,809) 0 2,827,899
12,445,996 (37,809) 0 12,408,187
Income before income tax
3,513,870 602 0 3,514,472
Income tax provision
819,090 0 0 819,090
Net income 2,694,780 602 0 2,695,382
COMPREHENSIVE INCOME Net income
2,694,780 602 0 2,695,382 Other comprehensive income
0 0 0 0
Comprehensive income $2,694,780 $602 $0 $2,695,382

63
NOTE 21: EXPLANATION OF TRANSITION TO IFRS
Notes to the reconciliations:
The following notes explain the impact of the significant differences between the previous historical Canadian GAAP accounting policies and the current IFRS accounting policies applied by the Credit Union.
The impact on deferred tax of the adjustments described below is set out in note (c).
(a) Derecognition of Financial Instruments (Securitizations)
Under previous Canadian GAAP, the transfer of mortgage loan receivables was recognized as a sale for accounting purposes. This resulted in the derecognition of the loan receivables and a loss on sale. Under IFRS, this transaction does not qualify as a sale and the effects of the transaction were reversed. The loss recognized on this transaction was $19,447. Refer to Note 20.
(b) Collective Allowance
The Credit Union maintained a general allowance for unidentified, potential loan losses. This allowance does not meet the requirements under IFRS and therefore, has been reversed.

64
Credit Union Deposit Guarantee Corporation
Deposits Fully Guaranteed Credit Union Deposit Guarantee Corporation is the primary regulator for Saskatchewan credit unions. The Corporation is given its mandate through provincial legislation, The Credit Union Act, 1998, for the main purpose of guaranteeing the full repayment of deposits held in Saskatchewan credit unions. Since 1953, the Corporation has successfully met its obligations. By guaranteeing deposits and promoting responsible governance, the Corporation contributes to confidence in Saskatchewan credit unions. Credit unions operate within a comprehensive regulatory framework to ensure depositors’ funds are fully guaranteed and completely secure. The Corporation establishes standards of sound business practice that are aligned with federal and international regulatory approaches, and monitors credit unions to ensure they are operating according to those standards. By monitoring risk in credit unions, the Corporation can identify potential issues early and credit unions can take corrective action. The Corporation invests in programs that support credit union decision-makers and their ability to actively manage risk and prevent loss. Saskatchewan credit unions have responded by continually enhancing governance practices and enterprise risk management processes, strengthening audit and compliance functions, and maintaining strong capital levels. This helps to ensure Saskatchewan credit unions can successfully meet the challenges of the rapidly changing financial services industry and increasing regulatory requirements. For more information about deposit protection, the Corporation’s regulatory responsibilities and its role in promoting the strength and stability of Saskatchewan credit unions, talk to a representative at the credit union or visit the Corporation’s web site at www.cudgc.sk.ca.

65
OFFICERS AND BRANCH LOCATIONS
Officers Celeste Labrecque – Executive Manager – Retail Banking & Saskatoon General Manager, TCU Wealth Management Inc.
Greg Peacock – Executive Manager – Finance & Accounting Saskatoon
Nadene Schmaltz – Executive Manager – Corporate Services Saskatoon
Dale Smith – Executive Manager – Business Strategy & Innovation Saskatoon
Morris Smysnuik – Chief Executive Officer Saskatoon
Branch locations
Regina Quance Branch 2615 E Quance Street Regina, SK S4V 3B7
Regina Rochdale Branch 4500 Rochdale Boulevard Regina, SK S4X 4N9
Saskatoon Arlington Branch 2311 Arlington Avenue Saskatoon, SK S7J 2H8
Saskatoon Ludlow Branch 307 Ludlow Street Saskatoon, SK S7S 1N6
MemberLine (Contact Centre) Regina 306-546-7800 Saskatoon 306-651-6500
Mailing Address PO Box 5050 Saskatoon, SK S7K 4E3

C R E D I T U N I O N
Our PurposeHelping our members realize their financial potential.
Our Passion
Building lifelong relationships by delivering progressive financial solutions in support of what is important to each
and every one of our members.
Our PromiseAs your trusted financial partner, we will provide you with
a “value added” experience. Ultimately we consider ourselves successful when we help you achieve your
financial goals and potential. Our tag line says it best – “We’ll help you get there”.