
Welfare Reform in Georgia · - attending school conferences - attending family planning counseling...
99
Welfare Reform in Georgia 2016 Senate Bill 104
Transcript of Welfare Reform in Georgia · - attending school conferences - attending family planning counseling...
Welfare Reform in Georgia
2016
Senate Bill 104

ii
iii
SECTION A2
SECTION BQuarterly and Annual TANF Reports ACF-196 Temporary Assistance to Needy Families-Financial Report 3
SECTION CPercentage and Number of TANF Caseload Given Hardship Exemption from Lifetime Limit 5
SECTION DTANF Recipient Transportation Assistance 10
SECTION EDiversionary Assistance to Prevent TANF Receipt 14
SECTION FNumber of Individuals Denied Assistance Due to a Serious Violent Felony Conviction 23
SECTION GNumber of Mothers Under 19 Who Received TANF Assistance 24
SECTION HTANF Subsidized Child Care 28
SECTION IData on Teen Pregnancy Prevention 40
SECTION JNumber of TANF Sanctions 54
SECTION KNumber of Legal Immigrants Receiving TANF Benefits by Category of Immigration Status 55
SECTION LNumber of Families No Longer Eligible Because of Time Limits 59
SECTION M* Follow-up Information on Job Retention and Earnings: * Information is not available
SECTION N
60Evaluation of the Effect of Code Section 49-4-186 On the Number of Births to TANF Recipients Families
DIVISION OF FAMILY AND CHILDREN SERVICESWELFARE REFORM IN GEORGIA ANNUAL REPORT 2016
TABLE OF CONTENTS
SENATE BILL 104 REPORTING REQUIREMENTS
WELFARE REFORM IN GEORGIA, 2016
The Total TANF Caseload Count
ii
REPORTING REQUIREMENTS
THE DEPARTMENT OF HUMAN RESOURCES IS SUPPLYING REPORTS AND STATISTICS ON WELFARE REFORM TO FULFILL THE REQUIREMENTS OF SENATE BILL 104. FROM SENATE BILL 104: “[The department shall] publish an annual report and such interim reports as may be necessary. The annual report and such interim reports shall be provided to the Governor and members of the General Assembly and contain the following:
A. The total TANF caseload count;
B. Quarterly and annual TANF reports, in full, prepared for submission to the federal government;
C. The percentage of the TANF caseload and the number of individuals given a hardship exemption from the lifetime limit on cash assistance and a categorization for such exemption;
D. The number of individuals who received transportation assistance and the cost of such assistance;
E. The number of individuals who received diversionary assistance in order to prevent their requiring TANF
assistance and the categories of such diversionary assistance, and job acceptance and retention statistics;
F. The number of individuals denied assistance due to a serious violent felony conviction;
G. The number of mothers under 19 years of age who received assistance and their percentage of the total TANF caseload;
H. Number of children receiving subsidized child care and the total and average per recipient cost per child;
I. Data on teen pregnancy prevention;
J. The number of families sanctioned;
K. The number of legal immigrants receiving TANF benefits by category of immigration status;
L. The number of families no longer eligible because of time limits;
M. Follow-up information on job retention and earnings; and
N. An evaluation of the effect of Code Section 49-4-186 on the number of births to TANF recipient families.
The information required under this paragraph shall be provided on a county-by-county basis where feasible.

iii
WELFARE REFORM IN GEORGIA: 2006 – 2016 Senate Bill 104 The enabling legislation for the Temporary Assistance for Needy Families (TANF) program in Georgia is Senate Bill 104, now known as Act 389. The major provisions are:
• Most recipients are limited to 48 months of TANF assistance.
• All adult TANF recipients and all eligible parents are mandated to participate in approved work activities.
• All adult TANF recipients are required to sign a personal responsibility plan that emphasized the fact that they must take personal responsibility to better their lives. Some of the required actions include:
- ensuring that minor children attend school
- attending school conferences
- attending family planning counseling
- participating in substance abuse treatment, if needed
- having children immunized, and
- obtain prenatal care, if needed
• Teen parents are required to continue to live with a parent or responsible relative, and must remain in school to obtain their GED or high school diploma.
• Family cap measures were strengthened, so that TANF cash assistance was not increased for recipients who had another child after receiving TANF for ten months.
• Families who did not meet work or personal responsibility requirements could be sanctioned, with a reduction or termination of benefits for three (3) months or 12 months, depending on the number of infractions.
The Personal Responsibility and Work Opportunity Reconciliation Act In August 1996, the Personal Responsibility and Work Opportunity Reconciliation Act (PRWORA) was enacted. PRWORA eliminated the Aid to Families with Dependent Children (AFDC) cash entitlement program and replaced it with the TANF block grant. PRWORA effectively ended welfare entitlement, replacing the AFDC program with the time-limited benefits of TANF. The purpose of this legislation is to:
• Provide assistance to needy families so that children could be cared for in their own homes;
• Reduce welfare dependency by promoting job preparation, work and marriage;

iv
• Prevent teen pregnancies; and
• Encourage the formation and maintenance of two-parent families.
PRWORA established mandatory work and job training participation rates for recipients and enacted time limits for the receipt of TANF benefits. Moreover, PRWORA afforded states greater flexibility in the design and implementation of the TANF program and provided each state a block grant to fund its program. State Maintenance of Effort (MOE) spending levels were mandated so that states would maintain levels of spending consistent with previous spending for AFDC.
In the fall of 1996, Georgia submitted a state plan for administering the TANF program. Following a 45-day federal review period and a series of public hearings, the plan was accepted by the U.S. Department of Health and Human Services (HHS) and Georgia was approved to receive its share of the TANF block grant. The first TANF checks were issued on January 1, 1997.
In past years, the most important aspect of the case manager’s job was issuing welfare benefits. With the 1996 introduction of Work First, the emphasis shifted to helping case managers assist TANF recipients in maintaining employment, as well as seeking career advancement. Customers are not just expected to get a job, but to keep the job and seek advancement. They are expected to earn enough money to leave the welfare rolls. As a result, our TANF caseloads greatly declined.
New Developments In October 2004, Georgia initiated a new service delivery strategy for TANF called TANF = WORK NOW. This strategy focused on 3 elements: (1) Education - TANF participants were educated at the point of application on all the goals and requirements of the TANF program. (2) Engagement - TANF participants with a work requirement were engaged in work activities within seven (7) days of the approval of their application. (3) Monitoring - TANF participants were monitored consistently and frequently to ensure adherence to program requirements. This concept yielded a significant decrease in the number of Total TANF Cases, in particular, the number of Adult Cases on TANF.
In April 2006, Georgia took TANF = Work Now a step further by focusing on values and beliefs that would assist in strengthening Georgia’s families. New policies were implemented and case managers were trained on the principles of case management. The values and beliefs that we espouse are:
• Welfare is not good enough for any family.
• Government cannot and should not take the place of family.
• Children are better off when responsible caretakers are able to provide for their families.
• There is dignity in work, whether with the hand or the head.
• Georgia urges responsible adult behavior and economic self-sufficiency to end dependency on government assistance.

v
• With proper preparation, support and supervision, we can help our customers create a more secure employment future for themselves.
In October 2006, Georgia recognized the need for additional transitional supports to assist participants with job retention and career advancement, thereby, launching the Work Support Program.
In February 2008, the Final Rule for the Reauthorization of TANF was released by the Administration for Children and Families (ACF) / HHS. This rule was based on changes required by the Deficit Reduction Act (DRA) of 2005. According to the DRA final document (45 CFR, Parts 261, 262, 263, and 265. pg. 6772), “The DRA reauthorized the TANF program through federal fiscal year (FFY) 2010 with a renewed focus on work, program integrity, and strengthening families through healthy marriage promotion and responsible fatherhood.”
The DRA retained most of the original welfare reform law. The key changes in the final rule were: (1) defined each of the 12 countable work activities, (2) defined the term “work eligible individual,” (3) clarified that a State may count only actual hours of participation, (4) recalibrated the caseload reduction credit by updating the base year from FFY 1995 to FFY 2005, (5) required each State to establish and maintain work participation verification procedures through a Work Verification Plan, (6) established a new penalty for failure to comply with work verification procedures, and (7) allows additional pro-family expenditures to count toward a State’s MOE requirement.
Also in FFY 2010, the agency rolled out a new business process, Georgia Re-engineering Our Work (G.R.O.W.). The G.R.O.W. process established three functions that case managers focus on (1) interviewing applicants, (2) processing applications, and (3) finalizing applications. An applicant in North Georgia applying for benefits could be interviewed by a case manager in Middle Georgia. The application could then be transmitted to a case manager in West Georgia for processing, and transmitted to another location for finalization or approval. After approval, the case was transferred back to the county where the applicant resided. The G.R.O.W. process symbolized the concept of doing more with less.
In FFY 2011, the Georgia Department of Human Services (DHS) added a new process, Document Imaging System (DIS). The document imaging system gave public assistance customers the option to scan in documents from a home computer scanner, a scanning station in a public community center, such as the Community Action Agencies/Authorities (CAA’s), certain child support offices, or local Georgia Division of Family and Children’s Services (DFCS) offices. Customers who were employed and unable to report to a local DFCS office could renew their benefits online and scan the required supporting documents to an image repository where the case manager or other staff could access the documents.

vi
In FFY 2012, DFCS revisited the G.R.O.W. process to reevaluate its effectiveness. During the evaluation, it became evident that the work could not change, but the way the work was done could. Business Operations Planning (B.O.P.) was added. B.O.P. is: (1) the standardization of G.R.O.W. within each Region. All Regions would use the same procedures to complete a case from start to finish. (2) Self-service was the standardized lobby resource, (3) Document Imaging (DIS), (4) Telecommunications – Local Office call center model, and (5) Office of Financial Independence (OFI) Data Tool – Standardized data management. OFI Teams were formed to ensure standardization. The OFI Teams consisted of: (1) Customer Support, (2) Business Support, and (3) Eligibility Specialists. Our customer support staff supported all walk-in work and was the face of DFCS. The business support staff scanned mail to DIS, answered general inquiries, registered and initiated cases. The eligibility specialists keyed cases, interviewed applicants, finalized cases and handled case maintenance. With these measures in place, we were striving to provide our customers with a timely and efficient outcome.
In an effort to improve the overall service of the public assistance programs, Georgia focused on improving the process to provide convenient access, service accountability, and improve the customer experience. Georgia One was a combination of technology (DIS and COMPASS) acquired in FY 2013 and incorporated self-service options that allowed DFCS to provide Supplemental Nutritional Assistance Program (SNAP), TANF, Childcare and Parent Services (CAPS), and Medicaid recipients the opportunity to track and manage their case. This change helped us serve our customers more efficiently and effectively. In an effort to find the best way to serve its people, the State reached out to all public assistance programs to map current processes. In March 2015, Georgia began to find more effective ways to help provide eligibility services and improve customer service. Georgia Gateway will allow interested parties to research information about available public assistance programs online. Future enhancements will include online application and eligibility criteria for other participating public assistance programs such as SNAP, CAPS, Medicaid, Women, Infants, Children (WIC), and PeachCare for Kids (PCK). Georgia Gateway is being implemented concurrently with a new business model known as “One Caseworker, One Family”, which streamlines the case management process by assigning one caseworker from application to completion.
Georgia has made the necessary changes to be compliant with the final rule. The most significant change was new internal control guidelines, requiring major system changes.

vii
TANF Adult CASELOADS SFY 2006 thru SFY 2016
TANF Adult Caseloads As we continue our mission to help TANF recipients attain self-sufficiency, our adult TANF caseload is decreasing. The TANF Adult Caseload has dropped from 5,901 in 2006 to 2,046 in 2016. The decrease is 3,855 cases within a 10 year period.
Collaborative Efforts To assist Georgia’s TANF recipients fulfill the requirements of Act 389 and attain self-sufficiency, it was necessary that we collaborate with other public service agencies and entities. To start, we formed partnerships with Georgia Department of Labor (GDOL) and the Technical College System of Georgia (TCSG) to develop a job-ready workforce. Each agency committed to providing specific services to TANF recipients, while DHS provided case management and support services. TCSG was the primary source for job training and GDOL focused on job development and placement.
The services provided through these partnerships have contributed greatly to the families receiving TANF. The recipients utilized the job training, job development and job placement resources from our partners to gain or refresh their skills; thus, becoming more marketable. The services also helped some find better jobs and leave the TANF program.
5,9013,392 2,273 2,952 3,250 3,442 4,079 3,861 2,917 2,416 2,046
0
5,000
10,000
15,000
20,000
25,000
30,000
35,000
40,000
45,000
50,000
2006 2007 2008 2009 2010 2011 2012 2013 2014 2015 2016

viii
TANF CASELOADS SFY 2006 thru SFY 2016
In SFY 2006, Georgia had 34,373 cases on its TANF roll. The current total number of cases on TANF in Georgia for SFY 2016 is 12,408. Georgia has reduced its rolls by approximately 36% in ten years.
Transportation Transportation expenditures greatly increased with the implementation of TANF and subsequently decreased as the number of TANF cases declined. DHS/DFCS offers two transportation work support options: direct payment to applicants and recipients and transportation services through DHS’ Consolidated Transportation System. Although funds were available for transportation expenses, transportation services were not readily available, particularly in rural areas. In SFY 2000, DHS/DFCS collaborated with the Georgia Office of Facilities and Support Services to expand the Consolidated Transportation System. TANF funds invested in this initiative have increased from $345,000 in SFY 2000 to $2,700,708 in SFY 2015. In SFY 2015, TANF funds paid directly to applicants and recipients totaled $1,464,700.
Work Support Payments In addition to partnerships with other agencies, the availability of work support payments is critical to the success of TANF self-sufficiency efforts. In order to secure and maintain employment, many families require assistance with transportation, childcare, and medical expenses as well as assistance in obtaining child support. WSP and Transitional Support Services (TSS) will be provided for applicants and participants who find employment and become ineligible for on-going TANF or decline TANF to stop the
34,373
26,11021,318 20,803 19,988 19,256 18,286 17,109 14,600 12,924 12,408
0
20,000
40,000
60,000
80,000
100,000
120,000
140,000
2006 2007 2008 2009 2010 2011 2012 2013 2014 2015 2016

ix
0
200
400
600
800
1000
1200
SFY 2016 295 378 436 535 670 754 807 878 889 934 972 845
SFY2015 0 0 0 0 0 0 0 1 7 47 154 219
SFY2014 0 0 0 0 0 0 0 0 0 0 0 0
SFY 2013 0 2 2 2 0 0 0 0 0 0 0 0
SFY 2012 233 196 152 113 68 44 10 1 0 1 1 0
SFY 2011 196 201 205 195 208 201 190 184 185 193 206 187
Jul Aug Sep Oct Nov Dec Jan Feb Mar Apr May Jun
TANF Subsidies Entitlement Code 98: Work Support Payments $200
Number of Clients State Fiscal Years 2011 - 2016
TANF clock. Both services will be provided to applicants and participants for twelve (12) months.
Employment Intervention Services (EIS) EIS is available to TANF applicants who have full time employment, but is temporarily on unpaid leave due to a temporary illness and is scheduled to return to work within four (4) months, and the AU meets the gross income ceiling (GIC) test.

x
Number of Children in Childcare (Based on payments processed)
State Fiscal Year 2010 – 2016
Childcare
0
10,000
20,000
30,000
40,000
50,000
60,000
70,000
80,000
90,000
SFY2016 100 193 375 1,204 36,52447,51050,56554,22554,93856,71160,48157,702
SFY2015 60,42160,08061,48861,45862,11462,87761,56462,14563,33661,38160,55757,210
SFY2014 60,68260,30661,36461,73763,34761,58061,73561,50863,11462,61863,85162,388
SFY2013 47,47347,66347,42549,89449,75451,05550,92752,45754,21757,46758,24358,103
SFY2012 52,98453,19148,58048,44046,44445,32144,77543,34243,28945,60146,53145,743
SFY2011 79,75482,15675,21269,95870,71068,54766,58563,81562,10561,47761,76555,560
SFY2010 55,34759,88958,53160,26462,43961,68463,02065,71270,07672,02078,37178,289
Jul Aug Sep Oct Nov Dec Jan Feb Mar Apr May Jun
Comparison of Cash Assistance and Childcare Expenditures in Millions of Dollars
SFY 2005 thru SFY 2015
$118
$161
$86
$219
$62
$191
$54
$175
$50
$167
$51
$212
$51
$226
$47
$174
$45
$172
$40
$209
$34
$206
$32
$181
$0
$50
$100
$150
$200
$250
2005 2006 2007 2008 2009 2010 2011 2012 2013 2014 2015 2016
TANF Cash Assistance Childcare Subsidies

xi
Increasing Success in Collecting Child Support
Affordable, quality childcare is essential to the success of individuals obtaining and maintaining employment. The average number of children in childcare from month to month decreased from 78,289 children in SFY 2010 to 57,702 in SFY 2016. In addition, expenditures in the program decreased from $212M in SFY 2010 to $181M in SFY 2016. Childcare continues to be one of the largest programs managed by case managers at the county level.
Medicaid Many TANF recipients beginning first-time employment were either unable to afford the medical insurance made available to them by their employers or found that few employers offered the option of medical insurance. The combination of Low Income Medicaid (LIM), Transitional Medical Assistance (TMA), and Right from the Start Medicaid (RSM) or PCK provided and continues to provide this necessary coverage. The 12-month continuation of Medicaid in the form of TMA provides necessary medical coverage for families who become ineligible for LIM as a result of new or increased earned income. Once TMA ends, the children of most families are eligible for additional coverage through RSM or PCK. As of June of 2016, there were 878,132 Georgia families that received Medicaid through ABD, LIM, TMA, and RSM.
Child Support
(Collections in Millions)
$338$368 $403
$430$464
$524$554 $596
$628 $651
$566$595 $600
$708 $692 $682 $703$721 $737
$0
$100
$200
$300
$400
$500
$600
$700
$800
SFY98SFY99SFY00SFY01SFY02SFY03SFY04SFY05SFY06SFY07SFY08SFY09SFY10SFY11SFY12SFY13SFY14SFY15SFY16
xii
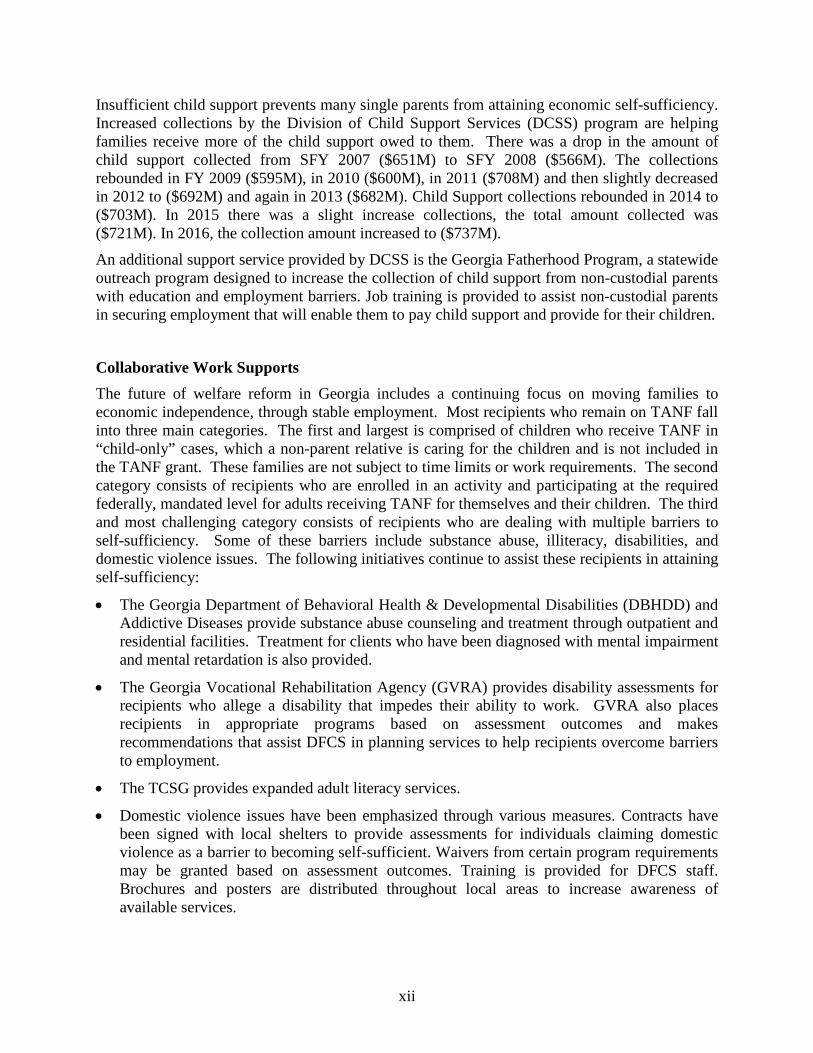
Insufficient child support prevents many single parents from attaining economic self-sufficiency. Increased collections by the Division of Child Support Services (DCSS) program are helping families receive more of the child support owed to them. There was a drop in the amount of child support collected from SFY 2007 ($651M) to SFY 2008 ($566M). The collections rebounded in FY 2009 ($595M), in 2010 ($600M), in 2011 ($708M) and then slightly decreased in 2012 to ($692M) and again in 2013 ($682M). Child Support collections rebounded in 2014 to ($703M). In 2015 there was a slight increase collections, the total amount collected was ($721M). In 2016, the collection amount increased to ($737M).
An additional support service provided by DCSS is the Georgia Fatherhood Program, a statewide outreach program designed to increase the collection of child support from non-custodial parents with education and employment barriers. Job training is provided to assist non-custodial parents in securing employment that will enable them to pay child support and provide for their children.
Collaborative Work Supports The future of welfare reform in Georgia includes a continuing focus on moving families to economic independence, through stable employment. Most recipients who remain on TANF fall into three main categories. The first and largest is comprised of children who receive TANF in “child-only” cases, which a non-parent relative is caring for the children and is not included in the TANF grant. These families are not subject to time limits or work requirements. The second category consists of recipients who are enrolled in an activity and participating at the required federally, mandated level for adults receiving TANF for themselves and their children. The third and most challenging category consists of recipients who are dealing with multiple barriers to self-sufficiency. Some of these barriers include substance abuse, illiteracy, disabilities, and domestic violence issues. The following initiatives continue to assist these recipients in attaining self-sufficiency:
• The Georgia Department of Behavioral Health & Developmental Disabilities (DBHDD) and Addictive Diseases provide substance abuse counseling and treatment through outpatient and residential facilities. Treatment for clients who have been diagnosed with mental impairment and mental retardation is also provided.
• The Georgia Vocational Rehabilitation Agency (GVRA) provides disability assessments for recipients who allege a disability that impedes their ability to work. GVRA also places recipients in appropriate programs based on assessment outcomes and makes recommendations that assist DFCS in planning services to help recipients overcome barriers to employment.
• The TCSG provides expanded adult literacy services.
• Domestic violence issues have been emphasized through various measures. Contracts have been signed with local shelters to provide assessments for individuals claiming domestic violence as a barrier to becoming self-sufficient. Waivers from certain program requirements may be granted based on assessment outcomes. Training is provided for DFCS staff. Brochures and posters are distributed throughout local areas to increase awareness of available services.

xiii
Lifetime Limits In Georgia, the receipt of TANF is limited to 48 months in a lifetime for an assistance unit. Beginning in January 1997, each month in which an assistance unit receives TANF, counts toward the 48-month lifetime limit. The federal lifetime limit is 60 months. An assistance unit that is subject to the lifetime limit may have the limit waived if it is determined that the assistance unit meets certain hardship criteria. TANF received by a recipient from another State is subject to be counted in the lifetime time limits.
Hardship waivers Some families will require additional time to prepare for work and some may never be fully self-sufficient. For these families, Georgia has established a hardship waiver policy that is approved on a case-by-case basis. The waiver of the lifetime limit allows for temporary extensions of TANF to families experiencing additional barriers.
The hardship waiver policy was revised in April 2006. There are three hardship criteria for case managers to use to evaluate each family’s situation.
1. The AU meets the domestic violence criteria.
2. The AU has an active child protective services case and the circumstances necessitating the CPS case create a barrier to the AU’s attainment of self-sufficiency.
3. The disability of the grantee relative, other eligible adult or a household member is a barrier to employment for the grantee relative or other eligible adults.
Other forms of support, Food Stamps, Medicaid, shelter and utility assistance, are available to families that do not meet any of the hardship criteria.
Georgia’s TANF caseload totaled 50,996 cases in December 2000 when the first 1,446 families reached the 48-month time limit. Of those families, 1,094 met a hardship criteria and were eligible for extended TANF benefits through hardship waivers. Since December 2000, the number of families reaching the 48-month time limit has consistently decreased.
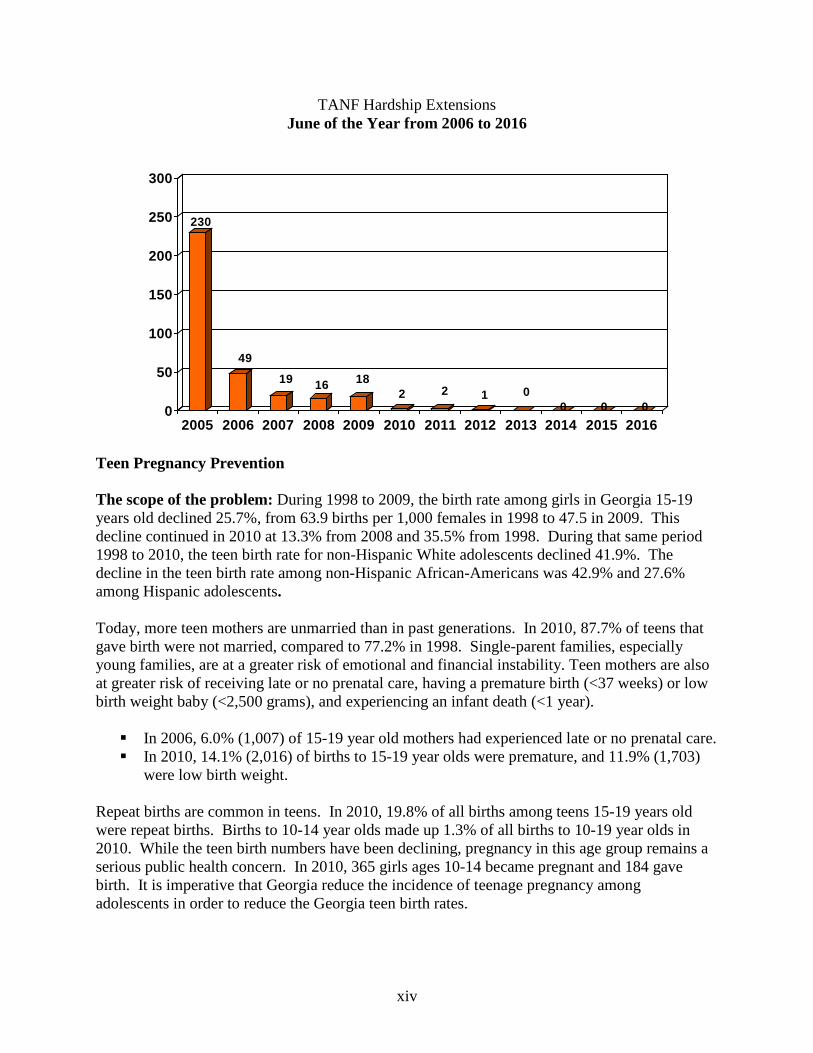
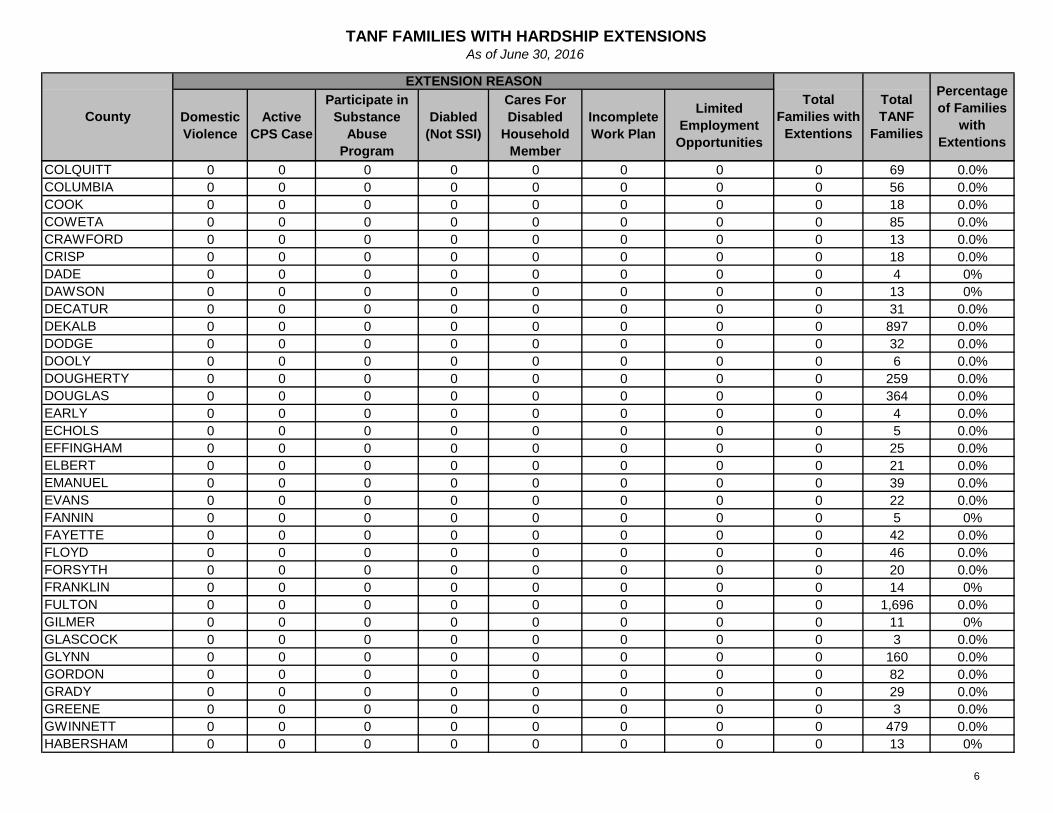
In December 2005, another milestone in the TANF program was reached. There were 311 Georgia TANF recipients that reached the federally imposed 60-month TANF lifetime limit. Of the 311 recipients, 280 continued to be eligible under a hardship extension. As with the 48-month time limit, the number of families reaching the 60-month federal lifetime limit has decreased. In June 2002, there were 1,566 families receiving a hardship extension, but in June 2005 there were only 230 families receiving extensions. In June of 2006, 49 families received an extension, and in June 2009, Georgia had only 18 families who received a hardship extension. In June 2010, there were only two households that received a hardship extension. In 2012, there was one household receiving a hardship extension. In 2013, there were no households receiving a hardship extension. As of 2016, there are still no households receiving a hardship extension.
xiv
TANF Hardship Extensions June of the Year from 2006 to 2016
Teen Pregnancy Prevention The scope of the problem: During 1998 to 2009, the birth rate among girls in Georgia 15-19 years old declined 25.7%, from 63.9 births per 1,000 females in 1998 to 47.5 in 2009. This decline continued in 2010 at 13.3% from 2008 and 35.5% from 1998. During that same period 1998 to 2010, the teen birth rate for non-Hispanic White adolescents declined 41.9%. The decline in the teen birth rate among non-Hispanic African-Americans was 42.9% and 27.6% among Hispanic adolescents. Today, more teen mothers are unmarried than in past generations. In 2010, 87.7% of teens that gave birth were not married, compared to 77.2% in 1998. Single-parent families, especially young families, are at a greater risk of emotional and financial instability. Teen mothers are also at greater risk of receiving late or no prenatal care, having a premature birth (<37 weeks) or low birth weight baby (<2,500 grams), and experiencing an infant death (<1 year). In 2006, 6.0% (1,007) of 15-19 year old mothers had experienced late or no prenatal care. In 2010, 14.1% (2,016) of births to 15-19 year olds were premature, and 11.9% (1,703)
were low birth weight. Repeat births are common in teens. In 2010, 19.8% of all births among teens 15-19 years old were repeat births. Births to 10-14 year olds made up 1.3% of all births to 10-19 year olds in 2010. While the teen birth numbers have been declining, pregnancy in this age group remains a serious public health concern. In 2010, 365 girls ages 10-14 became pregnant and 184 gave birth. It is imperative that Georgia reduce the incidence of teenage pregnancy among adolescents in order to reduce the Georgia teen birth rates.
230
49
19 16 182 2 1 0
0 0 00
50
100
150
200
250
300
2005 2006 2007 2008 2009 2010 2011 2012 2013 2014 2015 2016

xv
Progress: Teen birth rates have decreased both in Georgia and nationally. Georgia has made significant progress in reducing teen births and the associated personal and economic costs; but Georgia must continue to reduce the teen birth rate even further by reducing sexual activity and other risky behaviors among unmarried teens. Unintended pregnancies, particularly those occurring very early in a woman's reproductive years, often have adverse health, social, and economic consequences for the mother and her child. Teen pregnancy and out-of-wedlock parenting is linked to poverty and welfare dependency. Teenage mothers are more likely to be unmarried, drop out of school, and rely on Temporary Assistance to Needy Families (TANF). What is the Georgia Department of Public Health (DPH) Doing? Preventing teen pregnancy is a priority for the Department of Public Health. In partnership with the Georgia Department of Human Services, the DPH addresses teen pregnancy through two programs using a comprehensive approach, the Georgia Adolescent Health and Youth Development Program and the Georgia Women’s Health Family Planning Program. Georgia Adolescent Health and Youth Development (AHYD) Program: The goal of the AHYD program is to prevent teenage pregnancy by helping adolescents to grow up healthy, educated, employable, and connected to their families and communities. The program was established as a result of a teenage pregnancy prevention initiative funded by the Georgia General Assembly in July 1998. The Adolescent Health and Youth Development Program, is housed in the Health Promotion and Disease Prevention Section (HPDPS), within the Department of Public Health (DPH). The AHYD program aims to prevent welfare dependency and improve economic opportunity and responsible parenting. Currently, funding for the program is administered through a Memorandum of Understanding (MOU) between the Department of Public Health (DPH) and the Department of Human Services (DHS). Funds are provided to county health departments and local public health districts to support the planning, development, implementation, and evaluation of successful programs that address the broad range of social and economic factors that affect teen behavior, including substance abuse, violence, tobacco use, obesity, and teen sexual activity.
White4,711 (33.0%)
Black6,241 (43.7%)
Hispanic 2,283 (16.0%)
Proportion of Teen Births by Race/Ethnicity15 - 19 Year Olds 2010 (N = 14, 285)

xvi
Specifically, the AHYD program provides funding to 13 District AHYD Programs and a Youth Development Coordinator (YDC) in each funded health district. The state office provides ongoing program monitoring as well as capacity building to district and program staff. District AHYD Programs are operated through county health departments statewide and are located in counties reporting high rates of high school dropouts, HIV/STIs, and/or teen pregnancy. Youth Development Coordinators (YDC) coordinates efforts between district and county health departments including AHYD Programs. Youth Development Coordinators form critical partnerships with out-of-school programs and county and community agencies, holding workshops with communities, faith-based institutions, and public health leaders to foster collaboration around key adolescent health and youth development issues. The state AHYD Consultant provides YDCs with ongoing program and fiscal monitoring, technical assistance, training and resources. Specific strategies: Research shows that successful teen pregnancy prevention programs address the broad range of social and economic factors that affect teen behavior. No single approach is effective by itself. In Georgia, a comprehensive approach is utilized. This approach consists of several strategies including the following: Coordinated district adolescent health services: Health districts and county health departments actively partner with local youth organizations/providers to co-sponsor health education and promotion events, and to assure that youth have access to needed services and opportunities within their communities (e.g., legal services; food and housing assistance, dental services; tutoring and academic support; entrepreneurship; mental health counseling; youth development, physical activity, mentoring and related services). AHYD supports these local partnerships and collaborations by providing funding for a district Youth Development Coordinator to foster collaboration and coordination of efforts throughout Georgia. Annual district and teen center programs’ work plans demonstrate local collaboration. Comprehensive preventive health services: The AHYD programs provide comprehensive prevention services, including abstinence education, drug and alcohol prevention education, and adolescent reproductive health services. Services are offered in teen-friendly facilities where teens feel comfortable. Most of the youth who come for services do so with the knowledge of their parents. Teens come with a wide variety of needs. Teens may ask for information, attend abstinence classes, learn to improve their reaction to stress and conflict, get advice on nutrition and physical activity, obtain sports physicals, be tested for a sexually transmitted disease or pregnancy, join a support group, or just need someone to talk to. These programs also provide youth access to screening for a variety of health problems and when identified, provide or link them to needed services including immunizations and physicals. Teens are referred by their parents, other teens, school staff, caseworkers, community members, and outreach workers.

xvii
Abstinence education: Abstinence is the only certain way to eliminate the risk of pregnancy and STDs. It is the primary prevention method promoted across AHYD-funded programs. AHYD programs are funded to emphasize sexual abstinence as the best choice for preventing pregnancy and sexually transmitted diseases. Outreach and community referral: Local adolescent health and youth development programs coordinate with other professionals and agencies to assist adolescents and their families in obtaining needed AHYD services and information. Specially trained staff with first-hand knowledge and experience working with at-risk teens are regularly available. Parent education and involvement: Information and education programs are available to help parents strengthen their parenting and communication skills, build strong bonds with their teens, and understand the developmental changes specific to adolescence. Some programs have established a Parent Advisory Committee (PAC) to provide parents a meaningful way to participate in planning, decision-making, and opportunities for positive health promotion in the community. PACs, in collaboration with local public health officials, are responsible for determining the programs and activities offered in each local community. Faith/health community partnerships: The AHYD program has formed a partnership with members of the faith community and held conferences with community, faith, and public health leadership to encourage collaboration and working together for positive youth development and health promotion. Use of risk reduction strategies: Teen Centers using risk reduction strategies that include contraception must follow the DPH “Standard Protocols for Registered Professional Nurses in Public Health”, including encouraging parental involvement, signed informed consent, and distribution of contraceptive devices only in a clinical setting by a health care professional. Best practices for prevention programs: All prevention programs funded by DPH must incorporate evidence-based practices for effective teen pregnancy and STD prevention programs. In addition, all programs must have a demonstrated impact on key outcomes related to teen pregnancy and STD prevention. State Capacity Building Efforts: Several teleconference calls were held throughout fiscal year 2016. During the calls the State Adolescent Health and Youth Development Program provided guidance on 1) completing new work plan templates, 2) preparing budgets, 3) preparing reports using a new reporting template, and 4) SMART objectives. Asset Based Community Development: A state Asset Based Community Development Workshop was held in Atlanta, Georgia. The meeting brought together youth development coordinators, health promotion coordinators and representatives of community based organizations to receive training on maximizing local community resources. Shaping Policy for Health: The AHYD Youth Development Coordinators were invited to participate in several “Shaping Policy for Health” workshop series facilitated by the Directors of Health Promotion and Education. The workshops included 1) An Introduction to Competency-
xviii
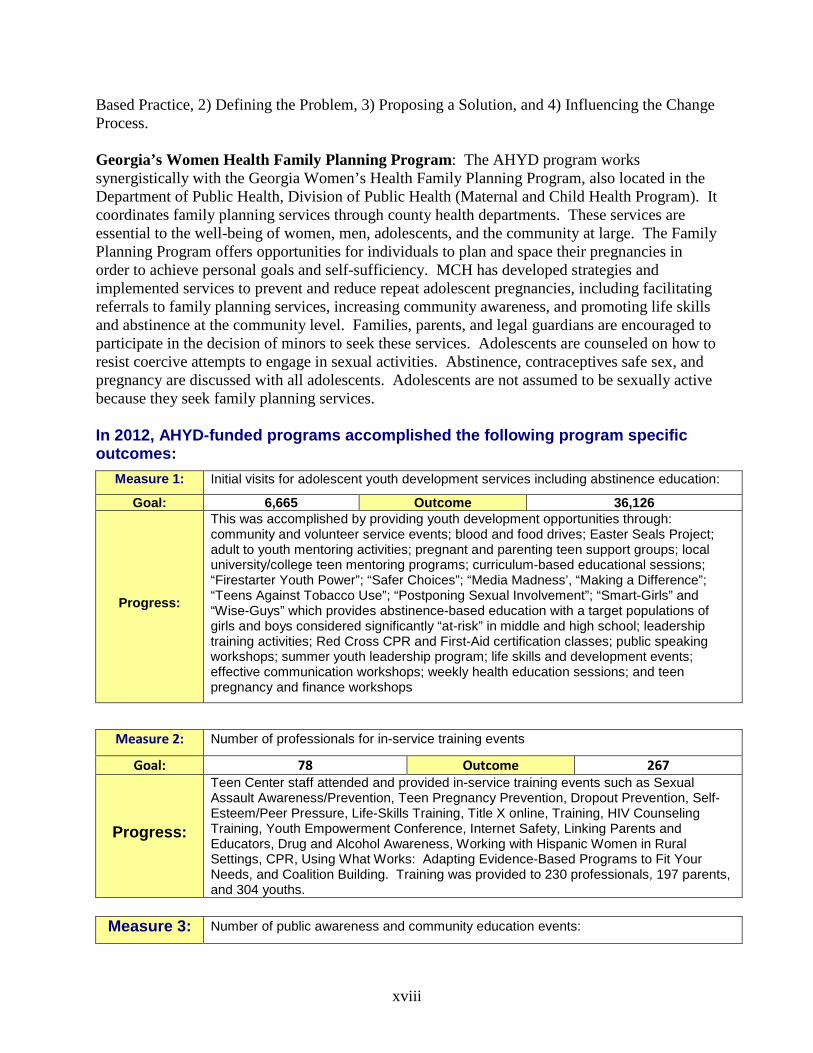
Based Practice, 2) Defining the Problem, 3) Proposing a Solution, and 4) Influencing the Change Process. Georgia’s Women Health Family Planning Program: The AHYD program works synergistically with the Georgia Women’s Health Family Planning Program, also located in the Department of Public Health, Division of Public Health (Maternal and Child Health Program). It coordinates family planning services through county health departments. These services are essential to the well-being of women, men, adolescents, and the community at large. The Family Planning Program offers opportunities for individuals to plan and space their pregnancies in order to achieve personal goals and self-sufficiency. MCH has developed strategies and implemented services to prevent and reduce repeat adolescent pregnancies, including facilitating referrals to family planning services, increasing community awareness, and promoting life skills and abstinence at the community level. Families, parents, and legal guardians are encouraged to participate in the decision of minors to seek these services. Adolescents are counseled on how to resist coercive attempts to engage in sexual activities. Abstinence, contraceptives safe sex, and pregnancy are discussed with all adolescents. Adolescents are not assumed to be sexually active because they seek family planning services. In 2012, AHYD-funded programs accomplished the following program specific outcomes:
Measure 1: Initial visits for adolescent youth development services including abstinence education:
Goal: 6,665 Outcome 36,126
Progress:
This was accomplished by providing youth development opportunities through: community and volunteer service events; blood and food drives; Easter Seals Project; adult to youth mentoring activities; pregnant and parenting teen support groups; local university/college teen mentoring programs; curriculum-based educational sessions; “Firestarter Youth Power”; “Safer Choices”; “Media Madness’, “Making a Difference”; “Teens Against Tobacco Use”; “Postponing Sexual Involvement”; “Smart-Girls” and “Wise-Guys” which provides abstinence-based education with a target populations of girls and boys considered significantly “at-risk” in middle and high school; leadership training activities; Red Cross CPR and First-Aid certification classes; public speaking workshops; summer youth leadership program; life skills and development events; effective communication workshops; weekly health education sessions; and teen pregnancy and finance workshops
Measure 2: Number of professionals for in-service training events
Goal: 78 Outcome 267
Progress:
Teen Center staff attended and provided in-service training events such as Sexual Assault Awareness/Prevention, Teen Pregnancy Prevention, Dropout Prevention, Self-Esteem/Peer Pressure, Life-Skills Training, Title X online, Training, HIV Counseling Training, Youth Empowerment Conference, Internet Safety, Linking Parents and Educators, Drug and Alcohol Awareness, Working with Hispanic Women in Rural Settings, CPR, Using What Works: Adapting Evidence-Based Programs to Fit Your Needs, and Coalition Building. Training was provided to 230 professionals, 197 parents, and 304 youths.
Measure 3: Number of public awareness and community education events:

xix
Goal: 113 Outcome 143
Progress:
Public awareness and adolescent health promotion included the distribution of a bullying prevention brochure developed with the District Public Information Officer, bulletin boards designed by Teen Center youth for Alcohol and Drug Prevention to coincide with school proms, “Got Consent” awareness campaign, distribution of pamphlets and wristbands for “You Make a Difference” campaign; community fairs, articles in school newspaper, radio and newspaper advertisements, HIV testing information via Teen Pregnancy Prevention listserv and Facebook.
TANF Purpose #3: Prevent and reduce the incidence of Out-of-wedlock pregnancies.
FUNDING: Segregated TANF funds
For more information about Adolescent Health and Youth Development Unit Programs, please contact us at 404-657-6638 or visit http://health.state.ga.us/programs/adolescent/ DFCS Afterschool Care Program
The Afterschool Care Program is located within the Georgia Division of Family and Children Services (DFCS) and provides federal funding to non-profit organizations and public agencies who serve youth and families during the out-of-school time. The program is designed to support DFCS’ goal of providing resources and services that promote self-sufficiency among children and families. By funding services that are provided during before school, after school, intercession and summer hours, the Afterschool Care Program supports two Temporary Assistance for Needy Families (TANF) goals: (a) Reduce the dependency of needy parents by promoting job preparation, work and marriage. (b) Prevent and reduce unplanned pregnancies among single young adults. The mission of the Afterschool Care Program is to provide resources to youth-serving organizations within the state of Georgia who serve families within low-to-moderate income communities and the foster care system. The vision of the Afterschool Care Program is to ensure every child and youth has access to high quality youth development programming within their community. Academic attainment and an enhanced well-being through positive youth development services are key factors in ensuring youth successfully transition into young adulthood, particularly youth of economically disadvantaged communities. Through out-of-school time programs, parents and caregivers can ensure their youth have a safe and enriching environment when the traditional school day ends. By providing funding through a Statement of Need (SoN) solicitation process, DFCS partners with community-based organizations and public agencies throughout the state of Georgia who provide services to youth and their families. The goals of the DFCS Afterschool Care Program are to:

xx
• Strengthen youth-serving organizations and institutions by providing funding that increases their capacity to design, implement, and sustain quality youth development programs and services;
• Provide opportunities for youth to establish positive relationships with their peers and caring adults during traditional non-school day hours; and
• Provide technical assistance to organizations and agencies as they implement services and activities that support their youth’s overall well-being as they prepare for and transition into young adulthood.
Positive Youth Development Services Agencies that are funded through the DFCS Afterschool Care Program provide project-based learning activities and/or youth apprenticeship experiences to youth participants that support school day learning and encourage positive transitions into adulthood. In Federal Fiscal Year 2016, funded agencies began implementing STEAM (Science, Technology, Engineering, Arts and Math) based learning opportunities. Through project-based learning activities and apprenticeship experiences, youth will have the opportunity to learn about 21st century career and educational pathways that support our evolving workforce. Project-based learning is a hands-on and creative approach to teaching, which provides academic support to students in a way that is fun and engaging. Projects are interdisciplinary in nature and they build on student interest and provide students with an opportunity to demonstrate what they have learned through the actual completion of the project. The youth apprenticeship experience is a method of engaging youth in work-based skill development training that can assist them in identifying and pursuing certain professional and career choices. Within organizations who implement apprenticeship experiences for their youth, apprenticeships are taught by professionals with real-world experiences in the apprenticeship field selected by the program. Each of these programs includes opportunities for students to participate in other well-being support opportunities, including, but not limited to, health and well-being programming, and family and community engagement. Funding Allocation and MOE Since Federal Fiscal Year (FFY) 2006, the DFCS Afterschool Care Program has partnered with agencies by providing funding for them to serve youth during the out-of-school time. Through this partnership, the Afterschool Care Program has required each partnering agency to provide a match contribution to support the programs and services provided to youth. This match is used to support the Georgia Department of Human Services (DHS) and Georgia Division of Family and Children Services’ (DFCS) Maintenance of Effort (MOE). From FFY 2006 to FFY 2016, the Afterschool Care Program funding supported programs and services that served over 25,000 youth through after school and summer programs collectively

xxi
(majority of youth are served through the Georgia Alliance of Boys and Girls Clubs) each year. Each year, approximately $15M is awarded to selected agencies with additional Maintenance of Effort (MOE) match support of approximately and $35M or more each year. Currently, (FFY 2017) the Afterschool Care Program is partnering with 40 agencies to provide positive youth development services during the out-of-school time. As in previous programming years, the Georgia Alliance of Boys and Girls Clubs continues to serve the largest number of youth and providing the largest amount in match funding for the Department of Human Services and Georgia Division of Family and Children Services’ MOE. In FFY 2016, the Afterschool Care Program served well over 24,000 youth through awarded funding. Partnerships and Collaborations During FFY 2013, the Afterschool Care Program partnered with other state agencies to provide the first Afterschool and Youth Development (ASYD) Conference in Georgia. In FFY 2014, in partnership with the Governor’s Office for Children and Families (GOCF), Georgia Department of Education (GaDOE), and Georgia Department of Public Health (DPH), the Georgia Division of Family and Children Services provided the second statewide After School and Youth Development (ASYD) Conference. The conference was held in Augusta, Georgia and over 900 youth development workers, stakeholders and agency representatives attended. During the ASYD Conference, the Georgia Afterschool and Youth Development Quality Standards were launched to continue the effort of improving quality and support to youth development and out-of-school time programs within our communities in Georgia. The ASYD Conference was held again in FFY 2016 in Columbus, Georgia with the same emphasis of continuous quality improvement for out-of-school time programs. With the statewide partnership to provide the ASYD Conference and in initiating an effort to improve out-of-school time program quality through state after school quality standards, DHS, DFCS, GaDOE and DPH have continued their commitment in working to provide programs and services that do not duplicate efforts throughout the state of Georgia but compliment and support the work of each agency while considering how initiatives, events, programs and services can be offered more streamlined and efficiently. Since FFY 2016, the Afterschool Care Program has partnered with the Georgia Department of Public Health’s Georgia SHAPE Health Initiative as the official DFCS Afterschool Care Program health program for all participating youth. Youth served through the DFCS Afterschool Care funded programs will participate in Georgia SHAPE approved activities to aid in the overall improvement of their health and well–being. Future Goals and Program Impact In addition to requiring that all current funded programs have an emphasis on Science, Technology, Engineering, Arts and Math (STEAM), The DFCS Afterschool Care Program will continue to support and implement the Afterschool and Youth Development Quality Standards statewide. Through a collaborative state partnership with other state agencies, including the Georgia Department of Education, each funded program will have the opportunity to utilize the established Afterschool and Youth Development Self-Assessment Tool to obtain baseline data of

xxii
their program’s quality and create a plan of improvement to be implemented over the course of the contract year. The Results of Georgia’s PRWORA Initiative Georgia has successfully achieved and in some instances exceeded the goals and requirements of the TANF program as mandated by the Personal Responsibility and Work Opportunity Reconciliation Act of 1996, including participation rates, maintenance of effort spending, and reducing the teen pregnancy rates. This effort has enabled thousands of Georgia’s citizens to achieve an improved way of life through welfare reform. Children of TANF families observe first-hand the benefits of work, as their parents provide for them a higher standard of living than was possible on welfare. These positive role models will, undoubtedly reduce the likelihood of children becoming future adult TANF recipients. Georgia will continue to demonstrate the successes that have been achieved for its families.

A. The Total TANF Caseload Count
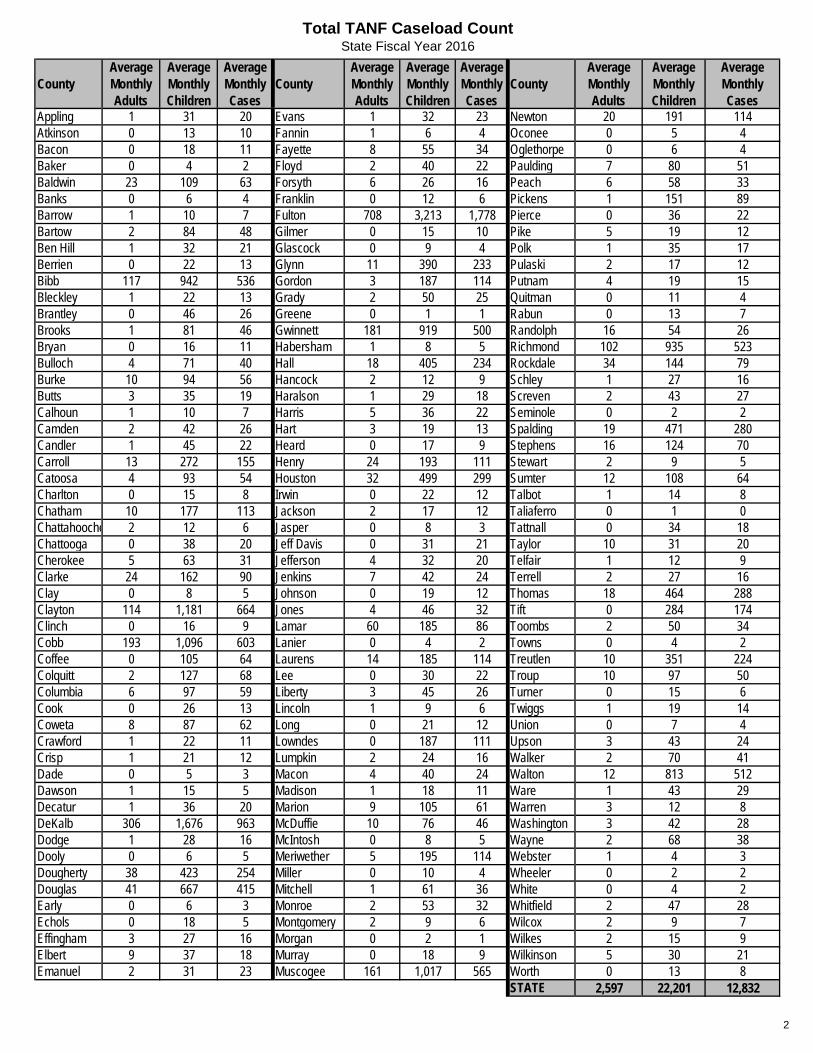
Total TANF Caseload CountState Fiscal Year 2016
2
CountyAverage Monthly Adults
Average Monthly Children
Average Monthly Cases
CountyAverage Monthly Adults
Average Monthly Children
Average Monthly Cases
CountyAverage Monthly Adults
Average Monthly Children
Average Monthly Cases
Appling 1 31 20 Evans 1 32 23 Newton 20 191 114Atkinson 0 13 10 Fannin 1 6 4 Oconee 0 5 4Bacon 0 18 11 Fayette 8 55 34 Oglethorpe 0 6 4Baker 0 4 2 Floyd 2 40 22 Paulding 7 80 51Baldwin 23 109 63 Forsyth 6 26 16 Peach 6 58 33Banks 0 6 4 Franklin 0 12 6 Pickens 1 151 89Barrow 1 10 7 Fulton 708 3,213 1,778 Pierce 0 36 22Bartow 2 84 48 Gilmer 0 15 10 Pike 5 19 12Ben Hill 1 32 21 Glascock 0 9 4 Polk 1 35 17Berrien 0 22 13 Glynn 11 390 233 Pulaski 2 17 12Bibb 117 942 536 Gordon 3 187 114 Putnam 4 19 15Bleckley 1 22 13 Grady 2 50 25 Quitman 0 11 4Brantley 0 46 26 Greene 0 1 1 Rabun 0 13 7Brooks 1 81 46 Gwinnett 181 919 500 Randolph 16 54 26Bryan 0 16 11 Habersham 1 8 5 Richmond 102 935 523Bulloch 4 71 40 Hall 18 405 234 Rockdale 34 144 79Burke 10 94 56 Hancock 2 12 9 Schley 1 27 16Butts 3 35 19 Haralson 1 29 18 Screven 2 43 27Calhoun 1 10 7 Harris 5 36 22 Seminole 0 2 2Camden 2 42 26 Hart 3 19 13 Spalding 19 471 280Candler 1 45 22 Heard 0 17 9 Stephens 16 124 70Carroll 13 272 155 Henry 24 193 111 Stewart 2 9 5Catoosa 4 93 54 Houston 32 499 299 Sumter 12 108 64Charlton 0 15 8 Irwin 0 22 12 Talbot 1 14 8Chatham 10 177 113 Jackson 2 17 12 Taliaferro 0 1 0Chattahooche 2 12 6 Jasper 0 8 3 Tattnall 0 34 18Chattooga 0 38 20 Jeff Davis 0 31 21 Taylor 10 31 20Cherokee 5 63 31 Jefferson 4 32 20 Telfair 1 12 9Clarke 24 162 90 Jenkins 7 42 24 Terrell 2 27 16Clay 0 8 5 Johnson 0 19 12 Thomas 18 464 288Clayton 114 1,181 664 Jones 4 46 32 Tift 0 284 174Clinch 0 16 9 Lamar 60 185 86 Toombs 2 50 34Cobb 193 1,096 603 Lanier 0 4 2 Towns 0 4 2Coffee 0 105 64 Laurens 14 185 114 Treutlen 10 351 224Colquitt 2 127 68 Lee 0 30 22 Troup 10 97 50Columbia 6 97 59 Liberty 3 45 26 Turner 0 15 6Cook 0 26 13 Lincoln 1 9 6 Twiggs 1 19 14Coweta 8 87 62 Long 0 21 12 Union 0 7 4Crawford 1 22 11 Lowndes 0 187 111 Upson 3 43 24Crisp 1 21 12 Lumpkin 2 24 16 Walker 2 70 41Dade 0 5 3 Macon 4 40 24 Walton 12 813 512Dawson 1 15 5 Madison 1 18 11 Ware 1 43 29Decatur 1 36 20 Marion 9 105 61 Warren 3 12 8DeKalb 306 1,676 963 McDuffie 10 76 46 Washington 3 42 28Dodge 1 28 16 McIntosh 0 8 5 Wayne 2 68 38Dooly 0 6 5 Meriwether 5 195 114 Webster 1 4 3Dougherty 38 423 254 Miller 0 10 4 Wheeler 0 2 2Douglas 41 667 415 Mitchell 1 61 36 White 0 4 2Early 0 6 3 Monroe 2 53 32 Whitfield 2 47 28Echols 0 18 5 Montgomery 2 9 6 Wilcox 2 9 7Effingham 3 27 16 Morgan 0 2 1 Wilkes 2 15 9Elbert 9 37 18 Murray 0 18 9 Wilkinson 5 30 21Emanuel 2 31 23 Muscogee 161 1,017 565 Worth 0 13 8
STATE 2,597 22,201 12,832

B. Quarterly and Annual TANF Reports, in Full, Prepared for Submission for the
Federal Government
Reports submitted to the federal government during the State Fiscal Year include: ACF-196 Temporary Assistance to Needy Families- Financial Report ACF-199 TANF Data Report TANF-ACF-DI-97-6 dated September 30, 1997 requires a computerized database
containing disaggregated case and client record information, as specified in Section 411(a) of Public Law 104-193, “The Personal Responsibility and Work Opportunity Reconciliation Act at 1996.” No Aggregate paper reports are required.

3
ACF-196R : Part 1: Expenditure Data
Program Name: Temporary Assistance for Needy FamiliesGrantee Name: GEORGIAReport Name: ACF-196R : Part 1: Expenditure Data
Funding/Grant Period: 1601GATANFReport Period: 07/01/2016 to 09/30/2016Report Status: Submitted with Warnings
Department of Health and Human ServicesAdministration for Children and Families
Temporary Assistance for Needy Families (TANF) ACF - 196R Financial ReportPart 1: Expenditure Data
StateGEORGIA
Grant Year2016
Fiscal Year2016
Report QuarterEnding09/30/2016
Next QuarterEnding03/31/2017
Report isSubmitted as:
New Revised Final
( A ) Federal Funds
State FamilyAssistance Grant
( B ) State Funds
( C ) State Funds
( D ) Federal Funds
ContingencyFunds Award
Reconciliation FSat FMAP Rate of
.6755
( E ) Federal Funds
EmergencyContingency
Funds(Authorized by
ARRA)
1. Awarded $330,741,739 $0
2. Transferred to CCDF Discretionary $0
3. Transfered to SSBG $5,881,073
4. Adjusted Award $324,860,666
5. Carryover $0
Expenditure CategoriesFederal TANFExpenditures
State MOEExpenditures in
TANF
MOEExpendituresSeparate State
Programs
Expenditures withContigency Funds
Expenditures withEmergency
Contigency Funds
6. Basic Assistance $51,175,645 $1,728,760 $0 $0
6.a. Basic Assistance (excluding Relative Foster Care Maintenance Paymentsand Adoption and Guardianship Subsidies) $21,667,908 $1,728,760 $0 $0
6.b. Relative Foster Care Maintenance Payments and Adoption andGuardianship Subsidies $29,507,737 $0 $0 $0
7. Assistance Authorized Solely Under Prior Law $12,794,273 $0
7.a. Foster Care Payments $12,794,273 $0
7.b. Juvenile Justice Payments $0 $0
7.c. Emergency Assistance Authorized Solely Under Prior Law $0 $0
8. Non-Assistance Authorized Solely Under Prior Law $7,283,857 $0
8.a. Child Welfare or Foster Care Services $7,283,857 $0
8.b. Juvenile Justice Services $0 $0
8.c. Emergency Services Authorized Solely Under Prior Law $0 $0
9. Work, Education, and Training Activities $7,860,473 $0
9.a. Subsidized Employment $7,535,608 $0 $0 $0
9.b. Education and Training $304 $0 $0 $0

4
PAGE 1 OF 1 APPROVED OMB No 0970-0247 expires 08/31/2015 FORM ACF-196
9.c. Additional Work Activities $324,561 $957,434 $0 $0
10. Work Supports $7,859,456 $0 $0 $0
11. Early Care and Education $0 $0 $0 $0
11.a. Child Care (Assistance and Non-Assistance) $0 $0 $0 $0
11.b. Pre-Kindergarten/Head Start $0 $0 $0 $0
12. Financial Education and Asset Development $0 $0 $0 $0
13. Refundable Earned Income Tax Credits $0 $0 $0 $0
14. Non-EITC Refundable State Tax Credits $0 $0 $0 $0
15. Non-Recurrent Short Term Benefits $105,518 $0 $0 $0
16. Supportive Services $0 $0 $0 $0
17. Services for Children and Youth $12,659,621 $34,441,367 $0 $0
18. Prevention of Out-of-Wedlock Pregnancies $731,979 $0 $0 $0
19. Fatherhood and Two-Parent Family Formation and Maintenance Programs $50,955 $0 $0 $0
20. Child Welfare Services $149,460,340 $84,216,873 $0 $0
20.a. Family Support/Family Preservation /Reunification Services $134,464,652 $78,748,816 $0 $0
20.b. Adoption Services $12,677,222 $2,590,759 $0 $0
20.c. Additional Child Welfare Services $2,318,466 $2,877,298 $0 $0
21. Home Visiting Programs $0 $0 $0 $0
22. Program Management $14,280,362 $6,238,858 $0 $0
22.a. Administrative Costs $9,949,867 $1,038,859 $0 $0
Total Cumulative Administrative Costs $9,949,867
22.b. Assessment/Service Provision $2,928,885 $2,475,251 $0 $0
22.c. Systems $1,401,610 $2,724,748 $0 $0
23. Other $7,755,879 $9,876,677 $0 $0
24. Total Expenditures $272,018,358 $137,459,969 $0 $0
25. Transitional Services for Employed $0 $0 $0 $0
26. Job Access $0 $0 $0 $0
27. Federal Unliquidated Obligations $36,508,893 $0
28. Unobligated Balance $16,333,415 $0
29. State Replacement Funds $0
Quarterly EstimateEstimate of TANFFunds Requested
30. Estimate of TANF Funds Requested for the Following Quarter $0
THIS IS TO CERTIFY THAT THE INFORMATION REPORTED ON ALL PARTS OF THIS FORM IS ACCURATE AND TRUE TO THE BEST OF MYKNOWLEDGE AND BELIEF.
Signature, Approving State Official State Official NameAnnissa N. Thompson
State Official TitleGrant Manager
State Official AgencyGEORGIA
Signature Date:11/14/2016
Date Submitted:11/14/2016

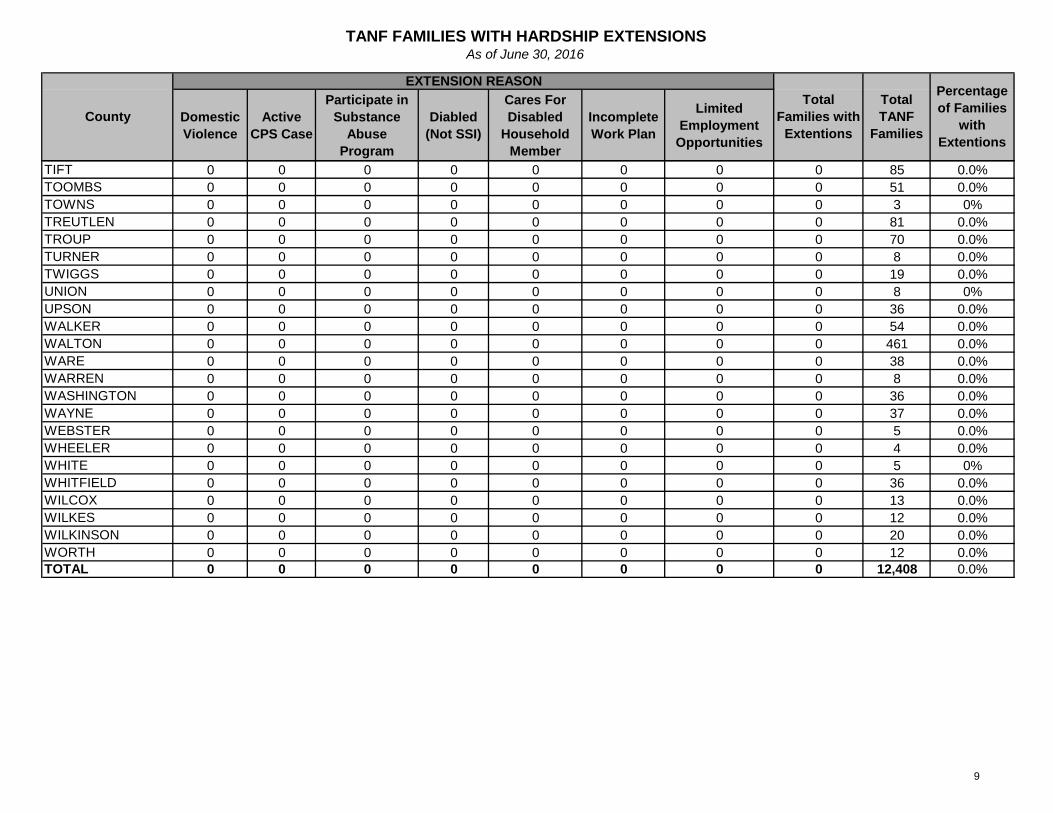
C. The Percentage of the TANF Caseload and the Number of Individuals Given a Hardship Exemption
From the Lifetime Limit

TANF FAMILIES WITH HARDSHIP EXTENSIONSAs of June 30, 2016
5
Domestic Violence
Active CPS Case
Participate in Substance
Abuse Program
Diabled (Not SSI)
Cares For Disabled
Household Member
Incomplete Work Plan
Limited Employment
Opportunities
APPLING 0 0 0 0 0 0 0 0 34 0.0%ATKINSON 0 0 0 0 0 0 0 0 13 0.0%BACON 0 0 0 0 0 0 0 0 16 0.0%BAKER 0 0 0 0 0 0 0 0 3 0.0%BALDWIN 0 0 0 0 0 0 0 0 72 0.0%BANKS 0 0 0 0 0 0 0 0 7 0.0%BARROW 0 0 0 0 0 0 0 0 16 0.0%BARTOW 0 0 0 0 0 0 0 0 58 0.0%BEN HILL 0 0 0 0 0 0 0 0 28 0.0%BERRIEN 0 0 0 0 0 0 0 0 17 0.0%BIBB 0 0 0 0 0 0 0 0 508 0.0%BLECKLEY 0 0 0 0 0 0 0 0 16 0.0%BRANTLEY 0 0 0 0 0 0 0 0 38 0.0%BROOKS 0 0 0 0 0 0 0 0 35 0.0%BRYAN 0 0 0 0 0 0 0 0 12 0.0%BULLOCH 0 0 0 0 0 0 0 0 70 0.0%BURKE 0 0 0 0 0 0 0 0 58 0.0%BUTTS 0 0 0 0 0 0 0 0 24 0.0%CALHOUN 0 0 0 0 0 0 0 0 9 0.0%CAMDEN 0 0 0 0 0 0 0 0 35 0.0%CANDLER 0 0 0 0 0 0 0 0 27 0.0%CARROLL 0 0 0 0 0 0 0 0 177 0.0%CATOOSA 0 0 0 0 0 0 0 0 57 0.0%CHARLTON 0 0 0 0 0 0 0 0 11 0.0%CHATHAM 0 0 0 0 0 0 0 0 139 0.0%CHATTAHOOCHEE 0 0 0 0 0 0 0 0 4 0.0%CHATTOOGA 0 0 0 0 0 0 0 0 29 0.0%CHEROKEE 0 0 0 0 0 0 0 0 41 0.0%CLARKE 0 0 0 0 0 0 0 0 74 0.0%CLAY 0 0 0 0 0 0 0 0 5 0.0%CLAYTON 0 0 0 0 0 0 0 0 600 0.0%CLINCH 0 0 0 0 0 0 0 0 11 0.0%COBB 0 0 0 0 0 0 0 0 537 0.0%COFFEE 0 0 0 0 0 0 0 0 67 0.0%
Percentage of Families
with Extentions
County
EXTENSION REASONTotal
Families with Extentions
Total TANF
Families
TANF FAMILIES WITH HARDSHIP EXTENSIONSAs of June 30, 2016
6
Domestic Violence
Active CPS Case
Participate in Substance
Abuse Program
Diabled (Not SSI)
Cares For Disabled
Household Member
Incomplete Work Plan
Limited Employment
Opportunities
Percentage of Families
with Extentions
County
EXTENSION REASONTotal
Families with Extentions
Total TANF
Families
COLQUITT 0 0 0 0 0 0 0 0 69 0.0%COLUMBIA 0 0 0 0 0 0 0 0 56 0.0%COOK 0 0 0 0 0 0 0 0 18 0.0%COWETA 0 0 0 0 0 0 0 0 85 0.0%CRAWFORD 0 0 0 0 0 0 0 0 13 0.0%CRISP 0 0 0 0 0 0 0 0 18 0.0%DADE 0 0 0 0 0 0 0 0 4 0%DAWSON 0 0 0 0 0 0 0 0 13 0%DECATUR 0 0 0 0 0 0 0 0 31 0.0%DEKALB 0 0 0 0 0 0 0 0 897 0.0%DODGE 0 0 0 0 0 0 0 0 32 0.0%DOOLY 0 0 0 0 0 0 0 0 6 0.0%DOUGHERTY 0 0 0 0 0 0 0 0 259 0.0%DOUGLAS 0 0 0 0 0 0 0 0 364 0.0%EARLY 0 0 0 0 0 0 0 0 4 0.0%ECHOLS 0 0 0 0 0 0 0 0 5 0.0%EFFINGHAM 0 0 0 0 0 0 0 0 25 0.0%ELBERT 0 0 0 0 0 0 0 0 21 0.0%EMANUEL 0 0 0 0 0 0 0 0 39 0.0%EVANS 0 0 0 0 0 0 0 0 22 0.0%FANNIN 0 0 0 0 0 0 0 0 5 0%FAYETTE 0 0 0 0 0 0 0 0 42 0.0%FLOYD 0 0 0 0 0 0 0 0 46 0.0%FORSYTH 0 0 0 0 0 0 0 0 20 0.0%FRANKLIN 0 0 0 0 0 0 0 0 14 0%FULTON 0 0 0 0 0 0 0 0 1,696 0.0%GILMER 0 0 0 0 0 0 0 0 11 0%GLASCOCK 0 0 0 0 0 0 0 0 3 0.0%GLYNN 0 0 0 0 0 0 0 0 160 0.0%GORDON 0 0 0 0 0 0 0 0 82 0.0%GRADY 0 0 0 0 0 0 0 0 29 0.0%GREENE 0 0 0 0 0 0 0 0 3 0.0%GWINNETT 0 0 0 0 0 0 0 0 479 0.0%HABERSHAM 0 0 0 0 0 0 0 0 13 0%

TANF FAMILIES WITH HARDSHIP EXTENSIONSAs of June 30, 2016
7
Domestic Violence
Active CPS Case
Participate in Substance
Abuse Program
Diabled (Not SSI)
Cares For Disabled
Household Member
Incomplete Work Plan
Limited Employment
Opportunities
Percentage of Families
with Extentions
County
EXTENSION REASONTotal
Families with Extentions
Total TANF
Families
HALL 0 0 0 0 0 0 0 0 146 0.0%HANCOCK 0 0 0 0 0 0 0 0 11 0.0%HARALSON 0 0 0 0 0 0 0 0 16 0.0%HARRIS 0 0 0 0 0 0 0 0 27 0.0%HART 0 0 0 0 0 0 0 0 14 0.0%HEARD 0 0 0 0 0 0 0 0 16 0.0%HENRY 0 0 0 0 0 0 0 0 136 0.0%HOUSTON 0 0 0 0 0 0 0 0 260 0.0%IRWIN 0 0 0 0 0 0 0 0 13 0.0%JACKSON 0 0 0 0 0 0 0 0 13 0.0%JASPER 0 0 0 0 0 0 0 0 7 0.0%JEFF DAVIS 0 0 0 0 0 0 0 0 23 0.0%JEFFERSON 0 0 0 0 0 0 0 0 22 0.0%JENKINS 0 0 0 0 0 0 0 0 28 0.0%JOHNSON 0 0 0 0 0 0 0 0 17 0.0%JONES 0 0 0 0 0 0 0 0 35 0.0%LAMAR 0 0 0 0 0 0 0 0 68 0.0%LANIER 0 0 0 0 0 0 0 0 3 0.0%LAURENS 0 0 0 0 0 0 0 0 121 0.0%LEE 0 0 0 0 0 0 0 0 24 0.0%LIBERTY 0 0 0 0 0 0 0 0 38 0.0%LINCOLN 0 0 0 0 0 0 0 0 8 0.0%LONG 0 0 0 0 0 0 0 0 11 0.0%LOWNDES 0 0 0 0 0 0 0 0 137 0.0%LUMPKIN 0 0 0 0 0 0 0 0 22 0.0%MACON 0 0 0 0 0 0 0 0 46 0.0%MADISON 0 0 0 0 0 0 0 0 13 0%MARION 0 0 0 0 0 0 0 0 48 0.0%MCDUFFIE 0 0 0 0 0 0 0 0 55 0.0%MCINTOSH 0 0 0 0 0 0 0 0 8 0.0%MERIWETHER 0 0 0 0 0 0 0 0 124 0.0%MILLER 0 0 0 0 0 0 0 0 4 0.0%MITCHELL 0 0 0 0 0 0 0 0 38 0.0%MONROE 0 0 0 0 0 0 0 0 32 0.0%

TANF FAMILIES WITH HARDSHIP EXTENSIONSAs of June 30, 2016
8
Domestic Violence
Active CPS Case
Participate in Substance
Abuse Program
Diabled (Not SSI)
Cares For Disabled
Household Member
Incomplete Work Plan
Limited Employment
Opportunities
Percentage of Families
with Extentions
County
EXTENSION REASONTotal
Families with Extentions
Total TANF
Families
MONTGOMERY 0 0 0 0 0 0 0 0 6 0.0%MORGAN 0 0 0 0 0 0 0 0 4 0%MURRAY 0 0 0 0 0 0 0 0 16 0%MUSCOGEE 0 0 0 0 0 0 0 0 536 0.0%NEWTON 0 0 0 0 0 0 0 0 117 0.0%OCONEE 0 0 0 0 0 0 0 0 5 0%OGLETHORPE 0 0 0 0 0 0 0 0 4 0%PAULDING 0 0 0 0 0 0 0 0 64 0.0%PEACH 0 0 0 0 0 0 0 0 34 0.0%PICKENS 0 0 0 0 0 0 0 0 57 0.0%PIERCE 0 0 0 0 0 0 0 0 27 0.0%PIKE 0 0 0 0 0 0 0 0 14 0.0%POLK 0 0 0 0 0 0 0 0 28 0.0%PULASKI 0 0 0 0 0 0 0 0 18 0.0%PUTNAM 0 0 0 0 0 0 0 0 23 0.0%QUITMAN 0 0 0 0 0 0 0 0 5 0.0%RABUN 0 0 0 0 0 0 0 0 9 0.0%RANDOLPH 0 0 0 0 0 0 0 0 29 0.0%RICHMOND 0 0 0 0 0 0 0 0 438 0.0%ROCKDALE 0 0 0 0 0 0 0 0 83 0.0%SCHLEY 0 0 0 0 0 0 0 0 17 0.0%SCREVEN 0 0 0 0 0 0 0 0 30 0.0%SEMINOLE 0 0 0 0 0 0 0 0 4 0.0%SPALDING 0 0 0 0 0 0 0 0 239 0.0%STEPHENS 0 0 0 0 0 0 0 0 105 0.0%STEWART 0 0 0 0 0 0 0 0 4 0.0%SUMTER 0 0 0 0 0 0 0 0 90 0.0%TALBOT 0 0 0 0 0 0 0 0 7 0.0%TALIAFERRO 0 0 0 0 0 0 0 0 2 0.0%TATTNALL 0 0 0 0 0 0 0 0 26 0.0%TAYLOR 0 0 0 0 0 0 0 0 18 0.0%TELFAIR 0 0 0 0 0 0 0 0 13 0.0%TERRELL 0 0 0 0 0 0 0 0 16 0.0%THOMAS 0 0 0 0 0 0 0 0 202 0.0%
TANF FAMILIES WITH HARDSHIP EXTENSIONSAs of June 30, 2016
9
Domestic Violence
Active CPS Case
Participate in Substance
Abuse Program
Diabled (Not SSI)
Cares For Disabled
Household Member
Incomplete Work Plan
Limited Employment
Opportunities
Percentage of Families
with Extentions
County
EXTENSION REASONTotal
Families with Extentions
Total TANF
Families
TIFT 0 0 0 0 0 0 0 0 85 0.0%TOOMBS 0 0 0 0 0 0 0 0 51 0.0%TOWNS 0 0 0 0 0 0 0 0 3 0%TREUTLEN 0 0 0 0 0 0 0 0 81 0.0%TROUP 0 0 0 0 0 0 0 0 70 0.0%TURNER 0 0 0 0 0 0 0 0 8 0.0%TWIGGS 0 0 0 0 0 0 0 0 19 0.0%UNION 0 0 0 0 0 0 0 0 8 0%UPSON 0 0 0 0 0 0 0 0 36 0.0%WALKER 0 0 0 0 0 0 0 0 54 0.0%WALTON 0 0 0 0 0 0 0 0 461 0.0%WARE 0 0 0 0 0 0 0 0 38 0.0%WARREN 0 0 0 0 0 0 0 0 8 0.0%WASHINGTON 0 0 0 0 0 0 0 0 36 0.0%WAYNE 0 0 0 0 0 0 0 0 37 0.0%WEBSTER 0 0 0 0 0 0 0 0 5 0.0%WHEELER 0 0 0 0 0 0 0 0 4 0.0%WHITE 0 0 0 0 0 0 0 0 5 0%WHITFIELD 0 0 0 0 0 0 0 0 36 0.0%WILCOX 0 0 0 0 0 0 0 0 13 0.0%WILKES 0 0 0 0 0 0 0 0 12 0.0%WILKINSON 0 0 0 0 0 0 0 0 20 0.0%WORTH 0 0 0 0 0 0 0 0 12 0.0%TOTAL 0 0 0 0 0 0 0 0 12,408 0.0%

D. Number of Individuals Who Received Transportation Assistance
and the Cost of Such Assistance
Transportation received by individuals participating in Application Job Search is shown in (E) Diversionary Assistance.

TANF RECIPIENT TRANSPORTATION ASSISTANCEState Fiscal Year 2016
10
COUNTY Annual Clients
Annual Funds
Cost Per Client
APPLING 0 $0.00 $0.00ATKINSON 0 $0.00 $0.00BACON 0 $0.00 $0.00BAKER 0 $0.00 $0.00BALDWIN 76 $6,895.00 $90.72BANKS 0 $0.00 $0.00BARROW 0 $0.00 $0.00BARTOW 6 $445.00 $74.17BEN HILL 0 $0.00 $0.00BERRIEN 0 $0.00 $0.00BIBB 11 $765.00 $69.55BLECKLEY 18 $1,775.00 $98.61BRANTLEY 0 $0.00 $0.00BROOKS 0 $0.00 $0.00BRYAN 0 $0.00 $0.00BULLOCH 5 $365.00 $73.00BURKE 30 $2,405.00 $80.17BUTTS 7 $410.00 $58.57CALHOUN 1 $100.00 $100.00CAMDEN 5 $375.00 $75.00CANDLER 2 $95.00 $47.50CARROLL 45 $3,495.00 $77.67CATOOSA 13 $1,095.00 $84.23CHARLTON 0 $0.00 $0.00CHATHAM 58 $4,752.50 $81.94CHATTAHOOCHEE 0 $0.00 $0.00CHATTOOGA 4 $315.00 $78.75CHEROKEE 6 $450.00 $75.00CLARKE 7 $510.00 $72.86CLAY 0 $0.00 $0.00CLAYTON 643 $30,896.25 $48.05CLINCH 0 $0.00 $0.00COBB 691 $66,387.33 $96.07COFFEE 0 $0.00 $0.00COLQUITT 4 $445.00 $111.25COLUMBIA 14 $725.00 $51.79COOK 1 $5.00 $5.00COWETA 27 $2,240.00 $82.96CRAWFORD 0 $0.00 $0.00CRISP 41 $3,400.00 $82.93DADE 0 $0.00 $0.00DAWSON 9 $375.00 $41.67DECATUR 1 $90.00 $90.00DEKALB 3 $2,185.70 $728.57DODGE 0 $0.00 $0.00DOOLY 0 $0.00 $0.00DOUGHERTY 167 $10,960.00 $65.63DOUGLAS 39 $3,345.00 $85.77EARLY 6 $585.00 $97.50ECHOLS 0 $0.00 $0.00EFFINGHAM 4 $280.00 $70.00

TANF RECIPIENT TRANSPORTATION ASSISTANCEState Fiscal Year 2016
11
COUNTY Annual Clients
Annual Funds
Cost Per Client
ELBERT 0 $0.00 $0.00EMANUEL 0 $0.00 $0.00EVANS 0 $0.00 $0.00FANNIN 0 $0.00 $0.00FAYETTE 35 $2,510.00 $71.71FLOYD 8 $540.00 $67.50FORSYTH 0 $0.00 $0.00FRANKLIN 0 $0.00 $0.00FULTON 4 $1,786.59 $446.65GILMER 0 $0.00 $0.00GLASCOCK 0 $0.00 $0.00GLYNN 9 $705.00 $78.33GORDON 12 $1,140.00 $95.00GRADY 13 $1,175.00 $90.38GREENE 0 $0.00 $0.00GWINNETT 2,183 $139,036.93 $63.69HABERSHAM 0 $0.00 $0.00HALL 263 $25,596.41 $97.32HANCOCK 3 $195.00 $65.00HARALSON 0 $0.00 $0.00HARRIS 29 $2,575.00 $88.79HART 2 $150.00 $75.00HEARD 1 $105.00 $105.00HENRY 123 $15,715.00 $127.76HOUSTON 13 $610.00 $46.92IRWIN 0 $0.00 $0.00JACKSON 0 $0.00 $0.00JASPER 0 $0.00 $0.00JEFF DAVIS 0 $0.00 $0.00JEFFERSON 21 $1,290.00 $61.43JENKINS 26 $1,935.00 $74.42JOHNSON 0 $0.00 $0.00JONES 0 $0.00 $0.00LAMAR 31 $2,465.00 $79.52LANIER 0 $0.00 $0.00LAURENS 49 $3,680.00 $75.10LEE 0 $0.00 $0.00LIBERTY 1 $45.00 $45.00LINCOLN 3 $160.00 $53.33LONG 0 $0.00 $0.00LOWNDES 0 $0.00 $0.00LUMPKIN 0 $0.00 $0.00MACON 0 $0.00 $0.00MADISON 0 $0.00 $0.00MARION 0 $0.00 $0.00MCDUFFIE 35 $2,235.00 $63.86MCINTOSH 0 $0.00 $0.00MERIWETHER 12 $1,030.00 $85.83MILLER 0 $0.00 $0.00MITCHELL 1 $100.00 $100.00MONROE 0 $0.00 $0.00

TANF RECIPIENT TRANSPORTATION ASSISTANCEState Fiscal Year 2016
12
COUNTY Annual Clients
Annual Funds
Cost Per Client
MONTGOMERY 0 $0.00 $0.00MORGAN 0 $0.00 $0.00MURRAY 0 $0.00 $0.00MUSCOGEE 337 $26,610.00 $78.96NEWTON 54 $3,975.00 $73.61OCONEE 0 $0.00 $0.00OGLETHORPE 0 $0.00 $0.00PAULDING 16 $1,265.00 $79.06PEACH 0 $0.00 $0.00PICKENS 0 $0.00 $0.00PIERCE 0 $0.00 $0.00PIKE 12 $955.00 $79.58POLK 3 $135.00 $45.00PULASKI 1 $45.00 $45.00PUTNAM 41 $3,615.00 $88.17QUITMAN 0 $0.00 $0.00RABUN 0 $0.00 $0.00RANDOLPH 0 $0.00 $0.00RICHMOND 172 $11,931.00 $69.37ROCKDALE 210 $15,901.25 $75.72SCHLEY 0 $0.00 $0.00SCREVEN 10 $575.00 $57.50SEMINOLE 0 $0.00 $0.00SPALDING 115 $7,840.00 $68.17STEPHENS 5 $1,250.98 $250.20STEWART 0 $0.00 $0.00SUMTER 10 $905.00 $90.50TALBOT 0 $0.00 $0.00TALIAFERRO 0 $0.00 $0.00TATTNALL 0 $0.00 $0.00TAYLOR 0 $0.00 $0.00TELFAIR 0 $0.00 $0.00TERRELL 4 $460.00 $115.00THOMAS 4 $350.00 $87.50TIFT 3 $180.00 $60.00TOOMBS 0 $0.00 $0.00TOWNS 0 $0.00 $0.00TREUTLEN 0 $0.00 $0.00TROUP 23 $1,890.00 $82.17TURNER 0 $0.00 $0.00TWIGGS 0 $0.00 $0.00UNION 0 $0.00 $0.00UPSON 13 $900.00 $69.23WALKER 3 $190.00 $63.33WALTON 0 $0.00 $0.00WARE 0 $0.00 $0.00WARREN 28 $1,800.00 $64.29WASHINGTON 7 $515.00 $73.57WAYNE 5 $365.00 $73.00WEBSTER 0 $0.00 $0.00WHEELER 0 $0.00 $0.00

TANF RECIPIENT TRANSPORTATION ASSISTANCEState Fiscal Year 2016
13
COUNTY Annual Clients
Annual Funds
Cost Per Client
WHITE 0 $0.00 $0.00WHITFIELD 7 $645.00 $92.14WILCOX 0 $0.00 $0.00WILKES 5 $460.00 $92.00WILKINSON 0 $0.00 $0.00WORTH 0 $0.00 $0.00STATE 5,909 $433,704.94 $73.40

E. The Number of Individuals Who Received Diversionary Assistance in Order to
Prevent Their Requiring TANF Assistance And the Categories and Cost of
Such Diversionary Assistance and Job Acceptance and Retention Statistics
Note: A diverted individual is defined as one who participates in Application Job Search and whose application for cash assistance is denied because the person either accepts a job or withdraws his or her application. No additional information is gathered on these individuals since they are no longer included in the TANF database.

DIVERSIONARY ASSISTANCE TO PREVENT TANF RECEIPTState Fiscal Year 2016
14
County Type of Assistance
Annual Clients Annual Funds Average Cost
per ClientChildcare 12 $2,002.00 $166.83Incidentals 0 $0.00 $0.00Transportation -1 ($95.00) $95.00Childcare 0 $0.00 $0.00Incidentals 0 $0.00 $0.00Transportation 0 $0.00 $0.00Childcare 0 $0.00 $0.00Incidentals 0 $0.00 $0.00Transportation 0 $0.00 $0.00Childcare 0 $0.00 $0.00Incidentals 0 $0.00 $0.00Transportation 0 $0.00 $0.00Childcare 46 $6,384.00 $138.78Incidentals 0 $0.00 $0.00Transportation 19 $1,090.00 $57.37Childcare 0 $0.00 $0.00Incidentals 0 $0.00 $0.00Transportation 0 $0.00 $0.00Childcare 8 $1,523.00 $190.38Incidentals 0 $0.00 $0.00Transportation 0 $0.00 $0.00Childcare 6 $768.00 $128.00Incidentals 0 $0.00 $0.00Transportation 0 $0.00 $0.00Childcare 5 $1,146.00 $229.20Incidentals 0 $0.00 $0.00Transportation 0 $0.00 $0.00Childcare 0 $0.00 $0.00Incidentals 0 $0.00 $0.00Transportation 0 $0.00 $0.00Childcare 588 $82,650.00 $140.56Incidentals 0 $0.00 $0.00Transportation 203 $15,950.00 $78.57Childcare 0 $0.00 $0.00Incidentals 0 $0.00 $0.00Transportation 0 $0.00 $0.00Childcare 0 $0.00 $0.00Incidentals 0 $0.00 $0.00Transportation 0 $0.00 $0.00Childcare 0 $0.00 $0.00Incidentals 0 $0.00 $0.00Transportation 0 $0.00 $0.00Childcare 0 $0.00 $0.00Incidentals 0 $0.00 $0.00Transportation 0 $0.00 $0.00Childcare 38 $4,204.00 $110.63Incidentals 1 $50.57 $50.57Transportation 15 $905.00 $60.33Childcare 19 $2,200.00 $115.79Incidentals 0 $0.00 $0.00Transportation 3 $55.00 $18.33Childcare 0 $0.00 $0.00Incidentals 0 $0.00 $0.00Transportation 0 $0.00 $0.00
BACON
BAKER
BALDWIN
BANKS
BRYAN
BULLOCH
BURKE
BUTTS
BARROW
BARTOW
BEN HILL
BERRIEN
BIBB
BLECKLEY
BRANTLEY
BROOKS
APPLING
ATKINSON

DIVERSIONARY ASSISTANCE TO PREVENT TANF RECEIPTState Fiscal Year 2016
15
County Type of Assistance
Annual Clients Annual Funds Average Cost
per ClientChildcare 0 $0.00 $0.00Incidentals 0 $0.00 $0.00Transportation 0 $0.00 $0.00Childcare 1 $83.00 $83.00Incidentals 0 $0.00 $0.00Transportation 0 $0.00 $0.00Childcare 0 $0.00 $0.00Incidentals 0 $0.00 $0.00Transportation 0 $0.00 $0.00Childcare 71 $6,862.00 $96.65Incidentals 0 $0.00 $0.00Transportation 0 $0.00 $0.00Childcare 7 $457.00 $65.29Incidentals 0 $0.00 $0.00Transportation 0 $0.00 $0.00Childcare 0 $0.00 $0.00Incidentals 0 $0.00 $0.00Transportation 0 $0.00 $0.00Childcare 66 $9,373.00 $142.02Incidentals 0 $0.00 $0.00Transportation 0 $0.00 $0.00Childcare 0 $0.00 $0.00Incidentals 0 $0.00 $0.00Transportation 0 $0.00 $0.00Childcare 0 $0.00 $0.00Incidentals 0 $0.00 $0.00Transportation 0 $0.00 $0.00Childcare 29 $5,209.00 $179.62Incidentals 0 $0.00 $0.00Transportation 2 $72.75 $36.38Childcare 71 $9,226.00 $129.94Incidentals 0 $0.00 $0.00Transportation 13 $375.00 $28.85Childcare 0 $0.00 $0.00Incidentals 0 $0.00 $0.00Transportation 0 $0.00 $0.00Childcare 912 $161,066.00 $176.61Incidentals 0 $0.00 $0.00Transportation 75 $1,040.00 $13.87Childcare 0 $0.00 $0.00Incidentals 0 $0.00 $0.00Transportation 0 $0.00 $0.00Childcare 708 $119,190.00 $168.35Incidentals 0 $0.00 $0.00Transportation 82 $7,582.55 $92.47Childcare 0 $0.00 $0.00Incidentals 0 $0.00 $0.00Transportation 0 $0.00 $0.00Childcare 2 $210.00 $105.00Incidentals 0 $0.00 $0.00Transportation 0 $0.00 $0.00Childcare 9 $1,358.00 $150.89Incidentals 0 $0.00 $0.00Transportation 1 $5.00 $5.00
CLARKE
CANDLER
CARROLL
CATOOSA
CHARLTON
CHATHAM
CHATTAHOOCHEE
CALHOUN
CAMDEN
CHATTOOGA
CHEROKEE
CLAY
CLAYTON
CLINCH
COBB
COFFEE
COLQUITT
COLUMBIA

DIVERSIONARY ASSISTANCE TO PREVENT TANF RECEIPTState Fiscal Year 2016
16
County Type of Assistance
Annual Clients Annual Funds Average Cost
per ClientChildcare 0 $0.00 $0.00Incidentals 0 $0.00 $0.00Transportation 0 $0.00 $0.00Childcare 46 $5,286.00 $114.91Incidentals 0 $0.00 $0.00Transportation 0 $0.00 $0.00Childcare 0 $0.00 $0.00Incidentals 0 $0.00 $0.00Transportation 0 $0.00 $0.00Childcare 0 $0.00 $0.00Incidentals 0 $0.00 $0.00Transportation 0 $0.00 $0.00Childcare 0 $0.00 $0.00Incidentals 0 $0.00 $0.00Transportation 0 $0.00 $0.00Childcare 11 $1,868.00 $169.82Incidentals 0 $0.00 $0.00Transportation 0 $0.00 $0.00Childcare 34 $7,063.00 $207.74Incidentals 0 $0.00 $0.00Transportation 0 $0.00 $0.00Childcare 2571 $447,822.00 $174.18Incidentals 0 $0.00 $0.00Transportation 9177 $449,088.00 $48.94Childcare 4 $568.00 $142.00Incidentals 0 $0.00 $0.00Transportation 2 $120.00 $60.00Childcare 4 $546.00 $136.50Incidentals 0 $0.00 $0.00Transportation 0 $0.00 $0.00Childcare 164 $20,885.00 $127.35Incidentals 0 $0.00 $0.00Transportation 85 $4,499.04 $52.93Childcare 98 $19,854.00 $202.59Incidentals 0 $0.00 $0.00Transportation 1 $25.00 $25.00Childcare 0 $0.00 $0.00Incidentals 0 $0.00 $0.00Transportation 0 $0.00 $0.00Childcare 1 $88.00 $88.00Incidentals 0 $0.00 $0.00Transportation 0 $0.00 $0.00Childcare 0 $0.00 $0.00Incidentals 0 $0.00 $0.00Transportation 0 $0.00 $0.00Childcare 0 $0.00 $0.00Incidentals 0 $0.00 $0.00Transportation 0 $0.00 $0.00Childcare 0 $0.00 $0.00Incidentals 0 $0.00 $0.00Transportation 0 $0.00 $0.00Childcare 3 $428.00 $142.67Incidentals 0 $0.00 $0.00Transportation 4 $260.00 $65.00
ELBERT
COOK
COWETA
DODGE
DOOLY
DOUGHERTY
DOUGLAS
DADE
DAWSON
DECATUR
DEKALB
CRAWFORD
CRISP
EARLY
ECHOLS
EMANUEL
EVANS
EFFINGHAM

DIVERSIONARY ASSISTANCE TO PREVENT TANF RECEIPTState Fiscal Year 2016
17
County Type of Assistance
Annual Clients Annual Funds Average Cost
per ClientChildcare 0 $0.00 $0.00Incidentals 0 $0.00 $0.00Transportation 2 $50.00 $25.00Childcare 37 $6,043.00 $163.32Incidentals 0 $0.00 $0.00Transportation 0 $0.00 $0.00Childcare 35 $5,876.00 $167.89Incidentals 0 $0.00 $0.00Transportation 0 $0.00 $0.00Childcare 13 $2,759.00 $212.23Incidentals 0 $0.00 $0.00Transportation 0 $0.00 $0.00Childcare 0 $0.00 $0.00Incidentals 0 $0.00 $0.00Transportation 0 $0.00 $0.00Childcare 3784 $697,632.00 $184.36Incidentals 0 $0.00 $0.00Transportation 16847 $815,694.85 $48.42Childcare 0 $0.00 $0.00Incidentals 0 $0.00 $0.00Transportation 0 $0.00 $0.00Childcare 0 $0.00 $0.00Incidentals 0 $0.00 $0.00Transportation 0 $0.00 $0.00Childcare 3 $508.00 $169.33Incidentals 0 $0.00 $0.00Transportation 0 $0.00 $0.00Childcare 1 $88.00 $88.00Incidentals 0 $0.00 $0.00Transportation 1 $35.00 $35.00Childcare 2 $210.00 $105.00Incidentals 0 $0.00 $0.00Transportation 0 $0.00 $0.00Childcare 0 $0.00 $0.00Incidentals 0 $0.00 $0.00Transportation 0 $0.00 $0.00Childcare 645 $119,204.00 $184.81Incidentals 0 $0.00 $0.00Transportation 181 $9,050.00 $50.00Childcare 1 $70.00 $70.00Incidentals 0 $0.00 $0.00Transportation 0 $0.00 $0.00Childcare 69 $10,473.00 $151.78Incidentals 0 $0.00 $0.00Transportation 94 $3,960.00 $42.13Childcare 0 $0.00 $0.00Incidentals 0 $0.00 $0.00Transportation 0 $0.00 $0.00Childcare 2 $280.00 $140.00Incidentals 0 $0.00 $0.00Transportation 0 $0.00 $0.00Childcare 3 $648.00 $216.00Incidentals 1 $826.93 $826.93Transportation 6 $425.00 $70.83
FORSYTH
FLOYD
FANNIN
FAYETTE
FULTON
FRANKLIN
HANCOCK
HALL
HABERSHAM
GWINNETT
GREENE
GRADY
HARRIS
HARALSON
GORDON
GLYNN
GLASCOCK
GILMER

DIVERSIONARY ASSISTANCE TO PREVENT TANF RECEIPTState Fiscal Year 2016
18
County Type of Assistance
Annual Clients Annual Funds Average Cost
per ClientChildcare 0 $0.00 $0.00Incidentals 0 $0.00 $0.00Transportation 0 $0.00 $0.00Childcare 0 $0.00 $0.00Incidentals 0 $0.00 $0.00Transportation 0 $0.00 $0.00Childcare 174 $29,383.00 $168.87Incidentals 0 $0.00 $0.00Transportation 1 $25.00 $25.00Childcare 156 $21,668.00 $138.90Incidentals 0 $0.00 $0.00Transportation 33 $2,585.00 $78.33Childcare 0 $0.00 $0.00Incidentals 0 $0.00 $0.00Transportation 0 $0.00 $0.00Childcare 0 $0.00 $0.00Incidentals 0 $0.00 $0.00Transportation 0 $0.00 $0.00Childcare 0 $0.00 $0.00Incidentals 0 $0.00 $0.00Transportation 0 $0.00 $0.00Childcare 0 $0.00 $0.00Incidentals 0 $0.00 $0.00Transportation 0 $0.00 $0.00Childcare 0 $0.00 $0.00Incidentals 0 $0.00 $0.00Transportation 0 $0.00 $0.00Childcare 0 $0.00 $0.00Incidentals 0 $0.00 $0.00Transportation 1 $20.00 $20.00Childcare 0 $0.00 $0.00Incidentals 0 $0.00 $0.00Transportation 1 $20.00 $20.00Childcare 11 $1,710.00 $155.45Incidentals 0 $0.00 $0.00Transportation 0 $0.00 $0.00Childcare 13 $1,511.00 $116.23Incidentals 0 $0.00 $0.00Transportation 0 $0.00 $0.00Childcare 0 $0.00 $0.00Incidentals 0 $0.00 $0.00Transportation 0 $0.00 $0.00Childcare 4 $300.00 $75.00Incidentals 0 $0.00 $0.00Transportation 14 $770.00 $55.00Childcare 2 $282.00 $141.00Incidentals 0 $0.00 $0.00Transportation 0 $0.00 $0.00Childcare 6 $799.00 $133.17Incidentals 0 $0.00 $0.00Transportation 5 $350.00 $70.00Childcare 0 $0.00 $0.00Incidentals 0 $0.00 $0.00Transportation 0 $0.00 $0.00
HEARD
HART
JENKINS
JEFFERSON
JEFF DAVIS
JASPER
JACKSON
IRWIN
HOUSTON
HENRY
LINCOLN
LEE
JONES
JOHNSON
LIBERTY
LAURENS
LANIER
LAMAR

DIVERSIONARY ASSISTANCE TO PREVENT TANF RECEIPTState Fiscal Year 2016
19
County Type of Assistance
Annual Clients Annual Funds Average Cost
per ClientChildcare 0 $0.00 $0.00Incidentals 0 $0.00 $0.00Transportation 0 $0.00 $0.00Childcare 2 $176.00 $88.00Incidentals 0 $0.00 $0.00Transportation 0 $0.00 $0.00Childcare 1 $88.00 $88.00Incidentals 0 $0.00 $0.00Transportation 0 $0.00 $0.00Childcare 3 $420.00 $140.00Incidentals 0 $0.00 $0.00Transportation 0 $0.00 $0.00Childcare 0 $0.00 $0.00Incidentals 0 $0.00 $0.00Transportation 0 $0.00 $0.00Childcare 0 $0.00 $0.00Incidentals 0 $0.00 $0.00Transportation 0 $0.00 $0.00Childcare 0 $0.00 $0.00Incidentals 0 $0.00 $0.00Transportation 1 $5.00 $5.00Childcare 0 $0.00 $0.00Incidentals 0 $0.00 $0.00Transportation 0 $0.00 $0.00Childcare 0 $0.00 $0.00Incidentals 0 $0.00 $0.00Transportation 0 $0.00 $0.00Childcare 2 $576.00 $288.00Incidentals 0 $0.00 $0.00Transportation 0 $0.00 $0.00Childcare 0 $0.00 $0.00Incidentals 0 $0.00 $0.00Transportation 1 $75.00 $75.00Childcare 8 $818.00 $102.25Incidentals 0 $0.00 $0.00Transportation 0 $0.00 $0.00Childcare 0 $0.00 $0.00Incidentals 0 $0.00 $0.00Transportation 0 $0.00 $0.00Childcare 0 $0.00 $0.00Incidentals 0 $0.00 $0.00Transportation 0 $0.00 $0.00Childcare 0 $0.00 $0.00Incidentals 0 $0.00 $0.00Transportation 0 $0.00 $0.00Childcare 466 $56,118.00 $120.42Incidentals 0 $0.00 $0.00Transportation 1 $75.00 $75.00Childcare 126 $17,375.00 $137.90Incidentals 1 $127.45 $127.45Transportation 20 $965.00 $48.25Childcare 6 $678.00 $113.00Incidentals 0 $0.00 $0.00Transportation 0 $0.00 $0.00
MCDUFFIE
MARION
MADISON
LONG
LUMPKIN
LOWNDES
MACON
MILLER
OCONEE
NEWTON
MITCHELL
MUSCOGEE
MURRAY
MORGAN
MONTGOMERY
MONROE
MERIWETHER
MCINTOSH

DIVERSIONARY ASSISTANCE TO PREVENT TANF RECEIPTState Fiscal Year 2016
20
County Type of Assistance
Annual Clients Annual Funds Average Cost
per ClientChildcare 0 $0.00 $0.00Incidentals 0 $0.00 $0.00Transportation 0 $0.00 $0.00Childcare 10 $1,660.00 $166.00Incidentals 0 $0.00 $0.00Transportation 4 $123.20 $30.80Childcare 10 $2,059.00 $205.90Incidentals 0 $0.00 $0.00Transportation 0 $0.00 $0.00Childcare 0 $0.00 $0.00Incidentals 0 $0.00 $0.00Transportation 0 $0.00 $0.00Childcare 0 $0.00 $0.00Incidentals 0 $0.00 $0.00Transportation 0 $0.00 $0.00Childcare 8 $1,036.00 $129.50Incidentals 0 $0.00 $0.00Transportation 0 $0.00 $0.00Childcare 3 $210.00 $70.00Incidentals 0 $0.00 $0.00Transportation 2 $103.20 $51.60Childcare 0 $0.00 $0.00Incidentals 0 $0.00 $0.00Transportation 0 $0.00 $0.00Childcare 12 $1,146.00 $95.50Incidentals 0 $0.00 $0.00Transportation 12 $605.00 $50.42Childcare 0 $0.00 $0.00Incidentals 0 $0.00 $0.00Transportation 0 $0.00 $0.00Childcare 0 $0.00 $0.00Incidentals 0 $0.00 $0.00Transportation 0 $0.00 $0.00Childcare 0 $0.00 $0.00Incidentals 0 $0.00 $0.00Transportation 0 $0.00 $0.00Childcare 587 $85,959.00 $146.44Incidentals 0 $0.00 $0.00Transportation 70 $2,175.00 $31.07Childcare 284 $47,530.00 $167.36Incidentals 0 $0.00 $0.00Transportation 29 $688.75 $23.75Childcare 3 $224.00 $74.67Incidentals 0 $0.00 $0.00Transportation 0 $0.00 $0.00Childcare 1 $210.00 $210.00Incidentals 0 $0.00 $0.00Transportation 0 $0.00 $0.00Childcare 0 $0.00 $0.00Incidentals 0 $0.00 $0.00Transportation 0 $0.00 $0.00Childcare 64 $9,078.00 $141.84Incidentals 0 $0.00 $0.00Transportation 0 $0.00 $0.00
PIERCE
SPALDING
SEMINOLE
QUITMAN
PUTNAM
PULASKI
POLK
PIKE
PAULDING
OGLETHORPE
PICKENS
PEACH
ROCKDALE
RICHMOND
RANDOLPH
RABUN
SCREVEN
SCHLEY
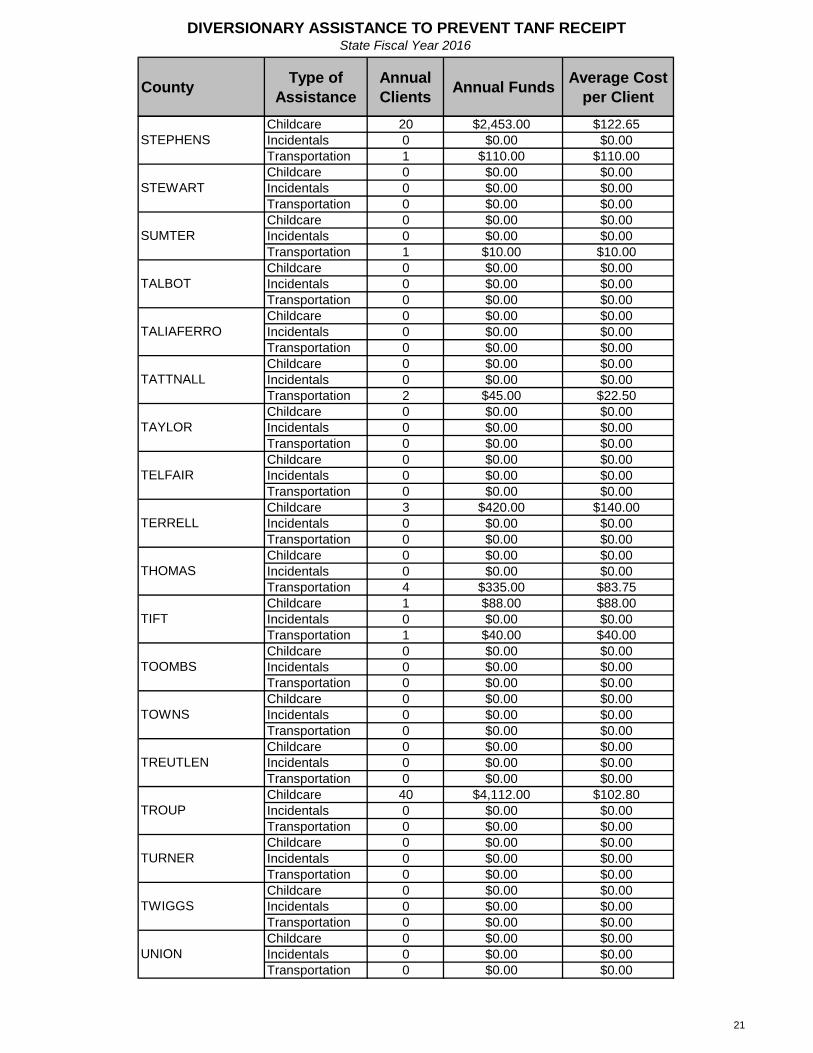
DIVERSIONARY ASSISTANCE TO PREVENT TANF RECEIPTState Fiscal Year 2016
21
County Type of Assistance
Annual Clients Annual Funds Average Cost
per ClientChildcare 20 $2,453.00 $122.65Incidentals 0 $0.00 $0.00Transportation 1 $110.00 $110.00Childcare 0 $0.00 $0.00Incidentals 0 $0.00 $0.00Transportation 0 $0.00 $0.00Childcare 0 $0.00 $0.00Incidentals 0 $0.00 $0.00Transportation 1 $10.00 $10.00Childcare 0 $0.00 $0.00Incidentals 0 $0.00 $0.00Transportation 0 $0.00 $0.00Childcare 0 $0.00 $0.00Incidentals 0 $0.00 $0.00Transportation 0 $0.00 $0.00Childcare 0 $0.00 $0.00Incidentals 0 $0.00 $0.00Transportation 2 $45.00 $22.50Childcare 0 $0.00 $0.00Incidentals 0 $0.00 $0.00Transportation 0 $0.00 $0.00Childcare 0 $0.00 $0.00Incidentals 0 $0.00 $0.00Transportation 0 $0.00 $0.00Childcare 3 $420.00 $140.00Incidentals 0 $0.00 $0.00Transportation 0 $0.00 $0.00Childcare 0 $0.00 $0.00Incidentals 0 $0.00 $0.00Transportation 4 $335.00 $83.75Childcare 1 $88.00 $88.00Incidentals 0 $0.00 $0.00Transportation 1 $40.00 $40.00Childcare 0 $0.00 $0.00Incidentals 0 $0.00 $0.00Transportation 0 $0.00 $0.00Childcare 0 $0.00 $0.00Incidentals 0 $0.00 $0.00Transportation 0 $0.00 $0.00Childcare 0 $0.00 $0.00Incidentals 0 $0.00 $0.00Transportation 0 $0.00 $0.00Childcare 40 $4,112.00 $102.80Incidentals 0 $0.00 $0.00Transportation 0 $0.00 $0.00Childcare 0 $0.00 $0.00Incidentals 0 $0.00 $0.00Transportation 0 $0.00 $0.00Childcare 0 $0.00 $0.00Incidentals 0 $0.00 $0.00Transportation 0 $0.00 $0.00Childcare 0 $0.00 $0.00Incidentals 0 $0.00 $0.00Transportation 0 $0.00 $0.00
TELFAIR
STEWART
STEPHENS
THOMAS
TERRELL
UNION
TOWNS
TOOMBS
TIFT
TAYLOR
TATTNALL
TALIAFERRO
TALBOT
SUMTER
TWIGGS
TREUTLEN
TURNER
TROUP

DIVERSIONARY ASSISTANCE TO PREVENT TANF RECEIPTState Fiscal Year 2016
22
County Type of Assistance
Annual Clients Annual Funds Average Cost
per ClientChildcare 4 $294.00 $73.50Incidentals 0 $0.00 $0.00Transportation 0 $0.00 $0.00Childcare 5 $505.00 $101.00Incidentals 0 $0.00 $0.00Transportation 0 $0.00 $0.00Childcare 22 $3,294.00 $149.73Incidentals 0 $0.00 $0.00Transportation 0 $0.00 $0.00Childcare 0 $0.00 $0.00Incidentals 0 $0.00 $0.00Transportation 0 $0.00 $0.00Childcare 3 $299.00 $99.67Incidentals 0 $0.00 $0.00Transportation 0 $0.00 $0.00Childcare 4 $630.00 $157.50Incidentals 0 $0.00 $0.00Transportation 3 $75.00 $25.00Childcare 5 $327.00 $65.40Incidentals 0 $0.00 $0.00Transportation 0 $0.00 $0.00Childcare 0 $0.00 $0.00Incidentals 0 $0.00 $0.00Transportation 0 $0.00 $0.00Childcare 0 $0.00 $0.00Incidentals 0 $0.00 $0.00Transportation 0 $0.00 $0.00Childcare 0 $0.00 $0.00Incidentals 0 $0.00 $0.00Transportation 0 $0.00 $0.00Childcare 0 $0.00 $0.00Incidentals 0 $0.00 $0.00Transportation 2 $40.00 $20.00Childcare 0 $0.00 $0.00Incidentals 0 $0.00 $0.00Transportation 0 $0.00 $0.00Childcare 12 $1,150.00 $95.83Incidentals 0 $0.00 $0.00Transportation 1 $10.00 $10.00Childcare 0 $0.00 $0.00Incidentals 0 $0.00 $0.00Transportation 0 $0.00 $0.00Childcare 1 $83.00 $83.00Incidentals 0 $0.00 $0.00Transportation 0 $0.00 $0.00Childcare 12,211 $2,056,779.00 $168.44Incidentals 3 $1,004.95 $334.98Transportation 27,022 $1,319,437.34 $48.83
WALKER
UPSON
TOTAL
WORTH
WILKINSON
WILKES
WILCOX
WHITFIELD
WHITE
WHEELER
WEBSTER
WAYNE
WASHINGTON
WARREN
WARE
WALTON

F. The Number of Individuals Denied Assistance Due to a Serious Felony
Conviction

NUMBER OF INDIVIDUALS DENIED ASSISTANCE DUE TO A SERIOUS VIOLENT FELONY CONVICTION
State Fiscal Year 2016
23
CountyNumber Denied/Closed
CountyNumber Denied/Closed
CountyNumber Denied/Closed
CountyNumber Denied/Closed
APPLING 1 EFFINGHAM 1 MITCHELL 1 WAYNE 2ATKINSON 1 ELBERT 3 MONROE 4 WEBSTER 1BACON 1 EMANUEL 1 MONTGOMERY 1 WHEELER 1BAKER 1 EVANS 1 MORGAN 1 WHITE 1BALDWIN 8 FANNIN 1 MURRAY 1 WHITFIELD 1BANKS 1 FAYETTE 1 MUSCOGEE 6 WILCOX 1BARROW 5 FLOYD 1 NEWTON 3 WILKES 2BARTOW 1 FORSYTH 1 OCONEE 1 WILKINSON 1BEN HILL 1 FRANKLIN 1 OGLETHORPE 1 WORTH 1BERRIEN 1 FULTON 48 PAULDING 2 TOTAL 321BIBB 1 GILMER 1 PEACH 1BLECKLEY 1 GLASCOCK 1 PICKENS 1BRANTLEY 1 GLYNN 2 PIERCE 1BROOKS 1 GORDON 1 PIKE 1BRYAN 1 GRADY 1 POLK 1BULLOCH 10 GREENE 1 PULASKI 1BURKE 1 GWINNETT 3 PUTNAM 1BUTTS 1 HABERSHAM 1 QUITMAN 1CALHOUN 1 HALL 1 RABUN 1CAMDEN 1 HANCOCK 1 RANDOLPH 1CANDLER 1 HARALSON 1 RICHMOND 4CARROLL 6 HARRIS 1 ROCKDALE 3CATOOSA 1 HART 1 SCHLEY 1CHARLTON 1 HEARD 1 SCREVEN 1CHATHAM 8 HENRY 2 SEMINOLE 1CHATTAHOOCHEE 1 HOUSTON 3 SPALDING 3CHATTOOGA 1 IRWIN 1 STEPHENS 1CHEROKEE 2 JACKSON 1 STEWART 1CLARKE 4 JASPER 1 SUMTER 1CLAY 1 JEFF DAVIS 1 TALBOT 1CLAYTON 3 JEFFERSON 1 TALIAFERRO 1CLINCH 1 JENKINS 2 TATTNALL 4COBB 8 JOHNSON 1 TAYLOR 1COFFEE 1 JONES 1 TELFAIR 1COLQUITT 1 LAMAR 1 TERRELL 1COLUMBIA 1 LANIER 1 THOMAS 2COOK 1 LAURENS 4 TIFT 1COWETA 4 LEE 1 TOOMBS 1CRAWFORD 1 LIBERTY 3 TOWNS 1CRISP 1 LINCOLN 1 TREUTLEN 1DADE 1 LONG 2 TROUP 1DAWSON 1 LOWNDES 1 TURNER 1DECATUR 1 LUMPKIN 1 TWIGGS 1DEKALB 20 MACON 1 UNION 1DODGE 1 MADISON 1 UPSON 1DOOLY 1 MARION 1 WALKER 2DOUGHERTY 6 MCDUFFIE 2 WALTON 2DOUGLAS 2 MCINTOSH 1 WARE 1EARLY 1 MERIWETHER 1 WARREN 1ECHOLS 1 MILLER 1 WASHINGTON 1

G. The Number of Mothers Under 19 Years of Age Who Received Assistance and Their
Percentage of the Total TANF Caseload

NUMBER OF MOTHERS UNDER 19 YEARS OF AGEWHO RECEIVED ASSISTANCE AND THEIR PERCENTAGE OF
THE TOTAL TANF CASELOADState Fiscal Year 2016
24
CountyNumber of Teen Moms as of June
2016
TANF Caseload as of June 2016
Percentage of Total Caseload
APPLING 4 34 11.8%ATKINSON 0 13 0.0%BACON 0 16 0.0%BAKER 0 3 0.0%BALDWIN 44 72 61.1%BANKS 1 7 14.3%BARROW 4 16 25.0%BARTOW 9 58 15.5%BEN HILL 0 28 0.0%BERRIEN 0 17 0.0%BIBB 275 508 54.1%BLECKLEY 1 16 6.3%BRANTLEY 1 38 2.6%BROOKS 4 35 11.4%BRYAN 0 12 0.0%BULLOCH 8 70 11.4%BURKE 17 58 29.3%BUTTS 6 24 25.0%CALHOUN 1 9 11.1%CAMDEN 7 35 20.0%CANDLER 3 27 11.1%CARROLL 15 177 8.5%CATOOSA 13 57 22.8%CHARLTON 0 11 0.0%CHATHAM 26 139 18.7%CHATTAHOOCHEE 4 4 100.0%CHATTOOGA 1 29 3.4%CHEROKEE 11 41 26.8%CLARKE 67 74 90.5%CLAY 1 5 20.0%CLAYTON 312 600 52.0%CLINCH 0 11 0.0%COBB 504 537 93.9%COFFEE 1 67 1.5%COLQUITT 7 69 10.1%COLUMBIA 16 56 28.6%COOK 0 18 0.0%COWETA 14 85 16.5%CRAWFORD 3 13 23.1%CRISP 3 18 16.7%DADE 0 4 0.0%DAWSON 3 13 23.1%DECATUR 2 31 6.5%DEKALB 925 897 103.1%DODGE 4 32 12.5%DOOLY 0 6 0.0%DOUGHERTY 99 259 38.2%DOUGLAS 118 364 32.4%

NUMBER OF MOTHERS UNDER 19 YEARS OF AGEWHO RECEIVED ASSISTANCE AND THEIR PERCENTAGE OF
THE TOTAL TANF CASELOADState Fiscal Year 2016
25
CountyNumber of Teen Moms as of June
2016
TANF Caseload as of June 2016
Percentage of Total Caseload
APPLING 4 34 11.8%EARLY 0 4 0.0%ECHOLS 0 5 0.0%EFFINGHAM 5 25 20.0%ELBERT 37 21 176.2%EMANUEL 6 39 15.4%EVANS 3 22 13.6%FANNIN 2 5 40.0%FAYETTE 12 42 28.6%FLOYD 9 46 19.6%FORSYTH 12 20 60.0%FRANKLIN 0 14 0.0%FULTON 1,803 1,696 106.3%GILMER 0 11 0.0%GLASCOCK 1 3 33.3%GLYNN 30 160 18.8%GORDON 6 82 7.3%GRADY 1 29 3.4%GREENE 0 3 0.0%GWINNETT 397 479 82.9%HABERSHAM 2 13 15.4%HALL 69 146 47.3%HANCOCK 7 11 63.6%HARALSON 4 16 25.0%HARRIS 10 27 37.0%HART 6 14 42.9%HEARD 0 16 0.0%HENRY 68 136 50.0%HOUSTON 79 260 30.4%IRWIN 0 13 0.0%JACKSON 6 13 46.2%JASPER 0 7 0.0%JEFF DAVIS 0 23 0.0%JEFFERSON 7 22 31.8%JENKINS 12 28 42.9%JOHNSON 0 17 0.0%JONES 3 35 8.6%LAMAR 206 68 302.9%LANIER 1 3 33.3%LAURENS 33 121 27.3%LEE 3 24 12.5%LIBERTY 8 38 21.1%LINCOLN 3 8 37.5%LONG 2 11 18.2%LOWNDES 2 137 1.5%LUMPKIN 3 22 13.6%MACON 10 46 21.7%MADISON 1 13 7.7%

NUMBER OF MOTHERS UNDER 19 YEARS OF AGEWHO RECEIVED ASSISTANCE AND THEIR PERCENTAGE OF
THE TOTAL TANF CASELOADState Fiscal Year 2016
26
CountyNumber of Teen Moms as of June
2016
TANF Caseload as of June 2016
Percentage of Total Caseload
APPLING 4 34 11.8%MARION 16 48 33.3%MCDUFFIE 15 55 27.3%MCINTOSH 0 8 0.0%MERIWETHER 12 124 9.7%MILLER 1 4 25.0%MITCHELL 2 38 5.3%MONROE 5 32 15.6%MONTGOMERY 1 6 16.7%MORGAN 0 4 0.0%MURRAY 2 16 12.5%MUSCOGEE 383 536 71.5%NEWTON 47 117 40.2%OCONEE 0 5 0.0%OGLETHORPE 1 4 25.0%PAULDING 11 64 17.2%PEACH 16 34 47.1%PICKENS 3 57 5.3%PIERCE 3 27 11.1%PIKE 10 14 71.4%POLK 1 28 3.6%PULASKI 6 18 33.3%PUTNAM 2 23 8.7%QUITMAN 0 5 0.0%RABUN 0 9 0.0%RANDOLPH 33 29 113.8%RICHMOND 279 438 63.7%ROCKDALE 90 83 108.4%SCHLEY 2 17 11.8%SCREVEN 6 30 20.0%SEMINOLE 0 4 0.0%SPALDING 52 239 21.8%STEPHENS 25 105 23.8%STEWART 6 4 150.0%SUMTER 28 90 31.1%TALBOT 6 7 85.7%TALIAFERRO 0 2 0.0%TATTNALL 0 26 0.0%TAYLOR 14 18 77.8%TELFAIR 5 13 38.5%TERRELL 5 16 31.3%THOMAS 49 202 24.3%TIFT 1 85 1.2%TOOMBS 6 51 11.8%TOWNS 0 3 0.0%TREUTLEN 34 81 42.0%TROUP 10 70 14.3%TURNER 0 8 0.0%

NUMBER OF MOTHERS UNDER 19 YEARS OF AGEWHO RECEIVED ASSISTANCE AND THEIR PERCENTAGE OF
THE TOTAL TANF CASELOADState Fiscal Year 2016
27
CountyNumber of Teen Moms as of June
2016
TANF Caseload as of June 2016
Percentage of Total Caseload
APPLING 4 34 11.8%TWIGGS 3 19 15.8%UNION 0 8 0.0%UPSON 8 36 22.2%WALKER 1 54 1.9%WALTON 18 461 3.9%WARE 1 38 2.6%WARREN 3 8 37.5%WASHINGTON 5 36 13.9%WAYNE 6 37 16.2%WEBSTER 4 5 80.0%WHEELER 1 4 25.0%WHITE 0 5 0.0%WHITFIELD 3 36 8.3%WILCOX 2 13 15.4%WILKES 1 12 8.3%WILKINSON 11 20 55.0%WORTH 0 12 0.0%TOTAL 6,658 12,408 53.7%

H. The Number of Children Receiving Subsidized Child Care and the Total Average
Recipient Cost of Child Care Provided to TANF Recipients

SUBSIDIZED CHILDCAREAnnual Expenditures
State Fiscal Year 2016
28
CountyType of
AssistanceAnnual Clients Annual Funds Average Cost
per ClientApplicant Services 12 $2,002.00 $166.83Pre-K 38 $3,414.00 $89.84TANF 0 $15.14 $0.00Transitional 0 $0.00 $0.00Applicant Services 0 $0.00 $0.00Pre-K 0 $0.00 $0.00TANF 0 $0.00 $0.00Transitional 0 $0.00 $0.00Applicant Services 0 $0.00 $0.00Pre-K 0 $0.00 $0.00TANF 0 $0.00 $0.00Transitional 0 $0.00 $0.00Applicant Services 0 $0.00 $0.00Pre-K 0 $0.00 $0.00TANF 0 $0.00 $0.00Transitional 0 $0.00 $0.00Applicant Services 46 $6,384.00 $138.78Pre-K 254 $23,759.00 $93.54TANF 95 $7,985.00 $84.05Transitional 284 $39,280.00 $138.31Applicant Services 0 $0.00 $0.00Pre-K 0 $0.00 $0.00TANF 0 $0.00 $0.00Transitional 0 $0.00 $0.00Applicant Services 8 $1,523.00 $190.38Pre-K 124 $12,328.00 $99.42TANF 0 $0.00 $0.00Transitional 49 $10,781.00 $220.02Applicant Services 6 $768.00 $128.00Pre-K 182 $12,065.00 $66.29TANF 31 $33,866.00 $1,092.45Transitional 59 $10,122.00 $171.56Applicant Services 5 $1,146.00 $229.20Pre-K 0 $0.00 $0.00TANF 0 $0.00 $0.00Transitional 0 $0.00 $0.00Applicant Services 0 $0.00 $0.00Pre-K 24 $769.00 $32.04TANF 0 $0.00 $0.00Transitional 0 $0.00 $0.00Applicant Services 588 $82,650.00 $140.56Pre-K 516 $45,582.00 $88.34TANF 239 $406,865.00 $1,702.36Transitional 622 $86,901.00 $139.71Applicant Services 0 $0.00 $0.00Pre-K 11 $1,056.00 $96.00TANF 19 $1,881.89 $99.05Transitional 3 $408.00 $136.00Applicant Services 0 $0.00 $0.00Pre-K 6 $155.00 $25.83TANF 0 $0.00 $0.00Transitional 0 $0.00 $0.00Applicant Services 0 $0.00 $0.00Pre-K 0 $0.00 $0.00TANF 0 $0.00 $0.00Transitional 0 $0.00 $0.00
APPLING
BEN HILL
BARTOW
BARROW
BANKS
BALDWIN
BRANTLEY
BROOKS
BIBB
BERRIEN
BAKER
BACON
ATKINSON
BLECKLEY

SUBSIDIZED CHILDCAREAnnual Expenditures
State Fiscal Year 2016
29
CountyType of
AssistanceAnnual Clients Annual Funds Average Cost
per ClientApplicant Services 0 $0.00 $0.00Pre-K 33 $2,800.00 $84.85TANF 0 $0.00 $0.00Transitional 0 $0.00 $0.00Applicant Services 38 $4,204.00 $110.63Pre-K 152 $12,828.00 $84.39TANF 22 $1,395.90 $63.45Transitional 200 $27,010.00 $135.05Applicant Services 19 $2,200.00 $115.79Pre-K 22 $560.00 $25.45TANF 37 $2,920.00 $78.92Transitional 25 $2,725.00 $109.00Applicant Services 0 $0.00 $0.00Pre-K 0 $0.00 $0.00TANF 19 $3,785.00 $199.21Transitional 0 $0.00 $0.00Applicant Services 0 $0.00 $0.00Pre-K 0 $0.00 $0.00TANF 1 $100.00 $100.00Transitional 0 $0.00 $0.00Applicant Services 1 $83.00 $83.00Pre-K 154 $17,501.00 $113.64TANF 5 $375.00 $75.00Transitional 0 $0.00 $0.00Applicant Services 0 $0.00 $0.00Pre-K 7 $370.00 $52.86TANF 2 $95.00 $47.50Transitional 0 $0.00 $0.00Applicant Services 71 $6,862.00 $96.65Pre-K 62 $3,812.00 $61.48TANF 149 $29,595.00 $198.62Transitional 108 $11,589.00 $107.31Applicant Services 7 $457.00 $65.29Pre-K 44 $3,897.00 $88.57TANF 13 $1,095.00 $84.23Transitional 0 $0.00 $0.00Applicant Services 0 $0.00 $0.00Pre-K 0 $0.00 $0.00TANF 0 $0.00 $0.00Transitional 0 $0.00 $0.00Applicant Services 66 $9,373.00 $142.02Pre-K 558 $53,563.00 $95.99TANF 63 $6,197.50 $98.37Transitional 211 $32,281.00 $152.99Applicant Services 0 $0.00 $0.00Pre-K 9 $170.00 $18.89TANF 0 $0.00 $0.00Transitional 0 $0.00 $0.00Applicant Services 0 $0.00 $0.00Pre-K 0 $0.00 $0.00TANF 4 $315.00 $78.75Transitional 0 $0.00 $0.00Applicant Services 29 $5,209.00 $179.62Pre-K 364 $35,519.00 $97.58TANF 20 $37,342.75 $1,867.14Transitional 165 $38,321.00 $232.25
CATOOSA
CARROLL
CANDLER
BURKE
BULLOCH
BRYAN
CHEROKEE
CHATTOOGA
CHATTAHOOCHEE
CAMDEN
CALHOUN
BUTTS
CHATHAM
CHARLTON

SUBSIDIZED CHILDCAREAnnual Expenditures
State Fiscal Year 2016
30
CountyType of
AssistanceAnnual Clients Annual Funds Average Cost
per ClientApplicant Services 71 $9,226.00 $129.94Pre-K 448 $35,360.00 $78.93TANF 23 $1,015.00 $44.13Transitional 138 $19,007.00 $137.73Applicant Services 0 $0.00 $0.00Pre-K 0 $0.00 $0.00TANF 0 $0.00 $0.00Transitional 51 $12,799.00 $250.96Applicant Services 912 $161,066.00 $176.61Pre-K 1,228 $128,049.00 $104.27TANF 756 $205,596.25 $271.95Transitional 4,384 $800,454.00 $182.59Applicant Services 0 $0.00 $0.00Pre-K 0 $0.00 $0.00TANF 0 $0.00 $0.00Transitional 0 $0.00 $0.00Applicant Services 708 $119,190.00 $168.35Pre-K 1,287 $124,785.00 $96.96TANF 1,850 $261,542.94 $141.37Transitional 3,093 $534,229.00 $172.72Applicant Services 0 $0.00 $0.00Pre-K 3 $100.00 $33.33TANF 0 $0.00 $0.00Transitional 0 $0.00 $0.00Applicant Services 2 $210.00 $105.00Pre-K 84 $7,246.00 $86.26TANF 4 $445.00 $111.25Transitional 14 $2,126.00 $151.86Applicant Services 9 $1,358.00 $150.89Pre-K 42 $2,661.00 $63.36TANF 15 $730.00 $48.67Transitional 6 $966.00 $161.00Applicant Services 0 $0.00 $0.00Pre-K 57 $3,957.00 $69.42TANF 1 $5.00 $5.00Transitional 34 $4,783.00 $140.68Applicant Services 46 $5,286.00 $114.91Pre-K 128 $10,385.00 $81.13TANF 100 $21,515.00 $215.15Transitional 275 $35,526.00 $129.19Applicant Services 0 $0.00 $0.00Pre-K 17 $3,998.00 $235.18TANF 0 $0.00 $0.00Transitional 11 $1,308.00 $118.91Applicant Services 0 $0.00 $0.00Pre-K 4 $214.00 $53.50TANF 43 $3,471.49 $80.73Transitional 35 $2,578.00 $73.66Applicant Services 0 $0.00 $0.00Pre-K 3 $481.00 $160.33TANF 0 $0.00 $0.00Transitional 0 $0.00 $0.00Applicant Services 11 $1,868.00 $169.82Pre-K 51 $4,892.00 $95.92TANF 9 $375.00 $41.67Transitional 14 $1,168.00 $83.43
DADE
CRAWFORD
COWETA
COLQUITT
COFFEE
COBB
CLINCH
CLAYTON
COOK
COLUMBIA
CLAY
CLARKE
CRISP
DAWSON

SUBSIDIZED CHILDCAREAnnual Expenditures
State Fiscal Year 2016
31
CountyType of
AssistanceAnnual Clients Annual Funds Average Cost
per ClientApplicant Services 34 $7,063.00 $207.74Pre-K 10 $923.00 $92.30TANF 1 $90.00 $90.00Transitional 61 $12,151.00 $199.20Applicant Services 2,571 $447,822.00 $174.18Pre-K 2,320 $240,624.00 $103.72TANF 9,259 $1,197,403.39 $129.32Transitional 10,603 $1,852,740.00 $174.74Applicant Services 4 $568.00 $142.00Pre-K 81 $5,873.00 $72.51TANF 2 $120.00 $60.00Transitional 0 $0.00 $0.00Applicant Services 4 $546.00 $136.50Pre-K 0 $0.00 $0.00TANF 0 $0.00 $0.00Transitional 6 $1,197.00 $199.50Applicant Services 164 $20,885.00 $127.35Pre-K 483 $38,793.00 $80.32TANF 260 $16,177.09 $62.22Transitional 444 $58,176.00 $131.03Applicant Services 98 $19,854.00 $202.59Pre-K 454 $43,718.00 $96.30TANF 44 $3,870.67 $87.97Transitional 394 $79,052.00 $200.64Applicant Services 0 $0.00 $0.00Pre-K 0 $0.00 $0.00TANF 8 $1,000.00 $125.00Transitional 0 $0.00 $0.00Applicant Services 1 $88.00 $88.00Pre-K 0 $0.00 $0.00TANF 0 $0.00 $0.00Transitional 0 $0.00 $0.00Applicant Services 0 $0.00 $0.00Pre-K 11 $702.00 $63.82TANF 5 $380.00 $76.00Transitional 0 $0.00 $0.00Applicant Services 0 $0.00 $0.00Pre-K 5 $223.00 $44.60TANF 0 $0.00 $0.00Transitional 17 $876.00 $51.53Applicant Services 0 $0.00 $0.00Pre-K 81 $4,824.00 $59.56TANF 0 $0.00 $0.00Transitional 0 $0.00 $0.00Applicant Services 3 $428.00 $142.67Pre-K 10 $253.00 $25.30TANF 4 $260.00 $65.00Transitional 0 $0.00 $0.00Applicant Services 0 $0.00 $0.00Pre-K 0 $0.00 $0.00TANF 2 $50.00 $25.00Transitional 33 $2,452.00 $74.30Applicant Services 37 $6,043.00 $163.32Pre-K 77 $10,657.00 $138.40TANF 75 $12,260.00 $163.47Transitional 63 $12,223.00 $194.02
DOUGHERTY
DOOLY
DODGE
DEKALB
DECATUR
FAYETTE
FANNIN
EVANS
EMANUEL
ELBERT
EFFINGHAM
DOUGLAS
ECHOLS
EARLY

SUBSIDIZED CHILDCAREAnnual Expenditures
State Fiscal Year 2016
32
CountyType of
AssistanceAnnual Clients Annual Funds Average Cost
per ClientApplicant Services 35 $5,876.00 $167.89Pre-K 234 $19,182.00 $81.97TANF 22 $38,707.86 $1,759.45Transitional 41 $5,113.00 $124.71Applicant Services 13 $2,759.00 $212.23Pre-K 93 $9,552.00 $102.71TANF 0 $0.00 $0.00Transitional 15 $2,950.00 $196.67Applicant Services 0 $0.00 $0.00Pre-K 0 $0.00 $0.00TANF 0 $0.00 $0.00Transitional 0 $0.00 $0.00Applicant Services 3,784 $697,632.00 $184.36Pre-K 2,258 $249,097.00 $110.32TANF 16,961 $1,968,481.69 $116.06Transitional 12,551 $2,268,437.00 $180.74Applicant Services 0 $0.00 $0.00Pre-K 0 $0.00 $0.00TANF 0 $0.00 $0.00Transitional 0 $0.00 $0.00Applicant Services 0 $0.00 $0.00Pre-K 0 $0.00 $0.00TANF 0 $0.00 $0.00Transitional 0 $0.00 $0.00Applicant Services 3 $508.00 $169.33Pre-K 140 $11,012.00 $78.66TANF 9 $705.00 $78.33Transitional 33 $4,235.00 $128.33Applicant Services 1 $88.00 $88.00Pre-K 4 $225.00 $56.25TANF 13 $1,175.00 $90.38Transitional 32 $3,686.00 $115.19Applicant Services 2 $210.00 $105.00Pre-K 0 $0.00 $0.00TANF 13 $1,175.00 $90.38Transitional 0 $0.00 $0.00Applicant Services 0 $0.00 $0.00Pre-K 0 $0.00 $0.00TANF 0 $0.00 $0.00Transitional 0 $0.00 $0.00Applicant Services 645 $119,204.00 $184.81Pre-K 1,408 $143,163.00 $101.68TANF 2,832 $343,202.93 $121.19Transitional 2,164 $391,215.00 $180.78Applicant Services 1 $70.00 $70.00Pre-K 28 $1,875.00 $66.96TANF 0 $0.00 $0.00Transitional 32 $3,382.00 $105.69Applicant Services 69 $10,473.00 $151.78Pre-K 333 $31,983.00 $96.05TANF 370 $39,449.57 $106.62Transitional 237 $47,443.00 $200.18Applicant Services 0 $0.00 $0.00Pre-K 0 $0.00 $0.00TANF 4 $345.00 $86.25Transitional 0 $0.00 $0.00
GREENE
GRADY
GORDON
GLYNN
FULTON
FRANKLIN
FORSYTH
FLOYD
GLASCOCK
GILMER
HANCOCK
HALL
HABERSHAM
GWINNETT

SUBSIDIZED CHILDCAREAnnual Expenditures
State Fiscal Year 2016
33
CountyType of
AssistanceAnnual Clients Annual Funds Average Cost
per ClientApplicant Services 2 $280.00 $140.00Pre-K 45 $5,449.00 $121.09TANF 0 $0.00 $0.00Transitional 33 $2,511.00 $76.09Applicant Services 3 $648.00 $216.00Pre-K 39 $4,746.00 $121.69TANF 71 $10,766.07 $151.63Transitional 0 $0.00 $0.00Applicant Services 0 $0.00 $0.00Pre-K 1 $39.00 $39.00TANF 2 $150.00 $75.00Transitional 0 $0.00 $0.00Applicant Services 0 $0.00 $0.00Pre-K 0 $0.00 $0.00TANF 6 $1,980.00 $330.00Transitional 24 $1,782.00 $74.25Applicant Services 174 $29,383.00 $168.87Pre-K 667 $72,434.00 $108.60TANF 178 $91,260.00 $512.70Transitional 380 $68,671.00 $180.71Applicant Services 156 $21,668.00 $138.90Pre-K 426 $29,933.00 $70.27TANF 46 $3,195.00 $69.46Transitional 532 $70,750.00 $132.99Applicant Services 0 $0.00 $0.00Pre-K 10 $1,095.00 $109.50TANF 0 $0.00 $0.00Transitional 0 $0.00 $0.00Applicant Services 0 $0.00 $0.00Pre-K 86 $8,626.00 $100.30TANF 0 $0.00 $0.00Transitional 18 $3,002.00 $166.78Applicant Services 0 $0.00 $0.00Pre-K 46 $2,952.00 $64.17TANF 0 $0.00 $0.00Transitional 0 $0.00 $0.00Applicant Services 0 $0.00 $0.00Pre-K 3 $301.00 $100.33TANF 0 $0.00 $0.00Transitional 0 $0.00 $0.00Applicant Services 0 $0.00 $0.00Pre-K 0 $0.00 $0.00TANF 24 $1,740.00 $72.50Transitional 12 $1,344.00 $112.00Applicant Services 0 $0.00 $0.00Pre-K 6 $640.00 $106.67TANF 29 $2,255.00 $77.76Transitional 40 $5,124.00 $128.10Applicant Services 0 $0.00 $0.00Pre-K 14 $606.00 $43.29TANF 1 $20.00 $20.00Transitional 0 $0.00 $0.00Applicant Services 11 $1,710.00 $155.45Pre-K 37 $3,312.00 $89.51TANF 0 $0.00 $0.00Transitional 1 $122.00 $122.00
HENRY
HEARD
HART
HARRIS
HARALSON
JACKSON
IRWIN
HOUSTON
JONES
JOHNSON
JENKINS
JEFFERSON
JEFF DAVIS
JASPER

SUBSIDIZED CHILDCAREAnnual Expenditures
State Fiscal Year 2016
34
CountyType of
AssistanceAnnual Clients Annual Funds Average Cost
per ClientApplicant Services 13 $1,511.00 $116.23Pre-K 95 $6,620.00 $69.68TANF 63 $12,305.00 $195.32Transitional 149 $19,732.00 $132.43Applicant Services 0 $0.00 $0.00Pre-K 0 $0.00 $0.00TANF 0 $0.00 $0.00Transitional 0 $0.00 $0.00Applicant Services 4 $300.00 $75.00Pre-K 74 $5,111.00 $69.07TANF 74 $5,013.85 $67.75Transitional 203 $17,164.00 $84.55Applicant Services 2 $282.00 $141.00Pre-K 98 $8,964.00 $91.47TANF 0 $0.00 $0.00Transitional 26 $2,781.00 $106.96Applicant Services 6 $799.00 $133.17Pre-K 81 $5,941.00 $73.35TANF 6 $395.00 $65.83Transitional 28 $3,879.00 $138.54Applicant Services 0 $0.00 $0.00Pre-K 0 $0.00 $0.00TANF 4 $310.00 $77.50Transitional 0 $0.00 $0.00Applicant Services 0 $0.00 $0.00Pre-K 1 $27.00 $27.00TANF 0 $0.00 $0.00Transitional 0 $0.00 $0.00Applicant Services 2 $176.00 $88.00Pre-K 209 $22,364.00 $107.00TANF 0 $0.00 $0.00Transitional 66 $10,176.00 $154.18Applicant Services 1 $88.00 $88.00Pre-K 53 $3,332.00 $62.87TANF 0 $0.00 $0.00Transitional 10 $1,334.00 $133.40Applicant Services 3 $420.00 $140.00Pre-K 4 $273.00 $68.25TANF 0 $0.00 $0.00Transitional 0 $0.00 $0.00Applicant Services 0 $0.00 $0.00Pre-K 24 $2,735.00 $113.96TANF 0 $0.00 $0.00Transitional 0 $0.00 $0.00Applicant Services 0 $0.00 $0.00Pre-K 0 $0.00 $0.00TANF 0 $0.00 $0.00Transitional 0 $0.00 $0.00Applicant Services 0 $0.00 $0.00Pre-K 42 $3,328.00 $79.24TANF 39 $2,445.00 $62.69Transitional 0 $0.00 $0.00Applicant Services 0 $0.00 $0.00Pre-K 0 $0.00 $0.00TANF 0 $0.00 $0.00Transitional 0 $0.00 $0.00
LIBERTY
LEE
LAURENS
LANIER
LAMAR
LUMPKIN
LOWNDES
LONG
LINCOLN
MADISON
MACON
MCINTOSH
MCDUFFIE
MARION

SUBSIDIZED CHILDCAREAnnual Expenditures
State Fiscal Year 2016
35
CountyType of
AssistanceAnnual Clients Annual Funds Average Cost
per ClientApplicant Services 0 $0.00 $0.00Pre-K 3 $125.00 $41.67TANF 33 $6,280.00 $190.30Transitional 0 $0.00 $0.00Applicant Services 2 $576.00 $288.00Pre-K 0 $0.00 $0.00TANF 0 $0.00 $0.00Transitional 0 $0.00 $0.00Applicant Services 0 $0.00 $0.00Pre-K 34 $2,215.00 $65.15TANF 2 $175.00 $87.50Transitional 46 $3,507.00 $76.24Applicant Services 8 $818.00 $102.25Pre-K 21 $1,689.00 $80.43TANF 0 $0.00 $0.00Transitional 10 $1,274.00 $127.40Applicant Services 0 $0.00 $0.00Pre-K 0 $0.00 $0.00TANF 0 $0.00 $0.00Transitional 0 $0.00 $0.00Applicant Services 0 $0.00 $0.00Pre-K 20 $611.00 $30.55TANF 0 $0.00 $0.00Transitional 7 $1,162.00 $166.00Applicant Services 0 $0.00 $0.00Pre-K 13 $1,241.00 $95.46TANF 0 $0.00 $0.00Transitional 0 $0.00 $0.00Applicant Services 466 $56,118.00 $120.42Pre-K 748 $65,232.00 $87.21TANF 1,416 $217,606.45 $153.68Transitional 1,177 $155,041.00 $131.73Applicant Services 126 $17,375.00 $137.90Pre-K 328 $33,698.00 $102.74TANF 100 $15,227.90 $152.28Transitional 397 $58,891.00 $148.34Applicant Services 6 $678.00 $113.00Pre-K 21 $3,307.00 $157.48TANF 0 $0.00 $0.00Transitional 0 $0.00 $0.00Applicant Services 0 $0.00 $0.00Pre-K 15 $1,727.00 $115.13TANF 0 $0.00 $0.00Transitional 0 $0.00 $0.00Applicant Services 10 $1,660.00 $166.00Pre-K 304 $29,781.00 $97.96TANF 23 $2,009.13 $87.35Transitional 120 $25,833.00 $215.28Applicant Services 10 $2,059.00 $205.90Pre-K 46 $3,807.00 $82.76TANF 0 $0.00 $0.00Transitional 13 $1,837.00 $141.31Applicant Services 0 $0.00 $0.00Pre-K 0 $0.00 $0.00TANF 0 $0.00 $0.00Transitional 0 $0.00 $0.00
OGLETHORPE
OCONEE
MURRAY
MORGAN
MONTGOMERY
MONROE
MITCHELL
MILLER
NEWTON
MUSCOGEE
MERIWETHER
PICKENS
PEACH
PAULDING

SUBSIDIZED CHILDCAREAnnual Expenditures
State Fiscal Year 2016
36
CountyType of
AssistanceAnnual Clients Annual Funds Average Cost
per ClientApplicant Services 0 $0.00 $0.00Pre-K 17 $1,880.00 $110.59TANF 0 $0.00 $0.00Transitional 0 $0.00 $0.00Applicant Services 8 $1,036.00 $129.50Pre-K 8 $218.00 $27.25TANF 37 $7,646.50 $206.66Transitional 1 $140.00 $140.00Applicant Services 3 $210.00 $70.00Pre-K 42 $1,558.00 $37.10TANF 5 $238.20 $47.64Transitional 0 $0.00 $0.00Applicant Services 0 $0.00 $0.00Pre-K 66 $5,309.00 $80.44TANF 2 $96.00 $48.00Transitional 18 $2,582.00 $143.44Applicant Services 12 $1,146.00 $95.50Pre-K 21 $2,790.00 $132.86TANF 1,454 $402,469.50 $276.80Transitional 32 $3,920.00 $122.50Applicant Services 0 $0.00 $0.00Pre-K 0 $0.00 $0.00TANF 0 $0.00 $0.00Transitional 0 $0.00 $0.00Applicant Services 0 $0.00 $0.00Pre-K 0 $0.00 $0.00TANF 0 $0.00 $0.00Transitional 0 $0.00 $0.00Applicant Services 0 $0.00 $0.00Pre-K 3 $216.00 $72.00TANF 0 $0.00 $0.00Transitional 0 $0.00 $0.00Applicant Services 587 $85,959.00 $146.44Pre-K 532 $50,614.00 $95.14TANF 282 $19,556.00 $69.35Transitional 817 $104,441.00 $127.83Applicant Services 284 $47,530.00 $167.36Pre-K 420 $37,628.00 $89.59TANF 289 $106,263.14 $367.69Transitional 808 $141,641.00 $175.30Applicant Services 3 $224.00 $74.67Pre-K 0 $0.00 $0.00TANF 0 $0.00 $0.00Transitional 0 $0.00 $0.00Applicant Services 1 $210.00 $210.00Pre-K 4 $712.00 $178.00TANF 11 $725.00 $65.91Transitional 22 $2,708.00 $123.09Applicant Services 0 $0.00 $0.00Pre-K 22 $795.00 $36.14TANF 0 $0.00 $0.00Transitional 0 $0.00 $0.00Applicant Services 64 $9,078.00 $141.84Pre-K 72 $6,773.00 $94.07TANF 269 $49,265.00 $183.14Transitional 282 $29,115.00 $103.24
PIKE
PIERCE
SEMINOLE
SCREVEN
SCHLEY
ROCKDALE
RICHMOND
RANDOLPH
RABUN
QUITMAN
SPALDING
PUTNAM
PULASKI
POLK

SUBSIDIZED CHILDCAREAnnual Expenditures
State Fiscal Year 2016
37
CountyType of
AssistanceAnnual Clients Annual Funds Average Cost
per ClientApplicant Services 20 $2,453.00 $122.65Pre-K 14 $1,524.00 $108.86TANF 6 $1,360.98 $226.83Transitional 54 $6,194.00 $114.70Applicant Services 0 $0.00 $0.00Pre-K 0 $0.00 $0.00TANF 0 $0.00 $0.00Transitional 0 $0.00 $0.00Applicant Services 0 $0.00 $0.00Pre-K 82 $7,208.00 $87.90TANF 11 $915.00 $83.18Transitional 0 $0.00 $0.00Applicant Services 0 $0.00 $0.00Pre-K 0 $0.00 $0.00TANF 0 $0.00 $0.00Transitional 34 $6,221.00 $182.97Applicant Services 0 $0.00 $0.00Pre-K 2 $139.00 $69.50TANF 0 $0.00 $0.00Transitional 0 $0.00 $0.00Applicant Services 0 $0.00 $0.00Pre-K 24 $2,782.00 $115.92TANF 2 $45.00 $22.50Transitional 36 $3,537.00 $98.25Applicant Services 0 $0.00 $0.00Pre-K 0 $0.00 $0.00TANF 0 $0.00 $0.00Transitional 0 $0.00 $0.00Applicant Services 0 $0.00 $0.00Pre-K 8 $325.00 $40.63TANF 0 $0.00 $0.00Transitional 28 $2,054.00 $73.36Applicant Services 3 $420.00 $140.00Pre-K 0 $0.00 $0.00TANF 4 $460.00 $115.00Transitional 4 $360.00 $90.00Applicant Services 0 $0.00 $0.00Pre-K 44 $2,703.00 $61.43TANF 8 $685.00 $85.63Transitional 0 $0.00 $0.00Applicant Services 1 $88.00 $88.00Pre-K 113 $7,984.00 $70.65TANF 4 $220.00 $55.00Transitional 0 $0.00 $0.00Applicant Services 0 $0.00 $0.00Pre-K 44 $3,428.00 $77.91TANF 0 $0.00 $0.00Transitional 0 $0.00 $0.00Applicant Services 0 $0.00 $0.00Pre-K 0 $0.00 $0.00TANF 0 $0.00 $0.00Transitional 12 $1,768.00 $147.33Applicant Services 0 $0.00 $0.00Pre-K 6 $24.00 $4.00TANF 0 $0.00 $0.00Transitional 0 $0.00 $0.00
SUMTER
STEWART
STEPHENS
TALIAFERRO
TALBOT
TREUTLEN
TOWNS
TOOMBS
TIFT
THOMAS
TERRELL
TELFAIR
TAYLOR
TATTNALL

SUBSIDIZED CHILDCAREAnnual Expenditures
State Fiscal Year 2016
38
CountyType of
AssistanceAnnual Clients Annual Funds Average Cost
per ClientApplicant Services 40 $4,112.00 $102.80Pre-K 84 $5,580.00 $66.43TANF 97 $21,919.50 $225.97Transitional 21 $1,745.00 $83.10Applicant Services 0 $0.00 $0.00Pre-K 0 $0.00 $0.00TANF 0 $0.00 $0.00Transitional 0 $0.00 $0.00Applicant Services 0 $0.00 $0.00Pre-K 0 $0.00 $0.00TANF 0 $0.00 $0.00Transitional 0 $0.00 $0.00Applicant Services 0 $0.00 $0.00Pre-K 17 $769.00 $45.24TANF 0 $0.00 $0.00Transitional 66 $9,002.00 $136.39Applicant Services 4 $294.00 $73.50Pre-K 22 $431.00 $19.59TANF 63 $13,938.75 $221.25Transitional 0 $0.00 $0.00Applicant Services 5 $505.00 $101.00Pre-K 29 $2,729.00 $94.10TANF 3 $190.00 $63.33Transitional 0 $0.00 $0.00Applicant Services 22 $3,294.00 $149.73Pre-K 212 $21,209.00 $100.04TANF 0 $0.00 $0.00Transitional 32 $4,349.00 $135.91Applicant Services 0 $0.00 $0.00Pre-K 96 $6,520.00 $67.92TANF 0 $0.00 $0.00Transitional 0 $0.00 $0.00Applicant Services 3 $299.00 $99.67Pre-K 12 $156.00 $13.00TANF 28 $1,800.00 $64.29Transitional 0 $0.00 $0.00Applicant Services 4 $630.00 $157.50Pre-K 4 $186.00 $46.50TANF 10 $590.00 $59.00Transitional 0 $0.00 $0.00Applicant Services 5 $327.00 $65.40Pre-K 27 $2,134.00 $79.04TANF 5 $365.00 $73.00Transitional 81 $7,396.00 $91.31Applicant Services 0 $0.00 $0.00Pre-K 0 $0.00 $0.00Transitional 0 $0.00 $0.00TANF 0 $0.00 $0.00Applicant Services 0 $0.00 $0.00Pre-K 0 $0.00 $0.00TANF 0 $0.00 $0.00Transitional 0 $0.00 $0.00Applicant Services 0 $0.00 $0.00Pre-K 24 $2,318.00 $96.58TANF 0 $0.00 $0.00Transitional 3 $200.00 $66.67
WARE
WALTON
WALKER
UPSON
UNION
TROUP
TWIGGS
TURNER
WHITE
WEBSTER
WAYNE
WASHINGTON
WARREN
WHEELER

SUBSIDIZED CHILDCAREAnnual Expenditures
State Fiscal Year 2016
39
CountyType of
AssistanceAnnual Clients Annual Funds Average Cost
per ClientApplicant Services 0 $0.00 $0.00Pre-K 24 $2,409.00 $100.38TANF 9 $685.00 $76.11Transitional 4 $612.00 $153.00Applicant Services 0 $0.00 $0.00Pre-K 0 $0.00 $0.00TANF 0 $0.00 $0.00Transitional 0 $0.00 $0.00Applicant Services 12 $1,150.00 $95.83Pre-K 0 $0.00 $0.00TANF 7 $620.00 $88.57Transitional 14 $1,514.00 $108.14Applicant Services 0 $0.00 $0.00Pre-K 0 $0.00 $0.00TANF 0 $0.00 $0.00Transitional 4 $513.00 $128.25Applicant Services 1 $83.00 $83.00Pre-K 21 $790.00 $37.62TANF 0 $0.00 $0.00Transitional 0 $0.00 $0.00Applicant Services 12,211 $2,056,779.00 $168.44Pre-K 19,672 $1,877,057.00 $95.42TANF 38,127 $5,656,565.03 $148.36Transitional 42,172 $7,205,619.00 $170.86
STATE
WORTH
WILKINSON
WILKES
WILCOX
WHITFIELD

I. Data On Teen Pregnancy Prevention

TEENAGE PREGNANCY PREVENTION - GEORGIA'S DECLINING PREGNANCYRates for Ages 15-19
2001 thru 2015 Trends
40
County 2000 2001 2002 2003 2004 2005 2006 2007 2008 2009 2010 2011 2012 2013 2014 2015
Appling Total Pregnancies 79 51 56 55 45 45 55 56 56 55 64 49 43 38 32 36Female Population (ages 15-19) 686 647 624 623 593 546 577 594 614 599 563 533 539 548 565 579Rates of Pregnancies per 1,000 115.2 78.8 89.7 88.3 75.9 82.4 95.3 94.3 91.2 91.8 113.7 91.9 79.8 69.3 56.6 62.2
Atkinson Total Pregnancies 42 30 45 23 31 28 28 27 27 33 21 29 21 25 21 25Female Population (ages 15-19) 315 273 269 280 259 276 278 298 310 325 316 294 266 278 287 298Rates of Pregnancies per 1,000 133.3 109.9 167.3 82.1 119.7 101.4 100.7 90.6 87.1 101.5 66.5 98.6 78.9 89.9 73.2 83.9
Bacon Total Pregnancies 43 31 25 20 33 24 36 42 42 36 29 24 36 15 21 15Female Population (ages 15-19) 374 337 330 323 324 323 311 318 328 317 327 336 357 374 394 386Rates of Pregnancies per 1,000 115 92 75.8 61.9 101.9 74.3 115.8 132.1 128 113.6 88.7 71.4 100.8 40.1 53.3 38.9
Baker Total Pregnancies 11 12 10 4 5 3 9 11 1 7 3 8 4 4 2 3Female Population (ages 15-19) 155 161 141 156 152 160 154 147 137 126 109 88 102 105 94 82Rates of Pregnancies per 1,000 71 74.5 70.9 * 32.9 * 58.4 74.8 * 55.6 * 90.9 * * * *
Baldwin Total Pregnancies 124 106 89 123 140 113 133 110 114 102 92 75 80 65 49 45Female Population (ages 15-19) 1,899 2,042 2,097 2,099 2,110 2,182 2,224 2,331 2,438 2,380 2,173 2,050 2,197 2,209 2,297 2,322Rates of Pregnancies per 1,000 65.3 51.9 42.4 58.6 66.4 51.8 59.8 47.2 46.8 42.9 42.3 36.6 36.4 29.4 21.3 19.4
Banks Total Pregnancies 35 38 31 39 40 31 36 36 37 45 27 28 16 28 21 16Female Population (ages 15-19) 480 466 466 457 487 541 561 564 624 641 628 581 598 577 577 592Rates of Pregnancies per 1,000 72.9 81.5 66.5 85.3 82.1 57.3 64.2 63.8 59.3 70.2 43 48.2 26.8 48.5 36.4 27
Barrow Total Pregnancies 138 137 134 115 130 142 125 146 154 133 113 106 118 88 70 74Female Population (ages 15-19) 1,446 1,472 1,513 1,603 1,683 1,848 1,969 2,159 2,290 2,323 2,332 2,225 2,178 2,226 2,248 2,349Rates of Pregnancies per 1,000 95.4 93.1 88.6 71.7 77.2 76.8 63.5 67.6 67.2 57.3 48.5 47.6 54.2 39.5 31.1 31.5
Bartow Total Pregnancies 253 254 226 235 248 250 258 271 236 206 196 215 152 136 145 126Female Population (ages 15-19) 2,433 2,475 2,601 2,798 2,964 3,161 3,308 3,417 3,479 3,452 3,499 3,249 3,267 3,360 3,371 3,392Rates of Pregnancies per 1,000 104 102.6 86.9 84 83.7 79.1 78 79.3 67.8 59.7 56 66.2 46.5 40.5 43 37.1
Ben Hill Total Pregnancies 69 75 68 55 72 80 78 73 69 68 55 55 39 33 36 39Female Population (ages 15-19) 657 639 630 641 625 620 631 595 593 603 583 541 526 531 474 509Rates of Pregnancies per 1,000 105 117.4 107.9 85.8 115.2 129 123.6 122.7 116.4 112.8 94.3 101.7 74.1 62.1 75.9 76.6
Berrien Total Pregnancies 47 44 49 42 53 63 54 54 52 42 41 35 25 27 38 26Female Population (ages 15-19) 541 540 570 605 594 627 644 656 697 690 645 577 534 517 459 548Rates of Pregnancies per 1,000 86.9 81.5 86 69.4 89.2 100.5 83.9 82.3 74.6 60.9 63.6 60.7 46.8 52.2 82.8 47.4
Bibb Total Pregnancies 530 490 478 461 459 474 467 443 504 472 390 371 326 311 315 258Female Population (ages 15-19) 6,207 6,041 5,961 5,925 5,939 6,048 6,039 6,087 6,014 5,983 5,840 5,763 5,506 5,400 5,362 5,273Rates of Pregnancies per 1,000 85.4 81.1 80.2 77.8 77.3 78.4 77.3 72.8 83.8 78.9 66.8 64.4 59.2 57.6 58.7 48.9
Bleckley Total Pregnancies 40 33 26 27 25 21 25 35 32 23 19 26 25 13 19 20Female Population (ages 15-19) 516 512 528 560 602 675 767 900 837 860 853 828 697 677 668 464Rates of Pregnancies per 1,000 77.5 64.5 49.2 48.2 41.5 31.1 32.6 38.9 38.2 26.7 22.3 31.4 35.9 19.2 28.4 43.1

TEENAGE PREGNANCY PREVENTION - GEORGIA'S DECLINING PREGNANCYRates for Ages 15-19
2001 thru 2015 Trends
41
County 2000 2001 2002 2003 2004 2005 2006 2007 2008 2009 2010 2011 2012 2013 2014 2015
Brantley Total Pregnancies 31 15 41 33 44 26 35 47 30 52 44 33 42 38 37 35Female Population (ages 15-19) 525 514 544 584 589 584 592 633 630 627 643 624 601 603 588 607Rates of Pregnancies per 1,000 59 29.2 75.4 56.5 74.7 44.5 59.1 74.2 47.6 82.9 68.4 52.9 69.9 63 62.9 57.7
Brooks Total Pregnancies 56 54 35 41 39 49 48 56 47 41 32 33 35 28 23 18Female Population (ages 15-19) 621 586 575 551 544 543 526 540 562 544 528 455 413 449 377 405Rates of Pregnancies per 1,000 90.2 92.2 60.9 74.4 71.7 90.2 91.3 103.7 83.6 75.4 60.6 72.5 84.7 62.4 61 44.4
Bryan Total Pregnancies 63 56 45 67 47 53 39 53 62 43 45 42 30 37 34 28Female Population (ages 15-19) 929 938 973 951 986 1,054 1,013 1,044 1,081 1,105 1,089 1,079 1,090 1,114 1,131 1,181Rates of Pregnancies per 1,000 67.8 59.7 46.2 70.5 47.7 50.3 38.5 50.8 57.4 38.9 41.3 38.9 27.5 33.2 30.1 23.7
Bulloch Total Pregnancies 170 178 173 146 183 156 203 189 173 173 145 132 122 111 107 99Female Population (ages 15-19) 3,762 3,861 3,813 4,005 3,986 4,224 4,091 4,102 4,029 4,079 4,199 4,642 3,916 3,927 4,075 3,992Rates of Pregnancies per 1,000 45.2 46.1 45.4 36.5 45.9 36.9 49.6 46.1 42.9 42.4 34.5 28.4 31.2 28.3 26.3 24.8
Burke Total Pregnancies 125 115 93 97 78 105 89 82 85 85 73 65 58 51 42 41Female Population (ages 15-19) 943 925 893 869 867 872 853 895 859 859 850 808 800 761 720 723Rates of Pregnancies per 1,000 132.6 124.3 104.1 111.6 90 120.4 104.3 91.6 99 99 85.9 80.4 72.5 67 58.3 56.7
Butts Total Pregnancies 65 78 61 59 57 57 63 51 60 53 46 51 46 34 36 31Female Population (ages 15-19) 630 629 652 623 648 720 737 727 727 715 693 653 669 629 648 652Rates of Pregnancies per 1,000 103.2 124 93.6 94.7 88 79.2 85.5 70.2 82.5 74.1 66.4 78.1 68.8 54.1 55.6 47.5
Calhoun Total Pregnancies 18 29 18 19 28 11 20 19 9 20 8 10 15 7 7 5Female Population (ages 15-19) 208 206 209 209 221 197 194 201 175 184 177 153 142 152 163 160Rates of Pregnancies per 1,000 86.5 140.8 86.1 90.9 126.7 55.8 103.1 94.5 51.4 108.7 45.2 65.4 105.6 46.1 42.9 31.3
Camden Total Pregnancies 100 119 106 112 85 88 103 125 124 102 74 71 84 56 51 44Female Population (ages 15-19) 1,637 1,638 1,741 1,750 1,808 1,866 1,856 1,907 1,898 1,892 1,859 1,738 1,664 1,605 1,559 1,521Rates of Pregnancies per 1,000 61.1 72.6 60.9 64 47 47.2 55.5 65.5 65.3 53.9 39.8 40.9 50.5 34.9 32.7 28.9
Candler Total Pregnancies 31 32 40 44 48 45 39 38 40 25 26 23 18 25 15 12Female Population (ages 15-19) 289 290 314 337 335 350 369 349 345 348 352 397 377 360 353 343Rates of Pregnancies per 1,000 107.3 110.3 127.4 130.6 143.3 128.6 105.7 108.9 115.9 71.8 73.9 57.9 47.7 69.4 42.5 35
Carroll Total Pregnancies 284 290 285 255 255 246 282 299 294 296 260 239 202 201 194 176Female Population (ages 15-19) 3,929 3,741 3,745 3,928 3,959 4,079 4,485 4,791 4,798 4,877 4,813 4,416 4,458 4,560 4,778 4,719Rates of Pregnancies per 1,000 72.3 77.5 76.1 64.9 64.4 60.3 62.9 62.4 61.3 60.7 54 54.1 45.3 44.1 40.6 37.3
Catoosa Total Pregnancies 107 111 110 100 109 98 137 135 137 135 101 91 100 88 73 62Female Population (ages 15-19) 1,691 1,656 1,748 1,807 1,928 2,038 2,116 2,145 2,149 2,155 2,129 2,032 2,028 2,025 1,999 2,038Rates of Pregnancies per 1,000 63.3 67 62.9 55.3 56.5 48.1 64.7 62.9 63.8 62.6 47.4 44.8 49.3 43.5 36.5 30.4
Charlton Total Pregnancies 32 25 24 21 25 12 24 22 29 34 20 21 23 10 11 11Female Population (ages 15-19) 393 388 397 426 450 443 447 422 421 378 379 355 322 304 280 278Rates of Pregnancies per 1,000 81.4 64.4 60.5 49.3 55.6 27.1 53.7 52.1 68.9 89.9 52.8 59.2 71.4 32.9 39.3 39.6

TEENAGE PREGNANCY PREVENTION - GEORGIA'S DECLINING PREGNANCYRates for Ages 15-19
2001 thru 2015 Trends
42
County 2000 2001 2002 2003 2004 2005 2006 2007 2008 2009 2010 2011 2012 2013 2014 2015
Chatham Total Pregnancies 685 725 665 630 678 670 667 698 601 616 533 493 450 387 357 325Female Population (ages 15-19) 8,120 7,938 8,188 8,328 8,507 8,831 9,100 9,372 9,490 9,690 9,654 9,209 9,209 9,083 9,306 9,347Rates of Pregnancies per 1,000 84.4 91.3 81.2 75.6 79.7 75.9 73.3 74.5 63.3 63.6 55.2 53.5 48.9 42.6 38.4 34.8
Chattahoochee Total Pregnancies 35 30 35 23 24 15 12 12 14 17 19 14 11 14 11 8Female Population (ages 15-19) 409 475 526 501 492 373 329 307 274 266 261 247 223 227 198 203Rates of Pregnancies per 1,000 85.6 63.2 66.5 45.9 48.8 40.2 36.5 39.1 51.1 63.9 72.8 56.7 49.3 61.7 55.6 39.4
Chattooga Total Pregnancies 82 88 53 82 46 59 67 82 69 74 52 63 49 35 47 51Female Population (ages 15-19) 737 699 710 736 730 757 762 786 782 759 737 735 736 726 733 741Rates of Pregnancies per 1,000 111.3 125.9 74.6 111.4 63 77.9 87.9 104.3 88.2 97.5 70.6 85.7 66.6 48.2 64.1 68.8
Cherokee Total Pregnancies 285 262 249 225 260 254 306 285 273 248 244 199 179 191 170 128Female Population (ages 15-19) 4,339 4,496 4,773 4,993 5,402 5,789 6,143 6,592 6,761 6,914 6,971 6,990 7,139 7,403 7,657 7,992Rates of Pregnancies per 1,000 65.7 58.3 52.2 45.1 48.1 43.9 49.8 43.2 40.4 35.9 35 28.5 25.1 25.8 22.2 16
Clarke Total Pregnancies 249 249 207 223 216 208 248 239 219 214 184 161 177 145 131 117Female Population (ages 15-19) 6,082 6,065 5,973 6,120 6,871 6,648 6,647 6,664 6,794 6,919 6,780 6,751 7,247 7,076 6,686 7,390Rates of Pregnancies per 1,000 40.9 41.1 34.7 36.4 31.4 31.3 37.3 35.9 32.2 30.9 27.1 23.8 24.4 20.5 19.6 15.8
Clay Total Pregnancies 14 18 15 8 7 14 5 8 8 12 6 7 3 4 0 5Female Population (ages 15-19) 133 113 108 104 115 112 117 124 118 97 91 91 73 63 70 69Rates of Pregnancies per 1,000 105.3 159.3 138.9 76.9 60.9 125 42.7 64.5 67.8 123.7 65.9 76.9 * * 0 72.5
Clayton Total Pregnancies 790 785 770 751 798 873 845 886 920 851 759 603 549 524 461 418Female Population (ages 15-19) 8,387 8,417 8,644 8,855 9,221 9,619 9,996 10,256 10,253 10,073 9,771 9,420 9,757 9,195 9,472 9,766Rates of Pregnancies per 1,000 94.2 93.3 89.1 84.8 86.5 90.8 84.5 86.4 89.7 84.5 77.7 64 56.3 57 48.7 42.8
Clinch Total Pregnancies 31 36 26 29 25 23 21 33 21 23 18 17 20 22 13 11Female Population (ages 15-19) 263 256 240 238 239 247 229 232 209 222 241 231 219 213 222 214Rates of Pregnancies per 1,000 117.9 140.6 108.3 121.8 104.6 93.1 91.7 142.2 100.5 103.6 74.7 73.6 91.3 103.3 58.6 51.4
Cobb Total Pregnancies 1,165 1,101 1,140 1,035 1,131 1,032 1,116 1,164 1,063 936 835 859 755 649 599 560Female Population (ages 15-19) 18,881 19,400 19,822 20,167 20,931 21,617 22,283 22,635 23,196 23,294 23,263 23,268 23,522 23,640 23,817 24,041Rates of Pregnancies per 1,000 61.7 56.8 57.5 51.3 54 47.7 50.1 51.4 45.8 40.2 35.9 36.9 32.1 27.5 25.2 23.3
Coffee Total Pregnancies 140 150 149 124 138 134 160 164 165 125 121 113 99 114 102 83Female Population (ages 15-19) 1,436 1,428 1,407 1,399 1,417 1,468 1,540 1,544 1,603 1,610 1,588 1,509 1,553 1,539 1,456 1,455Rates of Pregnancies per 1,000 97.5 105 105.9 88.6 97.4 91.3 103.9 106.2 102.9 77.6 76.2 74.9 63.7 74.1 70.1 57
Colquitt Total Pregnancies 170 149 154 138 149 123 145 181 161 146 134 114 92 84 82 80Female Population (ages 15-19) 1,591 1,520 1,486 1,466 1,462 1,479 1,570 1,595 1,580 1,560 1,564 1,448 1,418 1,464 1,423 1,433Rates of Pregnancies per 1,000 106.9 98 103.6 94.1 101.9 83.2 92.4 113.5 101.9 93.6 85.7 78.7 64.9 57.4 57.6 55.8
Columbia Total Pregnancies 170 166 150 146 152 153 177 180 189 142 165 125 110 105 73 75Female Population (ages 15-19) 3,441 3,480 3,566 3,664 3,811 3,996 4,216 4,371 4,461 4,571 4,555 4,588 4,630 4,761 4,760 4,875Rates of Pregnancies per 1,000 49.4 47.7 42.1 39.8 39.9 38.3 42 41.2 42.4 31.1 36.2 27.2 23.8 22.1 15.3 15.4

TEENAGE PREGNANCY PREVENTION - GEORGIA'S DECLINING PREGNANCYRates for Ages 15-19
2001 thru 2015 Trends
43
County 2000 2001 2002 2003 2004 2005 2006 2007 2008 2009 2010 2011 2012 2013 2014 2015
Cook Total Pregnancies 53 43 56 42 41 52 61 59 46 41 39 30 33 35 37 32Female Population (ages 15-19) 542 557 573 621 611 647 606 576 572 571 579 544 528 567 582 625Rates of Pregnancies per 1,000 97.8 77.2 97.7 67.6 67.1 80.4 100.7 102.4 80.4 71.8 67.4 55.1 62.5 61.7 63.6 51.2
Coweta Total Pregnancies 206 185 175 181 197 190 230 217 249 184 173 182 156 140 136 137Female Population (ages 15-19) 2,864 2,863 3,020 3,158 3,366 3,562 3,744 3,881 4,084 4,209 4,280 4,332 4,356 4,482 4,593 4,779Rates of Pregnancies per 1,000 71.9 64.6 57.9 57.3 58.5 53.3 61.4 55.9 61 43.7 40.4 42 35.8 31.2 29.6 28.7
Crawford Total Pregnancies 18 26 25 28 29 16 15 23 21 25 27 17 26 14 10 9Female Population (ages 15-19) 420 425 449 451 443 455 469 440 438 397 405 365 350 325 316 313Rates of Pregnancies per 1,000 42.9 61.2 55.7 62.1 65.5 35.2 32 52.3 47.9 63 66.7 46.6 74.3 43.1 31.6 28.8
Crisp Total Pregnancies 96 92 90 66 90 90 85 99 106 75 71 69 48 59 45 42Female Population (ages 15-19) 847 821 806 784 775 817 832 871 875 856 825 835 816 745 723 697Rates of Pregnancies per 1,000 113.3 112.1 111.7 84.2 116.1 110.2 102.2 113.7 121.1 87.6 86.1 82.6 58.8 79.2 62.2 60.3
Dade Total Pregnancies 30 32 30 26 17 25 32 23 22 31 24 21 21 20 11 19Female Population (ages 15-19) 680 703 703 706 694 724 737 747 731 716 704 680 667 648 612 591Rates of Pregnancies per 1,000 44.1 45.5 42.7 36.8 24.5 34.5 43.4 30.8 30.1 43.3 34.1 30.9 31.5 30.9 18 32.1
Dawson Total Pregnancies 39 37 30 31 39 38 27 35 41 30 27 27 16 27 18 25Female Population (ages 15-19) 428 502 526 554 597 661 659 697 686 667 630 625 630 645 659 690Rates of Pregnancies per 1,000 91.1 73.7 57 56 65.3 57.5 41 50.2 59.8 45 42.9 43.2 25.4 41.9 27.3 36.2
Decatur Total Pregnancies 106 91 78 69 93 70 105 107 95 89 80 64 74 50 59 61Female Population (ages 15-19) 1,057 1,032 1,037 1,026 1,012 1,016 1,043 1,020 1,004 975 971 924 927 913 909 879Rates of Pregnancies per 1,000 100.3 88.2 75.2 67.3 91.9 68.9 100.7 104.9 94.6 91.3 82.4 69.3 79.8 54.8 64.9 69.4
DeKalb Total Pregnancies 1,837 1,763 1,626 1,640 1,622 1,650 1,583 1,640 1,687 1,598 1,447 1,304 1,119 948 898 841Female Population (ages 15-19) 21,253 20,841 20,726 20,862 21,060 21,972 22,566 22,549 22,633 22,349 21,786 21,247 21,145 20,636 20,795 20,959Rates of Pregnancies per 1,000 86.4 84.6 78.5 78.6 77 75.1 70.1 72.7 74.5 71.5 66.4 61.4 52.9 45.9 43.2 40.1
Dodge Total Pregnancies 59 57 58 56 43 51 55 61 73 62 67 50 60 39 35 38Female Population (ages 15-19) 641 632 629 647 665 704 705 724 751 712 709 669 646 574 542 525Rates of Pregnancies per 1,000 92 90.2 92.2 86.6 64.7 72.4 78 84.3 97.2 87.1 94.5 74.7 92.9 67.9 64.6 72.4
Dooly Total Pregnancies 59 53 54 35 30 37 34 37 33 27 36 26 25 16 19 11Female Population (ages 15-19) 432 434 430 397 393 426 450 458 469 462 461 408 355 345 341 335Rates of Pregnancies per 1,000 136.6 122.1 125.6 88.2 76.3 86.9 75.6 80.8 70.4 58.4 78.1 63.7 70.4 46.4 55.7 32.8
Dougherty Total Pregnancies 365 364 303 345 320 348 384 369 341 340 318 282 254 219 214 159Female Population (ages 15-19) 4,196 4,066 3,944 3,911 3,894 4,048 4,129 4,149 4,111 4,092 3,955 3,686 3,637 3,566 3,567 3,586Rates of Pregnancies per 1,000 87 89.5 76.8 88.2 82.2 86 93 88.9 82.9 83.1 80.4 76.5 69.8 61.4 60 44.3
Douglas Total Pregnancies 249 236 216 229 239 219 264 282 284 298 239 232 214 192 166 172Female Population (ages 15-19) 3,261 3,245 3,305 3,480 3,635 3,905 4,276 4,600 4,883 5,064 5,046 4,947 4,907 4,841 4,925 5,094Rates of Pregnancies per 1,000 76.4 72.7 65.4 65.8 65.7 56.1 61.7 61.3 58.2 58.8 47.4 46.9 43.6 39.7 33.7 33.8

TEENAGE PREGNANCY PREVENTION - GEORGIA'S DECLINING PREGNANCYRates for Ages 15-19
2001 thru 2015 Trends
44
County 2000 2001 2002 2003 2004 2005 2006 2007 2008 2009 2010 2011 2012 2013 2014 2015
Early Total Pregnancies 28 42 47 44 42 31 36 33 41 45 30 22 22 20 19 17Female Population (ages 15-19) 471 482 451 465 456 446 443 456 436 426 420 360 354 365 357 363Rates of Pregnancies per 1,000 59.4 87.1 104.2 94.6 92.1 69.5 81.3 72.4 94 105.6 71.4 61.1 62.1 54.8 53.2 46.8
Echols Total Pregnancies 10 12 9 15 15 12 8 23 13 10 18 7 11 7 3 5Female Population (ages 15-19) 158 159 154 153 158 172 144 160 155 163 147 132 109 115 118 126Rates of Pregnancies per 1,000 63.3 75.5 58.4 98 94.9 69.8 55.6 143.8 83.9 61.3 122.4 53 100.9 60.9 * 39.7
Effingham Total Pregnancies 108 90 105 81 104 85 87 91 105 109 77 72 82 74 56 58Female Population (ages 15-19) 1,460 1,499 1,527 1,574 1,579 1,766 1,850 1,987 2,067 2,101 2,067 1,942 1,881 1,907 1,915 2,024Rates of Pregnancies per 1,000 74 60 68.8 51.5 65.9 48.1 47 45.8 50.8 51.9 37.3 37.1 43.6 38.8 29.2 28.7
Elbert Total Pregnancies 51 42 57 41 53 40 61 50 55 47 46 42 37 33 23 25Female Population (ages 15-19) 716 736 758 749 730 741 734 730 735 701 661 614 585 565 565 568Rates of Pregnancies per 1,000 71.2 57.1 75.2 54.7 72.6 54 83.1 68.5 74.8 67 69.6 68.4 63.2 58.4 40.7 44
Emanuel Total Pregnancies 92 87 85 92 86 83 78 105 71 74 66 62 64 58 53 37Female Population (ages 15-19) 1,003 935 937 932 895 905 887 854 860 793 790 728 680 676 681 675Rates of Pregnancies per 1,000 91.7 93 90.7 98.7 96.1 91.7 87.9 123 82.6 93.3 83.5 85.2 94.1 85.8 77.8 54.8
Evans Total Pregnancies 45 37 36 45 50 45 36 52 39 37 31 29 32 22 17 19Female Population (ages 15-19) 419 412 416 412 395 393 393 405 403 379 348 329 293 291 293 303Rates of Pregnancies per 1,000 107.4 89.8 86.5 109.2 126.6 114.5 91.6 128.4 96.8 97.6 89.1 88.1 109.2 75.6 58 62.7
Fannin Total Pregnancies 42 51 36 36 40 45 46 46 31 41 29 26 32 17 28 17Female Population (ages 15-19) 550 585 608 626 649 649 634 637 610 593 573 544 577 566 558 584Rates of Pregnancies per 1,000 76.4 87.2 59.2 57.5 61.6 69.3 72.6 72.2 50.8 69.1 50.6 47.8 55.5 30 50.2 29.1
Fayette Total Pregnancies 99 83 103 100 107 126 98 123 78 106 90 76 74 53 48 41Female Population (ages 15-19) 3,535 3,818 4,017 4,118 4,186 4,254 4,377 4,422 4,414 4,383 4,353 4,603 4,544 4,514 4,413 4,409Rates of Pregnancies per 1,000 28 21.7 25.6 24.3 25.6 29.6 22.4 27.8 17.7 24.2 20.7 16.5 16.3 11.7 10.9 9.3
Floyd Total Pregnancies 285 281 249 261 257 224 297 259 230 254 191 165 143 157 126 122Female Population (ages 15-19) 3,282 3,250 3,315 3,389 3,457 3,605 3,705 3,730 3,795 3,806 3,772 3,591 3,658 3,668 3,707 3,736Rates of Pregnancies per 1,000 86.8 86.5 75.1 77 74.3 62.1 80.2 69.4 60.6 66.7 50.6 45.9 39.1 42.8 34 32.7
Forsyth Total Pregnancies 150 123 116 156 143 171 172 150 122 143 121 126 95 79 80 69Female Population (ages 15-19) 2,463 2,607 2,861 3,158 3,522 3,834 4,238 4,525 4,899 5,065 5,270 5,714 6,159 6,705 7,232 7,673Rates of Pregnancies per 1,000 60.9 47.2 40.5 49.4 40.6 44.6 40.6 33.1 24.9 28.2 23 22.1 15.4 11.8 11.1 9
Franklin Total Pregnancies 48 53 47 44 50 46 55 53 62 70 39 37 47 31 26 28Female Population (ages 15-19) 758 759 761 743 734 749 811 795 793 739 725 691 711 704 727 749Rates of Pregnancies per 1,000 63.3 69.8 61.8 59.2 68.1 61.4 67.8 66.7 78.2 94.7 53.8 53.5 66.1 44 35.8 37.4
Fulton Total Pregnancies 2,608 2,338 2,242 2,028 1,800 1,849 1,831 1,944 2,058 1,941 1,870 1,776 1,419 1,315 1,166 1,123Female Population (ages 15-19) 26,774 26,774 26,767 27,058 27,184 27,642 28,517 29,652 30,480 31,056 31,162 32,615 33,747 33,311 32,822 33,669Rates of Pregnancies per 1,000 97.4 87.3 83.8 75 66.2 66.9 64.2 65.6 67.5 62.5 60 54.5 42 39.5 35.5 33.4

TEENAGE PREGNANCY PREVENTION - GEORGIA'S DECLINING PREGNANCYRates for Ages 15-19
2001 thru 2015 Trends
45
County 2000 2001 2002 2003 2004 2005 2006 2007 2008 2009 2010 2011 2012 2013 2014 2015
Gilmer Total Pregnancies 75 59 78 78 72 77 67 84 51 56 53 38 37 52 42 39Female Population (ages 15-19) 696 721 732 730 763 770 770 761 798 806 803 773 752 750 766 852Rates of Pregnancies per 1,000 107.8 81.8 106.6 106.8 94.4 100 87 110.4 63.9 69.5 66 49.2 49.2 69.3 54.8 45.8
Glascock Total Pregnancies 3 10 2 4 3 4 0 7 6 2 4 6 6 2 4 3Female Population (ages 15-19) 91 83 75 78 87 99 98 104 101 99 102 94 102 113 115 116Rates of Pregnancies per 1,000 * 120.5 * * * * 0 67.3 59.4 * * 63.8 58.8 * * *
Glynn Total Pregnancies 165 163 156 175 164 172 205 216 177 194 187 161 130 133 102 103Female Population (ages 15-19) 2,368 2,343 2,362 2,422 2,511 2,558 2,596 2,688 2,676 2,687 2,653 2,581 2,463 2,411 2,340 2,385Rates of Pregnancies per 1,000 69.7 69.6 66 72.3 65.3 67.2 79 80.4 66.1 72.2 70.5 62.4 52.8 55.2 43.6 43.2
Gordon Total Pregnancies 156 170 150 162 154 162 165 165 146 115 96 124 85 90 88 71Female Population (ages 15-19) 1,477 1,460 1,490 1,535 1,629 1,713 1,824 1,871 2,011 2,078 2,073 1,946 1,895 1,847 1,860 1,922Rates of Pregnancies per 1,000 105.6 116.4 100.7 105.5 94.5 94.6 90.5 88.2 72.6 55.3 46.3 63.7 44.9 48.7 47.3 36.9
Grady Total Pregnancies 94 89 80 93 98 82 102 83 87 67 67 64 48 55 32 41Female Population (ages 15-19) 888 856 874 875 871 843 882 884 854 849 817 791 810 788 787 784Rates of Pregnancies per 1,000 105.9 104 91.5 106.3 112.5 97.3 115.6 93.9 101.9 78.9 82 80.9 59.3 69.8 40.7 52.3
Greene Total Pregnancies 54 53 44 37 33 33 37 29 30 30 26 18 17 21 20 16Female Population (ages 15-19) 553 538 532 510 490 478 461 434 431 413 405 400 376 381 365 334Rates of Pregnancies per 1,000 97.6 98.5 82.7 72.5 67.3 69 80.3 66.8 69.6 72.6 64.2 45 45.2 55.1 54.8 47.9
Gwinnett Total Pregnancies 1,062 1,161 1,222 1,265 1,327 1,408 1,547 1,440 1,449 1,236 1,122 1,022 943 889 852 795Female Population (ages 15-19) 19,119 20,149 20,696 21,561 22,566 23,829 25,205 26,504 27,456 28,133 28,607 29,312 30,167 31,098 31,595 32,396Rates of Pregnancies per 1,000 55.5 57.6 59 58.7 58.8 59.1 61.4 54.3 52.8 43.9 39.2 34.9 31.3 28.6 27 24.5
Habersham Total Pregnancies 124 94 99 99 101 87 85 91 101 90 75 58 50 57 52 48Female Population (ages 15-19) 1,133 1,144 1,163 1,172 1,212 1,227 1,270 1,313 1,344 1,317 1,303 1,296 1,335 1,387 1,453 1,459Rates of Pregnancies per 1,000 109.4 82.2 85.1 84.5 83.3 70.9 66.9 69.3 75.1 68.3 57.6 44.8 37.5 41.1 35.8 32.9
Hall Total Pregnancies 438 445 448 449 430 445 434 437 437 371 349 348 300 244 266 258Female Population (ages 15-19) 4,688 4,762 4,868 5,010 5,135 5,311 5,458 5,767 5,969 6,058 6,096 6,040 6,034 6,073 6,163 6,438Rates of Pregnancies per 1,000 93.4 93.4 92 89.6 83.7 83.8 79.5 75.8 73.2 61.2 57.3 57.6 49.7 40.2 43.2 40.1
Hancock Total Pregnancies 36 39 23 33 34 30 26 31 21 19 13 18 12 15 13 7Female Population (ages 15-19) 348 339 339 335 332 350 342 349 337 320 310 294 266 227 203 166Rates of Pregnancies per 1,000 103.4 115 67.8 98.5 102.4 85.7 76 88.8 62.3 59.4 41.9 61.2 45.1 66.1 64 42.2
Haralson Total Pregnancies 83 76 81 72 73 55 72 69 65 65 59 74 50 41 49 49Female Population (ages 15-19) 859 810 844 851 897 956 978 968 978 936 922 877 892 944 957 968Rates of Pregnancies per 1,000 96.6 93.8 96 84.6 81.4 57.5 73.6 71.3 66.5 69.4 64 84.4 56.1 43.4 51.2 50.6
Harris Total Pregnancies 52 40 32 49 35 32 50 41 33 56 36 45 21 26 27 19Female Population (ages 15-19) 804 832 830 915 930 971 1,046 1,103 1,120 1,138 1,091 1,010 1,039 1,019 1,037 1,070Rates of Pregnancies per 1,000 64.7 48.1 38.6 53.6 37.6 33 47.8 37.2 29.5 49.2 33 44.6 20.2 25.5 26 17.8

TEENAGE PREGNANCY PREVENTION - GEORGIA'S DECLINING PREGNANCYRates for Ages 15-19
2001 thru 2015 Trends
46
County 2000 2001 2002 2003 2004 2005 2006 2007 2008 2009 2010 2011 2012 2013 2014 2015
Hart Total Pregnancies 44 47 41 61 44 32 37 43 66 59 32 32 41 32 38 32Female Population (ages 15-19) 649 638 660 703 689 720 704 762 763 772 738 712 695 693 688 712Rates of Pregnancies per 1,000 67.8 73.7 62.1 86.8 63.9 44.4 52.6 56.4 86.5 76.4 43.4 44.9 59 46.2 55.2 44.9
Heard Total Pregnancies 36 28 25 25 19 21 34 32 35 36 24 36 28 31 11 13Female Population (ages 15-19) 355 336 369 347 376 386 412 406 447 438 439 396 389 381 382 380Rates of Pregnancies per 1,000 101.4 83.3 67.8 72 50.5 54.4 82.5 78.8 78.3 82.2 54.7 90.9 72 81.4 28.8 34.2
Henry Total Pregnancies 259 253 265 311 299 329 352 330 387 380 355 279 254 237 258 233Female Population (ages 15-19) 3,866 4,236 4,632 5,046 5,529 6,038 6,677 7,285 7,738 8,123 8,262 8,318 8,428 8,475 8,539 8,830Rates of Pregnancies per 1,000 67 59.7 57.2 61.6 54.1 54.5 52.7 45.3 50 46.8 43 33.5 30.1 28 30.2 26.4
Houston Total Pregnancies 280 296 301 276 283 311 324 313 280 279 250 246 212 189 161 154Female Population (ages 15-19) 4,309 4,242 4,397 4,549 4,640 4,690 4,772 4,796 4,906 4,895 4,970 4,992 4,810 4,865 4,774 4,753Rates of Pregnancies per 1,000 65 69.8 68.5 60.7 61 66.3 67.9 65.3 57.1 57 50.3 49.3 44.1 38.8 33.7 32.4
Irwin Total Pregnancies 39 23 26 33 27 23 24 29 16 15 16 16 21 11 11 8Female Population (ages 15-19) 380 380 381 342 334 342 325 320 303 301 296 263 264 278 237 289Rates of Pregnancies per 1,000 102.6 60.5 68.2 96.5 80.8 67.3 73.8 90.6 52.8 49.8 54.1 60.8 79.5 39.6 46.4 27.7
Jackson Total Pregnancies 135 117 119 131 123 110 105 115 119 93 87 87 83 77 61 69Female Population (ages 15-19) 1,389 1,300 1,354 1,385 1,449 1,587 1,691 1,838 1,939 1,970 2,001 1,937 1,835 1,892 1,903 2,010Rates of Pregnancies per 1,000 97.2 90 87.9 94.6 84.9 69.3 62.1 62.6 61.4 47.2 43.5 44.9 45.2 40.7 32.1 34.3
Jasper Total Pregnancies 42 37 33 33 25 33 36 43 38 38 30 23 20 15 15 18Female Population (ages 15-19) 406 403 398 441 461 489 475 478 468 469 448 423 412 395 402 414Rates of Pregnancies per 1,000 103.4 91.8 82.9 74.8 54.2 67.5 75.8 90 81.2 81 67 54.4 48.5 38 37.3 43.5
Jeff Davis Total Pregnancies 57 52 49 47 50 49 42 43 52 51 49 38 33 30 35 31Female Population (ages 15-19) 473 428 456 453 477 501 495 496 519 509 510 485 446 466 459 509Rates of Pregnancies per 1,000 120.5 121.5 107.5 103.8 104.8 97.8 84.8 86.7 100.2 100.2 96.1 78.4 74 64.4 76.3 60.9
Jefferson Total Pregnancies 50 75 74 65 46 52 58 71 66 55 38 43 39 35 28 28Female Population (ages 15-19) 657 657 650 638 624 657 600 604 591 567 552 526 533 507 484 484Rates of Pregnancies per 1,000 76.1 114.2 113.8 101.9 73.7 79.1 96.7 117.5 111.7 97 68.8 81.7 73.2 69 57.9 57.9
Jenkins Total Pregnancies 28 35 39 30 33 32 29 20 33 24 21 24 10 16 20 15Female Population (ages 15-19) 350 336 332 326 316 305 310 317 314 311 308 259 259 265 248 247Rates of Pregnancies per 1,000 80 104.2 117.5 92 104.4 104.9 93.5 63.1 105.1 77.2 68.2 92.7 38.6 60.4 80.6 60.7
Johnson Total Pregnancies 28 34 23 24 33 18 15 19 21 16 17 15 13 11 16 7Female Population (ages 15-19) 309 294 294 279 280 267 264 250 258 250 247 251 279 280 277 275Rates of Pregnancies per 1,000 90.6 115.6 78.2 86 117.9 67.4 56.8 76 81.4 64 68.8 59.8 46.6 39.3 57.8 25.5
Jones Total Pregnancies 51 49 45 49 44 56 38 57 53 53 42 41 37 30 29 36Female Population (ages 15-19) 881 882 881 896 910 984 1,047 1,030 1,064 1,039 991 945 942 956 972 999Rates of Pregnancies per 1,000 57.9 55.6 51.1 54.7 48.4 56.9 36.3 55.3 49.8 51 42.4 43.4 39.3 31.4 29.8 36

TEENAGE PREGNANCY PREVENTION - GEORGIA'S DECLINING PREGNANCYRates for Ages 15-19
2001 thru 2015 Trends
47
County 2000 2001 2002 2003 2004 2005 2006 2007 2008 2009 2010 2011 2012 2013 2014 2015
Lamar Total Pregnancies 41 44 29 34 47 48 34 49 52 62 36 36 41 23 25 16Female Population (ages 15-19) 726 774 665 716 753 896 934 980 1,049 1,039 1,020 965 907 911 976 933Rates of Pregnancies per 1,000 56.5 56.8 43.6 47.5 62.4 53.6 36.4 50 49.6 59.7 35.3 37.3 45.2 25.2 25.6 17.1
Lanier Total Pregnancies 26 22 21 18 22 18 21 28 22 12 19 16 13 13 18 14Female Population (ages 15-19) 271 272 272 271 260 285 293 292 303 313 305 307 261 214 257 245Rates of Pregnancies per 1,000 95.9 80.9 77.2 66.4 84.6 63.2 71.7 95.9 72.6 38.3 62.3 52.1 49.8 60.7 70 57.1
Laurens Total Pregnancies 133 152 135 121 114 118 129 146 129 107 138 111 97 79 77 73Female Population (ages 15-19) 1,646 1,609 1,610 1,652 1,651 1,696 1,689 1,743 1,733 1,769 1,726 1,620 1,554 1,486 1,497 1,485Rates of Pregnancies per 1,000 80.8 94.5 83.9 73.2 69 69.6 76.4 83.8 74.4 60.5 80 68.5 62.4 53.2 51.4 49.2
Lee Total Pregnancies 47 48 36 36 40 46 50 49 65 59 41 34 38 28 32 23Female Population (ages 15-19) 1,025 982 1,007 993 1,002 1,006 1,075 1,107 1,149 1,127 1,077 1,049 1,030 1,029 1,034 1,038Rates of Pregnancies per 1,000 45.9 48.9 35.7 36.3 39.9 45.7 46.5 44.3 56.6 52.4 38.1 32.4 36.9 27.2 30.9 22.2
Liberty Total Pregnancies 268 247 221 198 210 193 189 256 220 216 188 162 140 115 109 115Female Population (ages 15-19) 2,306 2,254 2,306 2,236 2,311 2,443 2,336 2,471 2,420 2,480 2,315 2,160 2,000 1,766 1,731 1,630Rates of Pregnancies per 1,000 116.2 109.6 95.8 88.6 90.9 79 80.9 103.6 90.9 87.1 81.2 75 70 65.1 63 70.6
Lincoln Total Pregnancies 20 18 18 19 20 11 18 29 13 11 14 8 11 6 13 10Female Population (ages 15-19) 268 283 272 276 283 302 308 311 306 267 256 228 211 197 196 207Rates of Pregnancies per 1,000 74.6 63.6 66.2 68.8 70.7 36.4 58.4 93.2 42.5 41.2 54.7 35.1 52.1 30.5 66.3 48.3
Long Total Pregnancies 39 42 30 20 34 30 16 18 22 21 19 33 29 24 21 23Female Population (ages 15-19) 478 423 438 418 421 453 462 441 456 520 555 554 572 604 597 579Rates of Pregnancies per 1,000 81.6 99.3 68.5 47.8 80.8 66.2 34.6 40.8 48.2 40.4 34.2 59.6 50.7 39.7 35.2 39.7
Lowndes Total Pregnancies 229 237 217 252 246 235 268 286 279 252 245 194 164 160 138 119Female Population (ages 15-19) 3,848 4,096 4,230 4,300 4,533 4,694 4,767 4,881 5,023 5,145 5,177 5,242 5,297 4,808 4,918 4,519Rates of Pregnancies per 1,000 59.5 57.9 51.3 58.6 54.3 50.1 56.2 58.6 55.5 49 47.3 37 31 33.3 28.1 26.3
Lumpkin Total Pregnancies 65 41 36 38 47 53 45 32 47 52 31 44 22 29 28 18Female Population (ages 15-19) 1,110 1,078 1,118 1,192 1,207 1,260 1,310 1,338 1,361 1,390 1,334 1,239 1,435 1,495 1,498 1,541Rates of Pregnancies per 1,000 58.6 38 32.2 31.9 38.9 42.1 34.4 23.9 34.5 37.4 23.2 35.5 15.3 19.4 18.7 11.7
Macon Total Pregnancies 64 44 42 50 38 35 41 33 36 38 34 34 21 26 25 20Female Population (ages 15-19) 527 528 513 524 520 508 509 515 503 511 500 447 422 384 389 386Rates of Pregnancies per 1,000 121.4 83.3 81.9 95.4 73.1 68.9 80.6 64.1 71.6 74.4 68 76.1 49.8 67.7 64.3 51.8
Madison Total Pregnancies 70 58 74 58 67 67 64 57 46 67 51 52 38 51 35 31Female Population (ages 15-19) 841 829 848 904 925 987 1,015 1,034 1,030 1,009 983 952 919 898 887 907Rates of Pregnancies per 1,000 83.2 70 87.3 64.2 72.4 67.9 63.1 55.1 44.7 66.4 51.9 54.6 41.3 56.8 39.5 34.2
Marion Total Pregnancies 22 28 20 21 30 26 21 21 30 36 21 19 17 10 10 13Female Population (ages 15-19) 245 258 276 271 274 271 282 325 329 318 320 275 268 242 233 246Rates of Pregnancies per 1,000 89.8 108.5 72.5 77.5 109.5 95.9 74.5 64.6 91.2 113.2 65.6 69.1 63.4 41.3 42.9 52.8

TEENAGE PREGNANCY PREVENTION - GEORGIA'S DECLINING PREGNANCYRates for Ages 15-19
2001 thru 2015 Trends
48
County 2000 2001 2002 2003 2004 2005 2006 2007 2008 2009 2010 2011 2012 2013 2014 2015
McDuffie Total Pregnancies 82 79 72 76 77 90 77 74 74 76 53 48 47 46 37 19Female Population (ages 15-19) 782 809 805 809 801 826 834 823 833 831 772 722 689 645 662 715Rates of Pregnancies per 1,000 104.9 97.7 89.4 93.9 96.1 109 92.3 89.9 88.8 91.5 68.7 66.5 68.2 71.3 55.9 26.6
McIntosh Total Pregnancies 40 30 34 21 25 23 34 29 28 34 31 25 21 15 16 13Female Population (ages 15-19) 341 365 349 338 379 407 464 448 506 497 489 446 399 369 363 327Rates of Pregnancies per 1,000 117.3 82.2 97.4 62.1 66 56.5 73.3 64.7 55.3 68.4 63.4 56.1 52.6 40.7 44.1 39.8
Meriwether Total Pregnancies 80 85 79 68 65 65 69 59 75 73 52 34 39 36 28 31Female Population (ages 15-19) 798 801 783 797 829 843 826 810 798 790 708 639 591 594 630 636Rates of Pregnancies per 1,000 100.3 106.1 100.9 85.3 78.4 77.1 83.5 72.8 94 92.4 73.4 53.2 66 60.6 44.4 48.7
Miller Total Pregnancies 20 18 14 19 5 7 21 11 13 7 20 10 11 6 6 5Female Population (ages 15-19) 235 230 247 220 230 221 210 196 203 183 191 196 177 150 162 175Rates of Pregnancies per 1,000 85.1 78.3 56.7 86.4 21.7 31.7 100 56.1 64 38.3 104.7 51 62.1 40 37 28.6
Mitchell Total Pregnancies 94 81 67 54 68 69 72 85 97 65 58 36 40 47 46 36Female Population (ages 15-19) 887 861 800 779 757 755 774 799 784 739 723 675 633 634 670 674Rates of Pregnancies per 1,000 106 94.1 83.8 69.3 89.8 91.4 93 106.4 123.7 88 80.2 53.3 63.2 74.1 68.7 53.4
Monroe Total Pregnancies 73 55 54 50 49 43 41 49 48 48 36 45 31 20 26 24Female Population (ages 15-19) 743 733 808 821 808 852 847 829 852 845 830 787 782 782 758 751Rates of Pregnancies per 1,000 98.3 75 66.8 60.9 60.6 50.5 48.4 59.1 56.3 56.8 43.4 57.2 39.6 25.6 34.3 32
Montgomery Total Pregnancies 33 28 19 26 22 15 15 20 18 25 17 18 17 11 13 9Female Population (ages 15-19) 327 362 334 362 365 380 353 359 354 354 343 336 316 317 311 298Rates of Pregnancies per 1,000 100.9 77.3 56.9 71.8 60.3 39.5 42.5 55.7 50.8 70.6 49.6 53.6 53.8 34.7 41.8 30.2
Morgan Total Pregnancies 43 34 30 30 39 27 30 36 36 32 38 22 22 22 18 18Female Population (ages 15-19) 515 497 465 477 510 548 582 629 648 656 616 602 574 545 554 577Rates of Pregnancies per 1,000 83.5 68.4 64.5 62.9 76.5 49.3 51.5 57.2 55.6 48.8 61.7 36.5 38.3 40.4 32.5 31.2
Murray Total Pregnancies 126 131 129 131 131 145 140 139 127 117 100 90 74 102 71 60Female Population (ages 15-19) 1,254 1,262 1,252 1,273 1,340 1,396 1,445 1,423 1,448 1,431 1,412 1,338 1,280 1,310 1,306 1,311Rates of Pregnancies per 1,000 100.5 103.8 103 102.9 97.8 103.9 96.9 97.7 87.7 81.8 70.8 67.3 57.8 77.9 54.4 45.8
Muscogee Total Pregnancies 732 697 637 633 620 518 642 633 687 659 577 474 432 343 326 315Female Population (ages 15-19) 6,787 6,543 6,316 6,232 6,298 6,484 6,791 6,846 6,888 7,069 7,049 6,620 6,837 6,748 6,215 6,014Rates of Pregnancies per 1,000 107.9 106.5 100.9 101.6 98.4 79.9 94.5 92.5 99.7 93.2 81.9 71.6 63.2 50.8 52.5 52.4
Newton Total Pregnancies 170 195 190 195 213 203 227 259 266 251 239 215 163 173 146 149Female Population (ages 15-19) 2,136 2,231 2,405 2,652 2,893 3,130 3,435 3,743 3,910 3,949 3,977 3,974 4,015 3,897 4,021 4,055Rates of Pregnancies per 1,000 79.6 87.4 79 73.5 73.6 64.9 66.1 69.2 68 63.6 60.1 54.1 40.6 44.4 36.3 36.7
Oconee Total Pregnancies 34 24 27 42 22 22 32 24 24 34 28 22 13 17 11 6Female Population (ages 15-19) 945 992 1,036 1,109 1,151 1,170 1,188 1,189 1,221 1,250 1,253 1,253 1,281 1,299 1,320 1,385Rates of Pregnancies per 1,000 36 24.2 26.1 37.9 19.1 18.8 26.9 20.2 19.7 27.2 22.3 17.6 10.1 13.1 8.3 4.3

TEENAGE PREGNANCY PREVENTION - GEORGIA'S DECLINING PREGNANCYRates for Ages 15-19
2001 thru 2015 Trends
49
County 2000 2001 2002 2003 2004 2005 2006 2007 2008 2009 2010 2011 2012 2013 2014 2015
Oglethorpe Total Pregnancies 30 38 27 23 28 38 22 24 21 24 23 15 25 21 14 17Female Population (ages 15-19) 400 400 392 380 414 434 459 457 476 483 510 480 443 423 430 416Rates of Pregnancies per 1,000 75 95 68.9 60.5 67.6 87.6 47.9 52.5 44.1 49.7 45.1 31.3 56.4 49.6 32.6 40.9
Paulding Total Pregnancies 157 162 171 170 158 167 189 219 226 172 165 165 139 147 115 133Female Population (ages 15-19) 2,444 2,582 2,823 3,077 3,390 3,792 4,146 4,612 4,883 5,091 5,220 5,163 5,319 5,344 5,460 5,643Rates of Pregnancies per 1,000 64.2 62.7 60.6 55.2 46.6 44 45.6 47.5 46.3 33.8 31.6 32 26.1 27.5 21.1 23.6
Peach Total Pregnancies 89 94 81 76 58 66 79 66 69 76 76 53 64 41 33 27Female Population (ages 15-19) 1,032 1,068 1,058 1,082 1,111 1,116 1,218 1,437 1,574 1,647 1,614 1,526 1,414 1,284 1,228 1,133Rates of Pregnancies per 1,000 86.2 88 76.6 70.2 52.2 59.1 64.9 45.9 43.8 46.1 47.1 34.7 45.3 31.9 26.9 23.8
Pickens Total Pregnancies 63 64 52 57 55 46 68 73 51 43 47 43 37 30 45 43Female Population (ages 15-19) 744 709 737 799 852 882 896 906 853 837 858 805 799 822 827 842Rates of Pregnancies per 1,000 84.7 90.3 70.6 71.3 64.6 52.2 75.9 80.6 59.8 51.4 54.8 53.4 46.3 36.5 54.4 51.1
Pierce Total Pregnancies 54 51 50 44 59 54 44 54 45 43 43 45 24 30 36 34Female Population (ages 15-19) 557 568 562 578 547 572 576 601 575 583 621 590 538 579 596 626Rates of Pregnancies per 1,000 96.9 89.8 89 76.1 107.9 94.4 76.4 89.9 78.3 73.8 69.2 76.3 44.6 51.8 60.4 54.3
Pike Total Pregnancies 30 31 36 25 30 30 25 25 33 37 24 22 24 25 19 11Female Population (ages 15-19) 454 462 516 544 569 600 605 610 630 662 682 643 643 661 655 691Rates of Pregnancies per 1,000 66.1 67.1 69.8 46 52.7 50 41.3 41 52.4 55.9 35.2 34.2 37.3 37.8 29 15.9
Polk Total Pregnancies 154 146 150 134 123 120 112 148 143 95 83 94 87 55 70 70Female Population (ages 15-19) 1,335 1,309 1,253 1,256 1,306 1,292 1,299 1,312 1,310 1,305 1,277 1,214 1,195 1,220 1,234 1,297Rates of Pregnancies per 1,000 115.4 111.5 119.7 106.7 94.2 92.9 86.2 112.8 109.2 72.8 65 77.4 72.8 45.1 56.7 54
Pulaski Total Pregnancies 24 30 26 18 15 22 18 30 16 21 19 8 16 12 9 17Female Population (ages 15-19) 323 309 324 310 330 327 334 347 353 357 338 329 318 318 310 288Rates of Pregnancies per 1,000 74.3 97.1 80.2 58.1 45.5 67.3 53.9 86.5 45.3 58.8 56.2 24.3 50.3 37.7 29 59
Putnam Total Pregnancies 63 49 31 51 53 65 54 41 41 46 37 29 36 32 22 22Female Population (ages 15-19) 622 625 592 590 596 608 603 594 562 544 543 537 544 555 554 564Rates of Pregnancies per 1,000 101.3 78.4 52.4 86.4 88.9 106.9 89.6 69 73 84.6 68.1 54 66.2 57.7 39.7 39
Quitman Total Pregnancies 10 3 10 11 8 11 8 8 4 9 3 3 4 7 1 7Female Population (ages 15-19) 89 82 80 76 82 91 73 63 70 66 67 64 65 68 57 54Rates of Pregnancies per 1,000 112.4 * 125 144.7 97.6 120.9 109.6 127 * 136.4 * * * 102.9 * 129.6
Rabun Total Pregnancies 33 29 34 35 36 31 23 36 29 32 26 14 16 17 20 15Female Population (ages 15-19) 432 449 486 491 490 494 516 540 529 515 515 515 506 496 475 482Rates of Pregnancies per 1,000 76.4 64.6 70 71.3 73.5 62.8 44.6 66.7 54.8 62.1 50.5 27.2 31.6 34.3 42.1 31.1
Randolph Total Pregnancies 27 34 21 17 19 22 30 26 29 12 20 10 17 12 7 10Female Population (ages 15-19) 378 366 340 345 340 351 342 307 302 280 277 258 228 231 269 263Rates of Pregnancies per 1,000 71.4 92.9 61.8 49.3 55.9 62.7 87.7 84.7 96 42.9 72.2 38.8 74.6 51.9 26 38

TEENAGE PREGNANCY PREVENTION - GEORGIA'S DECLINING PREGNANCYRates for Ages 15-19
2001 thru 2015 Trends
50
County 2000 2001 2002 2003 2004 2005 2006 2007 2008 2009 2010 2011 2012 2013 2014 2015
Richmond Total Pregnancies 740 750 684 704 708 618 706 740 629 595 494 473 410 363 373 296Female Population (ages 15-19) 7,505 7,363 7,349 7,411 7,509 7,482 7,608 7,566 7,492 7,395 7,378 6,725 6,336 6,079 6,115 6,049Rates of Pregnancies per 1,000 98.6 101.9 93.1 95 94.3 82.6 92.8 97.8 84 80.5 67 70.3 64.7 59.7 61 48.9
Rockdale Total Pregnancies 176 182 181 187 161 194 191 179 171 191 170 157 139 113 113 85Female Population (ages 15-19) 2,684 2,699 2,739 2,790 2,831 2,898 3,077 3,206 3,300 3,391 3,379 3,305 3,179 3,146 3,204 3,312Rates of Pregnancies per 1,000 65.6 67.4 66.1 67 56.9 66.9 62.1 55.8 51.8 56.3 50.3 47.5 43.7 35.9 35.3 25.7
Schley Total Pregnancies 12 7 12 14 9 14 10 10 11 15 12 15 6 8 4 3Female Population (ages 15-19) 125 134 125 117 137 163 156 175 198 202 206 191 197 204 212 217Rates of Pregnancies per 1,000 96 52.2 96 119.7 65.7 85.9 64.1 57.1 55.6 74.3 58.3 78.5 30.5 39.2 * *
Screven Total Pregnancies 39 43 40 54 45 31 56 43 59 38 49 35 28 18 22 17Female Population (ages 15-19) 544 521 541 563 611 628 648 634 649 606 544 470 433 394 378 361Rates of Pregnancies per 1,000 71.7 82.5 73.9 95.9 73.6 49.4 86.4 67.8 90.9 62.7 90.1 74.5 64.7 45.7 58.2 47.1
Seminole Total Pregnancies 40 22 23 31 17 31 22 27 18 19 28 21 15 18 18 11Female Population (ages 15-19) 337 309 302 303 289 291 299 296 290 280 276 277 271 272 269 262Rates of Pregnancies per 1,000 118.7 71.2 76.2 102.3 58.8 106.5 73.6 91.2 62.1 67.9 101.4 75.8 55.4 66.2 66.9 42
Spalding Total Pregnancies 223 238 194 230 212 192 197 200 189 199 194 152 137 126 114 95Female Population (ages 15-19) 2,080 2,034 2,012 1,980 1,977 2,057 2,154 2,196 2,311 2,253 2,161 1,954 1,884 1,808 1,850 1,846Rates of Pregnancies per 1,000 107.2 117 96.4 116.2 107.2 93.3 91.5 91.1 81.8 88.3 89.8 77.8 72.7 69.7 61.6 51.5
Stephens Total Pregnancies 61 75 57 58 44 60 51 71 58 64 51 27 51 35 34 38Female Population (ages 15-19) 915 888 850 898 894 946 979 968 992 970 950 904 884 864 841 861Rates of Pregnancies per 1,000 66.7 84.5 67.1 64.6 49.2 63.4 52.1 73.3 58.5 66 53.7 29.9 57.7 40.5 40.4 44.1
Stewart Total Pregnancies 10 11 19 12 11 14 13 22 14 14 15 11 9 14 7 3Female Population (ages 15-19) 155 167 159 149 154 145 135 145 141 155 145 141 142 118 106 97Rates of Pregnancies per 1,000 64.5 65.9 119.5 80.5 71.4 96.6 96.3 151.7 99.3 90.3 103.4 78 63.4 118.6 66 *
Sumter Total Pregnancies 100 134 120 87 114 111 108 126 109 120 96 83 68 68 56 47Female Population (ages 15-19) 1,369 1,332 1,304 1,352 1,320 1,346 1,367 1,468 1,480 1,484 1,415 1,333 1,243 1,246 1,227 1,200Rates of Pregnancies per 1,000 73 100.6 92 64.3 86.4 82.5 79 85.8 73.6 80.9 67.8 62.3 54.7 54.6 45.6 39.2
Talbot Total Pregnancies 27 25 21 13 15 13 19 24 22 24 21 19 17 11 4 8Female Population (ages 15-19) 219 212 207 199 223 236 243 262 246 233 236 210 188 157 170 174Rates of Pregnancies per 1,000 123.3 117.9 101.4 65.3 67.3 55.1 78.2 91.6 89.4 103 89 90.5 90.4 70.1 * 46
Taliaferro Total Pregnancies 3 4 6 2 11 4 5 2 3 6 6 5 3 3 3 0Female Population (ages 15-19) 61 60 60 61 69 63 81 76 61 63 55 39 42 43 39 33Rates of Pregnancies per 1,000 * * 100 * 159.4 * 61.7 * * 95.2 109.1 128.2 * * * 0
Tattnall Total Pregnancies 66 68 67 76 72 64 68 80 78 75 55 48 42 31 29 29Female Population (ages 15-19) 653 673 651 656 657 638 665 677 701 667 672 638 647 650 647 669Rates of Pregnancies per 1,000 101.1 101 102.9 115.9 109.6 100.3 102.3 118.2 111.3 112.4 81.8 75.2 64.9 47.7 44.8 43.3

TEENAGE PREGNANCY PREVENTION - GEORGIA'S DECLINING PREGNANCYRates for Ages 15-19
2001 thru 2015 Trends
51
County 2000 2001 2002 2003 2004 2005 2006 2007 2008 2009 2010 2011 2012 2013 2014 2015
Taylor Total Pregnancies 29 15 25 15 21 19 16 30 32 25 27 16 20 11 12 9Female Population (ages 15-19) 307 279 288 302 302 288 306 344 350 344 343 321 311 292 256 252Rates of Pregnancies per 1,000 94.5 53.8 86.8 49.7 69.5 66 52.3 87.2 91.4 72.7 78.7 49.8 64.3 37.7 46.9 35.7
Telfair Total Pregnancies 52 24 33 30 36 33 38 31 40 33 25 34 19 21 18 20Female Population (ages 15-19) 377 345 333 313 326 372 416 422 418 427 415 410 383 379 384 397Rates of Pregnancies per 1,000 137.9 69.6 99.1 95.8 110.4 88.7 91.3 73.5 95.7 77.3 60.2 82.9 49.6 55.4 46.9 50.4
Terrell Total Pregnancies 50 57 36 34 38 31 48 36 47 41 38 25 25 19 14 13Female Population (ages 15-19) 440 404 388 384 377 355 355 346 364 338 320 302 248 257 261 246Rates of Pregnancies per 1,000 113.6 141.1 92.8 88.5 100.8 87.3 135.2 104 129.1 121.3 118.8 82.8 100.8 73.9 53.6 52.8
Thomas Total Pregnancies 145 128 92 123 123 106 106 122 107 111 105 95 81 62 72 56Female Population (ages 15-19) 1,594 1,587 1,591 1,566 1,531 1,593 1,625 1,599 1,639 1,612 1,558 1,529 1,349 1,363 1,329 1,389Rates of Pregnancies per 1,000 91 80.7 57.8 78.5 80.3 66.5 65.2 76.3 65.3 68.9 67.4 62.1 60 45.5 54.2 40.3
Tift Total Pregnancies 141 118 115 105 116 154 126 136 108 120 99 89 83 66 81 79Female Population (ages 15-19) 1,514 1,448 1,438 1,469 1,492 1,547 1,604 1,675 1,682 1,666 1,668 1,785 1,645 1,609 1,686 1,686Rates of Pregnancies per 1,000 93.1 81.5 80 71.5 77.7 99.5 78.6 81.2 64.2 72 59.4 49.9 50.5 41 48 46.9
Toombs Total Pregnancies 118 103 99 89 82 97 104 88 99 90 87 81 56 59 60 61Female Population (ages 15-19) 982 983 1,001 959 950 985 1,014 1,013 996 978 965 930 887 893 889 897Rates of Pregnancies per 1,000 120.2 104.8 98.9 92.8 86.3 98.5 102.6 86.9 99.4 92 90.2 87.1 63.1 66.1 67.5 68
Towns Total Pregnancies 11 16 12 5 14 14 9 13 13 11 20 7 12 5 15 14Female Population (ages 15-19) 366 371 382 380 405 416 436 477 444 442 436 440 480 513 551 558Rates of Pregnancies per 1,000 30.1 43.1 31.4 13.2 34.6 33.7 20.6 27.3 29.3 24.9 45.9 15.9 25 9.7 27.2 25.1
Treutlen Total Pregnancies 25 23 19 22 10 15 9 15 12 11 11 17 15 13 7 6Female Population (ages 15-19) 258 236 225 226 216 193 202 189 192 209 203 185 184 188 180 196Rates of Pregnancies per 1,000 96.9 97.5 84.4 97.3 46.3 77.7 44.6 79.4 62.5 52.6 54.2 91.9 81.5 69.1 38.9 30.6
Troup Total Pregnancies 207 217 194 183 193 204 181 207 204 182 162 156 138 134 129 112Female Population (ages 15-19) 2,140 2,213 2,208 2,163 2,239 2,334 2,408 2,452 2,549 2,515 2,508 2,512 2,429 2,405 2,395 2,361Rates of Pregnancies per 1,000 96.7 98.1 87.9 84.6 86.2 87.4 75.2 84.4 80 72.4 64.6 62.1 56.8 55.7 53.9 47.4
Turner Total Pregnancies 50 42 37 31 33 28 30 37 34 25 20 24 11 17 23 13Female Population (ages 15-19) 389 372 360 355 352 324 306 291 266 262 293 257 244 266 298 314Rates of Pregnancies per 1,000 128.5 112.9 102.8 87.3 93.8 86.4 98 127.1 127.8 95.4 68.3 93.4 45.1 63.9 77.2 41.4
Twiggs Total Pregnancies 31 33 26 23 27 35 31 22 21 15 18 11 10 7 15 12Female Population (ages 15-19) 416 421 425 440 424 392 376 343 330 320 303 265 243 237 196 181Rates of Pregnancies per 1,000 74.5 78.4 61.2 52.3 63.7 89.3 82.4 64.1 63.6 46.9 59.4 41.5 41.2 29.5 76.5 66.3
Union Total Pregnancies 30 32 20 21 27 30 37 33 28 35 26 22 17 18 20 15Female Population (ages 15-19) 476 489 479 489 512 528 535 566 548 529 531 483 487 528 559 556Rates of Pregnancies per 1,000 63 65.4 41.8 42.9 52.7 56.8 69.2 58.3 51.1 66.2 49 45.5 34.9 34.1 35.8 27

TEENAGE PREGNANCY PREVENTION - GEORGIA'S DECLINING PREGNANCYRates for Ages 15-19
2001 thru 2015 Trends
52
County 2000 2001 2002 2003 2004 2005 2006 2007 2008 2009 2010 2011 2012 2013 2014 2015
Upson Total Pregnancies 97 95 86 66 64 86 76 91 95 91 92 64 70 62 52 54Female Population (ages 15-19) 872 897 900 891 928 938 947 982 971 985 960 888 848 819 763 797Rates of Pregnancies per 1,000 111.2 105.9 95.6 74.1 69 91.7 80.3 92.7 97.8 92.4 95.8 72.1 82.5 75.7 68.2 67.8
Walker Total Pregnancies 164 157 167 145 136 155 164 187 154 132 119 123 111 103 98 101Female Population (ages 15-19) 1,989 1,944 1,921 1,975 2,032 2,117 2,187 2,272 2,225 2,217 2,171 2,098 2,031 2,056 2,061 2,066Rates of Pregnancies per 1,000 82.5 80.8 86.9 73.4 66.9 73.2 75 82.3 69.2 59.5 54.8 58.6 54.7 50.1 47.5 48.9
Walton Total Pregnancies 153 150 149 148 161 164 186 184 164 176 146 134 127 120 106 103Female Population (ages 15-19) 2,114 2,085 2,147 2,284 2,446 2,581 2,672 2,785 2,877 2,864 2,932 2,891 2,892 2,925 2,980 3,016Rates of Pregnancies per 1,000 72.4 71.9 69.4 64.8 65.8 63.5 69.6 66.1 57 61.5 49.8 46.4 43.9 41 35.6 34.2
Ware Total Pregnancies 111 91 112 89 101 100 115 123 121 108 106 102 89 80 72 71Female Population (ages 15-19) 1,193 1,092 1,076 1,119 1,122 1,119 1,140 1,162 1,148 1,170 1,168 1,115 1,007 945 990 1,023Rates of Pregnancies per 1,000 93 83.3 104.1 79.5 90 89.4 100.9 105.9 105.4 92.3 90.8 91.5 88.4 84.7 72.7 69.4
Warren Total Pregnancies 26 15 21 14 17 24 28 13 17 21 12 16 9 12 4 2Female Population (ages 15-19) 236 236 228 235 233 238 216 208 202 207 192 171 155 149 138 132Rates of Pregnancies per 1,000 110.2 63.6 92.1 59.6 73 100.8 129.6 62.5 84.2 101.4 62.5 93.6 58.1 80.5 * *
Washington Total Pregnancies 64 61 50 49 40 44 54 64 59 68 46 38 42 37 45 44Female Population (ages 15-19) 826 805 764 760 749 722 782 769 766 725 700 681 645 586 578 585Rates of Pregnancies per 1,000 77.5 75.8 65.4 64.5 53.4 60.9 69.1 83.2 77 93.8 65.7 55.8 65.1 63.1 77.9 75.2
Wayne Total Pregnancies 80 69 86 82 70 107 95 103 112 82 68 74 59 47 51 36Female Population (ages 15-19) 981 984 976 952 947 933 957 991 982 972 932 891 832 802 820 850Rates of Pregnancies per 1,000 81.5 70.1 88.1 86.1 73.9 114.7 99.3 103.9 114.1 84.4 73 83.1 70.9 58.6 62.2 42.4
Webster Total Pregnancies 2 6 10 5 4 5 8 3 3 4 1 2 4 5 3 1Female Population (ages 15-19) 84 75 74 79 82 76 74 84 89 96 94 86 79 70 74 78Rates of Pregnancies per 1,000 * 80 135.1 63.3 * 65.8 108.1 * * * * * * 71.4 * *
Wheeler Total Pregnancies 17 15 14 16 18 20 17 17 18 12 16 10 7 8 10 7Female Population (ages 15-19) 195 190 170 170 165 176 170 170 171 166 159 150 141 151 158 163Rates of Pregnancies per 1,000 87.2 78.9 82.4 94.1 109.1 113.6 100 100 105.3 72.3 100.6 66.7 49.6 53 63.3 42.9
White Total Pregnancies 49 39 55 52 43 49 42 43 47 37 34 28 21 31 23 29Female Population (ages 15-19) 646 648 707 753 806 861 896 883 879 893 888 873 940 959 972 992Rates of Pregnancies per 1,000 75.9 60.2 77.8 69.1 53.3 56.9 46.9 48.7 53.5 41.4 38.3 32.1 22.3 32.3 23.7 29.2
Whitfield Total Pregnancies 336 362 314 309 315 309 312 314 271 248 254 219 194 191 174 167Female Population (ages 15-19) 2,849 2,849 2,937 2,967 3,038 3,138 3,295 3,358 3,512 3,657 3,716 3,588 3,512 3,483 3,547 3,631Rates of Pregnancies per 1,000 117.9 127.1 106.9 104.1 103.7 98.5 94.7 93.5 77.2 67.8 68.4 61 55.2 54.8 49.1 46
Wilcox Total Pregnancies 14 35 15 24 16 19 25 21 18 20 12 20 11 21 17 8Female Population (ages 15-19) 264 268 280 297 277 268 268 252 274 259 252 239 266 227 211 220Rates of Pregnancies per 1,000 53 130.6 53.6 80.8 57.8 70.9 93.3 83.3 65.7 77.2 47.6 83.7 41.4 92.5 80.6 36.4

TEENAGE PREGNANCY PREVENTION - GEORGIA'S DECLINING PREGNANCYRates for Ages 15-19
2001 thru 2015 Trends
53
County 2000 2001 2002 2003 2004 2005 2006 2007 2008 2009 2010 2011 2012 2013 2014 2015
Wilkes Total Pregnancies 29 31 19 28 35 28 26 16 16 28 23 12 16 8 15 11Female Population (ages 15-19) 396 376 375 379 355 330 322 314 314 304 320 312 292 275 276 285Rates of Pregnancies per 1,000 73.2 82.4 50.7 73.9 98.6 84.8 80.7 51 51 92.1 71.9 38.5 54.8 29.1 54.3 38.6
Wilkinson Total Pregnancies 31 38 25 35 21 31 25 26 18 16 13 16 19 10 22 7Female Population (ages 15-19) 421 411 385 382 352 337 321 322 329 311 306 301 308 269 267 264Rates of Pregnancies per 1,000 73.6 92.5 64.9 91.6 59.7 92 77.9 80.7 54.7 51.4 42.5 53.2 61.7 37.2 82.4 26.5
Worth Total Pregnancies 71 61 53 59 65 52 42 61 62 58 43 54 40 29 40 23Female Population (ages 15-19) 890 866 831 839 832 841 840 823 877 851 814 818 804 680 654 657Rates of Pregnancies per 1,000 79.8 70.4 63.8 70.3 78.1 61.8 50 74.1 70.7 68.2 52.8 66 49.8 42.6 61.2 35
Georgia Total Pregnancies 23,298 22,586 21,437 21,040 21,098 21,058 22,083 22,773 22,231 20,886 18,664 17,018 15,009 13,542 12,609 11,578Female Population (ages 15-19) 288,056 288,837 292,612 298,811 307,138 318,344 329,203 338,772 345,304 347,660 345,655 340,408 340,208 338,478 340,036 345,489Rates of Pregnancies per 1,000 80.9 78.2 73.3 70.4 68.7 66.1 67.1 67.2 64.4 60.1 54 50 44.1 40 37.1 33.5

J. Sanctions Applied to TANF Recipients

TANF SANCTIONSState Fiscal Year 2016
54
County
Clients with Reductions Applied in SFY 2016
Clients with
Closures SFY 2016
County
Clients with
Reductions Applied in SFY 2016
Clients with
Closures SFY 2016
County
Clients with Reductions Applied in SFY 2016
Clients with
Closures SFY 2016
APPLING 0 0 FRANKLIN 0 0 PUTNAM 0 0ATKINSON 0 0 FULTON 43 1 QUITMAN 0 0BACON 0 0 GILMER 0 0 RABUN 0 0BAKER 0 0 GLASCOCK 0 0 RANDOLPH 0 0BALDWIN 1 2 GLYNN 0 0 RICHMOND 4 10BANKS 0 0 GORDON 0 0 ROCKDALE 2 0BARROW 0 0 GRADY 0 0 SCHLEY 0 0BARTOW 0 0 GREENE 0 0 SCREVEN 0 0BEN HILL 0 0 GWINNETT 1 0 SEMINOLE 0 0BERRIEN 0 0 HABERSHAM 0 0 SPALDING 0 0BIBB 9 67 HALL 0 0 STEPHENS 0 0BLECKLEY 0 0 HANCOCK 0 0 STEWART 0 0BRANTLEY 0 0 HARALSON 0 0 SUMTER 0 0BROOKS 0 0 HARRIS 0 0 TALBOT 0 0BRYAN 0 0 HART 0 0 TALIAFERRO 0 0BULLOCH 0 0 HEARD 0 0 TATTNALL 0 0BURKE 1 0 HENRY 0 0 TAYLOR 0 0BUTTS 1 0 HOUSTON 3 2 TELFAIR 0 0CALHOUN 0 0 IRWIN 0 0 TERRELL 1 0CAMDEN 0 0 JACKSON 1 0 THOMAS 0 0CANDLER 0 0 JASPER 0 0 TIFT 0 0CARROLL 1 0 JEFF DAVIS 0 0 TOOMBS 0 0CATOOSA 0 0 JEFFERSON 0 0 TOWNS 0 0CHARLTON 0 0 JENKINS 0 0 TREUTLEN 0 0CHATHAM 0 0 JOHNSON 0 0 TROUP 2 0CHATTAHOOCHEE 0 0 JONES 0 0 TURNER 0 0CHATTOOGA 0 0 LAMAR 0 0 TWIGGS 0 0CHEROKEE 0 0 LANIER 0 0 UNION 0 0CLARKE 0 0 LAURENS 1 0 UPSON 1 0CLAY 0 0 LEE 0 0 WALKER 0 0CLAYTON 4 0 LIBERTY 0 0 WALTON 0 0CLINCH 0 0 LINCOLN 0 0 WARE 0 0COBB 3 1 LONG 0 0 WARREN 0 0COFFEE 0 0 LOWNDES 0 0 WASHINGTON 1 0COLQUITT 0 0 LUMPKIN 0 0 WAYNE 0 0COLUMBIA 0 0 MACON 0 0 WEBSTER 0 0COOK 0 0 MADISON 0 0 WHEELER 0 0COWETA 0 0 MARION 0 0 WHITE 0 0CRAWFORD 0 0 MCDUFFIE 3 0 WHITFIELD 0 0CRISP 0 0 MCINTOSH 0 0 WILCOX 0 0DADE 0 0 MERIWETHER 0 0 WILKES 0 0DAWSON 0 0 MILLER 0 0 WILKINSON 0 0DECATUR 0 0 MITCHELL 0 0 WORTH 0 0DEKALB 10 1 MONROE 0 0 STATE 105 106DODGE 0 0 MONTGOMERY 0 0DOOLY 0 0 MORGAN 0 0DOUGHERTY 0 0 MURRAY 0 0DOUGLAS 1 2 MUSCOGEE 9 9EARLY 0 0 NEWTON 1 11ECHOLS 0 0 OCONEE 0 0EFFINGHAM 0 0 OGLETHORPE 0 0ELBERT 0 0 PAULDING 0 0EMANUEL 0 0 PEACH 0 0EVANS 0 0 PICKENS 0 0FANNIN 0 0 PIERCE 0 0FAYETTE 1 0 PIKE 0 0FLOYD 0 0 POLK 0 0FORSYTH 0 0 PULASKI 0 0

K. The Number of Legal Immigrants Receiving TANF Benefits by Category of
Immigration Status

LEGAL IMMIGRANTS RECEIVING TANF BYIMMIGRATION STATUS
State Fiscal Year 2016
55
County Eligible Alien
Parolee After
8/22/96
Permanent Resident Refugee Total Non-
CitizenAPPLING 0 0 0 0 0ATKINSON 0 0 0 0 0BACON 0 0 0 0 0BAKER 0 0 0 0 0BALDWIN 0 0 0 0 0BANKS 0 0 0 0 0BARROW 0 0 1 0 1BARTOW 0 0 0 0 0BEN HILL 0 0 0 0 0BERRIEN 0 0 0 0 0BIBB 0 0 2 5 7BLECKLEY 0 0 0 0 0BRANTLEY 0 0 0 0 0BROOKS 0 0 0 0 0BRYAN 0 0 0 0 0BULLOCH 0 0 0 0 0BURKE 0 0 0 0 0BUTTS 0 0 0 0 0CALHOUN 0 0 0 0 0CAMDEN 0 0 0 0 0CANDLER 0 0 0 0 0CARROLL 0 0 0 0 0CATOOSA 0 0 0 0 0CHARLTON 0 0 0 0 0CHATHAM 0 0 0 15 15CHATTAHOOCHEE 0 0 0 0 0CHATTOOGA 0 0 0 0 0CHEROKEE 0 0 1 0 1CLARKE 0 0 1 0 1CLAY 0 0 0 0 0CLAYTON 0 0 7 7 14CLINCH 0 0 0 0 0COBB 0 0 18 10 28COFFEE 0 0 0 0 0COLQUITT 0 0 0 0 0COLUMBIA 0 0 0 0 0COOK 0 0 0 0 0COWETA 0 0 0 0 0CRAWFORD 0 0 0 0 0CRISP 0 0 0 0 0DADE 0 0 0 0 0DAWSON 0 0 0 0 0DECATUR 0 0 0 0 0DEKALB 0 0 13 91 104DODGE 0 0 0 0 0DOOLY 0 0 0 0 0DOUGHERTY 0 0 0 1 1DOUGLAS 0 0 2 0 2EARLY 0 0 0 0 0ECHOLS 0 0 0 0 0

LEGAL IMMIGRANTS RECEIVING TANF BYIMMIGRATION STATUS
State Fiscal Year 2016
56
County Eligible Alien
Parolee After
8/22/96
Permanent Resident Refugee Total Non-
CitizenEFFINGHAM 0 0 0 0 0ELBERT 0 0 0 1 1EMANUEL 0 0 0 0 0EVANS 0 0 0 0 0FANNIN 0 0 0 0 0FAYETTE 0 0 0 0 0FLOYD 0 0 0 0 0FORSYTH 0 0 0 0 0FRANKLIN 0 0 0 0 0FULTON 1 0 18 277 296GILMER 0 0 0 0 0GLASCOCK 0 0 0 0 0GLYNN 0 0 0 0 0GORDON 0 0 1 0 1GRADY 0 0 0 0 0GREENE 0 0 0 0 0GWINNETT 1 0 25 45 71HABERSHAM 0 0 0 2 2HALL 0 0 2 0 2HANCOCK 0 0 0 0 0HARALSON 0 0 0 0 0HARRIS 0 0 0 0 0HART 0 0 0 0 0HEARD 0 0 0 0 0HENRY 0 0 0 0 0HOUSTON 0 0 0 0 0IRWIN 0 0 0 0 0JACKSON 0 0 0 0 0JASPER 0 0 0 0 0JEFF DAVIS 0 0 0 0 0JEFFERSON 0 0 0 0 0JENKINS 0 0 0 0 0JOHNSON 0 0 0 0 0JONES 0 0 0 0 0LAMAR 0 0 1 0 1LANIER 0 0 0 0 0LAURENS 0 0 0 0 0LEE 0 0 0 0 0LIBERTY 0 0 1 0 1LINCOLN 0 0 0 0 0LONG 0 0 0 0 0LOWNDES 0 0 0 0 0LUMPKIN 0 0 0 0 0MACON 0 0 0 0 0MADISON 0 0 0 4 4MARION 0 0 0 0 0MCDUFFIE 0 0 0 0 0MCINTOSH 0 0 0 0 0MERIWETHER 0 0 0 0 0MILLER 0 0 0 0 0

LEGAL IMMIGRANTS RECEIVING TANF BYIMMIGRATION STATUS
State Fiscal Year 2016
57
County Eligible Alien
Parolee After
8/22/96
Permanent Resident Refugee Total Non-
CitizenMITCHELL 0 0 0 0 0MONROE 0 0 0 0 0MONTGOMERY 0 0 0 0 0MORGAN 0 0 0 0 0MURRAY 0 0 0 0 0MUSCOGEE 0 0 0 0 0NEWTON 0 0 2 2 4OCONEE 0 0 0 0 0OGLETHORPE 0 0 0 0 0PAULDING 0 0 1 0 1PEACH 0 0 0 0 0PICKENS 0 0 0 0 0PIERCE 0 0 0 0 0PIKE 0 0 0 0 0POLK 0 0 0 0 0PULASKI 0 0 0 0 0PUTNAM 0 0 0 0 0QUITMAN 0 0 0 0 0RABUN 0 0 0 0 0RANDOLPH 0 0 0 0 0RICHMOND 0 0 2 0 2ROCKDALE 0 0 2 0 2SCHLEY 0 0 0 0 0SCREVEN 0 0 0 0 0SEMINOLE 0 0 0 0 0SPALDING 0 0 0 0 0STEPHENS 0 0 1 0 1STEWART 0 0 0 0 0SUMTER 0 0 0 0 0TALBOT 0 0 0 0 0TALIAFERRO 0 0 0 0 0TATTNALL 0 0 0 0 0TAYLOR 0 0 0 0 0TELFAIR 0 0 0 0 0TERRELL 0 0 0 0 0THOMAS 0 0 0 0 0TIFT 0 0 0 0 0TOOMBS 0 0 0 0 0TOWNS 0 0 0 0 0TREUTLEN 1 0 0 0 1TROUP 0 0 0 0 0TURNER 0 0 0 0 0TWIGGS 0 0 0 0 0UNION 0 0 0 0 0UPSON 0 0 0 0 0WALKER 0 0 0 0 0WALTON 0 0 1 0 1WARE 0 0 0 0 0WARREN 0 0 0 0 0WASHINGTON 0 0 0 0 0

LEGAL IMMIGRANTS RECEIVING TANF BYIMMIGRATION STATUS
State Fiscal Year 2016
58
County Eligible Alien
Parolee After
8/22/96
Permanent Resident Refugee Total Non-
CitizenWAYNE 0 0 0 0 0WEBSTER 0 0 0 0 0WHEELER 0 0 0 0 0WHITE 0 0 0 0 0WHITFIELD 0 0 0 0 0WILCOX 0 0 0 0 0WILKES 0 0 0 0 0WILKINSON 0 0 0 0 0WORTH 0 0 0 0 0STATE 3 0 102 460 565
Source: State TANF16

L. Number of Families No Longer Eligible Because of Time Limits
`

NUMBER OF FAMILIES NO LONGER ELIGIBLE BECAUSE OF TIME LIMITS
As of January 1, 2001 thru June 30, 2016
59
County Number of Families County Number of
Families CountyNumber
of Families
APPLING 0 FAYETTE 3 PEACH 40ATKINSON 2 FLOYD 14 PICKENS 0BACON 1 FORSYTH 0 PIERCE 7BAKER 3 FRANKLIN 1 PIKE 0BALDWIN 34 FULTON 851 POLK 1BANKS 1 GILMER 0 PULASKI 10BARROW 1 GLASCOCK 0 PUTNAM 9BARTOW 0 GLYNN 11 QUITMAN 1BEN HILL 7 GORDON 1 RABUN 0BERRIEN 5 GRADY 4 RANDOLPH 7BIBB 196 GREENE 3 RICHMOND 252BLECKLEY 6 GWINNETT 23 ROCKDALE 5BRANTLEY 2 HABERSHAM 0 SCHLEY 0BROOKS 5 HALL 14 SCREVEN 18BRYAN 1 HANCOCK 18 SEMINOLE 9BULLOCH 14 HARALSON 3 SPALDING 6BURKE 24 HARRIS 4 STEPHENS 11BUTTS 3 HART 13 STEWART 10CALHOUN 4 HEARD 0 SUMTER 69CAMDEN 2 HENRY 11 TALBOT 10CANDLER 1 HOUSTON 66 TALIAFERRO 1CARROLL 5 IRWIN 3 TATTNALL 8CATOOSA 0 JACKSON 1 TAYLOR 8CHARLTON 0 JASPER 2 TELFAIR 10CHATHAM 70 JEFF DAVIS 3 TERRELL 51CHATTAHOOCHEE 1 JEFFERSON 19 THOMAS 42CHATTOOGA 1 JENKINS 11 TIFT 26CHEROKEE 1 JOHNSON 8 TOOMBS 8CLARKE 44 JONES 3 TOWNS 0CLAY 3 LAMAR 2 TREUTLEN 5CLAYTON 75 LANIER 2 TROUP 19CLINCH 2 LAURENS 29 TURNER 2COBB 49 LEE 1 TWIGGS 10COFFEE 12 LIBERTY 15 UNION 0COLQUITT 30 LINCOLN 1 UPSON 10COLUMBIA 11 LONG 6 WALKER 2COOK 17 LOWNDES 27 WALTON 18COWETA 6 LUMPKIN 0 WARE 22CRAWFORD 1 MACON 9 WARREN 10CRISP 29 MADISON 7 WASHINGTON 18DADE 0 MARION 2 WAYNE 11DAWSON 0 MCDUFFIE 31 WEBSTER 0DECATUR 21 MCINTOSH 0 WHEELER 0DEKALB 186 MERIWETHER 3 WHITE 0DODGE 13 MILLER 1 WHITFIELD 2DOOLY 4 MITCHELL 35 WILCOX 2DOUGHERTY 143 MONROE 2 WILKES 7DOUGLAS 15 MONTGOMERY 3 WILKINSON 6EARLY 25 MORGAN 1 WORTH 30ECHOLS 1 MURRAY 0 TOTAL 3,386EFFINGHAM 8 MUSCOGEE 191ELBERT 2 NEWTON 13EMANUEL 26 OCONEE 1EVANS 1 OGLETHORPE 5FANNIN 0 PAULDING 2

N. An Evaluation of the Effect of Code Section 49-4-186 On the Number of Births to TANF
Recipients

FAMILY CAP CASES AND CHILDRENState Fiscal Year 2016
60
County
Number Family Cap Cases as of June 2016
Total Added in SFY 16
Total Family Cap Cases Served in
SFY16
TANF Caseload as of June 2016
Percent of TANF
Caseload
Number Family Cap Children as
of June 2016
Total Added in
SFY16
Total Family Cap Children
Served in SFY16
TANF Children as
of June 2016
Percent of TANF Child Recipients
APPLING 0 0 0 34 0.0% 0 0 0 32 0.0%ATKINSON 0 2 2 13 15.4% 0 2 2 13 15.4%BACON 1 0 1 16 6.3% 2 0 2 16 12.5%BAKER 0 0 0 3 0.0% 0 0 0 3 0.0%BALDWIN 4 4 8 72 11.1% 4 5 9 52 17.3%BANKS 0 0 0 7 0.0% 0 0 0 6 0.0%BARROW 1 0 1 16 6.3% 1 0 1 14 7.1%BARTOW 1 0 1 58 1.7% 2 0 2 55 3.6%BEN HILL 2 0 2 28 7.1% 2 0 2 28 7.1%BERRIEN 0 0 0 17 0.0% 0 0 0 17 0.0%BIBB 63 26 89 508 17.5% 80 46 126 431 29.2%BLECKLEY 0 0 0 16 0.0% 0 0 0 16 0.0%BRANTLEY 0 0 0 38 0.0% 0 0 0 38 0.0%BROOKS 3 1 4 35 11.4% 4 1 5 35 14.3%BRYAN 0 0 0 12 0.0% 0 0 0 12 0.0%BULLOCH 6 4 10 70 14.3% 7 4 11 65 16.9%BURKE 4 9 13 58 22.4% 5 12 17 52 32.7%BUTTS 0 0 0 24 0.0% 0 0 0 19 0.0%CALHOUN 2 0 2 9 22.2% 2 0 2 8 25.0%CAMDEN 1 1 2 35 5.7% 1 1 2 34 5.9%CANDLER 1 0 1 27 3.7% 1 0 1 25 4.0%CARROLL 4 2 6 177 3.4% 6 2 8 156 5.1%CATOOSA 0 0 0 57 0.0% 0 0 0 56 0.0%CHARLTON 0 0 0 11 0.0% 0 0 0 11 0.0%CHATHAM 3 5 8 139 5.8% 3 6 9 130 6.9%CHATTAHOCHEE 0 0 0 4 0.0% 0 0 0 3 0.0%CHATTOOGA 0 0 0 29 0.0% 0 0 0 28 0.0%CHEROKEE 0 0 0 41 0.0% 0 0 0 36 0.0%CLARKE 6 10 16 74 21.6% 9 20 29 59 49.2%CLAY 1 0 1 5 20.0% 1 0 1 5 20.0%CLAYTON 36 16 52 600 8.7% 43 22 65 532 12.2%CLINCH 2 0 2 11 18.2% 11 0 11 11 100.0%COBB 19 12 31 537 5.8% 27 12 39 400 9.8%COFFEE 3 3 6 67 9.0% 3 3 6 67 9.0%COLQUITT 6 4 10 69 14.5% 7 4 11 69 15.9%

FAMILY CAP CASES AND CHILDRENState Fiscal Year 2016
61
County
Number Family Cap Cases as of June 2016
Total Added in SFY 16
Total Family Cap Cases Served in
SFY16
TANF Caseload as of June 2016
Percent of TANF
Caseload
Number Family Cap Children as
of June 2016
Total Added in
SFY16
Total Family Cap Children
Served in SFY16
TANF Children as
of June 2016
Percent of TANF Child Recipients
COLUMBIA 2 3 5 56 8.9% 2 5 7 52 13.5%COOK 1 1 2 18 11.1% 3 3 6 18 33.3%COWETA 0 0 0 85 0.0% 0 0 0 70 0.0%CRAWFORD 3 0 3 13 23.1% 6 0 6 12 50.0%CRISP 3 2 5 18 27.8% 3 2 5 15 33.3%DADE 0 0 0 4 0.0% 0 0 0 4 0.0%DAWSON 0 0 0 13 0.0% 0 0 0 11 0.0%DECATUR 5 2 7 31 22.6% 6 3 9 31 29.0%DEKALB 62 35 97 897 10.8% 70 44 114 650 17.5%DODGE 3 0 3 32 9.4% 3 0 3 30 10.0%DOOLY 1 1 2 6 33.3% 1 1 2 6 33.3%DOUGHERTY 35 27 62 259 23.9% 46 39 85 234 36.3%DOUGLAS 14 3 17 364 4.7% 16 3 19 343 5.5%EARLY 1 0 1 4 25.0% 1 0 1 4 25.0%ECHOLS 0 2 2 5 40.0% 0 2 2 5 40.0%EFFINGHAM 0 0 0 25 0.0% 0 0 0 21 0.0%ELBERT 1 2 3 21 14.3% 1 2 3 17 17.6%EMANUEL 4 0 4 39 10.3% 5 0 5 37 13.5%EVANS 1 0 1 22 4.5% 1 0 1 21 4.8%FANNIN 0 0 0 5 0.0% 0 0 0 4 0.0%FAYETTE 1 0 1 42 2.4% 2 0 2 34 5.9%FLOYD 4 6 10 46 21.7% 6 8 14 39 35.9%FORSYTH 0 0 0 20 0.0% 0 0 0 12 0.0%FRANKLIN 0 0 0 14 0.0% 0 0 0 13 0.0%FULTON 163 97 260 1,696 15.3% 197 124 321 1,111 28.9%GILMER 1 0 1 11 9.1% 1 0 1 11 9.1%GLASCOCK 1 0 1 3 33.3% 1 0 1 3 33.3%GLYNN 18 7 25 160 15.6% 22 7 29 158 18.4%GORDON 2 0 2 82 2.4% 2 0 2 79 2.5%GRADY 3 0 3 29 10.3% 3 0 3 28 10.7%GREENE 0 0 0 3 0.0% 0 0 0 3 0.0%GWINNETT 10 12 22 479 4.6% 12 14 26 355 7.3%HABERSHAM 0 0 0 13 0.0% 0 0 0 11 0.0%HALL 9 3 12 146 8.2% 11 3 14 141 9.9%HANCOCK 0 0 0 11 0.0% 0 0 0 10 0.0%

FAMILY CAP CASES AND CHILDRENState Fiscal Year 2016
62
County
Number Family Cap Cases as of June 2016
Total Added in SFY 16
Total Family Cap Cases Served in
SFY16
TANF Caseload as of June 2016
Percent of TANF
Caseload
Number Family Cap Children as
of June 2016
Total Added in
SFY16
Total Family Cap Children
Served in SFY16
TANF Children as
of June 2016
Percent of TANF Child Recipients
HARALSON 1 0 1 16 6.3% 2 0 2 16 12.5%HARRIS 2 2 4 27 14.8% 2 2 4 22 18.2%HART 1 0 1 14 7.1% 1 0 1 14 7.1%HEARD 0 0 0 16 0.0% 0 0 0 14 0.0%HENRY 6 2 8 136 5.9% 8 4 12 105 11.4%HOUSTON 19 8 27 260 10.4% 26 11 37 221 16.7%IRWIN 1 0 1 13 7.7% 1 0 1 13 7.7%JACKSON 0 0 0 13 0.0% 0 0 0 11 0.0%JASPER 0 0 0 7 0.0% 0 0 0 6 0.0%JEFF DAVIS 0 0 0 23 0.0% 0 0 0 22 0.0%JEFFERSON 3 0 3 22 13.6% 4 1 5 20 25.0%JENKINS 2 0 2 28 7.1% 2 0 2 24 8.3%JOHNSON 0 0 0 17 0.0% 0 0 0 17 0.0%JONES 2 0 2 35 5.7% 2 0 2 34 5.9%LAMAR 1 6 7 68 10.3% 1 7 8 27 29.6%LANIER 0 0 0 3 0.0% 0 0 0 3 0.0%LAURENS 8 1 9 121 7.4% 8 1 9 106 8.5%LEE 0 1 1 24 4.2% 0 1 1 24 4.2%LIBERTY 2 1 3 38 7.9% 2 1 3 33 9.1%LINCOLN 0 0 0 8 0.0% 0 0 0 7 0.0%LONG 2 0 2 11 18.2% 3 0 3 11 27.3%LOWNDES 14 8 22 137 16.1% 16 14 30 135 22.2%LUMPKIN 0 0 0 22 0.0% 0 0 0 20 0.0%MACON 3 1 4 46 8.7% 3 1 4 43 9.3%MADISON 0 0 0 13 0.0% 0 0 0 12 0.0%MARION 1 0 1 48 2.1% 1 0 1 42 2.4%MCDUFFIE 2 2 4 55 7.3% 2 4 6 44 13.6%MCINTOSH 1 0 1 8 12.5% 4 0 4 8 50.0%MERIWETHER 3 3 6 124 4.8% 3 4 7 119 5.9%MILLER 2 0 2 4 50.0% 3 0 3 4 75.0%MITCHELL 3 1 4 38 10.5% 3 1 4 38 10.5%MONROE 1 0 1 32 3.1% 1 0 1 30 3.3%MONTGOMERY 0 0 0 6 0.0% 0 0 0 6 0.0%MORGAN 0 0 0 4 0.0% 0 0 0 2 0.0%MURRAY 0 0 0 16 0.0% 0 0 0 16 0.0%

FAMILY CAP CASES AND CHILDRENState Fiscal Year 2016
63
County
Number Family Cap Cases as of June 2016
Total Added in SFY 16
Total Family Cap Cases Served in
SFY16
TANF Caseload as of June 2016
Percent of TANF
Caseload
Number Family Cap Children as
of June 2016
Total Added in
SFY16
Total Family Cap Children
Served in SFY16
TANF Children as
of June 2016
Percent of TANF Child Recipients
MUSCOGEE 45 29 74 536 13.8% 56 37 93 396 23.5%NEWTON 4 5 9 117 7.7% 7 6 13 98 13.3%OCONEE 0 0 0 5 0.0% 0 0 0 5 0.0%OGLETHORPE 0 0 0 4 0.0% 0 0 0 4 0.0%PAULDING 0 1 1 64 1.6% 0 1 1 62 1.6%PEACH 5 3 8 34 23.5% 6 4 10 29 34.5%PICKENS 0 0 0 57 0.0% 0 0 0 56 0.0%PIERCE 1 0 1 27 3.7% 1 0 1 27 3.7%PIKE 1 0 1 14 7.1% 1 0 1 11 9.1%POLK 0 0 0 28 0.0% 0 0 0 27 0.0%PULASKI 1 0 1 18 5.6% 1 0 1 15 6.7%PUTNAM 1 0 1 23 4.3% 1 0 1 22 4.5%QUITMAN 1 0 1 5 20.0% 1 0 1 5 20.0%RABUN 0 0 0 9 0.0% 0 0 0 8 0.0%RANDOLPH 2 4 6 29 20.7% 2 4 6 11 54.5%RICHMOND 48 22 70 438 16.0% 60 30 90 386 23.3%ROCKDALE 5 7 12 83 14.5% 6 7 13 57 22.8%SCHLEY 2 1 3 17 17.6% 2 1 3 17 17.6%SCREVEN 2 0 2 30 6.7% 3 0 3 29 10.3%SEMINOLE 0 0 0 4 0.0% 0 0 0 4 0.0%SPALDING 17 3 20 239 8.4% 22 4 26 201 12.9%STEPHENS 0 1 1 105 1.0% 0 1 1 94 1.1%STEWART 0 0 0 4 0.0% 0 0 0 3 0.0%SUMTER 14 2 16 90 17.8% 17 2 19 71 26.8%TALBOT 1 0 1 7 14.3% 2 0 2 6 33.3%TALIAFERRO 0 0 0 2 0.0% 0 0 0 2 0.0%TATTNALL 1 1 2 26 7.7% 1 1 2 26 7.7%TAYLOR 5 1 6 18 33.3% 5 1 6 14 42.9%TELFAIR 0 0 0 13 0.0% 0 0 0 12 0.0%TERRELL 1 1 2 16 12.5% 1 1 2 15 13.3%THOMAS 48 7 55 202 27.2% 62 11 73 197 37.1%TIFT 15 1 16 85 18.8% 17 2 19 85 22.4%TOOMBS 0 0 0 51 0.0% 0 0 0 46 0.0%TOWNS 0 0 0 3 0.0% 0 0 0 3 0.0%TREUTLEN 21 3 24 81 29.6% 21 4 25 81 30.9%

FAMILY CAP CASES AND CHILDRENState Fiscal Year 2016
64
County
Number Family Cap Cases as of June 2016
Total Added in SFY 16
Total Family Cap Cases Served in
SFY16
TANF Caseload as of June 2016
Percent of TANF
Caseload
Number Family Cap Children as
of June 2016
Total Added in
SFY16
Total Family Cap Children
Served in SFY16
TANF Children as
of June 2016
Percent of TANF Child Recipients
TROUP 2 2 4 70 5.7% 2 5 7 54 13.0%TURNER 2 0 2 8 25.0% 3 0 3 8 37.5%TWIGGS 1 1 2 19 10.5% 1 1 2 16 12.5%UNION 0 0 0 8 0.0% 0 0 0 8 0.0%UPSON 1 3 4 36 11.1% 1 5 6 31 19.4%WALKER 0 0 0 54 0.0% 0 0 0 54 0.0%WALTON 36 11 47 461 10.2% 43 12 55 459 12.0%WARE 4 2 6 38 15.8% 4 2 6 38 15.8%WARREN 0 0 0 8 0.0% 0 0 0 7 0.0%WASHINGTON 4 1 5 36 13.9% 5 1 6 33 18.2%WAYNE 4 1 5 37 13.5% 6 1 7 37 18.9%WEBSTER 0 0 0 5 0.0% 0 0 0 2 0.0%WHEELER 0 0 0 4 0.0% 0 0 0 3 0.0%WHITE 0 0 0 5 0.0% 0 0 0 5 0.0%WHITFIELD 0 0 0 36 0.0% 0 0 0 35 0.0%WILCOX 0 0 0 13 0.0% 0 0 0 12 0.0%WILKES 2 0 2 12 16.7% 2 0 2 11 18.2%WILKINSON 1 1 2 20 10.0% 1 1 2 16 12.5%WORTH 2 0 2 12 16.7% 2 0 2 12 16.7%TOTAL 897 452 1,349 12,408 10.9% 1,105 597 1,702 10,362 16.4%


![A History of [Un]Immunized Diseases](https://static.fdocuments.us/doc/165x107/55a75a391a28ab71458b4756/a-history-of-unimmunized-diseases.jpg)


