Welded Stainless Steel Pressure Pipe from China - USITC · 2 Commissioner Charlotte R. Lane, ......
136
Welded Stainless Steel Pressure Pipe From China Investigation Nos. 701-TA-454 and 731-TA-1144 (Preliminary) Publication 3986 March 2008 Washington, DC 20436
-
Upload
doannguyet -
Category
Documents
-
view
214 -
download
0
Transcript of Welded Stainless Steel Pressure Pipe from China - USITC · 2 Commissioner Charlotte R. Lane, ......
Welded Stainless Steel Pressure PipeFrom China
Investigation Nos. 701-TA-454 and 731-TA-1144 (Preliminary)
Publication 3986 March 2008
Washington, DC 20436

U.S. International Trade Commission
COMMISSIONERS
Daniel R. Pearson, ChairmanShara L. Aranoff, Vice Chairman
Deanna Tanner OkunCharlotte R. Lane
Irving A. WilliamsonDean A. Pinkert
Robert A. RogowskyDirector of Operations
Staff assigned
Elizabeth Haines, InvestigatorNorman Van Toai, Industry Analyst
William Greene, EconomistJohn Ascienzo, AccountantMary Jane Alves, Attorney
Lemuel Shields, Statistician
Doug Corkran, Supervisor Investigator
Address all communications toSecretary to the Commission
United States International Trade CommissionWashington, DC 20436

U.S. International Trade CommissionWashington, DC 20436
www.usitc.gov
Welded Stainless Steel Pressure PipeFrom China
Investigation Nos. 701-TA-454 and 731-TA-1144 (Preliminary)
Publication 3986 March 2008


i
CONTENTS
Page
Determinations . . . . . . . . . . . . . . . . . . . . . . . . . . . . . . . . . . . . . . . . . . . . . . . . . . . . . . . . . . . . . . . . . 1Views of the Commission . . . . . . . . . . . . . . . . . . . . . . . . . . . . . . . . . . . . . . . . . . . . . . . . . . . . . . . . 3
Part I: Introduction . . . . . . . . . . . . . . . . . . . . . . . . . . . . . . . . . . . . . . . . . . . . . . . . . . . . . . . . . . . . I-1Background . . . . . . . . . . . . . . . . . . . . . . . . . . . . . . . . . . . . . . . . . . . . . . . . . . . . . . . . . . . . . . . . . . I-1Statutory criteria and organization of the report . . . . . . . . . . . . . . . . . . . . . . . . . . . . . . . . . . . . . . I-1
Statutory criteria . . . . . . . . . . . . . . . . . . . . . . . . . . . . . . . . . . . . . . . . . . . . . . . . . . . . . . . . . . . I-1Organization of the report . . . . . . . . . . . . . . . . . . . . . . . . . . . . . . . . . . . . . . . . . . . . . . . . . . . . I-2
U.S. WSS pressure pipe market summary . . . . . . . . . . . . . . . . . . . . . . . . . . . . . . . . . . . . . . . . . . I-3Summary data and data sources . . . . . . . . . . . . . . . . . . . . . . . . . . . . . . . . . . . . . . . . . . . . . . . . . . I-3Previous and related Title VII investigations . . . . . . . . . . . . . . . . . . . . . . . . . . . . . . . . . . . . . . . . I-3Previous and related safeguard investigations . . . . . . . . . . . . . . . . . . . . . . . . . . . . . . . . . . . . . . . I-4Nature and extent of alleged subsidies and sales at LTFV . . . . . . . . . . . . . . . . . . . . . . . . . . . . . . I-5The subject merchandise . . . . . . . . . . . . . . . . . . . . . . . . . . . . . . . . . . . . . . . . . . . . . . . . . . . . . . . . I-5
Commerce’s scope . . . . . . . . . . . . . . . . . . . . . . . . . . . . . . . . . . . . . . . . . . . . . . . . . . . . . . . . . . I-5Tariff treatment . . . . . . . . . . . . . . . . . . . . . . . . . . . . . . . . . . . . . . . . . . . . . . . . . . . . . . . . . . . . I-5
The domestic like product . . . . . . . . . . . . . . . . . . . . . . . . . . . . . . . . . . . . . . . . . . . . . . . . . . . . . . . I-7Description and applications . . . . . . . . . . . . . . . . . . . . . . . . . . . . . . . . . . . . . . . . . . . . . . . . . . I-7Manufacturing processes . . . . . . . . . . . . . . . . . . . . . . . . . . . . . . . . . . . . . . . . . . . . . . . . . . . . . I-9Marketing . . . . . . . . . . . . . . . . . . . . . . . . . . . . . . . . . . . . . . . . . . . . . . . . . . . . . . . . . . . . . . . . I-10
Domestic like product issues . . . . . . . . . . . . . . . . . . . . . . . . . . . . . . . . . . . . . . . . . . . . . . . . . . . . I-10Physical characteristics and uses . . . . . . . . . . . . . . . . . . . . . . . . . . . . . . . . . . . . . . . . . . . . . . . I-10Manufacturing facilities, employees and processes . . . . . . . . . . . . . . . . . . . . . . . . . . . . . . . . . I-11Interchangeability and customer and producer perceptions . . . . . . . . . . . . . . . . . . . . . . . . . . I-12Channels of distribution . . . . . . . . . . . . . . . . . . . . . . . . . . . . . . . . . . . . . . . . . . . . . . . . . . . . . . I-13Price . . . . . . . . . . . . . . . . . . . . . . . . . . . . . . . . . . . . . . . . . . . . . . . . . . . . . . . . . . . . . . . . . . . . I-13
Part II: Conditions of competition in the U.S. market . . . . . . . . . . . . . . . . . . . . . . . . . . . . . . . . II-1U.S. market conditions and characteristics . . . . . . . . . . . . . . . . . . . . . . . . . . . . . . . . . . . . . . . . . . II-1Channels of distribution . . . . . . . . . . . . . . . . . . . . . . . . . . . . . . . . . . . . . . . . . . . . . . . . . . . . . . . . II-1Supply and demand considerations . . . . . . . . . . . . . . . . . . . . . . . . . . . . . . . . . . . . . . . . . . . . . . . . II-2
U.S. supply . . . . . . . . . . . . . . . . . . . . . . . . . . . . . . . . . . . . . . . . . . . . . . . . . . . . . . . . . . . . . . . II-2U.S. demand . . . . . . . . . . . . . . . . . . . . . . . . . . . . . . . . . . . . . . . . . . . . . . . . . . . . . . . . . . . . . . II-4
Substitutability issues . . . . . . . . . . . . . . . . . . . . . . . . . . . . . . . . . . . . . . . . . . . . . . . . . . . . . . . . . . II-5Comparison of domestic products, subject imports, and nonsubject imports . . . . . . . . . . . . . II-5Factors affecting purchasing decisions . . . . . . . . . . . . . . . . . . . . . . . . . . . . . . . . . . . . . . . . . . II-6
Part III: U.S. producers’ production, shipments, and employment . . . . . . . . . . . . . . . . . . . . . . III-1U.S. producers . . . . . . . . . . . . . . . . . . . . . . . . . . . . . . . . . . . . . . . . . . . . . . . . . . . . . . . . . . . . . . . III-1U.S. capacity, production, and capacity utilization . . . . . . . . . . . . . . . . . . . . . . . . . . . . . . . . . . . III-1U.S. producers’ shipments . . . . . . . . . . . . . . . . . . . . . . . . . . . . . . . . . . . . . . . . . . . . . . . . . . . . . . III-3U.S. producers’ inventories . . . . . . . . . . . . . . . . . . . . . . . . . . . . . . . . . . . . . . . . . . . . . . . . . . . . . III-3U.S. producers’ imports and purchases . . . . . . . . . . . . . . . . . . . . . . . . . . . . . . . . . . . . . . . . . . . . . III-4U.S. employment, wages, and productivity . . . . . . . . . . . . . . . . . . . . . . . . . . . . . . . . . . . . . . . . . III-4

ii
CONTENTS
Page
Part IV: U.S. imports, apparent U.S. consumption, and market shares . . . . . . . . . . . . . . . . . . IV-1U.S. importers . . . . . . . . . . . . . . . . . . . . . . . . . . . . . . . . . . . . . . . . . . . . . . . . . . . . . . . . . . . . . . . . IV-1U.S. imports . . . . . . . . . . . . . . . . . . . . . . . . . . . . . . . . . . . . . . . . . . . . . . . . . . . . . . . . . . . . . . . . . IV-1Apparent U.S. consumption . . . . . . . . . . . . . . . . . . . . . . . . . . . . . . . . . . . . . . . . . . . . . . . . . . . . . IV-5U.S. market shares . . . . . . . . . . . . . . . . . . . . . . . . . . . . . . . . . . . . . . . . . . . . . . . . . . . . . . . . . . . . IV-6Ratio of imports to U.S. production . . . . . . . . . . . . . . . . . . . . . . . . . . . . . . . . . . . . . . . . . . . . . . . IV-6
Part V: Pricing and related information . . . . . . . . . . . . . . . . . . . . . . . . . . . . . . . . . . . . . . . . . . . . V-1Factors affecting pricing . . . . . . . . . . . . . . . . . . . . . . . . . . . . . . . . . . . . . . . . . . . . . . . . . . . . . . . . V-1
Raw material costs . . . . . . . . . . . . . . . . . . . . . . . . . . . . . . . . . . . . . . . . . . . . . . . . . . . . . . . . . . V-1Transportation costs to the U.S. market . . . . . . . . . . . . . . . . . . . . . . . . . . . . . . . . . . . . . . . . . . V-1U.S. inland transportation costs . . . . . . . . . . . . . . . . . . . . . . . . . . . . . . . . . . . . . . . . . . . . . . . . V-3Exchange rates . . . . . . . . . . . . . . . . . . . . . . . . . . . . . . . . . . . . . . . . . . . . . . . . . . . . . . . . . . . . . V-3
Pricing practices . . . . . . . . . . . . . . . . . . . . . . . . . . . . . . . . . . . . . . . . . . . . . . . . . . . . . . . . . . . . . . V-4Pricing methods . . . . . . . . . . . . . . . . . . . . . . . . . . . . . . . . . . . . . . . . . . . . . . . . . . . . . . . . . . . . V-4
Price data . . . . . . . . . . . . . . . . . . . . . . . . . . . . . . . . . . . . . . . . . . . . . . . . . . . . . . . . . . . . . . . . . . . V-5Price trends . . . . . . . . . . . . . . . . . . . . . . . . . . . . . . . . . . . . . . . . . . . . . . . . . . . . . . . . . . . . . . . V-6Price comparisons . . . . . . . . . . . . . . . . . . . . . . . . . . . . . . . . . . . . . . . . . . . . . . . . . . . . . . . . . . V-13
Lost sales and lost revenues . . . . . . . . . . . . . . . . . . . . . . . . . . . . . . . . . . . . . . . . . . . . . . . . . . . . . V-13
Part VI: Financial experience of U.S. producers . . . . . . . . . . . . . . . . . . . . . . . . . . . . . . . . . . . . . VI-1Background . . . . . . . . . . . . . . . . . . . . . . . . . . . . . . . . . . . . . . . . . . . . . . . . . . . . . . . . . . . . . . . . . . VI-1Operations on WSS pressure pipe . . . . . . . . . . . . . . . . . . . . . . . . . . . . . . . . . . . . . . . . . . . . . . . . VI-1Capital expenditures and research and development expenses . . . . . . . . . . . . . . . . . . . . . . . . . . . VI-4Assets and return on investment . . . . . . . . . . . . . . . . . . . . . . . . . . . . . . . . . . . . . . . . . . . . . . . . . . VI-5Capital and investment . . . . . . . . . . . . . . . . . . . . . . . . . . . . . . . . . . . . . . . . . . . . . . . . . . . . . . . . . VI-5
Part VII: Threat considerations and Bratsk information . . . . . . . . . . . . . . . . . . . . . . . . . . . . . . VII-1The industry in China . . . . . . . . . . . . . . . . . . . . . . . . . . . . . . . . . . . . . . . . . . . . . . . . . . . . . . . . . . VII-2
Overview . . . . . . . . . . . . . . . . . . . . . . . . . . . . . . . . . . . . . . . . . . . . . . . . . . . . . . . . . . . . . . . . . VII-2WSS pressure pipe operations . . . . . . . . . . . . . . . . . . . . . . . . . . . . . . . . . . . . . . . . . . . . . . . . . VII-3Alternative products . . . . . . . . . . . . . . . . . . . . . . . . . . . . . . . . . . . . . . . . . . . . . . . . . . . . . . . . VII-4
U.S. imports subsequent to December 31, 2007 . . . . . . . . . . . . . . . . . . . . . . . . . . . . . . . . . . . . . . VII-4U.S. importers’ inventories . . . . . . . . . . . . . . . . . . . . . . . . . . . . . . . . . . . . . . . . . . . . . . . . . . . . . . VII-4Antidumping and countervailing duty orders in third-country markets . . . . . . . . . . . . . . . . . . . . VII-5Information on nonsubject sources . . . . . . . . . . . . . . . . . . . . . . . . . . . . . . . . . . . . . . . . . . . . . . . . VII-5
“Bratsk” considerations . . . . . . . . . . . . . . . . . . . . . . . . . . . . . . . . . . . . . . . . . . . . . . . . . . . . . . VII-5Nonsubject source information . . . . . . . . . . . . . . . . . . . . . . . . . . . . . . . . . . . . . . . . . . . . . . . . VII-5Overview . . . . . . . . . . . . . . . . . . . . . . . . . . . . . . . . . . . . . . . . . . . . . . . . . . . . . . . . . . . . . . . . . VII-6Global exports of circular welded tubes, pipes, and hollow profiles of stainless steel . . . . . . VII-6

iii
CONTENTS
Page
AppendixesA. Federal Register notices . . . . . . . . . . . . . . . . . . . . . . . . . . . . . . . . . . . . . . . . . . . . . . . . . . . . . . . . A-1B. Conference witnesses . . . . . . . . . . . . . . . . . . . . . . . . . . . . . . . . . . . . . . . . . . . . . . . . . . . . . . . . . . B-1C. Summary data . . . . . . . . . . . . . . . . . . . . . . . . . . . . . . . . . . . . . . . . . . . . . . . . . . . . . . . . . . . . . . . . C-1D. Questionnaire selling price data for WSS pressure pipe products 1-5 imported from nonsubject
countries and price comparisons with the U.S.-produced products . . . . . . . . . . . . . . . . . . . . . . . D-1E. Alleged effects of imports on U.S. producers’ existing development and production efforts,
growth, investment, and ability to raise capital . . . . . . . . . . . . . . . . . . . . . . . . . . . . . . . . . . . . . . E-1
Note.–Information that would reveal confidential operations of individual concerns may not bepublished and therefore has been deleted from this report. Such deletions are indicated byasterisks.


1 The record is defined in sec. 207.2(f) of the Commission’s Rules of Practice and Procedure (19 CFR § 207.2(f)). 2 Commissioner Charlotte R. Lane, Commissioner Irving A. Williamson, and Commissioner Dean A. Pinkertdetermine that there is a reasonable indication that an industry in the United States is materially injured by reason ofimports of welded stainless steel pressure pipe from China. 3 Chairman Daniel R. Pearson, Vice Chairman Shara L. Aranoff, and Commissioner Deanna Tanner Okundetermine that there is a reasonable indication that an industry in the United States is threatened with material injuryby reason of imports of welded stainless steel pressure pipe from China.
UNITED STATES INTERNATIONAL TRADE COMMISSION
Investigation Nos. 701-TA-454 and 731-TA-1144 (Preliminary)
WELDED STAINLESS STEEL PRESSURE PIPE FROM CHINA
DETERMINATIONS
On the basis of the record1 developed in the subject investigations, the United States InternationalTrade Commission (Commission) determines, pursuant to sections 703(a) and 733(a) of the Tariff Act of1930 (19 U.S.C. § 1671b(a) and 19 U.S.C. § 1673b(a)) (the Act), that there is a reasonable indication thatan industry in the United States is materially injured,2 or threatened with material injury,3 by reason ofimports from China of welded stainless steel pressure pipe, provided for in subheading 7306.40 of theHarmonized Tariff Schedule of the United States, that are alleged to be subsidized by the Government ofChina and sold in the United States at less than fair value (LTFV).
Pursuant to section 207.18 of the Commission’s rules, the Commission also gives notice of thecommencement of the final phase of its investigations. The Commission will issue a final phase notice ofscheduling, which will be published in the Federal Register as provided in section 207.21 of theCommission’s rules, upon notice from the Department of Commerce (Commerce) of affirmativepreliminary determinations in these investigations under sections 703(b) and 733(b) of the Act, or, if thepreliminary determinations are negative, upon notice of affirmative final determinations in thoseinvestigations under sections 705(a) and 735(a) of the Act. Parties that filed entries of appearance in thepreliminary phase of the investigations need not enter a separate appearance for the final phase of theinvestigations. Industrial users, and, if the merchandise under investigation is sold at the retail level,representative consumer organizations have the right to appear as parties in Commission antidumping andcountervailing duty investigations. The Secretary will prepare a public service list containing the namesand addresses of all persons, or their representatives, who are parties to the investigations.
BACKGROUND
On January 30, 2008, a petition was filed with the Commission and Commerce by Bristol Metals(Bristol, TN), Felker Brothers Corp. (Marshfield, WI), Marcegaglia USA Inc. (Munhall, PA),Outoukumpu Stainless Pipe, Inc. (Schaumburg, IL), and the United Steel Workers of America(Pittsburgh, PA), alleging that an industry in the United States is materially injured or threatened withmaterial injury by reason of subsidized and LTFV imports of welded stainless steel pressure pipe fromChina. Accordingly, effective January 30, 2008, the Commission instituted countervailing dutyinvestigation No. 701-TA-454 (Preliminary) and antidumping duty investigation No. 731-TA-1144(Preliminary).

2
Notice of the institution of the Commission’s investigations and of a public conference to be heldin connection therewith was given by posting copies of the notice in the Office of the Secretary, U.S.International Trade Commission, Washington, DC, and by publishing the notice in the Federal Registerof February 5, 2008 (73 FR 6741). The conference was held in Washington, DC, on February 21, 2008,and all persons who requested the opportunity were permitted to appear in person or by counsel.

1 Commissioner Charlotte R. Lane, Commissioner Irving A. Williamson, and Commissioner Dean A. Pinkertfind a reasonable indication that an industry in the United States is materially injured by reason of subject importsfrom the People’s Republic of China (“China”). Except as otherwise noted, they join sections I to VI of this opinion. 2 Chairman Daniel R. Pearson, Vice Chairman Shara L. Aranoff, and Commissioner Deanna Tanner Okun find areasonable indication that an industry in the United States is threatened with material injury by reason of subjectimports from China. Except as otherwise noted, they join sections I to V and VII of this opinion. 3 19 U.S.C. §§ 1671b(a), 1673b(a); see, e.g., Co-Steel Raritan, Inc. v. United States, 357 F.3d 1294 (Fed. Cir.2004); American Lamb Co. v. United States, 785 F.2d 994, 1001-04 (Fed. Cir. 1986); Aristech Chemical Corp. v.United States, 20 CIT 353, 354 (1996). No party argued that the establishment of an industry is materially retardedby reason of the allegedly unfairly traded imports. 4 American Lamb, 785 F.2d at 1001; see also Texas Crushed Stone Co. v. United States, 35 F.3d 1535, 1543(Fed. Cir. 1994). 5 See, e.g., Petitions at Exh. I-1; Confidential Staff Report, Mem. INV-FF-022 at I-1 (Mar. 10, 2008) (“CR”);Public Staff Report, USITC Pub. 3986 at I-1 (Mar. 2008) (“PR”).
3
VIEWS OF THE COMMISSION
Based on the record in the preliminary phase of these investigations, we find a reasonableindication that an industry in the United States is materially injured,1 or threatened with material injury,2by reason of imports of certain welded stainless steel pressure pipe from China that are allegedlysubsidized and sold at less than fair value in the United States.
I. THE LEGAL STANDARD FOR PRELIMINARY DETERMINATIONS
The legal standard for preliminary antidumping and countervailing duty determinations requiresthe Commission to determine, based upon the information available at the time of the preliminarydeterminations, whether there is a reasonable indication that a domestic industry is materially injured,threatened with material injury, or whether the establishment of an industry is materially retarded, byreason of the allegedly unfairly traded imports.3 In applying this standard, the Commission weighs theevidence before it and determines whether “(1) the record as a whole contains clear and convincingevidence that there is no material injury or threat of such injury; and (2) no likelihood exists that contraryevidence will arise in a final investigation.”4
II. BACKGROUND
On January 30, 2008, four domestic producers (Bristol Metals of Bristol, TN (“Bristol Metals”);Felker Brothers Corp. of Marshfield, WI and Glasgow, KY (“Felker Brothers”); Marcegaglia USA, Inc.of Munhall, PA (“Marcegaglia”); and Outokumpu Stainless Pipe, Inc. of Schaumburg, IL(“Outokumpu”)) and the United Steel Workers of Pittsburgh, PA (“USW”) filed antidumping andcountervailing duty petitions regarding allegedly unfairly traded imports of certain welded stainless steelpressure pipe from China.5 Representatives from each petitioning entity appeared at the staff conferenceaccompanied by joint counsel, and they filed a joint postconference brief. A representative from SilboIndustries of Montvale, NJ (“Silbo”), an importer of subject merchandise from China, also appeared at thestaff conference accompanied by counsel, but Silbo did not file a postconference brief. No otherproducer, exporter, or importer of the subject merchandise from China appeared at the conference orsubmitted a postconference brief.

6 19 U.S.C. § 1677(4)(A). 7 19 U.S.C. § 1677(4)(A). 8 19 U.S.C. § 1677(10). 9 See, e.g., NEC Corp. v. Department of Commerce, 36 F. Supp. 2d 380, 383 (Ct. Int’l Trade 1998); NipponSteel Corp. v. United States, 19 CIT 450, 455 (1995); Torrington Co. v. United States, 747 F. Supp. 744, 749 n.3(Ct. Int’l Trade 1990), aff’d, 938 F.2d 1278 (Fed. Cir. 1991) (“every like product determination ‘must be made onthe particular record at issue’ and the ‘unique facts of each case’”). The Commission generally considers a numberof factors including: (1) physical characteristics and uses; (2) interchangeability; (3) channels of distribution;(4) customer and producer perceptions of the products; (5) common manufacturing facilities, production processes,and production employees; and, where appropriate, (6) price. See Nippon, 19 CIT at 455 n.4; Timken Co. v. UnitedStates, 913 F. Supp. 580, 584 (Ct. Int’l Trade 1996). 10 See, e.g., S. Rep. No. 96-249 at 90-91 (1979). 11 Nippon, 19 CIT at 455; Torrington, 747 F. Supp. at 748-49; see also S. Rep. No. 96-249 at 90-91 (1979)(Congress has indicated that the like product standard should not be interpreted in “such a narrow fashion as topermit minor differences in physical characteristics or uses to lead to the conclusion that the product and article arenot ‘like’ each other, nor should the definition of ‘like product’ be interpreted in such a fashion as to preventconsideration of an industry adversely affected by the imports under consideration.”) 12 See, e.g., USEC, Inc. v. United States, Slip Op. 01-1421at 9 (Fed. Cir. April 25, 2002) (“The ITC may notmodify the class or kind of imported merchandise examined by Commerce.”); Algoma Steel Corp. v. United States,688 F. Supp. 639, 644 (Ct. Int’l Trade 1988), aff’d, 865 F.3d 240 (Fed. Cir.), cert. denied, 492 U.S. 919 (1989). 13 Hosiden Corp. v. Advanced Display Mfrs., 85 F.3d 1561, 1568 (Fed. Cir. 1996) (Commission may find asingle like product corresponding to several different classes or kinds defined by Commerce); Torrington, 747 F.Supp. at 748-52 (affirming Commission determination of six like products in investigations where Commerce foundfive classes or kinds).
4
III. DOMESTIC LIKE PRODUCT
A. In General
In determining whether there is a reasonable indication that an industry in the United States ismaterially injured or threatened with material injury by reason of imports of the subject merchandise, theCommission first defines the “domestic like product” and the “industry.”6 Section 771(4)(A) of the TariffAct of 1930, as amended (“the Act”), defines the relevant domestic industry as the “producers as a{w}hole of a domestic like product, or those producers whose collective output of a domestic like productconstitutes a major proportion of the total domestic production of the product.”7 In turn, the Act defines“domestic like product” as “a product which is like, or in the absence of like, most similar incharacteristics and uses with, the article subject to an investigation.”8
The decision regarding the appropriate domestic like product(s) in an investigation is a factualdetermination, and the Commission has applied the statutory standard of “like” or “most similar incharacteristics and uses” on a case-by-case basis.9 No single factor is dispositive, and the Commissionmay consider other factors it deems relevant based on the facts of a particular investigation.10 TheCommission looks for clear dividing lines among possible like products and disregards minor variations.11 Although the Commission must accept the determination of Commerce as to the scope of the allegedlyunfairly traded imported merchandise,12 the Commission determines what domestic product is like theimported articles Commerce has identified.13 The Commission must base its domestic like productdetermination on the record in these investigations. The Commission is not bound by prior

14 Acciai Speciali Terni S.p.A. v. United States, 118 F. Supp. 2d 1298, 1304-05 (Ct. Int’l Trade 2000); Nippon,19 CIT at 455; Asociacion Colombiana de Exportadores de Flores v. United States, 693 F. Supp. 1165, 1169 n.5 (Ct.Int’l Trade 1988) (particularly addressing like product determination); Citrosuco Paulista, S.A. v. United States, 704F. Supp. 1075, 1087-88 (Ct. Int’l Trade 1988). 15 73 Fed. Reg. 9994, 9994 (Feb. 25, 2008) (initiation of countervailing duty investigation); 73 Fed. Reg. 10221,10221 (Feb. 26, 2008) (initiation of antidumping duty investigation). As Commerce explained, “The subject importsare normally classified in subheadings 7306.40.5005, 7306.40.5040, 7306.40.5062, 7306.40.5064, and 7306.40.5085of the Harmonized Tariff Schedule of the United States (“HTSUS”). They may also enter under HTSUSsubheadings 7306.40.1010, 7306.40.1015, 7306.40.5042, 7306.40.5044, 7306.40.5080, and 7306.40.5090. TheHTSUS subheadings are provided for convenience and customs purposes only; the written description of the scope isdispositive.” 73 Fed. Reg. at 9994; 73 Fed. Reg. at 10221. 16 See, e.g., CR at I-9 n.18; PR at I-7 n.18. Ferritic stainless steels (containing a minimum of 11.5 percentchromium) are highly corrosion-resistant but much less durable than austenitic grades and cannot be hardened byheat treatment. Martensitic stainless steels (containing a minimum of 11.5 percent chromium) are not as corrosion-resistant as the other two grades but are extremely durable, highly machinable, and can be hardened by heattreatment. Id. 17 See, e.g., CR at I-7; PR at I-7.
5
determinations, even those pertaining to the same imported products, but may draw upon previousdeterminations in addressing pertinent like product issues.14
B. Product Description
In its notices of initiation, Commerce defined the imported merchandise within the scope of theseinvestigations as circular welded austenitic stainless pressure pipe
not greater than 14 inches in outside diameter. This merchandise includes, but is notlimited to, the American Society for Testing and Materials (ASTM) A-312 or ASTM A-778 specifications, or comparable domestic or foreign specifications. ASTM A-358products are only included when they are produced to meet ASTM A-312 or ASTM A-778 specifications, or comparable domestic or foreign specifications.
Excluded from the scope are: (1) welded stainless mechanical tubing, meetingASTM A-554 or comparable domestic or foreign specifications; (2) boiler, heatexchanger, superheater, refining furnace, feedwater heater, and condenser tubing,meeting ASTM A-249, ASTM A-688 or comparable domestic or foreign specifications;and (3) specialized tubing, meeting ASTM A-269, ASTM A-270 or comparable domesticor foreign specifications.15
Austenitic stainless steels comprise over 70 percent of total global stainless steel production and contain amaximum of 0.15 percent carbon and a minimum of 16 percent chromium, as well as nickel andmanganese. Austenitic stainless steel products are distinguished from ferritic and martensitic stainlesssteels by their microstructure.16
C. Background on Previous Investigations and Reviews Involving Similar Scopes
The Commission has conducted several investigations of stainless steel hollow products, a termthat encompasses “pipes,” “tubes,” and “tubing.”17 Two antidumping duty orders are currently in effectregarding certain welded stainless steel pressure pipe imports from Korea and Taiwan, but the scope of

18 See, e.g., Certain Welded Stainless Steel Pipe from Korea and Taiwan, Invs. Nos. 731-TA-540 and 541(Second Review), USITC Pub. 3877 (Aug. 2006); Certain Welded Stainless Steel Pipe from Korea and Taiwan,Invs. Nos. 731-TA-540 and 541 (Review), USITC Pub. 3351 (Sept. 2000); Certain Welded Stainless Steel Pipe fromKorea and Taiwan, Invs. Nos. 731-TA-540 and 541 (Final), USITC Pub. 2585 (Dec. 1992). There were also twoearlier investigations of welded stainless steel pipes. In Welded Stainless Steel Pipe and Tube from Japan, Inv. No.AA1921-180, USITC Pub. 899 (Jul. 1978), the Commission made a negative determination. In Stainless Steel Pipesand Tubes from Sweden, the Commission made negative final determinations regarding welded stainless steelproducts in both the countervailing duty investigation, Inv. No. 701-TA-281 (Final), USITC Pub. 1966 (Apr. 1987),and in the companion antidumping duty investigation, Inv. No. 731-TA-354 (Final), USITC Pub. 2033 (Nov. 1987). 19 See, e.g., Confer. Tr. at 52-53 (Schagrin). The scope of the orders on certain welded stainless steel pipe fromKorea and Taiwan and the scope of the current investigations exclude certain welded stainless mechanical tubingproducts, certain boiler, heat exchanger, superheater, refining furnace, feedwater heater, and condenser tubing aswell as specialized tubing meeting ASTM A-269, ASTM A-279 or comparable specifications. Id. at 53 (Schagrin);CR at I-1; PR at I-1. 20 See, e.g., Confer. Tr. at 53 (Schagrin). 21 Petitioners and Silbo agree with the Commission’s decision in the second five-year reviews of the antidumpingduty orders on certain stainless steel welded pipe from Korea and Taiwan not to define a domestic like product morebroadly than the scope of those reviews to include stainless steel tubing products. They agree that there has been nosignificant change in the relevant facts relied upon by the Commission in those reviews. See, e.g., Confer. Tr. at 55-56 (Schagrin), 92-93 (Cornelius for Marcegaglia), 109-10 (Jakob for Silbo). In the second five-year reviews of theantidumping duty orders on imports of stainless steel welded pipe made to ASTM A-312 specifications, theCommission defined a domestic like product that included stainless steel welded pipes made to ASTM A-312 andASTM A-778 specifications but that did not include tubing products. The Commission agreed with the domesticindustry that tubular products were made to more stringent requirements and in a broader range of size and wallthicknesses, were generally not interchangeable with pipes made to ASTM A-312 and ASTM A-778 specifications,were often sold to end users rather than to the distributors that purchased ASTM A-312 and ASTM A-778 products,were often produced on different production lines using separate equipment, were perceived as different products bycustomers and producers, and were priced differently. See, e.g., USITC Pub. 3877 at 5-11. In the originalinvestigations of imports of ASTM A-312 welded stainless steel pipes from Korea and Taiwan, the Commissiondefined a domestic like product that also included other tubular products, and therefore was broader than the scope. See, e.g., USITC Pub. 2585 at 7-17. In the first reviews of the corresponding antidumping duty orders, theCommission retained the broader definition of the domestic like product, but noted that due to the lateness of theargument by domestic interested parties that only A-312 and A-778 pipes should be in the domestic like product,there was only limited information on the record as to differences between the various welded stainless steel tubularpipes. See, e.g., USITC Pub. 3351 at 4-5 & n.19. 22 The scope of the current investigations is limited to welded products and does not include seamless products. No party has asked the Commission to define the domestic like product to include seamless products, and we do notdo so based on the current record. Whereas the welded stainless steel products in these investigations are made fromstainless steel coils of sheet, strip, or plate, petitioners explained that seamless products are made from bars orbillets. Seamless products are made by different producers and serve different end uses than welded products. Seamless products are used in critical applications where pressure or temperature are an issue or for post-bendingapplications where the use of a welded seam would concern the engineer. See, e.g., Confer. Tr. at 51-52 (Henke for
6
those orders differs somewhat from the scope of the current investigations.18 The scope of those ordersincludes circular welded austenitic stainless steel pressure pipe made to ASTM A-312 specificationsregardless of the outside diameter, whereas the scope of the current investigations includes both ASTMA-312 and ASTM A-778 products, but does not include products with an outside diameter greater than 14inches.19
The scope of the current investigations does not include mechanical, boiler, or related weldedtubing products.20 None of the parties has asked the Commission to define the domestic like productmore broadly to include tubing products, and we do not do so based on the current record.21 22

Felker Brothers), 52 (Schagrin); see also, e.g., Stainless Steel Pipes and Tubes from Sweden, USITC Pub. 1966 andUSITC Pub. 2033 (in the companion antidumping and countervailing duty investigations defining seamless andwelded products as different domestic like products); cf., e.g., Circular Seamless Stainless Steel Hollow Productsfrom Japan, Inv. No. 731-TA-859 (Final), USITC Pub. 3344 (Aug. 2000) (defining domestic like product asseamless products). 23 See, e.g., Petitions, Vol. I at 4; Confer. Tr. at 30-31 (Schagrin). 24 See, e.g., Confer. Tr. at 96-98, 109-10 (Jakob for Silbo). 25 See, e.g., Confer. Tr. at 96-97 (Jakob for Silbo), 123 (Schagrin); Petitioners’ Postconf. Br. at 8-9; CR at I-14 toI-15, I-17; PR at I-11 to I-12. 26 See, e.g., Petitions, Vol. I at 3-4; Petitioners’ Postconf. Br. at 8-9; CR at I-3; PR at I-3. 27 See, e.g., Confer. Tr. at 123 (Schagrin); Petitioners’ Postconf. Br. at 8-9; CR at I-15; PR at I-11. 28 See, e.g., Petitioners’ Postconf. Br. at 8-9; CR at I-15, I-17 to I-18; PR at I-11 to I-12.
7
D. Analysis and Conclusion
The scope of these investigations includes ASTM A-312 and A-778 pipes but only if the outsidediameters are not greater than 14 inches (“small-diameter pipes” or “WSS pressure pipe”). Petitioners askthe Commission to define a single domestic like product that is coextensive with the scope of theseinvestigations.23 Silbo asks the Commission to define a domestic like product that also includes circularwelded austenitic stainless pressure pipes made to ASTM specifications A-312 and A-778 that are greaterthan 14 inches in outside diameter (“large-diameter pipes”). Silbo alleges that no prior trade casesdistinguished between small- and large-diameter pipes. Silbo asserts that petitioners’ proposed domesticlike product overlooks the most profitable area of the pipe business and the domestic industry’s largeexports of large-diameter pipe.24
No party urged the Commission to distinguish between small-diameter and large-diameter pipesin any of the previous investigations or reviews involving stainless steel hollow products, and this appearsto be the first instance in which the scope differentiated between small- and large-diameter weldedstainless pressure pipes. For purposes of the preliminary phase of these investigations, and based on thefactors normally considered, we define the domestic like product as WSS pressure pipe, coextensive withthe scope of these investigations.
Physical Characteristics and Uses. Both small- and large-diameter pipes are made to specificASTM specifications such as ASTM A-312 and ASTM A-778, although some evidence suggests thatlarger sizes may be made more often to ASTM A-358 specifications. Petitioners assert that small-diameter pipes are made to more exacting physical specifications, such as specific ASTM specificationgauge schedules, whereas larger sizes are made to meet a specific customer’s gauge requirements. Because small-diameter pipes generally are made from stainless steel coils of sheet, strip, or plate andlarge-diameter pipes are made from stainless steel cut-to-length plate or cut-to-length sheet, the recordsuggests that there may be important differences in the characteristics of small- and large-diameter pipesthat are associated with differences in welding processes, as discussed below.25
According to petitioners, small-diameter pipes are generally used as conduits for liquids or gases,and their major applications include, but are not limited to: digestor lines; blow lines; pharmaceuticallines; petrochemical lines; stock lines; brewery process and transport lines; general food processing lines;automotive paint lines; and paper process machines.26 Petitioners argue that large-diameter pipes are soldfor different end uses and/or for specific projects to end-users such as liquid natural gas terminals, othermajor natural gas distributors, and waste-water treatment plants.27
Interchangeability. According to petitioners, obvious size differences affect interchangeabilitybetween small- and large-diameter pipes. Moreover, a much larger percentage of large-diameter pipe isproduced to ASTM A-358 specifications.28 The record in the preliminary phase of these investigationsalso suggests that differences in tolerances and seams related to differences in manufacturing processes

29 See, e.g., *** Supplemental Questionnaire response. 30 See, e.g., *** Supplemental Questionnaire response. 31 See, e.g., CR at I-17 to I-18; PR at I-12 to I-13. 32 See, e.g., Confer. Tr. at 12 (Boling for Bristol Metals), 112-13 (Jakob for Silbo); 122-23 (Schagrin);Petitioners’ Postconf. Br. at 9-10; CR at I-17 to I-18; PR at I-12; CR/PR at Table I-4. 33 Silbo admits that it does not have any knowledge of the production processes used in the United States. See,e.g., Confer. Tr. at 110-11 (Jakob for Silbo). 34 See, e.g., CR at I-12; PR at I-9. 35 See, e.g., CR at I-12; PR at I-9. Welding is accomplished using the tungsten inert gas (“TIG”) process, theplasma process, or the laser welding process. These methods allow welding without filler material, complete fusionof butted edges, and shielding of the weld area with inert gas to prevent oxidation. See, e.g., CR at I-12; PR at I-9. 36 ASTM A-778 pipes do not require annealing. See, e.g., CR at I-15; PR at I-11. 37 See, e.g., Petitioners’ Postconf. Br. at 7 (citing USITC Pub. 3877 at I-16 to I-17); CR at I-9, I-11 to I-13; PR atI-7, I-9 to I-10. 38 See, e.g., CR at I-9 to I-10, I-11 to I-12; PR at I-7 to I-8, I-9 to I-10; Petitioners’ Postconf. Br. at 7-8; Confer.Tr. at 31 (Schagrin). In some instances, a spiral welding process may be used wherein a steel strip is spiraled andwelded along the spiral to produce pipes of any diameter. The looped weld running throughout the product ratherthan along a single straight line reportedly is a disadvantage in terms of weld refinement and potential end use. Inaddition, the spiral weld process cannot be used for welded A-312 products because the ASTM specificationrequires straight-seam welding. The spiral-weld process is used only for large-diameter pipes and requires a separatenon-inline annealing step because of the non-linear weld. See, e.g., CR at I-10, I-11 n.27; PR at I-8, I-9 n.27; Feb. 5,2008, Supplement to Petitions at 1.
8
limit interchangeability. Small-diameter pressure pipes are produced to different tolerances than large-diameter pipes.29 In addition, there are differences in terms of whether the seams have been cold worked,ironed, and/or planished (i.e., made smooth by rolling or hammering).30 Supplemental requirements andtesting (i.e., x-ray, eddy current, dye penetrant, and corrosion testing) are common for large- but not forsmall-diameter pipes.31
Channels of Distribution. Although Silbo argues that small- and large-diameter pipes are bothsold to distributors, the record suggests that small-diameter pipes are typically sold on the spot marketthrough distributors that maintain inventories, whereas the majority of the large-diameter pipes arecustom-made for projects for specific uses, such as for engineering or construction companies for use incapital projects or by end users in the gas business. Some master distributors do inventory smallquantities of 16", 18", 20", 24", and 30" large-diameter pipes, but even then, these larger pipes appeardestined for specific customers for specific projects.32
Common Manufacturing Facilities, Production Processes, and Production Employees. Small-and large-diameter pipes are usually made on entirely different equipment using different productionprocesses.33 In general, to produce small-diameter pipes, coiled stainless steel flat-rolled products (sheet,strip, or plate of a width essentially equal to the outside diameter of the pipe to be produced) are put intoan uncoiler and fed into a series of paired forming rolls.34 As product progresses through the rolls, itscross-sectional profile is formed into a tubular shape with the butted edges welded along the seam.35 After welding, the pipe proceeds through an in-line annealing furnace,36 is then straightened, and is finallycut to length.37 In contrast, large-diameter pipes generally are made one at a time in 10' or 20' lengths onpress-brake equipment in a much slower process that welds at a rate of inches per minute instead ofthousands of inches per minute in the case of small-diameter pipes.38 The press-brake process begins witha cut-to-length sheet (or cut-to-length plate) of a width essentially equal to the outside diameter and alength equal to the length of the piece of pipe to be produced. A press gradually bends the cut-to-lengthsheet into a cylindrical shape, and each length of pipe is individually welded then annealed in a separate

39 See, e.g., Feb. 5, 2008, Supplement to the Petitions at Quest. 8; Confer. Tr. at 31, 122 (Schagrin); Petitioners’Postconf. Br. at 7 (citing USITC Pub. 3877 at I-16 to I-17); CR at I-9, I-11 to I-12; PR at I-7, I-9. 40 See, e.g., Petitioners’ Postconf. Br. at 8; CR at I-16; PR at I-12. 41 See, e.g., CR at I-16 to I-17; PR at I-12. 42 See, e.g., Confer. Tr. at 122 (Schagrin); Petitioners’ Postconf. Br. at 7-8 (citing USITC Pub. 3877 at I-16 to I-17). 43 See, e.g., Confer. Tr. at 122 (Schagrin). 44 See, e.g., CR at I-12, I-16; PR at I-9, I-12; see also, e.g., CR/PR at Table III-4 (showing ***). 45 See, e.g., Confer. Tr. at 110 (Jakob for Silbo). We invite the parties to provide information at the time thatthey comment on the draft questionnaires about whether 14 inches in outside diameter is the appropriate cut-offbetween small- and large-diameter pipes. 46 See, e.g., Petitioners’ Postconf. Br. at 8, 9-10. 47 See, e.g., Petitioners’ Postconf. Br. at 8. 48 See, e.g., CR at I-18 to I-19; PR at I-13.
9
operation and subsequently pickled in acid.39 According to petitioners, although the start-to-finishmanufacturing process for small-diameter pipes may take *** days on a continuous welding line, theprocess to produce large-diameter pipes may take ***.40 In a press-brake process, semi-automaticwelding is utilized, requiring constant operator intervention.41
Petitioners report that different employees generally are used to produce small- and large-diameter pipes, additional training is needed before employees can be moved between the productionprocesses, and production of large-diameter pipes is more labor-intensive.42 Petitioners also argue thatthere are some differences in terms of producers, with Swepco making large-diameter but not small-diameter pipes and Marcegaglia making small-diameter but not large-diameter pipes.43 Althoughdomestic producers tend to specialize in certain size ranges, the record indicates that *** does produce***.44
Producer/Customer Perceptions. Silbo argues that in all the years the company has been inbusiness, it was not aware of any distinction between small- and large-diameter pipes above and below 14inches in outside diameter.45 Petitioners argue that, because of differences in manufacturing processes,producers view small- and large-diameter pipes as different products. They assert that customers alsoview the products differently because the large-diameter pipes are typically made for a specific customerand have correspondingly longer wait times, whereas small-diameter pipes made on a continuous processare stockpiled and sold by distributors from inventory.46
Price. Petitioners argue that differences in the machines and the machine and labor time used toproduce small- and large-diameter pipes contribute to higher per-unit costs and prices for large-diameterthan small-diameter pipes.47 The record indicates that large-diameter pipes are priced higher than small-diameter pipes and that small-diameter pipes are sold based on price lists from which discounts may betaken. For large-diameter pipes, industry price lists are not used and price discounts are less common.48
Conclusion: Most of the factual information in the record relevant to the domestic like producthas been submitted by petitioners and not rebutted by Silbo or any subject producers. Based on thislimited record, we find that there are some similarities between small- and large-diameter pipes to theextent that they are made to the same ASTM specifications, but that differences in manufacturingprocesses affecting the tolerances, seams, and other features limit interchangeability between theproducts. There is also limited overlap between the products in terms of manufacturers, manufacturingequipment, and employees, consisting of ***. Small-diameter pipes are generally sold to distributors andinventoried, whereas large-diameter pipes are generally sold directly for distinct end uses to end usersand/or for specific projects. Prices and pricing practices also differ between small- and large-diameterpipe products. In light of these facts, based on the current record and for purposes of the preliminaryphase of these investigations we define one domestic like product that is coextensive with the scope and

49 Chairman Pearson notes that in the original 1991-92 investigations involving welded stainless steel pipes fromKorea and Taiwan (where the scope was limited to ASTM A-312 pipes regardless of outside diameter), theCommission concluded that the domestic like product was not limited to products within the scope but consisted ofall welded stainless steel pipes and tubes, except for grade 409 tubes and mechanical tubing. The Commissionreaffirmed this finding in the first five-year reviews of those orders. In the second five-year reviews, however, theCommission decided to limit the domestic like product definition to ASTM A-312 and ASTM A-778 pipes (again,regardless of outside diameter), and did not include tubing in the domestic like product. While Chairman Pearsonconcurs with his colleagues in determining that, for purposes of the preliminary phase of these investigations, thedomestic like product should be defined coextensive with the scope, he notes that this will be the third differentdomestic like product definition that the Commission has applied to what is essentially the same imported product. Accordingly, in any final phase of these investigations, Chairman Pearson intends to revisit the issue of whether thedomestic like product should be expanded beyond the scope to include not only welded stainless steel pressure pipesof greater than 14 inches in outside diameter but also welded stainless steel tubular products other than grade 409tubes and mechanical tubing. 50 19 U.S.C. § 1677(4)(A). 51 United States Steel Group v. United States, 873 F. Supp. 673, 681-84 (Ct. Int’l Trade 1994), aff’d, 96 F.3d1352 (Fed. Cir. 1996). 52 See, e.g., Petitions, Vol. I at 2. The domestic industry captively consumes only limited quantities of WSSpressure pipe. See, e.g., Confer. Tr. at 61 (Boling, Henke, Cornelius, Avento, Schagrin); CR at III-5 n.7; PR at III-3n.7. 53 We must determine whether any producer of the domestic like product should be excluded from the domesticindustry pursuant to 19 U.S.C. § 1677(4)(B), which allows the Commission, if appropriate circumstances exist, toexclude from the domestic industry producers that are related to an exporter or importer of subject merchandise orwhich are themselves importers. No party argues, and there is no evidence on the current record, that any domesticproducer is related to any producer, exporter, or importer of subject merchandise in China or that any domesticproducer imported or purchased any subject merchandise from China. See, e.g., CR at III-8; PR at III-4; CR/PRTable III-1; Confer. Tr. at 56-57 (Schagrin). Accordingly, we do not find any domestic producer to be a relatedparty. 54 See, e.g., CR/PR at Table III-1.
10
consists of small-diameter welded pressure pipe. We intend to revisit this issue in any final phaseinvestigations and urge the parties to provide any additional information at the time that comments on thedraft questionnaires are submitted.49
IV. DOMESTIC INDUSTRY
The domestic industry is defined as the “producers as a {w}hole of a domestic like product, orthose producers whose collective output of a domestic like product constitutes a major proportion of thetotal domestic production of the product.”50 In defining the domestic industry, the Commission’s generalpractice has been to include in the industry all domestic production of the domestic like product, whethertoll-produced, captively consumed, or sold in the domestic merchant market.51
Petitioners request that the Commission define the domestic industry as all U.S. producers ofWSS pressure pipe.52 Silbo does not argue otherwise. Consistent with our definition of the domestic likeproduct, we define the domestic industry as including all domestic producers of WSS pressure pipe,53 i.e.,the *** for which we have reported data: ***.54

55 Pursuant to Section 771(24) of the Act, imports from a subject country of merchandise corresponding to adomestic like product that account for less than 3 percent of all such merchandise imported into the United Statesduring the most recent 12 months for which data are available preceding the filing of the petition shall be deemednegligible. 19 U.S.C. §§ 1671b(a), 1673b(a), 1677(24)(A)(i)(I). For purposes of determining negligibility andmeasuring the volume of imports and apparent U.S. consumption, we base imports into the United States on officialimport statistics from Commerce, as modified to exclude mechanical tubing, and as modified, based on questionnaireresponses, to include WSS pressure pipe imported under broader HTSUS categories and to exclude both WSSpressure pipe over 14 inches in diameter. In computing total import volume, we did not include imports fromCanada into the United States because the overwhelming majority of these imports consist of products that do notcorrespond to the scope of these investigations. See, e.g., CR at I-4 & n.5, IV-1 & n.5; PR at I-3 & n.5, IV-1 & n.5;Petitioners’ Postconf. Br. at 10 n.1. For purposes of deciding negligibility, the Commission is authorized to make“reasonable estimates on the basis of available statistics” of pertinent import levels. 19 U.S.C. § 1677(24)(C); seealso Uruguay Round Agreements Act, Statement of Administrative Action, H.R. Doc. No. 103-316, Vol. 1 at 186(1994) (“SAA”). Subject imports from China were well above three percent of total imports for the most recent 12-month period preceding the filing of the petitions (calendar year 2007), and no party argues to the contrary. Basedon the adjusted data, subject imports from China accounted for 51.1 percent of total imports of the merchandise intothe United States, by quantity, in that period. See, e.g., CR at IV-1; PR at IV-1; CR/PR at Table IV-2. Consequently, we find that subject imports from China are not negligible. 56 See, e.g., Confer. Tr. at 62-63 (Schagrin), 106 (Jakob for Silbo); CR at II-5; PR at II-4. Consistent with ourfinding that demand for WSS pressure pipe is derived from demand for its end-use applications, and in light of thewide variety of distinct industries in which WSS pressure pipe is used, we do not find that the WSS pressure pipemarket is characterized by a regular and measurable business cycle. Although the various industries that use WSSpressure pipe may each be characterized by a specific business cycle, WSS pressure pipe producers respond to theindividual business cycles of several different downstream industries. 57 See, e.g., CR/PR at Table IV-5. 58 See, e.g., Confer. Tr. at 6 (Schagrin), 16 (Cornelius for Marcegaglia). 59 See, e.g., Confer. Tr. at 98 (Jakob for Silbo). 60 When asked if demand for WSS pressure pipe had changed since January 1, 2005, three of the four respondingU.S. producers reported that U.S. demand had increased from 2 to 5 percent per year and that this increase wasdriven by economic expansion and higher per capita consumption of stainless steel. One U.S. producer indicatedthat during the recent expansion cycle in the United States, all the growth in demand was captured by imports from
11
V. CONDITIONS OF COMPETITION AND THE BUSINESS CYCLE55
Several conditions of competition inform our analysis in the preliminary phase of theseinvestigations.
A. Demand Considerations
Demand for WSS pressure pipe is derived from the demand of the downstream industries thatconsume the product, such as the pharmaceutical, food, petrochemical, refinery, and energy industries.56 During the period of investigation, demand, as measured by total apparent U.S. consumption (the sum ofthe domestic industry’s U.S. shipments and imports from subject and non-subject countries of WSSpressure pipe) increased from *** short tons in 2005 to *** short tons in 2006 and *** short tons in2007.57 Petitioners assert that demand for WSS pressure pipe increased during the period of investigationas the chemical, refinery, petrochemical, energy, and ethanol industries either retrofitted or expanded inthe midst of a strong U.S. economy, stronger exports due to a weak dollar, and a strong energy market,including rapid expansion of ethanol plants.58 Silbo concurs that demand for stainless steel products ingeneral and pipe in particular was strong throughout the period of investigation.59 Questionnairerespondents generally agreed.60 Evidence on the current record suggests that demand may have peaked

China. Another U.S. producer reported no change in demand. Six of ten responding importers reported that U.S.demand had increased, two reported that demand had fluctuated, and one reported that demand had decreased. Reasons given for the increase in demand were higher per-capita consumption and growing demand for renewablefuels (resulting in construction of ethanol and bio-diesel plants). High domestic prices for domestically producedWSS pressure pipe were given as the primary reason for declining U.S. demand. One importer reported that demandappeared to have declined over the last few months of 2007 and indicated that there had been an increase in demandin China and other developing countries. See, e.g., CR at II-6; PR at II-4. 61 Petitioners argue that, since the end of 2007, demand has flattened or declined because of the downturn in theeconomy and because of the slowing pace of construction of ethanol plants. See, e.g., Confer. Tr. at 12 (Boling forBristol Metals), 62-63 (Schagrin), 126 (Schagrin); see also, e.g., Confer. Tr. at 98, 104 (Jakob for Silbo). 62 See, e.g., CR/PR at Table I-4. 63 See, e.g., Confer. Tr. at 12 (Boling for Bristol Metals), 107 (Jakob for Silbo). 64 See, e.g., Petitions at Exh. I-6. 65 See, e.g., CR at VII-3 to VII-4; PR at VII-2 to VII-3. 66 See, e.g., CR at IV-1; PR at IV-1; CR/PR at Table IV-1. 67 See, e.g., CR at IV-4; PR at IV-1; CR/PR at Table IV-3. 68 See, e.g., CR/PR at Table I-1 at nn.2-3. 69 See, e.g., CR/PR at Table I-1 at n.3.
12
toward the end of the period of investigation.61 In any final phase investigations, we intend to explore thisissue further.
Whether domestically produced or imported into the U.S. market, the vast majority of WSSpressure pipe is sold to distributors.62 There are approximately 12 major distributors in the U.S. market,many if not all of which stock Chinese as well as domestically produced products.63
B. Supply Considerations
There are three sources of supply in the U.S. market: imports of the subject merchandise fromChina, imports from non-subject countries, and domestic shipments.
1. Imports of Subject Merchandise from China
Petitioners identified nine potential producers/exporters of WSS pressure pipe in China.64 TheCommission sent foreign producer questionnaires to 24 firms, received one completed questionnaire, andreceived two responses from firms that reported they do not produce the subject merchandise. Theresponding foreign producer (Winner Stainless Steel Tube Co., Ltd. (“Winner Stainless”) ) estimated thatit accounts for *** percent of total exports of WSS pressure pipe from China to the United States. U.S.importers identified the following Chinese producers as sources for their imports: ***.65 The largestimporter of WSS pressure pipe from China into the United States in 2007 was ***.66
2. Non-Subject Imports
Four countries (Korea, Malaysia, Taiwan, and Thailand) consistently accounted for the largemajority of non-subject imports between 2005 and 2007.67 Imports from Korea and Taiwan into theUnited States are subject to antidumping duty orders, except for imports from Taiwan producer ChangTieh (now known as Chang Mien), which were excluded from the order on Taiwan during the originalinvestigations, and imports from Taiwan producer Ta Chen.68 The order was revoked by Commerce withrespect to Ta Chen effective June 26, 2000, for merchandise entered after December 1998.69 Imports of

70 Derived from CR/PR at Tables IV-3 and IV-5. 71 See, e.g., CR at I-3, III-1; PR at I-3, III-1; CR/PR at Table III-1. 72 See, e.g., Petitions, Vol. I at 8. 73 See, e.g., Petitions, Vol. I at 8; CR at V-1; PR at V-1. 74 See, e.g., Petitions, Vol. I at 9, Exh. I-20. 75 See, e.g., Petitions, Vol. I at 9, Exh. I-21. Nickel stabilizes the austenite structure of iron, making stainlesssteels non-magnetic and less brittle at low temperatures, whereas molybdenum prevents specific forms of corrosion. See, e.g., Petitions, Vol. I at Exh. I-19 at 3, 5. 76 See, e.g., Petitions, Vol. I at 11; Confer. Tr. at 15 (Cornelius for Marcegaglia), 17 (Henke for Felker Brothers),37-38 (Schagrin). Petitioners assert that 70 to 80 percent of the world’s molybdenum is located in China and that theGovernment of China is imposing not only export taxes but also licensing quotas on exports of molybdenum, otherferroalloys, coking coal, coke, and iron ore. Petitioners claim that the effects of these measures are to ensure that theChinese producers have first access to these materials at below market prices and to leave other potential buyersuncertain about whether they will get access to such raw materials. See, e.g., Confer. Tr. at 38-39 (Schagrin). 77 See, e.g., CR at V-1; PR at V-1; Confer. Tr. at 98 (Jakob for Silbo). Petitioners testified that energy costsassociated with natural gas and electricity, as well as health care costs, are significant and continue to escalate, butaccount for only a small percentage of actual costs. See, e.g., Confer. Tr. at 70-72 (Avento, Cornelius, Henke,Boling). 78 See, e.g., Petitions, Vol. I at 11; CR/PR at Figures V-1 and V-2, Table V-1. 79 See, e.g., Petitions, Vol. I at 11, Exhs. I-24 to I-25; CR at V-1; PR at V-1.
13
WSS pressure pipe from Taiwan increased throughout the period of investigation and by 2007 held ***percent of the U.S. market.70
3. Domestic Shipments
At least seven firms currently produce WSS pressure pipe in the United States: Bristol Metals,Felker Brothers, Marcegaglia, Outokumpu, RathGibson, Swepco, and Webco. The five producers thatsubmitted questionnaire responses (all but ***) accounted for nearly *** percent of estimated U.S.production in 2007.71
C. Raw Material Costs
The primary material inputs used to produce WSS pressure pipe are stainless steel (American Ironand Steel Institute (“AISI”) grade 304 and AISI grade 316), electricity, natural gas, and other gases suchas argon, hydrogen, nitrogen, and helium.72 During the period of investigation, stainless steel and itsrelated surcharges accounted for the majority of the cost of production for WSS pressure pipes.73 Thenickel content in the stainless steel inputs varies, from 8 to 10 percent for grade 304 and from 10 to 14percent for grade 316.74 Grade 316 also contains between 2 and 3 percent molybdenum, which is notcontained in grade 304 stainless steel.75 Because of differences in alloying costs between types ofstainless steel, international stainless steel producers add a non-negotiable alloy surcharge for elementssuch as nickel and molybdenum to the base stainless steel price. Petitioners assert, however, thatproducers in China do not use alloy surcharges.76
Since 2004, prices of raw materials and energy sources rose rapidly and substantially, anddomestic flat-rolled stainless steel producers reinstated surcharges for their products.77 During the periodof investigation, petitioners report that average alloy surcharges for nickel per metric ton of stainless steelwere approximately $3,026 for grade 304 and $3,782 for grade 316.78 Likewise, during the period ofinvestigation, average alloy surcharges for molybdenum per metric ton of stainless steel were $1,525.58for grade 316.79 As petitioners note, prices for these commodities traded daily on the London Metal

80 See, e.g., Confer. Tr. at 7 (Schagrin), 15 (Cornelius for Marcegaglia), 72-78 (Henke, Schagrin, Cornelius forPetitioners). Petitioners report that alloy surcharges for grade 304 increased 223 percent between 2004 and 2007. See, e.g., id. at 17 (Henke for Felker Brothers); CR at V-1; PR at V-1. 81 See, e.g., CR at V-6; PR at V-5 (description of pricing products). 82 See, e.g., Petitions, Vol. I at 3, 14-15. 83 See, e.g., CR at II-7 to II-8; PR at II-5; CR/PR at Table II-2. 84 See, e.g., CR at II-7; PR at II-5. 85 See, e.g., CR at II-6 to II-7; PR at II-4 to II-5.
14
Exchange fluctuated widely during the period of investigation, with the price of nickel surging from $7per pound in early 2004 to a peak of $24 per pound in mid-2007 before falling and rising again, and theprice of molybdenum nearly quadrupling from $12 per pound in 2004 to $47 per pound before settlingdown in the range of $35 per pound.80
D. Interchangeability and Other Product Considerations
WSS pressure pipes can vary significantly depending on their ASTM specifications (generally A-312 or A-778), AISI steel grade (i.e., 304/304L or 316/316L), gauge (or thickness) range, and outsidediameter.81 Petitioners assert that WSS pressure pipe is a commodity product and that WSS pressure pipefrom China is interchangeable with U.S.-produced WSS pressure pipe because both are made to identicalASTM specifications, are sold in the same channels of distribution, and are purchased based onspecification and price.82 According to questionnaire data, the four responding U.S. producers reportingknowledge of both Chinese and U.S.-produced WSS pressure pipe indicated that products from bothsources were always interchangeable. Similarly, seven importers reporting knowledge of both Chineseand U.S.-produced WSS pressure pipe reported that Chinese and U.S.-produced products were alwaysinterchangeable.83 We find subject imports and the domestic like product to be highly interchangeablewith one another when they are made to the same ASTM specification, AISI steel grade, gauge, andoutside diameter.
The cost share of WSS pressure pipe in the products in which it is used is not clear. Mostresponding domestic producers and importers of WSS pressure pipe are distributors or sell to distributors,and hence they were unable to provide useful information regarding the share of downstream productcosts accounted for by WSS pressure pipe.84
There appear to be some products that may be substituted for WSS pressure pipe in some of itsvarious end-use applications. Four of five responding domestic producers reported that there are directsubstitutes for WSS pressure pipe, whereas the fifth domestic producer and the one responding importerreported no substitutes. The most frequently mentioned substitutes were coated carbon steel pipe,fiberglass reinforced plastics, high-density polyethylene, seamless stainless steel pressure pipe, and othernickel-chromium-based alloys. One domestic producer indicated that coated carbon steel pipe could beused as a substitute in energy and petrochemical applications, whereas another indicated that substitutesfind their way into the market when prices for stainless steel are high. These substitutes reportedly haveshorter installed lives; nonetheless, in recent years, they have replaced stainless steel pipe in waste-watertreatment projects and in pulp and paper plants.85

86 19 U.S.C. §§ 1671b(a), 1673b(a). 87 19 U.S.C. § 1677(7)(B)( i). The Commission “may consider such other economic factors as are relevant to thedetermination” but shall “identify each {such} factor ... {and} explain in full its relevance to the determination.” 19 U.S.C. § 1677(7)(B); see also, e.g., Angus Chem. Co. v. United States, 140 F.3d 1478 (Fed. Cir. 1998). 88 19 U.S.C. § 1677(7)(A). 89 19 U.S.C. § 1677(7)(C)(iii). 90 19 U.S.C. § 1677(7)(C)(iii). 91 19 U.S.C. § 1677(7)(C)(i). 92 See, e.g., CR/PR at Table C-1. Silbo argues that the annual data obscure a slowdown in subject imports fromChina in the second half of 2007. See, e.g., Confer. Tr. at 103-04 (Jakob for Silbo). On the other hand, petitionerspoint to recent U.S. licensing data for Chinese producers, which show an upturn of more than 50 percent betweenDecember 2007 and January 2008, as indicating that imports from China are increasing. See, e.g., Confer. Tr. at 126(Schagrin); Petitioners’ Postconf. Br. at Exh. 4. Even Silbo speculates that the apparent decline simply reflectsinventory corrections made by overstocked U.S. distributors due to rather severe downturns in projects using pipes. See, e.g., Confer. Tr. at 103-04 (Jakob for Silbo).
15
VI. VIEWS OF COMMISSIONER LANE, COMMISSIONER WILLIAMSON, ANDCOMMISSIONER PINKERT FINDING A REASONABLE INDICATION OFMATERIAL INJURY BY REASON OF SUBJECT IMPORTS FROM CHINA
In the preliminary phase of antidumping or countervailing duty investigations, the Commissiondetermines whether there is a reasonable indication that an industry in the United States is materiallyinjured by reason of the imports under investigation.86 In making this determination, the Commissionmust consider the volume of subject imports, their effect on prices for the domestic like product, and theirimpact on domestic producers of the domestic like product, but only in the context of U.S. productionoperations.87 The statute defines “material injury” as “harm which is not inconsequential, immaterial, orunimportant.”88 In assessing whether there is a reasonable indication that the domestic industry ismaterially injured by reason of subject imports, we consider all relevant economic factors that bear on thestate of the industry in the United States.89 No single factor is dispositive, and all relevant factors areconsidered “within the context of the business cycle and conditions of competition that are distinctive tothe affected industry.”90 For the reasons stated below, we determine that there is a reasonable indicationthat the domestic industry producing WSS pressure pipe is materially injured by reason of subject importsfrom China that are allegedly subsidized and sold at less than fair value in the United States.
A. Volume of Subject Imports from China
Section 771(7)(C)(I) of the Act provides that the “Commission shall consider whether the volumeof imports of the merchandise, or any increase in that volume, either in absolute terms or relative toproduction or consumption in the United States, is significant.”91 For purposes of the preliminary phaseof these investigations, we find that the volume of subject imports and the increase in that volume aresignificant during the period of investigation both in absolute terms and relative to consumption andproduction in the United States.
In absolute terms, the volume of subject imports from China more than doubled over the periodof investigation, increasing from 14,486 short tons in 2005 to 23,751 short tons in 2006 and 30,574 shorttons in 2007.92 By the end of the period of investigation, the volume of subject imports from China hadsurpassed the domestic industry’s production level. The domestic industry’s production increased from
93 See, e.g., CR/PR at Table C-1. Therefore, as a ratio to domestic production, subject imports from Chinaincreased from *** percent in 2005 to *** percent in 2006 and *** percent in 2007. See, e.g., CR/PR at Table IV-6. 94 See, e.g., CR/PR at Table C-1. 95 See, e.g., CR/PR at Table C-1. 96 See, e.g., CR/PR at Table C-1. 97 See, e.g., CR/PR at Table C-1. 98 19 U.S.C. § 1677(7)(C)(ii). 99 See, e.g., CR at V-6; PR at V-5. 100 When asked about non-price differences between U.S.- and Chinese-produced WSS pressure pipe, three offive domestic producers reported that they are never a factor, one reported that they are sometimes a factor, and onereported that non-price differences are always a factor. Of the eight responding importers, one reported that non-price differences are never a factor, two reported that they are sometimes a factor, two reported that they arefrequently a factor, and three reported that they are always a factor. See, e.g., CR at II-9; PR at II-6; CR/PR at TableII-3. We intend to explore the importance of non-price factors in any final phase investigations.
16
*** short tons in 2005 to *** short tons in 2006 before declining to *** short tons in 2007, below itsproduction level for 2005.93
The share of apparent U.S. consumption held by subject imports, by quantity, increased by ***percentage points from 2005 to 2007, rising from *** percent in 2005 to *** percent in 2006, beforeincreasing further to *** percent in 2007.94 Non-subject imports had a relatively stable market share interms of quantity and value.95 Non-subject imports’ share of the U.S. market, by quantity, declined from*** percent in 2005 to *** percent in 2006, and then increased to *** percent in 2007.96
Consequently, the increase in subject import volume came almost entirely at the expense of thedomestic industry. Although total apparent U.S. consumption increased by *** percent from 2005 to2007, the overall volume shipped and the market share held by the domestic industry fell. The domesticindustry’s share of apparent U.S. consumption, by quantity, declined from *** percent in 2005 to ***percent in 2006 and *** percent in 2007, an overall decrease of *** percentage points.97
We find for purposes of the preliminary phase of these investigations that the volume of subjectimports and the increase in that volume during a period of increasing apparent U.S. consumption aresignificant during the period of investigation, both in absolute terms and relative to consumption andproduction in the United States.
B. Price Effects of the Subject Imports from China
Section 771(C)(ii) of the Act provides that, in evaluating the price effects of subject imports, the Commission shall consider whether – (I) there has been significant price undersellingby the imported merchandise as compared with the price of domestic like products of theUnited States, and (II) the effect of imports of such merchandise otherwise depressesprices to a significant degree or prevents price increases, which otherwise would haveoccurred, to a significant degree.98
As we found above, when the products are made to the same ASTM specification, AISI steelgrade, gauge, and outside diameter, there is a high degree of interchangeability between the domestic likeproduct and subject imports from China. The vast majority of WSS pressure pipe sales in the U.S.market, whether of domestically produced or imported WSS pressure pipe, are made through spot sales,and the remainder are through short-term contracts.99 According to the record in the preliminary phase ofthese investigations, price is a relatively important factor in purchasing decisions.100

101 These products are: (1) ASTM A-312, welded, grade AISI 304/304L pipe, 1-inch schedule 40; (2) ASTM A-312, welded, grade AISI 304/304L pipe, 2-inch schedule 40; (3) ASTM A-312, welded, grade AISI 304/304L pipe,0.5-inch schedule 10; (4) ASTM A-312, welded, grade AISI 304/304L pipe, 6-inch schedule 10; and (5) ASTM A-312, welded, grade AISI 316/316L pipe, 2-inch schedule 40. See, e.g., CR at V-7 to V-8; PR at V-6. 102 See, e.g., CR/PR at Tables V-2 to V-6. Subject imports undersold the domestic like product in 10 of 12comparisons for product 1, with the margins of underselling ranging from 7.4 percent to 30.2 percent. See, e.g.,CR/PR at Table V-2. For product 2, subject imports undersold the domestic like product in 10 of 12 comparisons,with the margins of underselling ranging from 8.6 to 27.2 percent. See, e.g., CR/PR at Table V-3. For product 3,subject imports undersold the domestic like product in 11 of 12 comparisons, with the margins of undersellingranging from 10.4 to 45.9 percent. See, e.g., CR/PR at Table V-4. For product 4, subject imports undersold thedomestic like product in 10 of 12 comparisons, with the margins of underselling ranging from *** to 23.7 percent. See, e.g., CR/PR at Table V-5. For product 5, subject imports undersold the domestic like product in 8 of 12comparisons, with the margins of underselling ranging from 5.2 to 24.5 percent. See, e.g., CR/PR at Table V-6. 103 The Commission confirmed each of the alleged lost sales allegations involving approximately $*** in lostsales and confirmed lost revenues of approximately $*** over the period of investigation. See, e.g., CR/PR atTables V-8 to V-9. 104 See, e.g., CR/PR at Tables V-2 to V-6. 105 See, e.g., Confer. Tr. at 99-101, 115-16 (Jakob for Silbo). 106 See, e.g., CR/PR at Figure V-2; Petitions at Exh. I-25.
17
Five domestic producers and six importers of subject merchandise provided quarterly net U.S.f.o.b. selling price data for five WSS pressure pipe products.101 The pricing data collected in thepreliminary phase of these investigations show pervasive underselling at large margins by subject importsfrom China throughout much of the period of investigation.102 Thus, we find that there has beensignificant underselling of the domestic like product by subject imports from China. We also note thatthe record includes a number of confirmed instances where the domestic industry lost sales and revenuesto low-priced imports.103 Additionally, as discussed above, subject imports from China increased marketshare at the expense of the domestic industry during the period of investigation.
We acknowledge that there was some overselling of the domestic like product by subject importsfrom China toward the end of the period of investigation (the final two quarters of 2007 for products 1, 2,and 4; the final quarter of 2007 for product 3; and the final three quarters of 2007 for product 5).104 In anyfinal phase investigations, we intend to explore the extent to which this overselling may relate todifferences in how the subject imports from China are priced relative to the domestic like product. Silbo,an importer that accounted for *** percent of subject imports from China in 2007, negotiates non-revocable contracts with Chinese suppliers that set prices for deliveries made five to six months later, andSilbo concurrently negotiates non-revocable contracts with purchasers in the United States for deliveryfive to six months later. In contrast, domestic producers reportedly sell their products at prices prevailingat the time of the sale, and these selling prices reflect any prevailing alloy surcharges.105 Although nickelprices climbed between 2006 and the first half of 2007, they then fell dramatically before beginning torise again at the end of 2007.106 Thus, the observed price differentials might reflect the domesticindustry’s response at the time of shipment to trends in nickel and other alloy surcharges as compared tosubject imports from China for which prices were established a number of months earlier. We intend toexamine selling practices in the U.S. market in greater depth in any final phase investigations, particularlythe extent to which there are differences in how imported products are priced relative to the domestic likeproduct, and the impact of these practices in the U.S. market.

107 Prices for U.S.-produced product 1 (ASTM A-312, welded, grade AISI 304/304L pipe, 1-inch schedule 40)increased by *** percent between the first quarter of 2005 and the second quarter of 2007 but then declined in eachof the following two quarters. Prices of U.S. shipments of product 1 imported from China increased by 112.7percent between the first quarter of 2005 and the third quarter of 2007 before declining in the final quarter of 2007. See, e.g., CR at V-16; PR at V-13; CR/PR at Table V-2. Prices for U.S.-produced product 2 (ASTM A-312, welded,grade AISI 304/304L pipe, 2-inch schedule 40) increased irregularly by 59.0 percent between the first quarter of2005 and the last quarter of 2006 and then declined through the remainder of the period. Prices of U.S. shipments ofproduct 2 imported from China increased irregularly by 72.1 percent from the first quarter of 2005 through the thirdquarter of 2007 before declining through the rest of the period. See, e.g., CR at V-16 to V-17; PR at V-13; CR/PR atTable V-3. Prices for U.S.-produced product 3 (ASTM A-312, welded, grade AISI 304/304L pipe, 0.5-inchschedule 10) increased by *** percent from the first quarter of 2005 to the second quarter of 2007 before decliningthrough the remainder of 2007. Prices of U.S. shipments of product 3 imported from China increased by *** percentfrom 2005 to 2007. See, e.g., CR at V-16 to V-17; PR at V-13; CR/PR at Table V-4. Prices for U.S.-producedproduct 4 (ASTM A-312, welded, grade AISI 304/304L pipe, 6-inch schedule 10) increased by 67.7 percent from thefirst quarter of 2005 through the second quarter of 2007 before declining through the remainder of 2007. Prices ofU.S. shipments of product 4 imported from China increased by *** percent from 2005 to 2007. See, e.g., CR at V-16 to V-17; PR at V-13; CR/PR at Table V-5. Prices for U.S.-produced product 5 (ASTM A-312, welded, gradeAISI 316/316L pipe, 2-inch schedule 40) increased by 38.1 percent between the first quarter of 2005 and the lastquarter of 2006 before declining through the remainder of the period. Prices of U.S. shipments of product 5imported from China increased by 35.4 percent from the first quarter of 2005 to the third quarter of 2007 beforedeclining through the rest of the period. See, e.g., CR at V-16 to V-17; PR at V-13; CR/PR at Table V-6. 108 See, e.g., CR/PR at Table C-1. 109 See, e.g., CR/PR at Table C-1.
18
We have also considered movements in WSS pressure pipe prices over the period ofinvestigation.107 Given the general increases in the domestic industry’s prices over the period ofinvestigation, we do not find for purposes of the preliminary phase of these investigations that subjectimports from China significantly depressed prices of the domestic like product in the U.S. market.
Regarding possible suppression of prices, although prices increased during the period ofinvestigation, the domestic industry’s average unit cost of goods sold (“COGS”) also increased from $***per short ton in 2005 to $*** per short ton in 2006 and $*** per short ton in 2007, an increase of ***percent over the period of investigation or *** percent just between 2006 and 2007.108 Nevertheless, thedomestic industry’s COGS as a share of net sales declined from *** percent in 2005 to *** percent in2006 before increasing somewhat to *** percent in 2007.109 Thus, notwithstanding the significantincrease in COGS associated with dramatic increases in nickel and molybdenum costs, the domesticindustry appears to have been able to raise prices as its costs increased, although this may have abatedsomewhat at the end of the period of investigation. It is not clear from the preliminary record whetherU.S. prices were suppressed below the levels that the domestic industry would have attained in theabsence of the subject imports from China, given the strong growth in demand during the period ofinvestigation. The record, however, does reflect conditions of competition that would encourage pricesuppression, especially the interchangeability of the domestic like product and subject imports fromChina, the pervasive underselling of the domestic like product by subject imports from China at largemargins, and the loss of domestic industry sales to subject imports from China. We intend to furtherexplore the issue of price suppression in any final phase investigations.
For these reasons, for purposes of the preliminary phase of these investigations, we find thatsubject imports significantly undersold the domestic like product. We intend to seek further informationon the price effects of the subject imports from China in any final phase investigations, includinginformation regarding potential price depression or suppression.

110 In its notice of initiation, Commerce estimated the dumping margin for subject imports from China to rangefrom 8.36 to 12.70 percent ad valorem, based on a comparison of export price and normal value. See, e.g., 73 Fed.Reg. at 10224. In its notice of initiation, Commerce indicated that it would investigate sixteen programs alleged inthe petitions to have provided countervailable subsidies to producers of WSS pressure pipe in China: onepreferential lending program (loans and export credits pursuant to the Northeast Revitalization Program), sevenincome tax programs (the “Two Free, Three Half” program; income tax reductions for export-oriented foreigninvestment enterprises (“FIEs”); reduced income tax rate for FIEs located in Economic and TechnologicalDevelopment Zones and other special economic zones; income tax credit or refund for reinvestment of FIE profits;provincial and local tax exemptions and reductions for productive FIEs; local income tax reductions in certaindevelopment zones; and preferential tax policies for research and development at FIEs), two indirect tax and importtariff programs (value-added tax refunds on purchases of domestically produced equipment by FIEs; and tax creditson purchases of domestically produced equipment by domestically owned companies), three provincial subsidyprograms (Guangdong Province’s “Outward Expansion” program; preferential loans pursuant to Liaoning Province’sFive-Year Framework; and preferential tax policies for Town and Village Enterprises (“TVEs”)), two programsinvolving the provision of goods or services for less than adequate remuneration (provision of stainless steel coil forless than adequate remuneration; and provision of land use rights for less than adequate remuneration); and oneprogram involving government restraints on exports (export restraints on flat-rolled steel). See, e.g., 73 Fed. Reg. at9996. 111 19 U.S.C. § 1677(7)(C)(iii); see also SAA at 851 and 885 (“In material injury determinations, the Commissionconsiders, in addition to imports, other factors that may be contributing to overall injury. While these factors, insome cases, may account for the injury to the domestic industry, they also may demonstrate that an industry is facingdifficulties from a variety of sources and is vulnerable to dumped or subsidized imports.”) 112 19 U.S.C. § 1677(7)(C)(iii); see also SAA at 851, 885; Live Cattle from Canada and Mexico, Invs. Nos. 701-TA-386, 731-TA-812-813 (Prelim.), USITC Pub. 3155 at 25 n.148 (Feb. 1999). 113 See, e.g., CR/PR at Table C-1. *** accounted for almost all of the decrease in production, with ***. See,e.g., CR at III-3; PR at III-1. 114 The domestic industry’s U.S. shipments of WSS pressure pipe increased from *** short tons in 2005 to ***short tons in 2006 and then declined to *** short tons in 2007. See, e.g., CR/PR at Table C-1. Exports, which werea *** share of the domestic industry’s total shipments, also declined by *** percent over this same period. U.S.export shipments of WSS pressure pipe declined from *** short tons in 2005 to *** short tons in 2006 and *** short
19
C. Impact of the Subject Imports from China110
Section 771(7)(C)(iii) provides that the Commission, in examining the impact of the subjectimports on the domestic industry, “shall evaluate all relevant economic factors which have a bearing onthe state of the industry.”111 These factors include output, sales, inventories, capacity utilization, marketshare, employment, wages, productivity, profits, cash flow, return on investment, ability to raise capital,research and development, and factors affecting domestic prices. No single factor is dispositive and allrelevant factors are considered “within the context of the business cycle and conditions of competitionthat are distinctive to the affected industry.”112
We have examined performance indicia for the domestic industry producing WSS pressure pipe. Overall, the record in the preliminary phase of these investigations indicates that production-relatedperformance factors generally declined over the period of investigation despite high demand, whereasfinancial-related performance factors increased over the period of investigation but ***, as furtherexplained below. Even those levels of profitability are largely attributable to domestic producers’earnings generated from surcharges related to escalating prices for major stainless steel inputs such asnickel and molybdenum.
The domestic industry’s production of WSS pressure pipe increased from *** short tons in 2005to *** short tons in 2006, but then declined to *** short tons in 2007 to a level lower than in 2005.113 Itstotal U.S. shipments of WSS pressure pipe declined by *** percent from 2005 through 2007.114
tons in 2007. See, e.g., CR/PR at Table C-1. 115 The domestic industry’s end-of-period inventories of WSS pressure pipe increased from *** short tons in2005 to *** short tons in 2006 but then declined to *** short tons in 2007. See, e.g., CR/PR at Table C-1. 116 See, e.g., CR/PR at Table C-1. These data show an increase in production capacity of *** percent between2005 and 2007. ***. See, e.g., CR at III-2 to III-3; PR at III-1. 117 See, e.g., CR/PR at Table C-1. ***. See, e.g., CR at III-3; PR at III-1. 118 See, e.g., CR/PR at Table C-1. For example, Bristol Metals indicated that in the last several months it has notutilized four of its eight continuous-welding mills or has only produced with limited shifts at those mills, because ofdeclining orders due to increased imports of subject merchandise from China; as a result, the company has cut backon its employees’ work hours and suffered financial difficulties associated with lower capacity utilization levels. See, e.g., Confer. Tr. at 10-11 (Boling for Bristol Metals). Although Mr. Boling testified that Bristol Metals hasreduced production in facilities that produce between ½-inch and 10-inch ranges, he explained that the biggestimpact from subject imports from China has been in the 6- to 8-inches and smaller ranges. See, e.g., Confer. Tr. at64-65 (Boling for Bristol Metals). Mr. Avento testified that Outokumpu largely shut down its south plant where itproduces 6-inch and smaller pipe due to subject imports from China, but it is still producing the larger sizes at itsnorth plant. See, e.g., Confer. Tr. at 65-66 (Avento for Outokumpu). By contrast, Mr. Cornelius testified thatMarcegaglia produces ½ -inch to 12-inch products but has seen subject imports from China competing with thecompany’s entire range of products. See, e.g., Confer. Tr. at 66 (Cornelius for Marcegaglia). Likewise, Mr. Henketestified that Felker Brothers has seen competition from subject imports from China in the 2-inch to 12-inchdimensions, and his company has struggled to cross-train its employees to produce other sizes of pipe products inorder to try to keep these workers. See, e.g., Confer. Tr. at 66-67 (Henke for Felker Brothers). 119 The average number of production and related workers and the domestic industry’s productivity increasedbetween 2005 and 2006, but declined between 2006 and 2007, although wages declined between 2005 and 2006 thenimproved between 2006 and 2007. The average number of production and related workers increased from *** in2005 to *** in 2006, before decreasing to *** in 2007. See, e.g., CR/PR at Table C-1. Productivity increased from*** tons/1,000 hours in 2005 to *** tons/1,000 hours in 2006, then declined to *** tons/1,000 hours in 2007. See,e.g., id. Hourly wages decreased from $*** in 2005 to $*** in 2006, before increasing to $*** in 2007. See, e.g.,id. 120 See, e.g., CR/PR at Table C-1. Net sales measured by quantity increased from *** short tons in 2005 to ***short tons in 2006 and then declined to *** short tons in 2007. See, e.g., CR/PR at Table C-1. Net sales measuredby value increased from $*** in 2005 to $*** in 2006, and $*** in 2007. See, e.g., CR/PR at Table C-1. 121 See, e.g., CR/PR at Table C-1.
20
The domestic industry’s end-of-period inventories of WSS pressure pipe decreased by ***percent from 2005 through 2007.115 The domestic industry’s average production capacity increased from*** short tons in 2005 to *** short tons in 2006 and *** short tons in 2007.116 We intend to examinecapacity utilization levels more closely in any final phase investigations, because reported capacityutilization levels for the domestic industry as a whole appear to be low. Moreover, there are largedisparities among the capacity utilization levels reported by individual domestic producers, which raisesquestions as to the consistency of the methodology used to calculate capacity utilization.117 As a result,for purposes of the preliminary phase of these investigations, we have placed more weight on capacityutilization trends than on capacity utilization levels. The domestic industry’s capacity utilizationincreased from *** percent in 2005 to *** percent in 2006 and then declined to *** percent in 2007.118 This decline of *** percentage points in capacity utilization between 2006 and 2007 is striking given thereportedly strong demand prevailing in the U.S. market at the time.119
The domestic industry’s net sales declined by *** percent from 2005 to 2007 when measured byquantity, but increased by *** percent over the same period when measured by value.120 As discussedpreviously, the domestic industry’s average unit COGS increased from $*** per short ton in 2005 to $***per short ton in 2006 and $*** per short ton in 2007, an increase of *** percent over the period ofinvestigation or *** percent just between 2006 and 2007.121 Nevertheless, the domestic industry’s COGS
122 See, e.g., CR/PR at Table C-1. 123 See, e.g., CR at VI-3 to VI-4; PR at VI-1; CR/PR at Figures V-1 to V-2, Table VI-2. 124 See, e.g., CR/PR at Table C-1. 125 See, e.g., CR/PR at Table C-1. 126 See, e.g., CR at VI-13; PR at VI-4; CR/PR at Tables VI-1, VI-5. The domestic industry’s capital expendituresdeclined from $*** in 2005 to $*** in 2006, before increasing to $*** in 2007. See, e.g., CR/PR at Table C-1. 127 See, e.g., CR/PR at Table VI-5. 128 Petitioners argue that, during the period of investigation, they purchased coiled stainless steel and fortuitouslybooked the raw material costs (base price plus alloy surcharges for the coiled stainless steel) at the date theypurchased the raw materials. Because of a slowdown of pipe orders due to competition with subject imports fromChina and a concurrent escalation in alloy surcharges for nickel and molybdenum, when domestic producerseventually did sell limited quantities of pipe products several months later, domestic producers benefitted from thethen-prevailing high surcharges for nickel and molybdenum that they could pass along to their pipe customers. Inother words, petitioners argue that even though domestic producers were not selling as much, due to “inventorygains” associated with increases in nickel and/or molybdenum costs, they made some profits. See, e.g., Confer. Tr.at 7-8, 72-78 (Schagrin). As described in the staff report, the data reported by the domestic industry are consistentwith petitioners’ argument that their profitability in 2006 and 2007 reflects their ability to pass along the generallyincreasing cost surcharges that prevailed during this period and that they benefitted from these increasing surcharges. See, e.g., CR at VI-3 to VI-7; PR at VI-1 to VI-2, VI-4; CR/PR at Figures V-1 to V-2; Tables VI-2, C-1.
21
as a share of net sales declined from *** percent in 2005 to *** percent in 2006 before increasingsomewhat to *** percent in 2007.122 Thus, notwithstanding the significant increase in COGS due at leastin part to dramatic increases in nickel and molybdenum costs, the domestic industry generally was able toraise prices as its costs increased, although to a lesser degree at the end of the period of investigation.123 Again, the domestic industry’s declining ability to keep pace with large cost increases at the end of theperiod in a time of strong demand warrants further examination in any final phase investigations.
On the surface, the domestic industry’s financial indicators appeared to improve during the periodof investigation. The domestic industry turned a $*** operating loss in 2005 into $*** in operatingprofits in 2006 before further improving to a positive $*** in 2007.124 The domestic industry’s ratio ofoperating income to sales increased by *** percentage points from 2005 to 2007. The domesticindustry’s operating income margin improved from a *** percent loss in 2005 to a *** percent profit in2006 and a *** percent profit in 2007.125 Capital expenditures were ***, an indication that the domesticindustry ***.126 *** research and development expenses.127 Significantly, however, the domesticindustry’s ability to obtain even this level of profitability during a period of high demand depended onwhat petitioners term the “inventory gains” earned on the large price swings in the major cost componentsof stainless steel. The returns fortuitously earned on surcharges for these commodities mask domesticproducers’ otherwise poor profitability.128
In summary, the domestic industry suffered from lower U.S. shipments, lower capacity utilizationlevels, and lost sales and lost revenues due to increasing volumes of subject imports from China during aperiod in which apparent U.S. consumption increased by *** percent. The industry only showed positivefinancial performance as a result of the “inventory gains” afforded by the concurrent escalation in pricesfor commodity inputs. Given our finding of a significant volume and a significant increase in the volumeof subject imports from China during a period of increasing apparent U.S. consumption, our finding ofsignificant underselling by subject imports from China, our findings concerning the declines in thedomestic industry’s performance during the period of investigation, we find for purposes of our
129 We note that there is limited information on the record regarding the role of non-subject imports of WSSpressure pipe in the U.S. market. In any final phase investigations, we will seek information on the role of non-subject imports of WSS pressure pipe in the U.S. market. We invite parties to comment in any final phaseinvestigations on whether Bratsk Aluminum Smelter v. United States, 444 F.3d 1369 (Fed. Cir. 2006), is applicableto the facts of these investigations. We also invite parties to comment on what additional information theCommission should collect to address the issues raised by the Court, how that information should be collected, andwhich of the various non-subject sources should be the focus of additional information gathering by the Commissionin any final phase investigations. 130 19 U.S.C. § 1677(7)(F)(ii). 131 19 U.S.C. § 1677(7)(F)(ii). 132 19 U.S.C. § 1677(7)(F)(i).
22
preliminary determinations in these investigations that subject imports from China are having asignificant adverse impact on the domestic WSS pressure pipe industry.129
D. Conclusion
For the reasons stated above, we find that there is a reasonable indication that an industry in theUnited States is materially injured by reason of allegedly unfairly traded subject imports from China soldin the U.S. market.
VII. VIEWS OF CHAIRMAN PEARSON, VICE CHAIRMAN ARANOFF, ANDCOMMISSIONER OKUN FINDING A REASONABLE INDICATION OF A THREAT OFMATERIAL INJURY BY REASON OF SUBJECT IMPORTS FROM CHINA
A. General Legal Standards
Section 771(7)(F) of the Act directs the Commission to determine whether the U.S. industry isthreatened with material injury by reason of the subject imports by analyzing whether “further dumped orsubsidized imports are imminent and whether material injury by reason of imports would occur unless anorder is issued or a suspension agreement is accepted.”130 The Commission may not make suchdeterminations “on the basis of mere conjecture or supposition,” and considers the threat factors “as awhole” in making its determinations whether dumped or subsidized imports are imminent and whethermaterial injury by reason of subject imports would occur unless an order is issued.131 In making ourdeterminations, we consider all statutory threat factors that are relevant to these investigations.132 Basedon our evaluation of the record compiled in the preliminary phase of these investigations, we determinethat there is a reasonable indication that the domestic WSS pressure pipe industry is threatened withmaterial injury by reason of subject imports from China.

133 Statutory threat factor (VII) is inapplicable, as these investigations do not involve an agricultural product. 19 U.S.C. § 1677(7)(F)(i). Moreover, none of the parties has argued that statutory threat factor (VI) (product-shifting) applies in these investigations. We observe that in its notice of initiation, Commerce estimated thedumping margin for subject imports from China to range from 8.36 to 12.70 percent ad valorem, based on acomparison of export price and normal value. See, e.g., 73 Fed. Reg. 10221, 10224 (Feb. 26, 2008). In its notice ofinitiation, Commerce indicated that it would investigate sixteen programs alleged in the petitions to have providedcountervailable subsidies to producers of WSS pressure pipe in China: one preferential lending program (loans andexport credits pursuant to the Northeast Revitalization Program), seven income tax programs (the “Two Free, ThreeHalf” program; income tax reductions for export-oriented foreign investment enterprises (“FIEs”); reduced incometax rate for FIEs located in Economic and Technological Development Zones and other special economic zones;income tax credit or refund for reinvestment of FIE profits; provincial and local tax exemptions and reductions forproductive FIEs; local income tax reductions in certain development zones; and preferential tax policies for researchand development at FIEs), two indirect tax and import tariff programs (value-added tax refunds on purchases ofdomestically produced equipment by FIEs; and tax credits on purchases of domestically produced equipment bydomestically owned companies), three provincial subsidy programs (Guangdong Province’s “Outward Expansion”program; preferential loans pursuant to Liaoning Province’s Five-Year Framework; and preferential tax policies forTown and Village Enterprises (“TVEs”)), two programs involving the provision of goods or services for less thanadequate remuneration (provision of stainless steel coil for less than adequate remuneration; and provision of landuse rights for less than adequate remuneration); and one program involving government restraints on exports (exportrestraints on flat-rolled steel). See, e.g., 73 Fed. Reg. 9994, 9996 (Feb. 25, 2008). 134 See, e.g., CR/PR at Table C-1. Silbo argues that the annual data obscure a slowdown in subject imports fromChina in the second half of 2007. See, e.g., Confer. Tr. at 103-04 (Jakob for Silbo). On the other hand, petitionerspoint to recent U.S. licensing data for Chinese producers, which show an upturn of more than 50 percent betweenDecember 2007 and January 2008, as indicating that imports from China are increasing. See, e.g., Confer. Tr. at 126(Schagrin); Petitioners’ Postconf. Br. at Exh. 4. Even Silbo speculates that the apparent decline simply reflectsinventory corrections made by overstocked U.S. distributors due to rather severe downturns in projects using pipes. See, e.g., Confer. Tr. at 103-04 (Jakob for Silbo). 135 See, e.g., CR/PR at Table C-1. Therefore, as a ratio to domestic production, subject imports from Chinaincreased from *** percent in 2005 to *** percent in 2006 and *** percent in 2007. See, e.g., CR/PR at Table IV-6. 136 See, e.g., CR/PR at Table C-1. 137 See, e.g., CR/PR at Table C-1. 138 See, e.g., CR/PR at Table C-1.
23
B. Analysis of Statutory Threat Factors133
The volume and market penetration of subject imports from China increased during the period ofinvestigation, indicating the likelihood of substantially increased imports from China into the U.S.market. In absolute terms, the volume of subject imports from China more than doubled over the periodof investigation, increasing from 14,486 short tons in 2005 to 23,751 short tons in 2006 and 30,574 shorttons in 2007.134 By the end of the period of investigation, the volume of subject imports from China hadsurpassed the domestic industry’s production level. The domestic industry’s production increased from*** short tons in 2005 to *** short tons in 2006 before declining to *** short tons in 2007, below itsproduction level for 2005.135
The share of apparent U.S. consumption held by subject imports, by quantity, increased by ***percentage points from 2005 to 2007, rising from *** percent in 2005 to *** percent in 2006, beforeincreasing further to *** percent in 2007.136 Non-subject imports had a relatively stable market share interms of quantity and value.137 Non-subject imports’ share of the U.S. market, by quantity, declined from*** percent in 2005 to *** percent in 2006, and then increased to *** percent in 2007.138
Consequently, the increase in subject import volume came almost entirely at the expense of thedomestic industry. Although total apparent U.S. consumption increased by *** percent from 2005 to
139 See, e.g., CR/PR at Table C-1. 140 See, e.g., CR at VII-3 to VII-4; PR at VII-2 to VII-3. 141 See, e.g., CR at VII-4; PR at VII-3. 142 See, e.g., CR/PR at Table VII-1. 143 See, e.g., Petitions at 18, Exh. I-40; Confer. Tr. at 13 (Boling for Bristol Metals), 32-33 (Schagrin);Petitioners’ Postconf. Br. at 17-19, Exhs. 5, 6; CR at VII-3; PR at VII-3. 144 See, e.g., CR/PR at Table VII-1. 145 See, e.g., CR/PR at Table VII-1. 146 See, e.g., CR/PR at Tables VII-1 and VII-3. 147 We also note that Argentina and South Africa imposed antidumping duties in 2005 and 2007, respectively, onimports of austenitic stainless steel pipes and tubes from China. See, e.g., Petitions at 19; Petitioners’ Postconf. Br.at 19-20; CR at VII-8; PR at VII-5. 148 See, e.g., CR/PR at Table VII-2 (U.S. imports subsequent to December 31, 2007). In any final phaseinvestigations, we intend to seek more information about production operations in China, the availability of otherexport markets to absorb any additional exports from China, and the effect of the recent export tax imposed by theGovernment of China on the level of exports of WSS pressure pipe from China to the United States. See, e.g.,Petitions at 18-20; Confer. Tr. at 32-36 (Schagrin), 105 (Jakob for Silbo); Petitioners’ Postconf. Br. at 16-21, Exhs.4-6.
24
2007, the overall volume shipped and the market share held by the domestic industry fell. The domesticindustry’s share of apparent U.S. consumption, by quantity, declined from *** percent in 2005 to ***percent in 2006 and *** percent in 2007, an overall decrease of *** percentage points.139
Data on existing and projected capacity to produce WSS pressure pipe in China also indicate thelikelihood of substantially increased imports from China in the imminent future. The Commissionreceived a completed questionnaire response from only one subject producer of WSS pressure pipe inChina, although the petitioners identified nine producers and/or exporters of WSS pressure pipe in Chinaand responding importers of subject merchandise from China identified at least six possible foreignproducers of subject merchandise in China.140 The responding foreign producer, Winner Stainless,estimated that it accounts for *** percent of total exports of WSS pressure pipe from China to the UnitedStates.141 ***,142 other record evidence indicates that a number of new WSS production facilities openedin China and existing Chinese facilities added capacity during the period of investigation, and publiclyavailable information suggests further capacity increases in China are likely in the imminent future.143 Winner Stainless reported producing at *** percent capacity utilization in *** capacity available toexport to the U.S. market.144 Winner Stainless *** exported *** percent of its production to the UnitedStates during the period of investigation, made *** to the Chinese home market, and sold the remainderof its production ***.145 Therefore, ***. Winner Stainless reported *** end-of-period inventories inChina, and importers of the subject merchandise reported not insubstantial end-of-period inventories inthe United States.146 Based on the large increase in subject imports from China during the period ofinvestigation, significant end-of-period inventory levels, evidence of existing orders for WSS pressurepipe from China for delivery into the United States in 2008, and evidence that the Chinese producers havethe ability and incentive to ship substantially increased volumes of WSS pressure pipe to the UnitedStates,147 we find, for purposes of the preliminary phase of these investigations, that substantiallyincreased imports of subject merchandise from China are likely in the imminent future.148
We also considered pricing developments during the period of investigation as well as likelypricing developments in the imminent future. As we found above, when the products are made to thesame ASTM specification, AISI steel grade, gauge, and outside diameter, there is a high degree ofinterchangeability between the domestic like product and subject imports from China. The vast majorityof WSS pressure pipe sales in the U.S. market, whether of domestically produced or imported WSS
149 See, e.g., CR at V-6; PR at V-4. 150 When asked about non-price differences between U.S.- and Chinese-produced WSS pressure pipe, three offive domestic producers reported that they are never a factor, one reported that they are sometimes a factor, and onereported that non-price differences are always a factor. Of the eight responding importers, one reported that non-price differences are never a factor, two reported that they are sometimes a factor, two reported that they arefrequently a factor, and three reported that they are always a factor. See, e.g., CR at II-9; PR at II-6; CR/PR at TableII-3. We intend to explore the importance of non-price factors in any final phase investigations. 151 These products are: (1) ASTM A-312, welded, grade AISI 304/304L pipe, 1-inch schedule 40; (2) ASTM A-312, welded, grade AISI 304/304L pipe, 2-inch schedule 40; (3) ASTM A-312, welded, grade AISI 304/304L pipe,0.5-inch schedule 10; (4) ASTM A-312, welded, grade AISI 304/304L pipe, 6-inch schedule 10; and (5) ASTM A-312, welded, grade AISI 316/316L pipe, 2-inch schedule 40. See, e.g., CR at V-7 to V-8; PR at V-6. 152 See, e.g., CR/PR at Tables V-2 to V-6. Subject imports undersold the domestic like product in 10 of 12comparisons for product 1, with the margins of underselling ranging from 7.4 percent to 30.2 percent. See, e.g.,CR/PR at Table V-7. For product 2, subject imports undersold the domestic like product in 10 of 12 comparisons,with the margins of underselling ranging from 8.6 to 27.2 percent. See, e.g., CR/PR at Table V-7. For product 3,subject imports undersold the domestic like product in 11 of 12 comparisons, with the margins of undersellingranging from 10.4 to 45.9 percent. See, e.g., CR/PR at Table V-7. For product 4, subject imports undersold thedomestic like product in 10 of 12 comparisons, with the margins of underselling ranging from *** to 23.7 percent. See, e.g., CR/PR at Table V-7. For product 5, subject imports undersold the domestic like product in 8 of 12comparisons, with the margins of underselling ranging from 5.2 to 24.5 percent. See, e.g., CR/PR at Table V-7. 153 The Commission confirmed each of the alleged lost sales allegations involving approximately $*** in lostsales and confirmed lost revenues of approximately $*** over the period of investigation. See, e.g., CR/PR atTables V-8 to V-9. 154 See, e.g., CR/PR at Tables V-2 to V-6. 155 See, e.g., Confer. Tr. at 99-101, 115-16 (Jakob for Silbo). 156 See, e.g., CR/PR at Figure V-2; Petitions at I-25.
25
pressure pipe, are made through spot sales, and the remainder are through short-term contracts.149 According to the record in the preliminary phase of these investigations, price is a relatively importantfactor in purchasing decisions.150
Five domestic producers and six importers of subject merchandise provided quarterly net U.S.f.o.b. selling price data for five WSS pressure pipe products.151 The pricing data collected in thepreliminary phase of these investigations show pervasive underselling at large margins by subject importsfrom China throughout much of the period of investigation.152 We also note that the record includes anumber of confirmed instances where the domestic industry lost sales and revenues to low-pricedimports.153 Additionally, as discussed above, subject imports from China increased market share at theexpense of the domestic industry during the period of investigation.
We acknowledge that there was some overselling of the domestic like product by subject importsfrom China toward the end of the period of investigation (the final two quarters of 2007 for products 1, 2,and 4; the final quarter of 2007 for product 3; and the final three quarters of 2007 for product 5).154 In anyfinal phase investigations, we intend to explore the extent to which this overselling may relate todifferences in how subject imports from China are priced relative to the domestic like product. Silbo, animporter that accounted for *** percent of subject imports from China in 2007, negotiates non-revocablecontracts with Chinese suppliers that set prices for deliveries made five to six months later, and Silboconcurrently negotiates non-revocable contracts with purchasers in the United States for delivery five tosix months later. In contrast, domestic producers reportedly sell their products at prices prevailing at thetime of the sale, and these selling prices reflect any prevailing alloy surcharges.155 Although nickel pricesclimbed between 2006 and the first half of 2007, they then fell dramatically before beginning to rise againat the end of 2007.156 Thus, the observed price differentials might reflect the domestic industry’s responseat the time of shipment to trends in nickel and other alloy surcharges as compared to subject imports from

157 See, e.g., CR/PR at Table C-1. *** accounted for almost all of the decrease in production, with ***. See,e.g., CR at III-3; PR at III-1. The average number of production and related workers and the domestic industry’sproductivity increased between 2005 and 2006, but declined between 2006 and 2007, although wages declinedbetween 2005 and 2006, then improved between 2006 and 2007. The average number of production and relatedworkers increased from *** in 2005 to *** in 2006, before decreasing to *** in 2007. See, e.g., CR/PR at Table C-1. Productivity increased from *** tons/1,000 hours in 2005 to *** tons/1,000 hours in 2006 then declined to ***tons/1,000 hours in 2007. See, e.g., id. Hourly wages decreased from $*** in 2005 to $*** in 2006, beforeincreasing to $*** in 2007. See, e.g., id. 158 The domestic industry’s U.S. shipments of WSS pressure pipe increased from *** short tons in 2005 to ***short tons in 2006 and then declined to *** short tons in 2007. See, e.g., CR/PR at Table C-1. Exports, which werea *** share of the domestic industry’s total shipments, also declined by *** percent over this same period. U.S.export shipments of WSS pressure pipe declined from *** short tons in 2005 to *** short tons in 2006 and *** shorttons in 2007. See, e.g., CR/PR at Table C-1. 159 The domestic industry’s end-of-period inventories of WSS pressure pipe increased from *** short tons in2005 to *** short tons in 2006 but then declined to *** short tons in 2007. See, e.g., CR/PR at Table C-1. 160 See, e.g., CR/PR at Table C-1. These data show an increase in production capacity of *** percent between2005 and 2007. ***. See, e.g., CR at III-2 to III-3; PR at III-1. 161 See, e.g., CR/PR at Table C-1. ***. See, e.g., CR at III-3; PR at III-1.
26
China for which prices were established a number of months earlier. We intend to examine sellingpractices in the U.S. market in greater depth in any final phase investigations, particularly the extent towhich there are differences in how imported products are priced relative to the domestic like product, andthe impact of these practices in the U.S. market.
In short, by pervasively underselling the domestic like product, subject imports gained marketshare at the expense of the domestic industry. One important factor that permitted prices to rise alongwith costs, even in the face of pervasive underselling, was rising demand. We have found that demandbegan to soften at the end of the period and is likely to continue to soften in the imminent future. Becausewe find that underselling is likely to continue despite weakening demand, we find it likely that the subjectimports will enter the U.S. market at prices that are likely to have a significant depressing or suppressingeffect on domestic prices and at prices that are likely to increase demand for further imports. In any finalphase investigations, we also will examine changes in the prices of alloy surcharges and demand patternsover the period of investigation and in the imminent future.
Domestic industry performance indicators moved in divergent directions during the period ofinvestigation, with production-related performance factors generally declining and financial-relatedperformance factors improving over the period of investigation. The domestic industry’s production ofWSS pressure pipe increased from *** short tons in 2005 to *** short tons in 2006, but then declined to*** short tons in 2007 to a level lower than in 2005.157 The domestic industry’s total U.S. shipments ofWSS pressure pipe declined by *** percent from 2005 through 2007.158 Its end-of-period inventories ofWSS pressure pipe decreased by *** percent from 2005 through 2007.159
The domestic industry’s average production capacity increased from *** short tons in 2005 to*** short tons in 2006 and *** short tons in 2007.160 We intend to examine capacity utilization levelsmore closely in any final phase investigations, because reported capacity utilization levels for thedomestic industry as a whole appear to be low. Moreover, there are large disparities among the capacityutilization levels reported by individual domestic producers, which raises questions as to the consistencyof the methodology used to calculate capacity utilization.161 As a result, for purposes of the preliminaryphase of these investigations, we have placed more weight on capacity utilization trends than on capacity

162 See, e.g., CR/PR at Table C-1. For example, Bristol Metals indicated that in the last several months, it has notutilized four of its eight continuous-welding mills or has only produced with limited shifts at those mills, because ofdeclining orders due to increased imports of subject merchandise from China; as a result, the company has cut backon its employees’ work hours and suffered financial difficulties associated with lower capacity utilization levels. See, e.g., Confer. Tr. at 10-11 (Boling for Bristol Metals). Although Mr. Boling testified that Bristol Metals hasreduced production in facilities that produce between ½-inch and 10-inch ranges, he explained that the biggestimpact from subject imports from China has been in the 6- to 8-inches and smaller ranges. See, e.g., Confer. Tr. at64-65 (Boling for Bristol Metals). Mr. Avento testified that Outokumpu largely shut down its south plant where itproduces 6-inch and smaller pipe due to subject imports from China, but it is still producing the larger sizes at itsnorth plant. See, e.g., Confer. Tr. at 65-66 (Avento for Outokumpu). By contrast, Mr. Cornelius testified thatMarcegaglia produces ½-inch to 12-inch products but has seen subject imports from China competing with thecompany’s entire range of products. See, e.g., Confer. Tr. at 66 (Cornelius for Marcegaglia). Likewise, Mr. Henketestified that Felker Brothers has seen competition from subject imports from China in the 2-inch to 12-inchdimensions, and his company has struggled to cross-train its employees to produce other sizes of pipe products inorder to try to keep these workers. See, e.g., Confer. Tr. at 66-67 (Henke for Felker Brothers). 163 See, e.g., CR/PR at Table C-1. Net sales measured by quantity increased from *** short tons in 2005 to ***short tons in 2006 and then declined to *** short tons in 2007. See, e.g., CR/PR at Table C-1. Net sales measuredby value increased from $*** in 2005 to $*** in 2006, and $*** in 2007. See, e.g., CR/PR at Table C-1. 164 See, e.g., CR/PR at Table C-1. 165 See, e.g., CR/PR at Table C-1. 166 See, e.g., CR at VI-3 to VI-4; PR at VI-1; CR/PR at Figures V-1 to V-2, Tables VI-2, C-1. 167 Petitioners argue that coiled stainless steel purchased during the period of investigation was booked at the rawmaterial costs (base price plus alloy surcharges for the coiled stainless steel) at the date domestic producerspurchased the raw materials. Because of the concurrent escalation in alloy surcharges for nickel and molybdenum,when domestic producers sold WSS pressure pipe at a later time in the period, they benefitted from the then-prevailing high raw material surcharges for nickel and molybdenum. Thus, petitioners argue that even thoughdomestic shipments were lower allegedly due to the increased volume of subject imports, the change in the value oftheir inventory associated with the raw material surcharges resulted in positive financial returns for the industry. See, e.g., Confer. Tr. at 7-8, 72-78 (Schagrin). In accounting, there is no distinction between revenues earnedthrough surcharges or base prices, and there is no distinction between costs incurred through surcharges or baseprices. See, e.g., CR at VI-3 to VI-7; PR at VI-1 to VI-3; CR/PR at Figures V-1 to V-2; Tables VI-2, C-1. 168 See, e.g., CR/PR at Table C-1.
27
utilization levels. The domestic industry’s capacity utilization increased from *** percent in 2005 to ***percent in 2006 and then declined to *** percent in 2007.162
The domestic industry’s net sales declined by *** percent from 2005 to 2007 when measured byquantity, but increased by *** percent over the same period when measured by value.163 The domesticindustry’s average unit COGS increased from $*** per short ton in 2005 to $*** per short ton in 2006and $*** per short ton in 2007, an increase of *** percent over the period of investigation or *** percentjust between 2006 and 2007.164 Nevertheless, the domestic industry’s COGS as a share of net salesdeclined from *** percent in 2005 to *** percent in 2006 before increasing somewhat to *** percent in2007.165 Thus, notwithstanding the significant increase in COGS due at least in part to dramatic increasesin nickel and molybdenum costs, the domestic industry generally was able to raise prices as its costsincreased, although to a lesser degree at the end of the period of investigation.166
The domestic industry’s financial indicators improved during the period of investigation.167 Thedomestic industry turned a $*** operating loss in 2005 into $*** in operating profits in 2006 beforefurther improving to a positive $*** in 2007.168 The domestic industry’s ratio of operating income tosales increased by *** percentage points from 2005 to 2007. The domestic industry’s operating incomemargin improved from a *** percent loss in 2005 to a *** percent profit in 2006 and a *** percent profit
169 See, e.g., CR/PR at Table C-1. 170 See, e.g., CR at VI-3; PR at VI-1; CR/PR at Tables VI-1, VI-5. The domestic industry’s capital expendituresdeclined from $*** in 2005 to $*** in 2006, before increasing to $*** in 2007. See, e.g., CR/PR at Table C-1. 171 See, e.g., CR/PR at Table VI-5. 172 See, e.g., CR at VI-15; PR at VI-5; CR/PR at Appendix E. 173 Chairman Pearson and Commissioner Okun note that petitioners concede that WSS pressure pipe is acommodity product. See, e.g., Petitions, Vol. I at 3. Importer Silbo does not argue otherwise. Given our finding oninterchangeability, for purposes of the preliminary phase of these investigations we assume that WSS pressure pipeis a commodity product, and, therefore, one of the predicates of the test provided for in Bratsk Aluminium Smelter v.United States, 444 F.3d 1369 (Fed. Cir. 2006), is satisfied.
The second predicate of the Bratsk test requires that non-subject imports are price-competitive and asignificant factor in the U.S. market. As to whether non-subject imports are a significant factor in the U.S. market,the record in the preliminary phase of these investigations suggests that they are. Collectively, non-subject imports’market share is comparable to that of the subject imports. Subject imports’ market share by quantity was ***percent in 2005, *** percent in 2006, and *** percent in 2007. See, e.g., CR/PR at Table IV-5. The collective U.S.market share of non-subject imports declined from *** percent in 2005 to *** percent in 2006, and then increased to*** percent in 2007. See, e.g., CR/PR at Table IV-5. Non-subject imports are comprised of imports from severalcountries. The largest and growing share of apparent U.S. consumption among non-subject sources belonged to non-subject imports from Taiwan, which increased in market share from *** percent in 2005 to *** percent in 2006 and*** percent in 2007. Derived from CR/PR at Tables IV-3, IV-5.
With respect to whether non-subject imports are price-competitive, in its importers’ questionnaires theCommission requested product-specific price data from non-subject countries. It received information about non-subject imports from Korea and Malaysia but not non-subject imports from Taiwan. See, e.g., CR at VII-9; PR atVII-6. These data on non-subject imports from Korea and Malaysia show predominant underselling of the domesticlike product. In addition, the prices of non-subject imports from Korea and Malaysia showed some undersellingcompared with prices of subject imports, although there were more instances of overselling. See, e.g., CR/PR atAppendix D. As has increasingly become the case in recent proceedings involving stainless steel products fromTaiwan, importers of the subject merchandise from Taiwan provided virtually no data regarding the prices of importsinto the U.S. market from Taiwan. The virtual absence of pricing data on the largest share of non-subject importsinto the U.S. market makes our assessment of the price-competitive nature of non-subject imports difficult. We notethat Taiwan producers Chang Tieh Industry and Ta Chen are no longer subject to an antidumping duty order onASTM A-312 pipe from Taiwan. For purposes of the preliminary phase of these investigations and based on thelimited information available on this issue, we find that non-subject imports are price-competitive with the domesticlike product. We intend to seek more information on this issue in any final phase investigations. Based on ourfinding that non-subject imports are a significant factor in the U.S. market and our finding concerning the price-competitive nature of non-subject imports with the domestic like product, for purposes of the preliminary phase ofthese investigations, we find the second Bratsk triggering factor is met.
Assuming that the Bratsk test is triggered for purposes of the preliminary phase of these investigations, wenow consider whether non-subject imports are likely to replace subject imports from China and continue to causeinjury to the domestic industry. One of the relevant factors we must examine in assessing this issue is the size of the
28
in 2007.169 Capital expenditures were ***, an indication that the domestic industry ***.170 *** researchand development expenses.171 Several U.S. producers also indicated that the subject imports had actualand potential negative effects on their companies’ development and production efforts.172
In light of evidence suggesting that demand may be flattening or declining, some evidence of thedomestic industry’s declining ability to raise prices as its costs increased at the end of the period, andevidence of declines in a number of domestic industry performance indicators, we find the domesticindustry is vulnerable. Thus, for purposes of the preliminary phase of these investigations, we find areasonable indication that the increased subject imports from China at low prices will likely result inmaterial injury to the domestic industry unless antidumping duty and countervailing duty orders areissued.173 174

non-subject supplier industries and the amount of excess capacity in those industries. The Commission soughtpublicly available information regarding international suppliers of WSS pressure pipe since 2005 from nationalimport and export statistics, from conference testimony, and from interviews with industry sources. The leadingnon-subject source of WSS pressure pipe is Taiwan; other major non-subject source countries include Korea andMalaysia, followed by Thailand. See, e.g., CR at VII-9; PR at VII-6. Information suggests that these countries havesignificant capacity to produce circular welded tubes, pipes, and hollow profiles of stainless steel, a category thatencompasses many more products than those with the scope of these investigations (WSS pressure pipe). Statisticsindicate that Korea, Malaysia, and Taiwan export significant quantities of circular welded tubes, pipes, and hollowprofiles of stainless steel and that the U.S. market serves as their leading export market for those products. See, e.g.,CR/PR at Tables VII-4 - VII-7; CR at VII-9 to VII-15; PR at VII-6 to VII-12. Based on this limited information, itappears as if non-subject imports may have sufficient capacity to replace subject imports from China if antidumpingduty and countervailing duty orders were to be imposed on subject imports from China.
Trends in the U.S. market share for subject and non-subject imports relative to U.S. producers’ market shareduring the period examined may provide some indication of the likely import pattern if subject imports were not inthe U.S. market. Apparent U.S. consumption of WSS pressure pipe increased *** percent from 2005 to 2007. See,e.g., CR/PR at Table C-1. The market share held by domestic producers fell from *** percent in 2005 to ***percent in 2007. The market share of subject U.S. imports rose from *** percent in 2005 to *** percent in 2007. The market share of U.S. imports of non-subject WSS pressure pipe slightly increased from *** percent in 2005 to*** percent in 2007. See, e.g., CR/PR at Table C-1. Thus, the record indicates that both subject and non-subjectimports were taking market share from the domestic industry during most of the period examined. In any final phaseof these investigations, in order to complete our analysis under Bratsk, we will again attempt to seek information onproduction capacity of major non-subject producers of WSS pressure pipe. Given the size of the Taiwan industryand its volume of exports to the United States, the fact that we do not have any pricing data on those imports makesit difficult to draw conclusions concerning the ability of the Taiwan exporters to replace subject imports from China. Therefore, for purposes of the preliminary phase of these investigations, we cannot determine whether non-subjectimports would negate a benefit to the domestic industry from the imposition of orders on subject imports fromChina.
For a complete statement of Chairman Pearson’s and Commissioner Okun’s interpretation of Bratsk in apreliminary phase investigation, see Separate and Additional Views of Chairman Daniel R. Pearson andCommissioner Deanna Tanner Okun Concerning Bratsk Aluminum v. United States in Sodium Hexametaphosphatefrom China, Inv. No. 731-TA-1110 (Prelim.), USITC Pub. 3912 at 19-25 (Apr. 2007). 174 Vice Chairman Aranoff notes that there is limited information on the record regarding the role of non-subjectimports of WSS pressure pipe in the U.S. market. In any final phase investigations, she will seek information on therole of non-subject imports of WSS pressure pipe in the U.S. market. She invites parties to comment in any finalphase investigations on whether Bratsk Aluminum Smelter v. United States, 444 F.3d 1369 (Fed. Cir. 2006), isapplicable to the facts of these investigations. She also invites parties to comment on what additional informationthe Commission should collect to address the issues raised by the Court, how that information should be collected,and which of the various non-subject sources should be the focus of additional information gathering by theCommission in any final phase investigations.
29
For the foregoing reasons, we find that there is a reasonable indication that the domestic industryproducing WSS pressure pipe is threatened with material injury by reason of subject imports of WSSpressure pipe from China that are allegedly subsidized by the Government of China and sold in the UnitedStates at less than fair value.

175 Commissioner Lane, Commissioner Williamson, and Commissioner Pinkert find a reasonable indication thatan industry in the United States is materially injured by reason of subject imports from China. 176 Chairman Pearson, Vice Chairman Aranoff, and Commissioner Okun find a reasonable indication that anindustry in the United States is threatened with material injury by reason of subject imports from China.
30
CONCLUSION
For the foregoing reasons and based on the record in the preliminary phase of theseinvestigations, the Commission finds a reasonable indication than an industry in the United States ismaterially injured,175 or threatened with material injury,176 by reason of imports of WSS pressure pipefrom China that are allegedly subsidized and sold at less than fair value in the United States.
1 As discussed in greater detail in the section of this chapter entitled “The Subject Merchandise,” for purposes ofthese investigations, the products covered are circular welded austenitic stainless steel pressure pipe not greater than14 inches in outside diameter. These pipes meet the ASTM A-312 or A-778 specifications or comparablespecifications. These stainless steel pipes are generally used as a conduit for liquids or gases. Excluded from thescope are: (1) non-circular welded stainless pipe; (2) welded stainless mechanical tubing, such as ASTM A-554; and(3) boiler, heat exchanger, superheater and condenser tubing, such as ASTM A-249, A-269, A-270, and A-688. 2 Commerce initiated a countervailing duty investigation on six categories of subsidies. 73 FR 9994, February25, 2008. Commerce calculated estimated dumping margins of 8.36 - 12.70 percent. 73 FR 10221, February 26,2008. 3 Federal Register notices cited in the tabulation are presented in appendix A.
I-1
PART I: INTRODUCTION
BACKGROUND
These investigations result from a petition filed on January 30, 2008, by Bristol Metals (Bristol,TN), Felker Brothers Corp. (Marshfield, WI), Marcegaglia USA, Inc. (Munhall, PA), OutokumpuStainless Pipe, Inc. (Schaumburg, IL), and The United Steel Workers (Pittsburgh, PA). The petitionalleges that an industry in the United States is materially injured and threatened with material injury byreason of subsidized and less-than-fair-value (“LTFV”) imports of welded stainless steel pressure pipe(“WSS pressure pipe”)1 from China.2 Information relating to the background of the investigations isprovided below.3
Date Action
January 30, 2008Petition filed with Commerce and the Commission; institution of Commissioninvestigations (73 FR 6741, February 5, 2008)
February 21, 2008Commission’s conference (a list of witnesses appearing at the conference ispresented in appendix B)
February 25, 2008Commerce’s notice of initiation of countervailing investigation (73 FR 9994,February 25, 2008)
February 26, 2008Commerce’s notice of initiation of antidumping duty investigation, (73 FR 10221,February 26, 2008)
March 14, 2008 Commission’s vote
March 17, 2008 Commission determinations transmitted to Commerce
STATUTORY CRITERIA AND ORGANIZATION OF THE REPORT
Statutory Criteria
Section 771(7)(B) of the Tariff Act of 1930 (the “Act”) (19 U.S.C. § 1677(7)(B)) provides that inmaking its determinations of injury to an industry in the United States, the Commission--
shall consider (I) the volume of imports of the subject merchandise, (II)the effect of imports of that merchandise on prices in the United Statesfor domestic like products, and (III) the impact of imports of such

I-2
merchandise on domestic producers of domestic like products, but onlyin the context of production operations within the United States; and. . .may consider such other economic factors as are relevant to thedetermination regarding whether there is material injury by reason ofimports.
Section 771(7)(C) of the Act (19 U.S.C. § 1677(7)(C)) further provides that--
In evaluating the volume of imports of merchandise, the Commissionshall consider whether the volume of imports of the merchandise, or anyincrease in that volume, either in absolute terms or relative to productionor consumption in the United States is significant.. . .In evaluating the effect of imports of such merchandise on prices, theCommission shall consider whether . . . (I) there has been significantprice underselling by the imported merchandise as compared with theprice of domestic like products of the United States, and (II) the effect ofimports of such merchandise otherwise depresses prices to a significantdegree or prevents price increases, which otherwise would haveoccurred, to a significant degree.. . .In examining the impact required to be considered under subparagraph(B)(i)(III), the Commission shall evaluate (within the context of thebusiness cycle and conditions of competition that are distinctive to theaffected industry) all relevant economic factors which have a bearing onthe state of the industry in the United States, including, but not limited to. . . (I) actual and potential declines in output, sales, market share, profits,productivity, return on investments, and utilization of capacity, (II)factors affecting domestic prices, (III) actual and potential negativeeffects on cash flow, inventories, employment, wages, growth, ability toraise capital, and investment, (IV) actual and potential negative effectson the existing development and production efforts of the domesticindustry, including efforts to develop a derivative or more advancedversion of the domestic like product, and (V) in {an antidumpinginvestigation}, the magnitude of the margin of dumping.
Organization of the Report
Part I of this report presents information on the subject merchandise, alleged subsidies anddumping margins, and domestic like product. Part II of this report presents information on conditions ofcompetition and other relevant economic factors. Part III presents information on the condition of theU.S. industry, including data on capacity, production, shipments, inventories, and employment. Parts IVand V present the volume and pricing of imports of the subject merchandise, respectively. Part VIpresents information on the financial experience of U.S. producers. Part VII presents the statutoryrequirements and information obtained for use in the Commission’s consideration of the question of threatof material injury, and the judicial requirements and information obtained for use in the Commission’sconsideration of Bratsk issues.

4 Table C-2 is based on an expanded domestic like product that includes pressure pipe greater than 14 inches indiameter. 5 As discussed in detail in Part IV, import data for Canada are not being used because the overwhelming majorityconsists of nonsubject product (mechanical tubing).
I-3
U.S. WSS PRESSURE PIPE MARKET SUMMARY
Trade for WSS pressure pipe pipe totaled approximately $*** (nearly *** short tons) in the U.S.market in 2007. Currently, at least seven firms produce WSS pressure pipe in the United States. Five ofthe producers – Bristol, Felker, Marcegaglia, Outokumpu, and Webco – accounted for nearly *** percentof estimated U.S. production in 2007. At least eight firms have imported WSS pressure pipe from Chinasince 2005. The three largest importers – ***, ***, and *** – accounted for almost *** percent ofreported U.S. imports from China in 2007. There is one large confirmed Chinese producer of WSSpressure pipe, Winner. The petition estimates there are eight other producers in China.
WSS pressure pipe is generally used as a conduit for liquids or gases, with applications includingdigestor lines, blow lines, pharmaceutical lines, petrochemical lines, stock lines, brewery process andtransport lines, general food processing lines, automotive paint lines, and paper process machines. Thequantity of apparent U.S. consumption of WSS pressure pipe increased by nearly *** between 2005 and2007, reflecting the growth in ethanol facilities. The value of apparent U.S. consumption ***, reflectingboth rising demand and rapid increases in stainless steel prices generally. U.S. producers’ U.S. shipmentsof WSS pressure pipe totaled *** short tons in 2007, and accounted for *** percent of apparent U.S.consumption by quantity. U.S. imports from China totaled 30,574 short tons in 2007, and accounted for*** percent of apparent U.S. consumption by quantity, while U.S. imports from all other sourcescombined totaled 29,314 short tons in 2007, and accounted for *** percent of apparent U.S. consumptionby quantity. The largest sources of imported WSS pressure pipe are China and Taiwan.
SUMMARY DATA AND DATA SOURCES
A summary of data collected in the investigations is presented in appendix C, tables C-1 andC-2.4 Except as noted, U.S. industry data are based on questionnaire responses of five firms thataccounted for nearly *** percent of U.S. production of WSS pressure pipe during 2007. U.S. imports arebased on official import statistics of Commerce, as modified to include WSS pressure pipe importedunder basket HTS categories (based on questionnaire responses) and to exclude both WSS pressure pipeover 14 inches in diameter (based on questionnaire responses) and mechanical tubing.5 Data regardingthe Chinese industry are based on one foreign producer questionnaire response, while information withrespect to other foreign industries is drawn from published sources.
PREVIOUS AND RELATED TITLE VII INVESTIGATIONS
The Commission has conducted several previous import relief investigations and two reviews onASTM A-312 pipe, a subset of WSS pressure pipe. Table I-1 presents data on previous and related titleVII investigations.
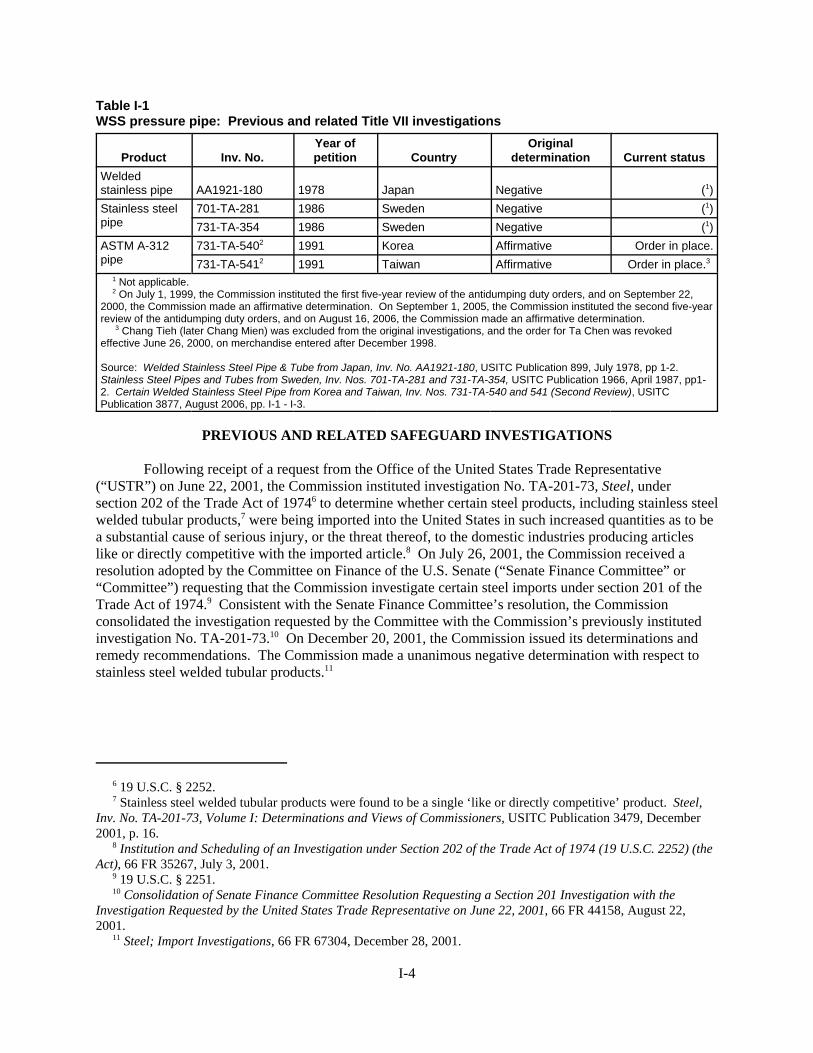
6 19 U.S.C. § 2252. 7 Stainless steel welded tubular products were found to be a single ‘like or directly competitive’ product. Steel,Inv. No. TA-201-73, Volume I: Determinations and Views of Commissioners, USITC Publication 3479, December2001, p. 16. 8 Institution and Scheduling of an Investigation under Section 202 of the Trade Act of 1974 (19 U.S.C. 2252) (theAct), 66 FR 35267, July 3, 2001. 9 19 U.S.C. § 2251. 10 Consolidation of Senate Finance Committee Resolution Requesting a Section 201 Investigation with theInvestigation Requested by the United States Trade Representative on June 22, 2001, 66 FR 44158, August 22,2001. 11 Steel; Import Investigations, 66 FR 67304, December 28, 2001.
I-4
Table I-1WSS pressure pipe: Previous and related Title VII investigations
Product Inv. No.Year ofpetition Country
Originaldetermination Current status
Weldedstainless pipe AA1921-180 1978 Japan Negative (1)Stainless steelpipe
701-TA-281 1986 Sweden Negative (1)731-TA-354 1986 Sweden Negative (1)
ASTM A-312pipe
731-TA-5402 1991 Korea Affirmative Order in place.731-TA-5412 1991 Taiwan Affirmative Order in place.3
1 Not applicable. 2 On July 1, 1999, the Commission instituted the first five-year review of the antidumping duty orders, and on September 22,2000, the Commission made an affirmative determination. On September 1, 2005, the Commission instituted the second five-yearreview of the antidumping duty orders, and on August 16, 2006, the Commission made an affirmative determination. 3 Chang Tieh (later Chang Mien) was excluded from the original investigations, and the order for Ta Chen was revokedeffective June 26, 2000, on merchandise entered after December 1998.
Source: Welded Stainless Steel Pipe & Tube from Japan, Inv. No. AA1921-180, USITC Publication 899, July 1978, pp 1-2. Stainless Steel Pipes and Tubes from Sweden, Inv. Nos. 701-TA-281 and 731-TA-354, USITC Publication 1966, April 1987, pp1-2. Certain Welded Stainless Steel Pipe from Korea and Taiwan, Inv. Nos. 731-TA-540 and 541 (Second Review), USITCPublication 3877, August 2006, pp. I-1 - I-3.
PREVIOUS AND RELATED SAFEGUARD INVESTIGATIONS
Following receipt of a request from the Office of the United States Trade Representative(“USTR”) on June 22, 2001, the Commission instituted investigation No. TA-201-73, Steel, under section 202 of the Trade Act of 19746 to determine whether certain steel products, including stainless steelwelded tubular products,7 were being imported into the United States in such increased quantities as to bea substantial cause of serious injury, or the threat thereof, to the domestic industries producing articleslike or directly competitive with the imported article.8 On July 26, 2001, the Commission received aresolution adopted by the Committee on Finance of the U.S. Senate (“Senate Finance Committee” or“Committee”) requesting that the Commission investigate certain steel imports under section 201 of theTrade Act of 1974.9 Consistent with the Senate Finance Committee’s resolution, the Commissionconsolidated the investigation requested by the Committee with the Commission’s previously institutedinvestigation No. TA-201-73.10 On December 20, 2001, the Commission issued its determinations andremedy recommendations. The Commission made a unanimous negative determination with respect tostainless steel welded tubular products.11
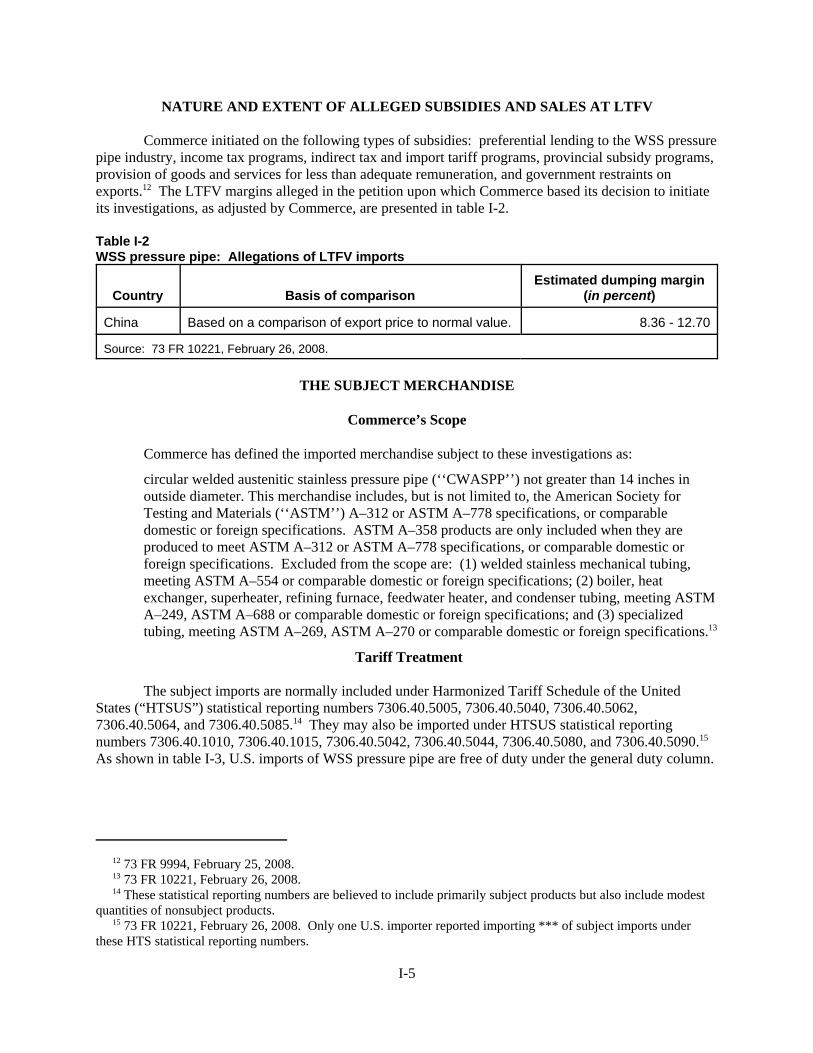
12 73 FR 9994, February 25, 2008. 13 73 FR 10221, February 26, 2008. 14 These statistical reporting numbers are believed to include primarily subject products but also include modestquantities of nonsubject products. 15 73 FR 10221, February 26, 2008. Only one U.S. importer reported importing *** of subject imports underthese HTS statistical reporting numbers.
I-5
NATURE AND EXTENT OF ALLEGED SUBSIDIES AND SALES AT LTFV
Commerce initiated on the following types of subsidies: preferential lending to the WSS pressurepipe industry, income tax programs, indirect tax and import tariff programs, provincial subsidy programs,provision of goods and services for less than adequate remuneration, and government restraints onexports.12 The LTFV margins alleged in the petition upon which Commerce based its decision to initiateits investigations, as adjusted by Commerce, are presented in table I-2.
Table I-2WSS pressure pipe: Allegations of LTFV imports
Country Basis of comparisonEstimated dumping margin
(in percent)
China Based on a comparison of export price to normal value. 8.36 - 12.70
Source: 73 FR 10221, February 26, 2008.
THE SUBJECT MERCHANDISE
Commerce’s Scope
Commerce has defined the imported merchandise subject to these investigations as:
circular welded austenitic stainless pressure pipe (‘‘CWASPP’’) not greater than 14 inches inoutside diameter. This merchandise includes, but is not limited to, the American Society forTesting and Materials (‘‘ASTM’’) A–312 or ASTM A–778 specifications, or comparabledomestic or foreign specifications. ASTM A–358 products are only included when they areproduced to meet ASTM A–312 or ASTM A–778 specifications, or comparable domestic orforeign specifications. Excluded from the scope are: (1) welded stainless mechanical tubing,meeting ASTM A–554 or comparable domestic or foreign specifications; (2) boiler, heatexchanger, superheater, refining furnace, feedwater heater, and condenser tubing, meeting ASTMA–249, ASTM A–688 or comparable domestic or foreign specifications; and (3) specializedtubing, meeting ASTM A–269, ASTM A–270 or comparable domestic or foreign specifications.13
Tariff Treatment
The subject imports are normally included under Harmonized Tariff Schedule of the UnitedStates (“HTSUS”) statistical reporting numbers 7306.40.5005, 7306.40.5040, 7306.40.5062,7306.40.5064, and 7306.40.5085.14 They may also be imported under HTSUS statistical reportingnumbers 7306.40.1010, 7306.40.1015, 7306.40.5042, 7306.40.5044, 7306.40.5080, and 7306.40.5090.15 As shown in table I-3, U.S. imports of WSS pressure pipe are free of duty under the general duty column.

I-6
Table I-3WSS pressure pipe: Tariff treatment, 2008
HTSprovision
StatSuffix Article description
General1 Column 22
Rates (percent advalorem)
7306
7306.407306.40.10
7306.40.50
10
1590
05
15
40
42
44
62
6480
85
90
Other tubes, pipes, and hollow profiles (for example, open seamed orwelded, riveted or similarly closed), of iron or steel:
Other, welded, of circular cross section, of stainless steel: Having a wall thickness of less than 1.65 mm. . . . . . . . . . Containing more than 0.5 percent by weight of nickel Containing more than 1.5 percent but less than 5 percent by weight of molybdenum Other Other
Having a wall thickness of 1.65 mm or more. . . . . . . . . . . Of high-nickel alloy steel Other: Suitable for use in boilers, superheaters, heat- exchangers condensers, refining furnaces and
feedwater heaters, whether or not cold- drawn
Other, cold-drawn or cold-rolled (cold- reduced): Containing more than 0.5 percent but less than 24 percent by weight of nickel
Other: Containing less than 15 percent by weight of chromium
Other
Other: With an outside diameter not exceeding 114.3 mm: Containing more than 0.5 percent but less than 24 percent by weight of nickel: Containing more than 1.5 percent but less than 5 percent by weight of molybdenum Other
Other With an outside diameter exceeding
114.3 mm but not exceeding 406.4 mm: Containing more than 0.5 percent but less
than 24 percent by weight of nickel
Other
Free
Free
36%
11%
1 Normal trade relations, formerly known as the most-favored-nation duty rate applicable to imports from China. 2 Applies to imports from a small number of countries that do not enjoy normal trade relations duty status.
Source: Harmonized Tariff Schedule of the United States (2008).

16 Information in this section is drawn to a large degree from Certain Welded Stainless Steel Pipe From Koreaand Taiwan, Inv. Nos. 731-TA-540 and 541 (Second Review), USITC Publication 3877, August 2006, pp. I-17 to I-23. 17 Other important types of tubes and pipes which are defined by the AISI include standard pipe, line pipe,structural pipe and tubing, mechanical tubing, and oil country tubular goods. All are designed for specificapplications and must meet appropriate engineering standards for those end uses. 18 These types have different microstructures. Austenitic stainless steels comprise over 70 percent of totalstainless steel production. They contain a maximum of 0.15 percent carbon, a minimum of 16 percent chromiumtogether with nickel, and manganese. Ferritic stainless steels (containing at minimum 11.5 percent chromium) arehighly corrosion resistant, but much less durable than austenitic grades and cannot be hardened by heat treatment. Martensitic stainless steels (containing at minimum 11.5 percent chromium) are not as corrosion resistant as theother two grades, but are extremely durable as well as highly machinable, and can be hardened by heat treatment. Asmaller sub-group of stainless steels is called duplex stainless steels. This group has a combined microstructure ofaustenite and ferrite. Duplex stainless steels have improved strength over austenitic stainless steels and also higherresistance to corrosion. Stainless steels can be also classified according to series with different characteristics. Forexample, 300 series stainless steels are austenitic chromium-nickel alloys which, among other things, includes types304, the most common grade, type 304L (similar to 304 grade but specially modified for welding and fabricability),type 316, the second widely used austenitic steel (following 304) for nuclear reprocessing plants, food,pharmaceutical products and surgical stainless steel applications. The addition of molybdenum to type 316 enhanceits resistance to specific type of corrosion and metallic contamination and chloride corrosion relative to type 304.Other series include 400 series (ferritic and martensitic chromium alloys), 500 series (heat resisting chromiumalloys), and 600 series (martensitic precipitation hardening alloys. See AISI, Steel Glossary, found athttp://www.steel.org/AM/Template.cfm?Section=Steel_Glossary2&TEMPLATE=/CM/HTMLDisplay.cfm&CONTENTID=6426, retrieved February 22, 2008; Atlas Publishing Co., Metal Reference and Encyclopedia, p. 140, 1968; andhttp://www.berkeleypoint.com/learning/stainless.html, retrieved February 24, 2008.
I-7
THE DOMESTIC LIKE PRODUCT
Description and Applications16
“Pipes,” “tubes,” and “tubing” are terms that designate hollow forms that are used for conveyinggases, liquids and solids, and for a diversity of mechanical and structural purposes. In general, steel pipes are produced in various grades of carbon, alloy, or stainless steel and are distinguished by end usesas defined by the American Iron and Steel Institute (“AISI”). Most directly relevant in theseinvestigations is pressure pipe, which is used to convey fluids at high temperatures or pressures, or both,and are suitable for heat applications.17 Pressure pipe is typically produced to exact outside diameters anddecimal wall thicknesses, usually to specifications such as those of the American Society for Testing andMaterials (“ASTM”).
AISI defines stainless steel as a general class of steels that contains more than 10 percent ofchromium (Cr) by weight. Chromium gives stainless steel excellent resistance to corrosion and goodstrength at high temperatures and pressure. For these reasons, it is used in corrosive environments, high temperature and pressure conditions, or when cleanliness and ease of maintenance are strictly required. Stainless steel equipment is widely used in automotive, food processing, medical and health equipmentproducts, as well as in the petrochemical industry and the power production industry. Other alloys,including nickel (Ni) and molybdenum (Mo), are also added to obtain additional desirable characteristicsfor various types of stainless steels. Depending on their microstructures and chemical compositions,stainless steels can be generally classified into three main types, namely austenitic, ferritic, andmartensitic stainless steels.18
Both ASTM A-312 and A-778 pipes are made of austenitic stainless steel grade, which is themost popular type of stainless steel, accounting for approximately 70 percent of all stainless steel
19 Schagrin Associates, “Response to the Department of Commerce’s Request for Clarification of the Petition forthe Antidumping Duties on U.S. Imports of Welded Stainless Pressure Pipe from the People’s Republic of China,”February 5, 2008. 20 Schagrin Associates, “Response to the Department of Commerce’s Request for Clarification of the Petition forthe Imposition of Antidumping Duties on U.S. Imports of Welded Stainless Pressure Pipe from the People’s Republicof China,” February 5, 2008, p. 1. 21 Other ASTM pipe and tube specifications include A-249, A-269, A-270, and ASTM tube specifications includeA-358, and A-409. In general, the descriptions of the uses for various types of welded stainless steel tubularproducts are taken from Certain Welded Stainless Steel Pipes from the Republic of Korea and Taiwan, Invs. Nos.731-TA-540-541 (Second Sunset Review), USITC Publication 3877, December 1992, pp. I-10 and I-11, unlessotherwise noted. The physical description of the various grades of WSS pressure pipe is compiled from thestandards and specifications published by the ASTM. 22 Annealing is a process in which the subject material is heated to a temperature of over 1,900 degrees Fahrenheitfollowed by controlled cooling. This specific heat treatment technique alters the micro-structure of the subject material, causing changes in properties such as strength and hardness. 23 Certain Welded Stainless Steel Pipe From Korea and Taiwan, Inv. Nos. 731-TA-540 and 541 (Second Review),USITC Publication 3877, August 2006, p. I-15. 24 Certain Welded Stainless Steel Pipe From Korea and Taiwan, Inv. Nos. 731-TA-540 and 541 (Second Review),USITC Publication 3877, August 2006, p. I-15. 25 Certain Welded Stainless Steel Pipe From Korea and Taiwan, Inv. Nos. 731-TA-540 and 541 (Second Review),USITC Publication 3877, August 2006, p. I-15.
I-8
production. In addition, products made to A-358 specifications (included when they are produced to meetASTM A-312 or ASTM A-778 specifications) are made of austenitic stainless steel.
As discussed later in the section on “Manufacturing processes,” ASTM A-312 or ASTM A-778products of 14 inches or less in diameter are typically produced on the same machinery and equipment. In contrast, domestic producers reportedly are unable to use a continuous welding process for sizes largerthan 14 inches.19 For larger sizes, domestic producers use either the batch process or the spiral weldingprocess for forming and welding.20
The term “WSS pressure pipe,” in this case, includes any welded pipe that is made fromaustenitic stainless steel to ASTM specifications A-312 and A-778 or equivalent.21 As specified by theASTM, A-312 pipes are designed for high temperature and general corrosive service, and must beannealed.22 Major uses for welded A-312 pipes include digester lines, pharmaceutical production lines,petrochemical stock lines, automotive paint lines, and various processing lines such as those in breweries,paper mills, and general food facilities.23 A-778 pipes are most often used in the pulp/paper industry andfor wastewater applications, owing to its ability to withstand high temperatures and corrosive contact,albeit somewhat less than A-312 pipes. A-778 pipes are also used in corn processing (to ethanol) andlow-pressure fluid transfer systems.24
Although stainless steel tubular products as a group are defined by their anti-corrosive and highstrength characteristics, they are designed for a wide variety of applications under different operatingconditions and made by different processes as specified by the ASTM. Consequently, certain types ofstainless steel products may be distinguished from WSS pressure pipe.
ASTM A-249, A-269, and A-688 tubes are used primarily in heating and cooling apparatusessuch as heat exchangers, condensers, boilers, and feed water heaters. Among the industries using thesetubing products are producers of ethanol, pharmaceuticals, and foods and beverages.25 ASTM A-270tubes have a polished finish on either the inside or the outside of the tube, or both, and are intended forapplications in the dairy and food industries. ASTM A-358 pipes are used in critical applications wherefailure of the weld might have serious consequences, such as in nuclear power plants and liquified naturalgas facilities. According to Commerce’s scope, A-358 pipes are only included when they are produced tomeet ASTM A-312 or A-778 specifications. ASTM A-409 products are thin-walled mechanical tubing. They are generally used in applications requiring withstanding corrosive or high- temperature conditions,
26 Conference transcript, p. 86 (Tidlow). 27 An additional method of WSS pipe and tube manufacture is the less commonly used spiral-weld process inwhich a steel strip is spiraled and welded along the spiral. This process can be used to produce pipes of anydiameter, but the looped weld running throughout the product, rather than along a single straight weld, is reportedlya disadvantage in terms of weld refinement and potential end use. The spiral-weld process cannot be used forwelded A-312 pipes, as that ASTM specification requires straight-seam welding. The spiral-weld process is onlyused for larger-diameter pressure pipes and tubes, and requires a separate non-inline annealing step owing to thenonlinear weld. 28 Conference transcript, p. 31 (Schagrin). 29 This is called a batch process (rather than “continuous”) because each individual length of pipe is bent andwelded individually. 30 Staff telephone interview with ***. 31 Also known as the gas tungsten-arc welding (“GTAW”) process. 32 Although the TIG and plasma process can use filler metal, the laser process does not allow for the use of fillermetal. WSS pressure pipe produced in accordance with the standard for ASTM A-312, according to the ASTM, maynot be made with filler metal.
I-9
such as in automotive exhaust-converter systems and water well casings. Petitioners stressed that mostimports from Canada are of this grade.26
Manufacturing Processes
Two common methods can be used to form the tubular shape of WSS pressure pipe, thecontinuous-mill process and the press-brake process.27 The continuous-mill process, which is theprincipal method of producing WSS pressure pipe, begins with coils of sheet, strip, or plate. Coiled steel,of a width essentially equal to the outside diameter of the pipe to be produced, is set up in an uncoiler andfed into a series of paired forming rolls. As it progresses through the rolls, its cross-sectional profile isformed into a tubular shape with the butted edges ready for welding as described below. Petitionersreport that domestic producers use this process for diameter sizes between 2 and 14 inches.28
The second method of manufacturing welded stainless steel tubular products is a batch process inwhich a press gradually bends cut-to-length sheet into a cylindrical shape with the butted edges ready forwelding as described below.29 The starting sheet is of a width essentially equal to the outside diameterand a length equal to the length of the piece of pipe to be produced. The press-brake process islabor-intensive, and is used primarily for the production of pipes with diameters typically above 16inches, although one U.S. producer, ***, does produce WSS pressure pipe using this method.30
In the welding stage, the butt edges are welded together by an automatic welding machine usingeither the tungsten inert gas (“TIG”) welding process,31 the plasma welding process, or the laser weldingprocess. These methods allow welding without filler material,32 complete fusion of butted edges, andshielding of the weld area with inert gas to prevent oxidation. In the TIG welding process, welding heatis provided by an electric arc between a tungsten electrode and the pipe edges. The plasma weldingprocess is similar to the TIG process in that the plasma (a gas) is heated as it passes through an arc torchwhich is created by an electrode within a nozzle. In the laser welding process, a laser beam is directed tothe weld butt joint, forming a deep-penetration fusion weld. The laser process is capable of a higherspeed of operation than is the TIG process. For continuous welded pipe, the pipe continues after welding

33 In-line annealing normally is performed in a nonoxidizing atmosphere, a process known as “bright annealing.” Product that is annealed by other than bright annealing must be pickled in acid to remove surface oxides and producea “bright” finish. 34 ASTM A-249 and A-269 specifications for pressure tubes are similar to that for A-312 pipes in that the processof annealing is required after welding. Tubular products produced to A-249 specification must be cold worked(planished) in the weld bead before annealing. Cold-working and planishing are finishing steps to assure a smoothsurface, particularly in the area of the weld. Cold-working is defined as “altering the shape or size of a metal byplastic deformation. Processes include rolling, drawing, pressing, spinning, extruding and heading, it is carried outbelow the recrystallisation point, usually at room temperature. Hardness and tensile strength are increased with thedegree of cold work while ductility and impact values are lowered. The cold rolling and cold drawing of steelsignificantly improves surface finish.” Planishing is defined as producing a smooth surface finish on metal by rapidsuccession of blows delivered by highly polished dies or by a hammer designed for the purpose, or by rolling in aplanishing mill. Alternatively, and for tube too small in diameter to weld, the product tubing must be cold drawnfrom a larger size and subsequently annealed and pickled. The A-269 specification is similar to A-249 in that itrequires post-weld annealing but A-269 products may or may not be cold worked, depending upon the diameter, wallthickness, and manufacturer’s capabilities. For some products, the removal or smoothing of the interior weld bead isrequired prior to annealing. 35 Petitioners’ postconference brief, p. 1. 36 Conference transcript, pp. 96-98 (Jakob). Silbo did not submit a postconference brief. 37 Type 304 is the most widely used austenitic stainless steel. It is resistant to food processing environments,except for high-temperature conditions involving high acid and chloride contents, and it resists organic chemicals,
(continued...)
I-10
through an in-line annealing furnace,33 then through straightening and, finally, cutting to length.34 Batchwelded pipe must be annealed in a separate operation, and subsequently pickled in acid.
Marketing
WSS pressure pipe is largely sold to distributors, and rarely sold directly to end users, aspresented in table I-4.
Table I-4WSS pressure pipe: U.S. producers’ and importers’ shares of reported U.S. shipments, by sourcesand channels of distribution, 2005-07
* * * * * * *
DOMESTIC LIKE PRODUCT ISSUES
The petitioners contend that the Commission should find one domestic like product that is co-extensive with the scope of merchandise subject to the investigations as identified by Commerce.35 At theCommission’s staff conference, U.S. importer Silbo argued that there is no basis for excluding pressurepipe greater than 14 inches in diameter from the domestic like product.36
Physical Characteristics and Uses
Most stainless steel pipes are produced to conform to one or more of the standard specificationspublished by the ASTM. Welded stainless steel tubular products include ASTM A-312 and A-778,ASTM A-358 and A-409 pipes, and ASTM A-249, A-269, and A-270 pressure tubes. Most are producedin either of two common grades (defined by chemical composition and physical requirements) of stainlesssteel, namely 304/304L or 316/316L.37

37 (...continued)dyestuffs, and a wide variety of inorganic chemicals. Type 316 has corrosion resistance superior to that of Type 304in many types of chemical corrodents, as well as marine atmospheres. It also has higher strength at elevatedtemperatures. Type 316 contains a minimum of 2 percent of molybdenum and 10 percent of nickel compared to nomolybdenum and 8 percent of nickel in Type 304. The chromium content of Type 316 is 16 percent compared to 18percent for Type 304. Both Types 304 and 316 contain a maximum of 0.08 percent of carbon. Extra-low carbongrades, Types 304L and 316L, containing a maximum of 0.03 percent carbon, are more suitable for applicationsinvolving welding. Welded pipes and tubes are usually produced using steel that meets the requirements of both theregular grade and the extra-low carbon grade, designated 304/304L or 316/316L. Iron & Steel Society, SteelProducts Manual: Stainless Steels, 1999, pp. 86 and 114. 38 Certain Welded Stainless Steel Pipe From Korea and Taiwan, Inv. Nos. 731-TA-540 and 541 (Second Review),USITC Publication 3877, August 2006, p. I-19. 39 ASTM A-778 is listed in the ASTM as having diameter of 3" to 14". However, a note attached to the ASTMstates that if the pipe meets the other ASTM specifications even though it is a non-included diameter, it can still beclassified as A-778. 40 Conference transcript, p. 46 (Schagrin). 41 Certain Welded Stainless Steel Pipe From Korea and Taiwan, Inv. Nos. 731-TA-540 and 541 (Second Review),USITC Publication 3877, August 2006, p. I- 22. 42 Conference transcript, p. 65 (Avento); See also staff telephone interview with ***.
I-11
ASTM specification A-312 is the most common specification for stainless steel pipe, andaccounts for much of the welded stainless steel pipe consumed in the United States.38 The specificationfor A-312 pipe requires that it be straight-seam welded without the use of filler metal in the weld, and thatthe pipe be annealed after welding. Welded A-312 pipes are designed for high temperature and generalcorrosive service. ASTM A-778 pipe is most similar to A-312, but differs in the welding process and inthat A-778 post-weld annealing of the pipe is not required.39
*** reported the larger-diameter WSS pressure pipe market is different in several ways. First, amuch larger share of this product is produced to the A-358 specification, *** for 2005-07. Second, thisproduct is predominantly used in the liquid natural gas and waste water treatment markets, markets thatare not really present in the smaller diameter categories. *** reported that the similarities are limited toshape and some common industry uses. However, as 14 inch and smaller pipe is produced to muchtighter tolerances and is manufactured with different methods, the weld seam that is a result of themanufacturing process in producing greater than 14 inch pipe is more prevalent. This weld seam is nottypically cold worked, ironed, or planished as is the norm with the 14 inch pipe and is typically used inlarge air duct systems, waste water plants, and mining. *** reported that larger sizes are commonly usedin liquid natural gas systems, large size water transmission, pulp and paper production, oil refining andmining. They are typically used in capital projects and generally purchased by engineering orconstruction companies, or end users directly, or on a bid basis through a distributor.
Manufacturing Facilities, Employees, and Processes
Firms producing both welded ASTM A-312 and A-778 pipes can use the same facilities andworkers to produce both grades (except that A-778 pipes do not require annealing).40 Other (non-A-778)welded stainless steel pipes and pressure tubes have been reported to be produced at the same facilities aswelded A-312 pipes.41 However, domestic producers typically specialize in certain size ranges. Forexample, *** generally manufactures products which are larger than 14 inches in diameter whileMarcegaglia only produces tubes with smaller than 14 inch diameters. Outokumpu’s south plantprimarily makes pipes of up to 6 inches in diameter while the north plant manufactures larger sizes.42 That is because, as mentioned before, pipes with diameters above 14 inches are typically produced by thepress-brake method, a batch process, while smaller tubes are generally manufactured by a continuous-mill

43 Conference transcript, p. 31 (Schagrin). 44 Certain Welded Stainless Steel Pipe From Korea and Taiwan, Inv. Nos. 731-TA-540 and 541 (Second Review),USITC Publication 3877, August 2006, p. I- 20. 45 Certain Welded Stainless Steel Pipe From Korea and Taiwan, Inv. Nos. 731-TA-540 and 541 (Second Review),USITC Publication 3877, August 2006, p. I- 20.
I-12
process. These two manufacturing processes reportedly require different equipment and are operated byemployees with different skills and training.43
*** reported that the vast majority of the larger than 14 inch pipes are produced on a batch millprocess, one piece at a time, versus a continuous mill process that is much more efficient in terms of costsand time. Costs can be *** percent more for the batch process and production cycles can be *** longer toachieve only a small fraction of the continuous mill production footage. *** reported that themanufacturing processes are “completely different,” that the 14 inch and smaller diameter pipe is made oncontinuous tube mills where automatic welding is utilized that requires minimal operator intervention andthe raw coil is slit to width. Greater than 14 inch diameter pipe is produced one piece at a time using a“press break” operation. The pipe cylinder is rolled in 10' or 20' lengths and then welded together with a“seamer” weld operation. Semi-automatic welding is utilized, requiring constant operator intervention. The skill set of the trained employee “is completely different and not interchangeable without additionaltraining.” *** also reported that large diameter pipe is usually made piece by piece in a “batch” process,using different equipment, from individual plates, rather than from continuous coils.
Interchangeability and Customer and Producer Perceptions
U.S. producers and importers were asked to identify any products that may be substituted forWSS pressure pipe. None of the responding questionnaire recipients identified larger diameter pipeproduced to ASTM specifications A-312 or A-778 as a substitute for WSS pressure pipe. Also, none ofthe responding producers identified ASTM A-358 pipe (generally reserved for critical applications),pressure tubes such as ASTM A-249, A-269, and A-270 (generally used in heat exchangers, condensers,boilers, and feed water heaters, or in dairy applications), or mechanical tubing as a substitute for WSSpressure pipe. Similarly, most importers identified no welded stainless steel substitutes for WSS pressurepipe, although two indicated that welded pipe produced from other nickel/chromium alloys or fromduplex stainless steel could substitute for WSS pressure pipe.
According to domestic producers, A-312 and A-778 pipes are the only “true pressure pipeproducts.”44 The domestic producers note that “A-312 is always substitutable for A-778, but A-778 isnever substitutable for A-312.”45
*** reported that the larger diameter and smaller diameter categories have little or nointerchangeability as they are specified by size and gauge for specific uses. *** reported that specificdiameter requirements are specified by an engineering company and are not likely interchangeable. ***reported that the project specifications determine the size of the pipe, thus larger welded pipe is generallynot interchangeable with smaller sizes.
*** reported that customers and producers perceive the larger than 14 inch WSS pressure pipe asa different product than the smaller diameters. First, the products are manufactured differently. Second,both the mills and the distributors keep very few inventories of the larger diameter pipes but rather sell toend users. Third, most of these items are custom made to specifications, gauges and testing requirementsthat are not typical of inventoried pipes. X-ray, eddy current, dye penetrant and corrosion testing aretypical supplemental requirements for larger than 14 inch pipe that are seldom seen on smaller diameterpipes. *** reported that large pipe is usually for more critical applications requiring a high degree ofquality.
I-13
Channels of Distribution
As discussed earlier, the vast majority of U.S. shipments of WSS pressure pipe less than or equalto 14 inches are sold through distributors. In contrast, *** reported that larger than 14 inch pipe ischaracterized by direct selling to end users as compared to inventories at the master distributors. Even if sold to a master distributor, the larger-diameter pipe is most often destined to a specific customer for aspecific project, rather than for inventory. *** reported that greater than 14 inch diameter pipe is nottypically stocked at distribution. This product is purchased for projects by distributors as required andtypically shipped directly to job sites. *** reported that large pipe is usually sold directly to the user orfabricator or as part of a package put together by a distributor including fittings, flanges, and otherproducts.
Price
In aggregate, the average unit values for U.S. shipments of WSS pressure pipe less than or equalto 14 inches were $*** per short ton in 2005, $*** in 2006, and $*** in 2007. By comparison, theaverage unit values for WSS pressure pipe greater than 14 inches were higher: $*** in 2005, $*** in2006, and $*** in 2007. Pricing practices and prices reported for WSS pressure pipe in response toCommission questionnaires are presented in Part V of this report. *** reported smaller diameter pipe istypically priced as listed and discounted from price sheets. The larger diameters are sold as cost plus amark-up. *** also reported that, unlike for smaller pipe, there is no industry list price sheet for greaterthan 14 inch diameter pipe. Also, price discounting is far less prevalent when quoting greater than 14inch pipe. *** reported that larger diameter pipe generally carries a greater price per pound because it ismore labor intensive to produce.


1 Certain Welded Stainless Steel Pipe From Korea and Taiwan, Inv. Nos. 731-TA-540 and 541 (Second Review),USTC Publication 3877, August 2006.
II-1
PART II: CONDITIONS OF COMPETITION IN THE U.S. MARKET
U.S. MARKET CONDITIONS AND CHARACTERISTICS
The primary factors affecting WSS pressure pipe usage are capital investment projects bychemical and petrochemical plants, grain processing (ethanol plants), food and beverage processingplants, power generation plants, and pulp and paper mills.1 The demand for WSS pressure pipe dependson demand for downstream products using A-312 pipe and typical end users include the chemical andpharmaceutical industry, food and beverage industry, power generation industry, and the pulp and paperindustry.
Producers and importers were asked to estimate the share of their sales that occurred withincertain distance ranges. Four of the five responding U.S. producers reported nationwide sales and theremaining U.S. producer reported that it sold it products in the Northeast, Mid-Atlantic, Midwest,Southeast, West Coast, Southeast, and Northwest. On average, U.S. producers sold 6.3 percent of theirWSS pressure pipe within 101 miles of their storage or production facilities, 78.2 percent between 101and 1,000 miles, and 15.5 percent beyond 1,000 miles. Seven of the ten responding importers alsoreported nationwide sales; another reported sales to the Northwest, Southeast, Mid-Atlantic, Mid-West,and Great Lakes; another reported sales in the Mid-Atlantic; and the remaining importer reporting sales inthe Southeast, Mid-West, and the West Coast. On average, U.S. importers of Chinese WSS pressure pipesold 39.5 percent of their WSS pressure pipe within 100 miles of their entry or storage facilities, 22.9percent between 101 and 1,000 miles, and 37.5 percent over 1,000 miles.
CHANNELS OF DISTRIBUTION
Both domestic and imported WSS pressure pipe are sold to distributors and end users. During2005-07, the vast majority of U.S. producers’ shipments of WSS pressure pipe was shipped todistributors. The share shipped to distributors decreased slightly from *** percent in 2005 to *** percentin 2007. Four of the five responding U.S. producers of WSS pressure pipe shipped to both distributorsand end users while the other shipped exclusively to distributors.
U.S. shipments of subject imported WSS pressure pipe also went primarily to distributors. During 2005-07, *** percent of U.S. shipments of WSS pressure pipe imported from China (on average)were to distributors. Table II-1 presents information on channels of distribution for U.S. producers aswell as for U.S. importers of subject SSW pressure pipes from China and from all other countries.

II-2
Table II-1WSS pressure pipe: U.S. producers’ and importers’ shares of reported U.S. shipments, by sourcesand channels of distribution, 2005-07
* * * * * * *
SUPPLY AND DEMAND CONSIDERATIONS
U.S. Supply
Domestic Production
Based on available information, U.S. producers of WSS pressure pipe have the ability to respondto increases in demand with relatively large increases in shipments of U.S.-produced WSS pressure pipeto the U.S. market. Should demand increase, U.S. producers have ample available capacity and moderateinventory levels with which they could respond. Should demand decrease, however, producers are likelyto be limited in their ability to switch resources into producing alternative products or to move productinto export markets. Factors contributing to this degree of responsiveness of supply are discussed below.
Industry capacity
Total U.S. capacity increased from *** short tons in 2005 to *** short tons in 2007, or by ***percent. U.S. producers’ reported capacity utilization for WSS pressure pipe decreased from *** percentin 2005 to *** percent in 2007. These levels of capacity utilization indicates that U.S. producers of WSSpressure pipe have ample available capacity with which they could increase production of WSS pressurepipe in the short run in the event of a price change.
Alternative markets
U.S. producers’ exports of WSS pressure pipe were low over the period for which data werecollected, accounting for *** percent of total shipments in 2007. Exports decreased from *** short tonsin 2005 to *** short tons in 2007, or by *** percent. The low levels of exports during the period of forwhich data were collected indicates that domestic producers of WSS pressure pipe are constrained in theirability to shift shipments between the United States and other markets in the short run in response to pricechanges.
Inventory levels
U.S. producers of WSS pressure pipe reported that end-of-period inventory quantities declinedfrom *** short tons in 2005 to *** short tons in 2007, or by *** percent. U.S. producers also reportedthat the ratio of U.S. producers’ inventory to total shipments of WSS pressure pipe increased from ***percent in 2005 to *** percent in 2007. Overall, these inventory levels (relative to total shipments)indicate that U.S. producers have the ability to respond to changes in demand by changing theirinventories.

2 Conference transcript, p. 69 (Cornelius).
II-3
Production alternatives
*** reported producing other products using the same equipment or machinery or using the samelabor as it used to produced WSS pressure pipe. Petitioner Marcegaglia stated that no other productswere produced on its mills besides WSS pressure pipe.2
Subject Imports from China
Imported WSS pressure pipe from China increased by 225.2 percent from $47.9 million in 2005to $155.8 million in 2007. On an absolute basis, U.S. subject imports from China increased from 14,486short tons in 2005 to 30,574 short tons in 2007. Based on information provided by one Chinese producer,supplies of subject imports of WSS pressure pipe from China are likely to respond to changes in demandwith large changes in the quantity shipped to the U.S. market. Factors contributing to the degree ofresponsiveness of supply are discussed below.
Industry capacity
Reported Chinese capacity remained constant at *** short tons during 2005-07. Capacityutilization increased from *** percent in 2005 to *** percent in 2006 before declining to *** percent in2007. These data indicate that Chinese suppliers of WSS pressure pipe have excess capacity with whichto increase production of subject product in the event of a change in demand.
Alternative markets
Shipments to the home market accounted for a small and declining portion of total reportedshipments of WSS pressure piped by the responding Chinese firm, falling from *** percent in 2005 to*** percent in 2007. All reported exports went to markets in ***. The one responding Chinese producer,Winner Stainless Steel Tube Co., reported that more than *** percent of its shipments of WSS pressurepipe were to the United States, with less than *** exported to other markets. Overall, however, availabledata indicate that foreign producers in China have some ability to divert substantial shipments fromalternative markets in response to changes in the U.S. market conditions regarding WSS pressure pipe.
Inventory levels
Data on Chinese producers’s inventory levels indicate that, between 2005 and 2007, inventoriesas a share of total shipments fell from *** percent in 2005 to *** percent in 2007. These data indicatethat Chinese producers have only limited ability to use inventories as a means of increasing shipments ofWSS pressure pipe to the U.S. market.
Production alternatives
The one responding Chinese producer, Winner Stainless Steel Tube Co., reported that equipmentused to produce WSS pressure pipe could manufacture welded stainless steel mechanical tubing as well. Overall, approximately *** percent of Winner’s total sales in 2007 were of WSS pressure pipe.
3 Certain Welded Stainless Steel Pipe From Korea and Taiwan, Inv. Nos. 731-TA-540 and 541 (Second Review),USITC Publication 3877, August 2006. 4 In contrast, the thicker-walled A-358 pipes are used in highly critical applications such as nuclear power plantsor liquid gas facilities. WSS pressure pipe tubes such as A-269 or A-249 have a broader range of applicationsalthough many are used in heating and cooling applications. Tube products are normally ordered to meet customers’exact specifications, whereas pipe products are normally sold in standard sizes. No responding producer or importerreported changes in the end uses of WSS pressure pipe.
II-4
U.S. Demand
Based on available information, U.S. consumers of WSS pressure pipe are likely to respond tochanges in the price of WSS pressure pipe with moderate changes in their purchases of WSS pressurepipe. High pressure pipes are necessary for many production facilities, and while substitutes areavailable, they are either more expensive (as in the case with seamless pipe) or are not as corrosiveresistant as stainless steel (as in the case with plastics or other materials).
Demand Characteristics
U.S. demand for WSS pressure pipe depends primarily on the level of demand for downstreamproducts using WSS pressure pipe.3 WSS pressure pipe are used primarily as a conduit for liquids orgasses, heat exchange, and other purposes in the chemical and petrochemical industry, food and beverageprocessing industry, power generation industry, and pulp and paper industry. Major uses for WSSpressure pipe include digester lines, pharmaceutical production lines, petrochemical stock lines,automotive paint lines, and various other processing lines such as those in paper mills, breweries, andfood processing facilities. Since WSS pressure pipes are annealed, they can withstand very high heat andare corrosion resistant. This is not the case with A-778 pipes, which are not annealed and thereforecannot withstand temperatures above 800 degrees Fahrenheit. A-788 pipes are therefore used in lessdemanding applications such as paper manufacturing.4 Available data indicates that total apparent U.S. consumption of WSS pressure pipe increasedfrom *** short tons in 2005 to *** short tons in 2007. When asked if demand for WSS pressure pipe hadchanged since January 1, 2005, three of the four responding U.S. producers reported that U.S. demandhad increased between 2 to 5 percent per year and that this increase was driven by economic expansionand higher per capita consumption of stainless steel. One U.S. producer indicated that during the recentexpansion cycle in the United States, all the growth in demand was captured by imports from China. Another U.S. producer indicated that there had been no change in demand for WSS pressure pipe as itremained steady since January 2005. Six of ten responding importers reported that U.S. demand hadincreased, two reported that it had fluctuated, and one reported that it had decreased. Reasons given forthe increase in U.S. demand included more consumption per capita and the growing demand forrenewable fuels (ethanol and bio-diesel plants). High domestic prices for domestically produced WSSpressure pipe was given as the principal factor behind declining U.S. demand. One importer reported thatdemand appeared to be down over the last 2 to 3 months of 2007 and it indicated that there had been anincrease in demand in China and in other developing Asian countries.
Substitute Products
U.S. producers and importers were asked to list any products that may be substituted for WSSpressure pipe. Four of five responding U.S. producers reported that there are direct substitutes for WSSpressure pipe, whereas the remaining importer reported that there were no substitutes. The mostfrequently mentioned substitutes were coated carbon steel pipe, fiberglass reinforced plastics (FRP), and

II-5
high density polyethylene (HDPE), seamless stainless steel pressure pipe, and other nickel-chromiumbased alloys. One U.S. producer indicated that coated carbon steel pipe could be use as a substitute inenergy and petrochemical applications, whereas, another indicated that substitutes find their way into themarket when prices for stainless steel are high. These substitutes reportedly have a shorter installed life;nonetheless, in recent years they have replaced stainless steel pipe in waste water treatment projects andpulp and paper plants.
Cost Share
Since most responding U.S. producers and importers of WSS pressure pipe are distributors or sellto distributors, they were unable to provide useful information regarding the share of end-use costsaccounted for by WSS pressure pipe.
SUBSTITUTABILITY ISSUES
The degree of substitution between imported WSS pressure pipe and U.S.-produced WSSpressure pipe depends upon such factors as end uses, relative prices, quality, and conditions of sales (e.g.,order lead times, availability, price discounts/rebates, payment terms, product services, etc.), purchasersupply requirements, and product differentiation. Product differentiation depends on factors such as therange of products and the market perception of these factors. Based on available data, staff believes thatwhile there may be some differences between domestic WSS pressure pipe and imported WSS pressurepipe in factors such as availability, product range, and delivery, among others, overall there is a very highdegree of substitution between WSS pressure pipe from the United States and WSS pressure pipe fromChina. However, the degree of substitution between imported WSS pressure pipe and U.S.-producedother than WSS pressure pipe may be lower, and depends on the characteristics and end uses of eachspecific domestic product considered.
Comparison of Domestic Products, Subject Imports, and Nonsubject Imports
Producers and importers were asked to report how frequently WSS pressure pipe from differentcountries are interchangeable (table II-2). The four responding U.S. producers reporting knowledge ofboth Chinese and U.S.-produced WSS pressure pipe indicated that they were always interchangeable. Similarly, seven importers reporting knowledge of both Chinese and U.S.-produced WSS pressure pipereported that Chinese and U.S.-produced WSS pressure pipe were always interchangeable. One importer,***, however, noted that it is very important to understand the significance of the price of nickel indetermining the price of stainless pipe and to appreciate the level of volatility in the price of nickel, coil,and pipe. *** also reported that it is critical to understand differences in price quotations. *** indicatedthat it quoted prices for mills that would ship WSS pressure pipe on a fixed price for delivery four months(on average) into the future. Domestic delivery is done possibly in a month or less, may be cancelled, andprices may not be fixed (subject to surcharges).
Three producers that compared U.S. products with those from Taiwan, Malaysia, and Koreareported that products from these countries can always be used interchangeably. Five importers reportedthat products from Taiwan can always be used interchangeably, four importers reported that productsfrom Korea can always be used interchangeably, and five importers reported that products from Malaysiacan be used interchangeably.

II-6
Table II-2WSS pressure pipe: Perceived degree of interchangeability of products produced in the UnitedStates, imported from China, and imported from third countries and sold in the United States1
Country comparison
U.S. producers U.S. importers
A F S N O A F S N O
U.S. vs. China 5 0 0 0 0 7 0 0 0 1
U.S. vs. Taiwan 3 0 0 0 1 5 0 0 0 3
U.S. vs. Korea 3 0 0 0 1 4 0 0 0 3
U.S. vs. Malaysia 3 0 0 0 1 5 0 0 0 3
U.S. vs. Thailand 0 0 0 0 0 0 0 0 0 0
U.S. vs. Other nonsubject countries 6 0 0 0 1 9 0 0 0 7
China vs. Taiwan 2 0 0 0 2 5 0 0 0 3
China vs. Korea 2 0 0 0 2 5 0 0 0 3
China vs. Malaysia 2 0 0 0 2 5 0 0 0 3
China vs. Thailand 0 0 0 0 0 0 0 0 0 0
China vs. Other nonsubject countries 5 0 0 0 2 9 0 0 0 7
1 Producers and importers were asked if WSS pressure pipes produced in the United States and in othercountries are used interchangeably.
Note: “A” = Always, “F” = Frequently, “S” = Sometimes, “N” = Never, and “0” = No familiarity.
Source: Compiled from data submitted in response to Commission questionnaires.
Factors Affecting Purchasing Decisions
Producers and importers were asked to assess how often differences other than price weresignificant in sales of WSS pressure pipe from different sources (table II-3). Three of five respondingU.S. producers reported that non-price differences between U.S.-produced and Chinese-produced WSS pressure pipe are never a factor in their sales of WSS pressure pipe, the fourth reported that it issometimes a factor, and the fifth reported that it is always a factor. Three responding importers of WSSpressure pipe reported that non-price differences between U.S.-produced and Chinese-produced WSSpressure pipe are always a factor, two reported that they are frequently a factor, two reported that they aresometimes a factor, and one reported that they are never a factor. One importer reported that perceivedquality differences, end user acceptance, availability, and other factors are importance differences.
Two producers reported that non-price differences between U.S.-produced and Korean-produced,Malaysian-produced, and Taiwan-produced WSS pressure pipe were never a factor in their sales of WSSpressure pipe and one producer reported that non-price differences between U.S.-produced and Korean-produced, Malaysian-produced, and Taiwan-produced WSS pressure pipe were always a factor in theirsales. Two importers reported that non-price differences between U.S.-produced and Korean-produced,Malaysian-produced, and Taiwan-produced WSS pressure pipe were always a factor in their sales, tworeported that it was frequently a factor, one reported that it was never a factor with Malaysian-producedand Taiwan-produced, and three reported that it was never a factor in their sales.

II-7
Table II-3WSS pressure pipe: U.S. producers’ and importers’ perceptions concerning the importance ofnon-price differences in purchases of WSS pressure pipe from the United States and othercountries1
Country comparison
U.S. producers U.S. importers
A F S N O A F S N O
U.S. vs. China 1 0 1 3 0 3 2 2 1 1
U.S. vs. Taiwan 1 0 1 2 1 2 2 1 1 3
U.S. vs. Korea 1 0 1 2 1 2 2 0 1 4
U.S. vs. Malaysia 1 0 1 2 1 2 2 1 1 3
U.S. vs. Thailand 0 0 0 0 0 0 0 0 0 0
U.S. vs. Other nonsubject countries 2 0 1 4 3 4 4 0 2 8
China vs. Taiwan 0 0 0 2 2 2 2 1 1 3
China vs. Korea 0 0 0 2 2 2 2 0 1 4
China vs. Malaysia 0 0 0 2 2 2 2 1 1 3
China vs. Thailand 0 0 0 0 0 0 0 0 0 0
China vs. Other nonsubject countries 1 0 0 4 4 4 4 0 2 9
1 Producers and importers were asked if factors other than price were a significant factor in their sales of WSSpressure pipe.
Note: “A” = Always, “F” = Frequently, “S” = Sometimes, “N” = Never, and “0” = No familiarity.
Source: Compiled from data submitted in response to Commission questionnaires.


1 “Trent Tube Unit In Carrollton To Close Doors,” American Metal Market, April 6, 2004. “After Five Years OfHigh Hopes, Trent Pulls Out The Low-End Pipe,” American Metal Market, April 12, 2004. 2 About 50 hourly workers and 12 salaried employees lost their jobs when the Carrollton plant closed 2004. 3 ASTM A-358 is not made domestically to the A-312 or A-778 specifications. Conference transcript, p. 48-49(Boling, Cornelius, Schagrin). 4 Petitioners estimated the production for three nonresponding U.S. firms: Alaskan Copper (*** short tons), RathGibson (*** short tons), and Swepco Tube (*** short tons). Petitioners’ postconference brief, exh. 1. With respectto Alaskan Copper, however, sales of A-312 pipe ***. Correspondence from Alaskan Pipe, April 21, 2006(retrieved from the record in Inv. Nos. 731-TA-540 and 541 (Second Review)). With respect to Rath Gibson, thefirm reported it produces WSS pressure pipe and ***. Staff telephone interview with ***. With respect to Swepco,it reported that about *** percent of its production of WSS pressure pipe is 14 inches or less in diameter, and theremaining *** of its production is over 14 inches. Swepco can produce ***. Staff telephone interview with ***.
III-1
PART III: U.S. PRODUCERS’ PRODUCTION, SHIPMENTS, ANDEMPLOYMENT
The Commission analyzes a number of factors in making injury determinations (see 19 U.S.C. §§1677(7)(B) and 1677(7)(C)). Information on the alleged margin of dumping and the alleged subsidieswas presented earlier in this report and information on the volume and pricing of imports of the subjectmerchandise is presented in Parts IV and V. Information on the other factors specified is presented in thissection and/or Part VI.
U.S. PRODUCERS
The Commission sent producer questionnaires to all firms identified in the petition as domesticproducers of WSS pressure pipe and to other domestic firms identified by public sources as producers ofwelded stainless steel tubular products. Five firms that are estimated to account for nearly *** percent ofU.S. production of WSS pressure pipe during 2007 provided responses to the Commission’s producerquestionnaire.
Presented in table III-1 is a list of current domestic WSS pressure pipe producers, eachcompany’s position on the petition, production locations, related and/or affiliated firms, and their sharesof 2007 reported domestic production of WSS pressure pipe. In addition to the reporting activeproducers, Crucible Materials Corp. closed its Trent Tube division’s Carrollton, GA, pipe operations inJune 2004, because the plant had lost market share and had suffered operating losses for the previous fiveyears.1 Crucible blamed the plant’s unprofitable performance on over-capacity in the U.S. industry andlow cost imports.2
U.S. CAPACITY, PRODUCTION, AND CAPACITY UTILIZATION
In 2007, *** percent of U.S. producers’ production of WSS pressure pipe was ASTM A-312 and*** percent was A-778.3 No U.S. producer reported “other” forms of WSS pressure pipe. In addition,*** percent of their 2007 production was less than or equal to 4.5 inches in outside diameter, and ***percent was 4.5-14 inches. Producers’ capacity, production, and capacity utilization data for WSSpressure pipe are presented in table III-2. These data show an increase in the capacity to produce WSSpressure pipe of *** percent from 2005 to 2007. *** and *** accounted for a majority of the increase incapacity. ***. Production of WSS pressure pipe fell overall by *** percent from 2005 to 2007.4 ***accounted for almost all of the decrease. ***. Capacity utilization decreased by *** percentage pointsfrom 2005 to 2007. ***.

III-2
Table III-1WSS pressure pipe: U.S. producers, positions on the petition, U.S. production locations, relatedand/or affiliated firms, and shares of 2007 reported U.S. production of WSS pressure pipe
Firm namePosition on
petitionU.S. production
location(s) Related and/or affiliated firms
Share ofproduction(percent)
Bristol Support Bristol, TN Synalloy Corp. (United States) ***
Felker SupportMarshfield, WIGlasgow, KY None. ***
Marcegaglia Support Munhall, PA Marcegaglia (Italy) ***
Outokumpu Support Wildwood, FL
Outokumpu (United States)Outokumpu (Finland)Outokumpu (Sweden) ***
Rath Gibson (1) Janesville, WI (1) (1)
Swepco (1) Clifton, NJ (1) (1)
Webco Support Mannford, OK None. ***
1 Not available. Note.–Because of rounding, shares may not total 100.0 percent.
Source: Compiled from data submitted in response to Commission questionnaires.
Table III-2WSS pressure pipe: U.S. capacity, production, and capacity utilization, 2005-07
* * * * * * *
In the Commission’s questionnaire, U.S. producers were asked if they had experienced any plantopenings, relocations, expansions, acquisitions, consolidations, closures, or prolonged shutdowns becauseof strikes or equipment failure; curtailment of production because of shortages of materials; or any otherchange in the character of their operations or organization relating to the production of WSS pressure pipesince January 1, 2005. Three firms reported such changes; their responses to this question are presentedin table III-3.
Table III-3WSS pressure pipe: U.S. producers’ comments concerning plant openings, relocations,expansions, acquisitions, consolidations, closures, or prolonged shutdowns
* * * * * * *
*** of the U.S. producers of WSS pressure pipe that responded to the Commission’squestionnaire reported the production of other products on the same equipment and machinery and usingthe same production and related workers employed in the production of WSS pressure pipe. Theirresponses are presented in table III-4.

5 ***. 6 ***. Conference transcript, pp. 10-12 (Boling). 7 Internal consumption was reported by ***. At the Commission’s conference Marcegaglia and Outokumpureported they do not internally consume any WSS pressure pipe. Felker reported that “they do utilize some of thecontinuous pipe to bend and press elbow reducers, et cetera” and that they have a fabrication division that producespipe spools. Conference transcript, p. 61 (Henke). 8 Conference transcript, p. 5 (Schagrin). Nickel increased from $7 per pound in 2004 to $24 per pound in mid-2007, while molybdenum rose from $12 per pound to $47 per pound. Conference transcript, p. 7 (Schagrin).
III-3
Table III-4WSS pressure pipe: U.S. producers’ products made on the same equipment and machinery andusing the same production and related workers, 2005-07
* * * * * * *
U.S. PRODUCERS’ SHIPMENTS
Data on domestic producers’ shipments of WSS pressure pipe are presented in table III-5. U.S.shipments accounted for *** percent of U.S. producers’ total shipments of WSS pressure pipe in 2007,and commercial shipments alone accounted for *** percent. U.S. shipments *** in 2006 then *** in2007, for an overall decrease of *** percent. *** producers had increased shipments in 2006 anddecreased shipments in 2007, with *** accounting for the vast majority of reduction in shipments in2007.5 ***.6 The domestic producers reported *** percent of total U.S. shipments as internalconsumption during 2005-07.7 The unit value of U.S. shipments increased *** percent from 2005 to2007. This reflected in large part surcharges put in place by the stainless steel industry “due to enormoussurges in the price of nickel and molybdenum.”8 All WSS pressure pipe producers reportedly passedthose surcharges on to their customers.
Exports of WSS pressure pipe were reported by ***. These exports decreased steadily andaccounted for less than *** percent of U.S. producers’ total shipments during 2005-07. The exportmarkets listed included ***.
*** firm reported involvement in a toll agreement regarding the production of WSS pressurepipe. *** firm reported production of WSS pressure pipe in a foreign trade zone.
Table III-5WSS pressure pipe: U.S. producers’ shipments, by types, 2005-07
* * * * * * *
U.S. PRODUCERS’ INVENTORIES
Data collected in these investigations on domestic producers’ end-of-period inventories of WSSpressure pipe are presented in table III-6. Domestic producers’ inventories declined over the period forwhich data were collected, but to a lesser extent than production and sales, resulting in higher inventoryholdings relative to output and shipments. U.S. producers’ inventories were equivalent to between ***and *** percent of U.S. producers’ total shipments during 2005-07. *** firms, *** and ***, togetheraccounted for *** percent of the inventories held during the period for which data were collected.

9 Conference transcript, p. 28 (Hart). 10 Conference transcript, pp. 66-67 (Henke). 11 Conference transcript, pp. 28-29 (Hart).
III-4
Table III-6WSS pressure pipe: U.S. producers’ end-of-period inventories, 2005-07
* * * * * * *
U.S. PRODUCERS’ IMPORTS AND PURCHASES
*** U.S. producer, ***, reported direct imports of WSS pressure pipe during the period for whichdata were collected. In 2007, *** imported ***. *** U.S. producers reported purchases of WSS pressurepipe. In 2006, *** reported purchases from U.S. importers of ***, citing the need to *** for certain sizes. In 2007, *** reported purchases from domestic producers of ***, citing ***.
U.S. EMPLOYMENT, WAGES, AND PRODUCTIVITY
The U.S. producers’ aggregate employment data for WSS pressure pipe are presented in table III-7. In the aggregate, U.S. WSS pressure pipe producers reported an increase in the number of productionand related workers employed in the manufacture of WSS pressure pipe from 2005 to 2006, and then adecrease in 2007. This largely reflects ***. It was reported that several of the companies, faced with adecline in demand, instead of laying off employees chose to reduce the hours worked in order to savejobs9 or to cross train employees on other equipment.10 It was reported that job losses in the WSSpressure pipe industry had temporarily leveled off at the petitioning firms due to the earlier closure ofplants at Trent Tube, Acme/Romac, and Davis.11 Consistent with trends in output, productivity rose in2006 then fell in 2007, for an overall decrease of *** percent (*** and *** accounted for a majority ofthe decrease). Falling productivity combined with a modest increase in wage rate, resulted in higher thanunit labor costs in 2007.
Table III-7WSS pressure pipe: U.S. producers’ employment-related indicators, 2005-07
* * * * * * *
1 Eight firms reported that they did not import the subject merchandise during 2005-07. 2 The Commission received two incomplete questionnaire responses from firms, Angstrom USA and RobertMitchell Co., Inc., that import from *** and ***, respectively. Ta Chen, the *** , did not respond to theCommission questionnaire. 3 Imports of WSS pressure pipe are from official statistics under the HTS statistical reporting numbers7306.40.5005, 7306.40.5040, 7306.40.5062, 7306.40.5064, and 7306.40.5085. Although certain larger diameterproduct may enter under these statistical reporting numbers, only *** reported such entries. 4 Some WSS pressure pipe may be imported under HTS statistical reporting numbers 7306.40.1010,7306.40.1015, 7306.40.5042, 7306.40.5044, 7306.40.5080, and 7306.40.5090, which are basket categories. *** wasthe only U.S. importer to report imports under these statistical reporting numbers (these imports were from ***). 5 Import data for Canada are not being used because the overwhelming majority consists of nonsubjectmechanical tubing. ***. 6 A majority of the remainder comes from Korea, Malaysia, Taiwan, and Thailand.
IV-1
PART IV: U.S. IMPORTS, APPARENT U.S. CONSUMPTION, AND MARKET SHARES
U.S. IMPORTERS
The Commission sent importer questionnaires to 34 firms believed to be importers of weldedstainless steel tubular products, as well as to all U.S. producers of welded stainless steel tubular products.1 Usable questionnaire responses were received from 10 companies that are believed to account for morethan *** percent of the quantity of U.S. imports from China and more than *** percent of U.S. importsfrom other countries during the period for which data were collected.2 The largest importer of WSSpressure pipe from China in 2007 was ***. Other major importers of WSS pressure pipe are ***. Presented in table IV-1 are the responding U.S. importers and 2007 coverage based on responses toCommission questionnaires.
U.S. IMPORTS
U.S. imports are based on official import statistics of Commerce,3 as modified to include WSSpressure pipe entering under broader HTS categories4 (based on questionnaire responses) and to excludepressure pipe greater than 14 inches in diameter (based on questionnaire responses) and mechanicaltubing from Canada.5 U.S. imports of WSS pressure pipe are presented in table IV-2. China is the largestforeign supplier of WSS pressure pipe to the United States, accounting for 51.1 percent of the quantity oftotal imports in 2007, and 49.4 percent of the value.6 From 2005 to 2007, the quantity and value ofimports of WSS pressure pipe from China increased by 111.1 percent and 225.2 percent, respectively. Atthe same time, the unit value of imports of WSS pressure pipe from China increased by 54.1 percent. Thequantity and value of imports from other countries increased by 35.9 percent and by 111.3 percent,respectively, from 2005 to 2007. In 2007, *** percent of U.S. importers’ imports of WSS pressure pipefrom China was A-312, and *** percent was A-778. In addition, *** percent of their 2007 U.S. importsfrom China was less than or equal to 4.5 inches in outside diameter, and *** percent was greater than 4.5up to 14 inches. In 2007, *** percent of U.S. importers’ imports of WSS pressure pipe from all othersources was A-312, and *** percent was A-778. In addition, *** percent of their 2007 U.S. imports fromall other sources was less than or equal to 4.5 inches in outside diameter, and *** percent was greater than4.5 up to 14 inches.
Nonsubject imports of WSS pressure pipe are presented in table IV-3. Four countries - Korea,Malaysia, Taiwan, and Thailand - consistently accounted for the large majority of imports of WSSpressure pipe from nonsubject sources during 2005-07.
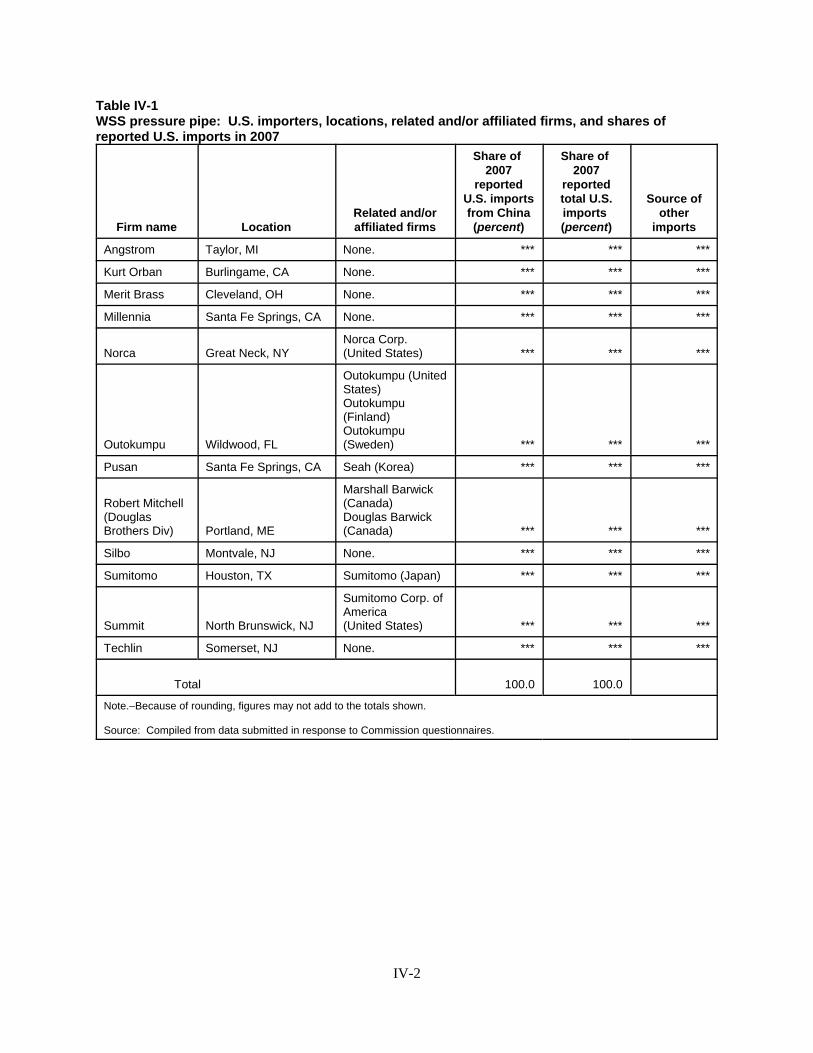
IV-2
Table IV-1WSS pressure pipe: U.S. importers, locations, related and/or affiliated firms, and shares ofreported U.S. imports in 2007
Firm name LocationRelated and/oraffiliated firms
Share of 2007
reportedU.S. importsfrom China(percent)
Share of 2007
reportedtotal U.S.imports (percent)
Source ofother
imports
Angstrom Taylor, MI None. *** *** ***
Kurt Orban Burlingame, CA None. *** *** ***
Merit Brass Cleveland, OH None. *** *** ***
Millennia Santa Fe Springs, CA None. *** *** ***
Norca Great Neck, NYNorca Corp.(United States) *** *** ***
Outokumpu Wildwood, FL
Outokumpu (UnitedStates) Outokumpu(Finland)Outokumpu(Sweden) *** *** ***
Pusan Santa Fe Springs, CA Seah (Korea) *** *** ***
Robert Mitchell(DouglasBrothers Div) Portland, ME
Marshall Barwick(Canada)Douglas Barwick(Canada) *** *** ***
Silbo Montvale, NJ None. *** *** ***
Sumitomo Houston, TX Sumitomo (Japan) *** *** ***
Summit North Brunswick, NJ
Sumitomo Corp. ofAmerica (United States) *** *** ***
Techlin Somerset, NJ None. *** *** ***
Total 100.0 100.0
Note.–Because of rounding, figures may not add to the totals shown.
Source: Compiled from data submitted in response to Commission questionnaires.

IV-3
Table IV-2WSS pressure pipe: U.S. imports, by sources, 2005-07
Source
Calendar year
2005 2006 2007
Quantity (short tons)
China 14,486 23,751 30,574
Nonsubject sources 21,567 22,860 29,314
Total 36,053 46,611 59,888
Value (1,000 dollars)1
China 47,923 79,051 155,849
Nonsubject sources 75,650 93,018 159,869
Total 123,573 172,069 315,718
Unit value (per short ton)1
China 3,308 3,328 5,097
Nonsubject sources 3,508 4,069 5,454
Average 3,428 3,692 5,272
Share of quantity (percent)
China 40.2 51.0 51.1
Nonsubject sources 59.8 49.0 48.9
Total 100.0 100.0 100.0
Share of value (percent)
China 38.8 45.9 49.4
Nonsubject sources 61.2 54.1 50.6
Total 100.0 100.0 100.01 Landed, duty-paid.
Note.–Because of rounding, figures may not add to the totals shown.
Source: Compiled from official Commerce statistics, as adjusted by questionnaire responses.
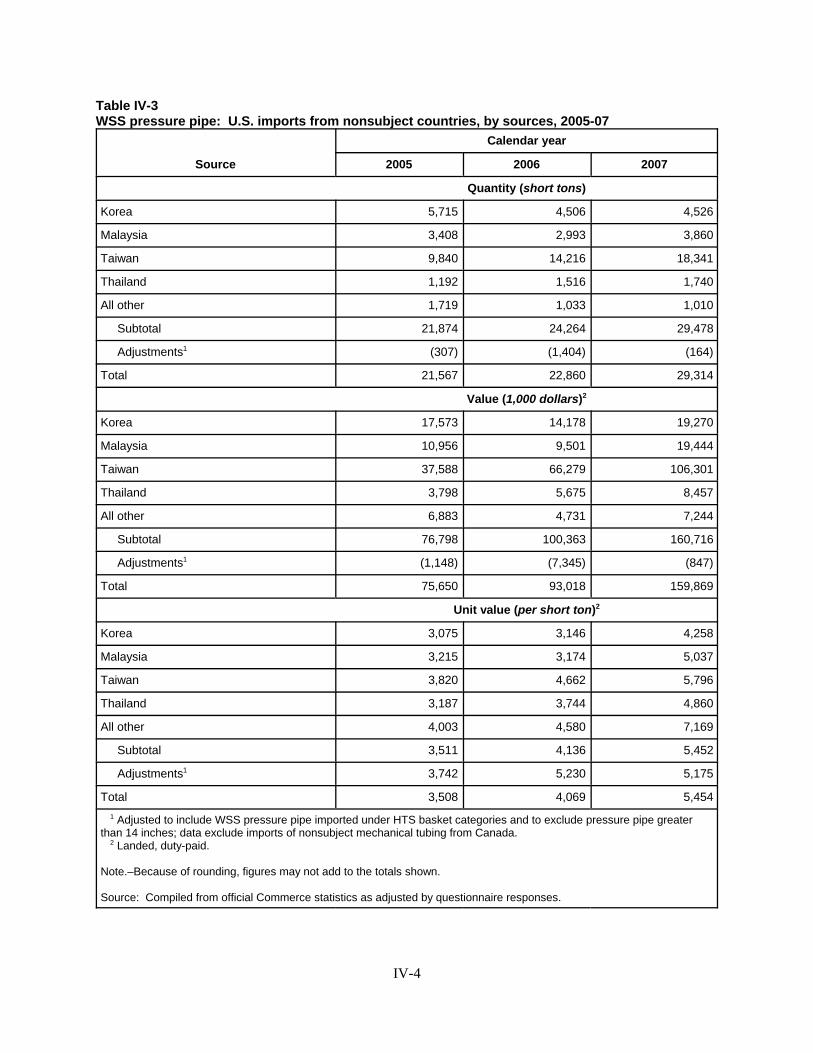
IV-4
Table IV-3WSS pressure pipe: U.S. imports from nonsubject countries, by sources, 2005-07
Source
Calendar year
2005 2006 2007
Quantity (short tons)
Korea 5,715 4,506 4,526
Malaysia 3,408 2,993 3,860
Taiwan 9,840 14,216 18,341
Thailand 1,192 1,516 1,740
All other 1,719 1,033 1,010
Subtotal 21,874 24,264 29,478
Adjustments1 (307) (1,404) (164)
Total 21,567 22,860 29,314
Value (1,000 dollars)2
Korea 17,573 14,178 19,270
Malaysia 10,956 9,501 19,444
Taiwan 37,588 66,279 106,301
Thailand 3,798 5,675 8,457
All other 6,883 4,731 7,244
Subtotal 76,798 100,363 160,716
Adjustments1 (1,148) (7,345) (847)
Total 75,650 93,018 159,869
Unit value (per short ton)2
Korea 3,075 3,146 4,258
Malaysia 3,215 3,174 5,037
Taiwan 3,820 4,662 5,796
Thailand 3,187 3,744 4,860
All other 4,003 4,580 7,169
Subtotal 3,511 4,136 5,452
Adjustments1 3,742 5,230 5,175
Total 3,508 4,069 5,454 1 Adjusted to include WSS pressure pipe imported under HTS basket categories and to exclude pressure pipe greaterthan 14 inches; data exclude imports of nonsubject mechanical tubing from Canada. 2 Landed, duty-paid.
Note.–Because of rounding, figures may not add to the totals shown.
Source: Compiled from official Commerce statistics as adjusted by questionnaire responses.

7 Conference transcript, p. 36 (Schagrin). 8 Conference transcript, pp. 36, 63 (Schagrin), p. 106 (Jakob).
IV-5
APPARENT U.S. CONSUMPTION
Data on apparent U.S. consumption of WSS pressure pipe presented in table IV-4 are based onU.S. producers’ U.S. shipments of WSS pressure pipe provided in response to Commission questionnairesand U.S. imports from official statistics as adjusted to include WSS pressure pipe imported under HTSbasket categories and to exclude pressure pipe greater than 14 inches and imports of nonsubjectmechanical tubing from Canada. Apparent U.S. consumption increased steadily by *** percent from2005 to 2007. A substantial portion of the increase in demand was a result of the expansion of ethanolfacilities in the United States.7 However, the ethanol expansion has reportedly begun to slow.8
Table IV-4WSS pressure pipe: U.S. shipments of domestic product, U.S. imports, by sources, and apparentU.S. consumption, 2005-07
Item
Calendar year
2005 2006 2007
Quantity (short tons)
U.S. producers’ U.S. shipments1 *** *** ***
U.S. imports from--
China2 14,486 23,751 30,574
Nonsubject2 21,567 22,860 29,314
Total imports 36,053 46,611 59,888
Apparent U.S. consumption *** *** ***
Value (1,000 dollars)
U.S. producers’ U.S. shipments1 *** *** ***
U.S. imports from--
China2 47,923 79,051 155,849
Nonsubject2 75,650 93,018 159,869
Total imports 123,573 172,069 315,718
Apparent U.S. consumption *** *** ***1 F.o.b. U.S. mill.2 Landed, duty-paid.
Source: Compiled from data submitted in response to Commission questionnaires and from official Commercestatistics, as adjusted by questionnaire responses.

IV-6
U.S. MARKET SHARES
U.S. market share data are presented in table IV-5. The quantity of the U.S. producers’ marketshare decreased *** percentage points from 2005 to 2007. In contrast, the share of subject imports fromChina increased from *** percent in 2005 to *** percent in 2007, on the basis of quantity. Nonsubjectimports’ market share decreased from 2005 to 2006, then increased in 2007, for an overall increase.
Table IV-5WSS pressure pipe: Apparent U.S. consumption and market shares, 2005-07
* * * * * * *
RATIO OF IMPORTS TO U.S. PRODUCTION
Information concerning the ratio of subject imports to U.S. production of WSS pressure pipe ispresented in table IV-6. Imports from China were equivalent to *** percent of U.S. production during2005, increased to *** percent during 2006, and further to *** percent in 2007.
Table IV-6WSS pressure pipe: Ratio of U.S. imports to U.S. production, by sources, 2005-07
* * * * * * *

1 Conference transcript, p. 15 (Cornelius). 2 Welded A-312 pipes are normally manufactured from hot-rolled stainless steel sheet. 3 Petitioners’ postconference brief. Also see Certain Welded Stainless Steel Pipe From Korea and Taiwan, Inv.Nos. 731-TA-540 and 541 (Second Review), USITC Publication 3877, August 2006, pp. V-1 to V-2. 4 Conference transcript, p. 7 (Schagrin). 5 These estimates are based on HTS statistical reporting numbers 7306.40.5005, 7306.40.5040, 7306.40.5062,7306.40.60.64, and 7306.40.50.85.
V-1
PART V: PRICING AND RELATED INFORMATION
FACTORS AFFECTING PRICES
Raw Material Costs
Flat- rolled stainless steel and alloying agents are the primary raw materials used to produce WSSpressure pipe. Raw material costs have risen substantially since 2005 and accounted for as much as 70 to80 percent of the cost of production of WSS pressure pipe in 2007.1 As shown in figure V-1, the monthlyprices of AISI 304 stainless steel increased by 65.9 percent during 2005-07.2 This trend reflects the risingcosts of scrap iron and alloying agents such as chromium, molybdenum, manganese, and nickel. Thelatter element is especially important for the nickel-rich stainless steel grades 304 and 316 used tomanufacture WSS pressure pipe. As shown in figure V-2, monthly nickel prices rose from $0.41 perpound of steel in January 2005 to a peak of $2.60 per pound of steel in July 2007. The price of nickel perpound of steel subsequently declined irregularly to $1.45 per pound of steel by December 2007.
As a result of rising costs, many stainless steel sheet producers have instituted raw material,energy, and fuel surcharges.3 These surcharges are then passed along by producers of WSS pressure pipe. According to conference testimony, monthly surcharges have increased since 2003 and grade 304 prices,in particular, increased by 223 percent from 2004 to 2007. These surcharges reportedly can account foras much as 50 percent of the final price of WSS pressure pipe.4
Energy inputs used in the production of WSS pressure pipe include natural gas and electricity. As shown in table V-1, the cost of both natural gas and electricity have increased since 2002.
Transportation Costs to the U.S. Market
Transportation costs for WSS pressure pipe from China to the United States (excluding U.S.inland costs) in 2007 are estimated to be equivalent to approximately 1.0 percent of the customs valuefrom product from China. These estimates are derived from official import data and represent thetransportation and other charges on imports valued on a c.i.f. basis, as compared with customs value.5

V-2
Figure V-1Cold-rolled and hot-rolled stainless steel sheet: Monthly prices of grade AISI 304, 2005-07
Source: Purchasing Magazine’s Steel Price Transaction Report.
Figure V-2Nickel prices, by month, 2005-07
Source: Petitioners’ postconference brief, Exhibit 8.

6 Producer price data in China were not available to calculate real exchange rates of the yuan vis-a-vis the U.S.dollar during 2005-07. The Chinese government effectively pegged the yuan to the U.S. dollar at 8.28 per dollarduring the early part of this period. On July 21, 2005, the Chinese government announced that it would no longerpeg the yuan to the U.S. dollar but would tie the yuan to a basket of currencies. Within the new basket, the yuan wasrevalued upward against the U.S. dollar by 2.1 percent, or from 8.28 yuan per dollar under the old peg to 8.11 yuanper dollar under the new exchange rate policy. The Chinese government has not disclosed which currencies are inthe new basket, but indicated that the weight of the U.S. dollar represented less than 50 percent of the new basket ofcurrencies.
V-3
Table V-1U.S. natural gas and electricity prices for industrial customers, 2002-07
Item 2002 2003 2004 2005 2006 Jan.-Nov. 2007
U.S. natural gas1
industrial prices $4.02 $5.89 $6.53 $8.56 $7.86 $7.37
Electricity2
industrial prices 4.88¢ 5.11¢ 5.25¢ 5.73¢ 6.16¢ 6.38
1 In dollars per thousand cubic feet.2 In cents per kilowatt-hour.
Sources: U.S. Energy Information Administration, http://www.eia.doe.gov.
U.S. Inland Transportation Costs
The five responding U.S. producers reported that U.S. inland transportation costs for WSSpressure pipe generally ranged between 1.0 and 2.5 percent of U.S.-produced WSS pressure pipe. Forimports from China these costs accounted for between less than 1.0 percent and 5.0 percent for imports ofWSS pressure pipe, with four of five responding importers reporting the U.S. inland transportation costsof less than 5.0 percent. The five responding U.S. producers and five of eight importers reported that theynormally arrange for inland transportation. The remaining two importers reported that the purchaserarranges for U.S. inland transportation. On average, U.S. producers sold 6.3 percent of their WSSpressure pipe within 101 miles of their storage or production facilities, 78.2 percent between 101 and1,000 miles, and 15.5 percent beyond 1,000 miles. Seven of the ten responding importers also reportednationwide sales; another reported sales to the Northwest, Southeast, Mid-Atlantic, Mid-West, and GreatLakes; another reported sales in the Mid-Atlantic; and the remaining importer reported sales in theSoutheast, Mid-West, and the West Coast. On average, U.S. importers of Chinese WSS pressure pipesold 39.5 percent of their WSS pressure pipe within 100 miles of their entry or storage facilities, 22.9percent between 101 and 1,000 miles, and 37.5 percent over 1,000 miles.
Exchange Rates
Quarterly data reported by the Federal Reserve Bank of St. Louis indicate that the nominalexchange rate for the Chinese yuan appreciated against the U.S. dollar during 2007 compared to 2006,averaging 7.58 yuan per dollar. Figure V-3 shows that quarterly nominal exchange rate index of theChinese yuan relative to the U.S. dollar during 2005-07.6

7 Data for nonsubject countries are presented in appendix D.
V-4
Figure V-3Nominal exchange rate indices of the Chinese yuan relative to the U.S. dollar, by quarters, 2005-2007
Note. - - Index (Jan.-Mar. 2005=100). Exchange rates are in U.S. dollars per Chinese yuan.
Source: Federal Reserve Bank of St. Louis, retrieved from http://research.stlouis.org, last accessed March 5, 2008.
PRICING PRACTICES
Pricing Methods
Five U.S. producers and seven U.S. importers of WSS pressure pipe from China and from othercountries reported their 2007 shipments by type of sale.7 U.S. producers’ and importers’ shares of their2007 U.S. commercial shipments of the domestically produced and imported Chinese WSS pressure pipe,on average, are shown in the following tabulation.
Type of sale
Share of 2007 U.S. commercial shipments (percent)
U.S.- producedproducts
Imported Chineseproducts
Spot sale 78.5 84.5
Short-term sales 21.5 15.5
Long-term sales 0 0
Total 100.0 100.0
Source: Compiled from data submitted in response to Commission questionnaires.

8 Conference transcript, p. 7 (Schagrin).
V-5
U.S. producers and importers reported that spot sales, short-term sales, and long-term contractsales were most often negotiated on an individual transaction basis, although U.S. producers also reportedusing price lists. U.S. producers and importers reported the typical provisions of their short-term salesagreements with their customers for WSS pressure pipe. U.S. producers reported that their short-termcontracts ranged from 60 days to 12 months and importers reported that their short-term contracts rangedfrom 3 to 6 months. Four of the five responding U.S. producers reported that prices could be renegotiatedduring the contract period while the fifth reported that they could not. Responding importers reportedthat prices could not be renegotiated during the contract period. The majority of U.S. producers reportedthat short-term contracts generally fix both price and quantity. Responding U.S. producers reported thatshort-term contracts did not have meet or release provisions. One of two responding importers reportedthat short-term contracts did have meet or release provisions, whereas the other reported that they did not.
Responding U.S. producers reported making at least 40 percent of their sales from inventory.Two of five U.S. producers reported that 65 percent of their sales were from inventory, two othersreported that 80 percent of its sales were from inventory, and the remaining U.S. producer reported that 40 percent of its sales were from inventory. The responding U.S. producers also reported giving quantitydiscounts for their sales of WSS pressure pipe. Four of the five responding U.S. producers reportedgiving quantity discounts based on either annual or quarterly volumes while the fifth offered quantitydiscounts based on early payment. Six of ten responding importers reported making 100 percent of theirsales on a produced-to-order basis, the remaining four importers reported that 100 percent of their saleswere from inventory. Reported lead times on produced-to-order sales ranged from 90 to 120 days,whereas lead times on sales from inventory ranged from one to seven days.
Prices are determined differently by different suppliers. Eight of ten responding importersreported determining price through transaction-by-transaction negotiations and the remaining importersreported determining price through contracts. Seven of ten responding importers reported that they didnot give discounts; whereas the remaining importers reported giving quantity discounts. Seven of tenresponding importers reported typical sales terms net 30 days, one reported 45 days, one reported salesterms of 60 days, and another reported various sales terms.
Since 2005, raw material surcharges have accounted for a substantial portion of the final price ofWSS pressure pipe for domestic suppliers. Over the past 12 months, energy and fuel (delivery)surcharges have also been added to the price of steel sheet and passed on to the price of WSS pressurepipe. In 2007, prices in the WSS pressure pipe industry are reportedly continuing to rise in order to keeppace with rising input costs.8
PRICE DATA
The Commission requested U.S. producers and importers of WSS pressure pipe to providequarterly data for the total quantity and f.o.b. (U.S. point of shipment) value of specified A-312 pipes thatwere shipped to unrelated customers in the U.S. market in 2005-07. The products for which pricing datawere requested are as follows:

9 Grade AISI 316 stainless steel has corrosion resistance superior to that of grade AISI 304 (which is more widelyused in the production of welded A-312 pipes). Grade AISI 316 also has higher strength at elevated temperaturesthan does AISI 304. These properties are due principally to the higher nickel content of AISI 316 as well as theaddition of molybdenum to the steel. Iron & Steel Society, Steel Products Manual: Stainless Steels, 1999, pp. 86,114. 10 As noted previously, however, imports of welded stainless pressure pipe from two Taiwan producers (ChangTieh Industry and Ta Chen) are not subject to antidumping duty orders.
V-6
Product 1.--ASTM A-312, welded, grade AISI 304/304L pipe, 1-inch schedule 40;Product 2.--ASTM A-312, welded, grade AISI 304/304L pipe, 2-inch schedule 40;Product 3.--ASTM A-312, welded, grade AISI 304/304L pipe, 0.5-inch schedule 10;Product 4.--ASTM A-312, welded, grade AISI 304/304L pipe, 6-inch schedule 10; andProduct 5.--ASTM A-312, welded, grade AISI 316/316L pipe, 2-inch schedule 40.9
The price data were based on quarterly net U.S. f.o.b. selling price data of U.S. producers andimporters for their shipments of the specified domestic and imported Chinese WSS pressure pipe, during2005-07, for sales to unrelated U.S. distributors. In addition, each U.S. importer was requested to providethe selling price data for the specified product categories that they imported from their largest nonsubjectcountry source.
Five U.S. producers and six importers of welded A-312 pipe from China, provided usable pricingdata for sales of the requested products. In addition, seven U.S. importers of WSS pressure pipe alsoreported the requested price data for three nonsubject countries, two of which (Taiwan and Korea) haveU.S. antidumping duty orders in place.10
Price Trends
Tables V-2 through V-6 and figures V-4 through V-8 present f.o.b. (U.S. point of shipment)selling prices to unrelated customers for the five products defined above which were produced and sold inthe United States as well as for products produced in China and sold in the United States. Pricing datareported by responding firms accounted for *** of U.S. producers’ shipments of U.S.- produced WSSpressure pipe and *** of reported U.S. shipments of subject imports from China from January 2005through December 2007 (based on questionnaire responses). In addition, price comparisons betweendomestic A-312 pipe and that imported from nonsubject countries are shown in appendix D.

V-7
Table V-2WSS pressure pipe: Weighted-average f.o.b. prices and quantities of domestic and importedproduct 11 and margins of underselling/(overselling), by quarters, January 2005 - December 2007
Period
United States China
Price (per 1,000 feet)
Quantity(1,000 feet)
Price(per 1,000 feet)
Quantity(1,000 feet)
Margin(percent)
2005:Jan.-Mar. $2,949.80 166.0 $2,470.95 114.5 16.2
Apr.-June 2,999.34 88.9 2,670.07 139.2 11.0
July-Sept. 2,961.33 123.2 2,420.56 165.3 18.3
Oct.-Dec. 2,705.27 87.9 2,005.36 135.4 25.9
2006:Jan.-Mar. 2,660.57 121.8 2,058.78 169.0 22.6
Apr.-Mar. 3,088.39 128.3 2,157.20 200.4 30.2
July-Sept. 3,627.96 129.2 2,582.72 260.1 28.8
Oct.-Dec. 4,245.73 68.9 3,238.84 257.0 23.7
2007:Jan.-Mar. 4,837.92 68.2 4,478.35 274.1 7.4
Apr.-June 5,372.19 71.1 3,948.24 257.6 26.5
July-Sept. 4,485.83 83.0 5,256.59 224.3 (17.2)
Oct.-Dec. 4,095.01 46.1 4,175.92 154.9 (2.0)1 ASTM A-312, welded, grade AISI 304/304L pipe, 1-inch schedule 40.
Source: Compiled from data submitted in response to Commission questionnaires.

V-8
Table V-3WSS pressure pipe: Weighted-average f.o.b. prices and quantities of domestic and importedproduct 21 and margins of underselling/(overselling), by quarters, January 2005 - December 2007
Period
United States China
Price (per 1,000 feet)
Quantity(1,000 feet)
Price(per 1,000 feet)
Quantity(1,000 feet)
Margin(percent)
2005:Jan.-Mar. $5,925.52 148.5 $5,294.78 88.2 10.6
Apr.-June 6,190.69 72.4 5,605.01 92.8 9.5
July-Sept. 5,809.50 78.8 5,219.46 112.6 10.2
Oct.-Dec. 5,470.45 56.6 4,263.81 98.5 22.1
2006:Jan.-Mar. 5,385.88 138.6 4,659.92 154.1 13.5
Apr.-Mar. 5,857.54 102.3 4,703.80 162.8 19.7
July-Sept. 7,855.54 111.4 6,038.67 189.2 23.1
Oct.-Dec. 9,422.27 80.5 6,856.51 178.4 27.2
2007:Jan.-Mar. 8,641.32 102.4 7,321.25 232.9 15.3
Apr.-June 8,625.55 69.5 7,881.03 206.1 8.6
July-Sept. 7,853.28 55.5 9,114.48 173.9 (16.1)
Oct.-Dec. *** *** *** *** ***1 ASTM A-312, welded, grade AISI 304/304L pipe, 2-inch schedule 40.
Source: Compiled from data submitted in response to Commission questionnaires.

V-9
Table V-4WSS pressure pipe: Weighted-average f.o.b. prices and quantities of domestic and importedproduct 31 and margins of underselling/(overselling), by quarters, January 2005 - December 2007
Period
United States China
Price (per 1,000 feet)
Quantity(1,000 feet)
Price(per 1,000 feet)
Quantity(1,000 feet)
Margin(percent)
2005:Jan.-Mar. $*** *** $908.13 6.4 ***
Apr.-June 1,524.26 6.1 1,365.12 4.1 10.4
July-Sept. *** *** 1,017.59 5.6 ***
Oct.-Dec. 1,255.36 15.5 1,030.24 6.3 17.9
2006:Jan.-Mar. 1,396.07 8.9 917.41 12.7 34.3
Apr.-Mar. 1,395.25 15.8 1,142.30 8.3 18.1
July-Sept. 1,970.60 10.1 1,066.87 9.7 45.9
Oct.-Dec. *** *** 1,471.41 12.9 ***
2007:Jan.-Mar. 2,130.63 9.6 1,572.48 27.9 26.2
Apr.-June 2,271.65 9.1 1,520.87 15.4 33.1
July-Sept. 1,898.83 26.5 1,698.16 17.1 10.6
Oct.-Dec. 1,532.79 21.5 1,889.58 9.0 (23.3)1 ASTM A-312, welded, grade AISI 304/304L pipe, 0.5-inch schedule 10.
Source: Compiled from data submitted in response to Commission questionnaires.

V-10
Table V-5WSS pressure pipe: Weighted-average f.o.b. prices and quantities of domestic and importedproduct 41 and margins of underselling/(overselling), by quarters, January 2005 - December 2007
Period
United States China
Price (per 1,000 feet)
Quantity(1,000 feet)
Price(per 1,000 feet)
Quantity(1,000 feet)
Margin(percent)
2005:Jan.-Mar. $15,198.19 61.2 $13,130.36 22.2 13.6
Apr.-June 15,496.26 49.2 *** *** ***
July-Sept. 15,292.44 59.1 13,400.90 29.4 12.4
Oct.-Dec. 13,696.95 75.2 11,521.47 19.9 15.9
2006:Jan.-Mar. 13,788.60 77.2 12,180.82 39.4 11.7
Apr.-Mar. 15,728.95 67.6 13,035.11 59.6 17.1
July-Sept. 19,284.15 100.0 14,721.03 50.5 23.7
Oct.-Dec. 22,668.69 143.0 17,400.97 80.6 23.2
2007:Jan.-Mar. 25,164.84 55.0 20,156.15 152.6 19.9
Apr.-June 25,487.08 51.0 21,105.02 114.7 17.2
July-Sept. 21,830.97 41.3 22,217.71 88.7 (1.8)
Oct.-Dec. 22,609.09 26.4 *** *** ***1 ASTM A-312, welded, grade AISI 304/304L pipe, 6-inch schedule 10.
Source: Compiled from data submitted in response to Commission questionnaires.

V-11
Table V-6WSS pressure pipe: Weighted-average f.o.b. prices and quantities of domestic and importedproduct 51 and margins of underselling/(overselling), by quarters, January 2005 - December 2007
Period
United States China
Price (per 1,000 feet)
Quantity(1,000 feet)
Price(per 1,000 feet)
Quantity(1,000 feet)
Margin(percent)
2005:Jan.-Mar. $9,736.70 49.7 $10,751.46 24.0 (10.4)
Apr.-June 10,309.42 61.8 8,774.53 47.2 14.9
July-Sept. 10,267.98 47.8 8,926.89 51.1 13.1
Oct.-Dec. 9,616.68 56.5 8,389.16 30.8 12.8
2006:Jan.-Mar. 9,174.41 55.2 7,564.61 38.6 17.6
Apr.-Mar. 9,648.69 56.5 7,869.98 55.0 18.4
July-Sept. 12,125.37 65.4 9,149.32 64.7 24.5
Oct.-Dec. 13,644.29 54.1 10,895.55 69.0 20.3
2007:Jan.-Mar. 13,096.37 35.3 12,419.58 50.0 5.2
Apr.-June 12,362.79 41.0 12,731.99 56.9 (3.0)
July-Sept. 13,447.11 33.1 14,556.16 26.3 (8.2)
Oct.-Dec. 12,570.00 22.6 *** *** ***1 ASTM A-312, welded, grade AISI 316/316L pipe, 2-inch schedule 40.
Source: Compiled from data submitted in response to Commission questionnaires.
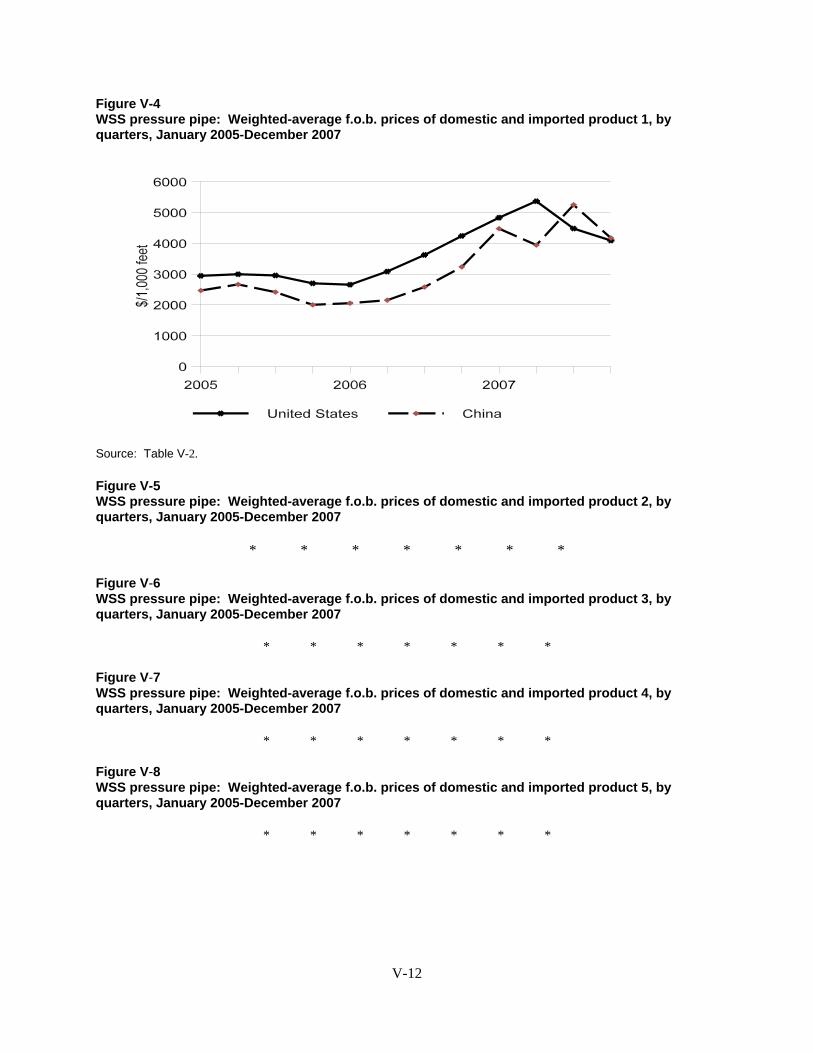
V-12
Figure V-4WSS pressure pipe: Weighted-average f.o.b. prices of domestic and imported product 1, byquarters, January 2005-December 2007
Source: Table V-2.
Figure V-5WSS pressure pipe: Weighted-average f.o.b. prices of domestic and imported product 2, byquarters, January 2005-December 2007
* * * * * * *
Figure V-6WSS pressure pipe: Weighted-average f.o.b. prices of domestic and imported product 3, byquarters, January 2005-December 2007
* * * * * * *
Figure V-7WSS pressure pipe: Weighted-average f.o.b. prices of domestic and imported product 4, byquarters, January 2005-December 2007
* * * * * * *
Figure V-8WSS pressure pipe: Weighted-average f.o.b. prices of domestic and imported product 5, byquarters, January 2005-December 2007
* * * * * * *

V-13
U.S. producers’ weighted-average prices for product 1 increased by 82.1 percent from January-March 2005 through April-June 2007 then declined through the remainder of the year. Overall, prices forproduct 2 increased irregularly by 59.0 percent from January-March 2005 to October-December 2006then declined through the remainder of the period. Weighted-average prices for domestic product 3increased by *** percent from January 2005 to April-June 2007 before declining through the remainderof the period. Weighted-average prices for domestic product 4 increased by 67.7 percent from January2005 through April-June 2007 before declining through the remainder of the period. Average prices fordomestic product 5 increased by 38.1 percent from January 2005 through October-December 2006 beforedeclining through the remainder of the period.
Prices of U.S. shipments of product 1 imported from China increased by 112.7 percent fromJanuary 2005 through July-September 2007 before declining through the rest of the period. Prices ofChinese product 2 increased irregularly by 72.1 percent from January 2005 through July-September 2007before declining in the final quarter. Prices of Chinese product 3 increased by *** percent from 2005 to2007. Likewise, prices of Chinese product 4 increased by *** percent from 2005 to 2007. Prices of U.S.shipments of Chinese product 5 increased by 35.4 percent from January 2005 to July-September 2007before declining in the final quarter.
Price Comparisons
Imported welded A-312 pipe from China undersold the domestic product in 49 of 60 quarters. Adetailed summary of margins of overselling and underselling is presented in table V-7.
Table V-7WSS pressure pipe: Number of quarters of underselling and overselling and highest and lowestmargin of underselling and overselling, by product
Product
Number ofquarters of
underselling
Number ofquarters ofoverselling
Lowestmargin of
underselling
Highestmargin of
underselling
Lowestmargin of
overselling
Highestmargin of
overselling
China
Product 1 10 2 7.4 30.2 2.0 17.2
Product 2 10 2 8.6 27.2 *** 16.1
Product 3 11 1 10.4 45.9 23.3 23.3
Product 4 10 2 *** 23.7 1.8 ***
Product 5 8 4 5.2 24.5 3.0 10.4
Source: Compiled from data submitted in response to Commission questionnaires.
LOST SALES AND LOST REVENUES
The Commission requested U.S. producers of WSS pressure pipe to report any instances of lostsales and /or lost revenues they experienced due to competition from imports of WSS pressure pipe fromChina during January 2005 through December 2007. One petitioner, *** provided a list of 42 alleged lostsales or lost revenues to Chinese competitors in 2007 and 2008. *** reported *** lost sales allegationstotaling $*** and involving *** feet of WSS pressure pipe and *** lost revenues allegations totaling$*** and involving *** feet of WSS pressure pipe. Staff contacted the listed purchasers, and a summaryof the information obtained is presented in tables V-8 and V-9 and is discussed below in detail.

V-14
Table V-8WSS pressure pipe: U.S. producers’ lost sales allegations
* * * * * * *
Table V-9WSS pressure pipe: U.S. producers’ lost revenue allegations
* * * * * * *
*** named *** in *** lost revenue allegations concerning imports of WSS pressure pipe fromChina. *** agreed with the allegations. *** named *** in *** lost sales allegations and *** lost revenueallegations. *** agreed with the lost sales allegations stating that “***.” *** agreed with *** lostrevenue allegations noting that “***.” ***, indicated that during the period examined his companyswitched from welded stainless pressure pipe produced in the United States to pipe produced in ***.

1 Petitioners’ postconference brief, p. 3. 2 Surcharges are a widely-accepted method of transparently and quickly accommodating changes in specificcosts. Absent surcharges, which are in addition to some base price, buyers and sellers would have to continuallyrenegotiate or otherwise reset the base price. From an accounting point of view, however, there is no distinctionbetween revenues earned through either surcharges or base prices, and there is no distinction between costs incurredthrough either surcharges or base prices. Thus, if a company sells one ton of WSS pressure pipe and charges a baseprice of $4,000 per ton and a surcharge amount of $2,000 per ton, the revenue it reports in its financial statements is$6,000. Similarly, if that same company buys one ton of hot-rolled stainless steel and pays a base price of $4,000
(continued...)VI-1
PART VI: FINANCIAL EXPERIENCE OF U.S. PRODUCERS
BACKGROUND
Bristol, Felker, Marcegaglia, Outukumpu, and Webco, which together accounted for nearly ***percent of the U.S. production of WSS pressure pipe during the 2005-07 time period, supplied financialdata on their WSS pressure pipe operations. Bristol, Marcegaglia, and Outukumpu are subsidiaries oflarger entities, while Felker and Webco are independent producers. All five domestic producers producedother products (most notably other stainless and alloy pipes and tubes) at the establishments where WSSpressure pipe was produced. *** reported internal consumption of WSS pressure pipe, and these salesaccounted for *** to *** percent of the industry’s annual sales quantities and values. No firms reportedany transfers to related parties. The unit sales values of *** product were very similar to the unit salesvalue of its commercial sales. Webco’s fiscal year ends July 31, while the fiscal year for the otherproducers ends December 31.
OPERATIONS ON WSS PRESSURE PIPE
Aggregate income-and-loss data for the U.S. producers are presented in table VI-1. Tosummarize, the overall financial condition of the domestic WSS pressure pipe industry improved –though not substantially – from 2005 to 2007, even as sales quantities declined and costs increasedsharply. Most of the improvement occurred from 2005 to 2006, as sales quantity, sales value, andprofitability all improved, and the moderate operating loss turned to become a moderate operating profit. Increases in unit sales prices ($ *** per short ton) more than *** increases in unit operating costs (cost ofgoods sold and selling, general, and administrative costs combined) ($ *** per short ton, primarilyresulting from higher raw material costs). From 2006 to 2007, increases in unit sales prices ($ *** pershort ton) continued to exceed increases in unit operating costs ($ ***, again mostly raw materials),though by a much smaller margin, and profitability was essentially stable. Three producers reportedoperating losses in 2005, compared to none in 2007.
Table VI-1WSS pressure pipe: Results of U.S. producers’ operations, fiscal years 2005-07
* * * * * * *
The domestic industry has argued that the apparent improvement in its financial condition is theresult of inventory gains caused by massive increases in the prices for nickel and molybdenum, and thatthis presents a unique condition of competition that the Commission should factor into its analysis in thisinvestigation.1 That is, U.S. producers of flat-rolled stainless steel (the input used to produce WSSpressure pipe) have instituted monthly surcharges to account for large price swings in the major costcomponents of stainless steel (nickel, chromium, molybdenum, vanadium, manganese, iron, titanium, andenergy).2 While there were marked fluctuations from month to month, these surcharges generally

2 (...continued)per ton and a surcharge amount of $2,000 per ton, the cost it reports in its financial statements is $6,000. 3 Conference transcript, pp. 75-76 (Henke), pp. 76-77 (Cornelius), and pp. 77-79 (Schagrin). 4 The surcharges were provided by ***; see edis document number 294176. See alsoHTTP://WWW.AKSTEEL.COM/MARKETS_PRODUCTS/STAINLESS_SURCHARGES.ASP andHTTP://WWW.ALLEGHENYLUDLUM.COM/LUDLUM/PAGES/SURCHARGECALCULATOR/SURCHARGEFRONT.ASP?TYPE=STAINLESS%20STEEL. Although domestic WSS pressure pipe producers probably alsosourced some of their hot-rolled stainless steel from North American Stainless, there is no publicly availablesurcharge information available for that company for periods prior to April 2007. 5 This three month period is an estimate of the effect of the two- to four-month lag between the time the flat-rolledstainless steel is ordered and the time it is received and converted into pipe, plus any amount in inventory. 6 The estimate in table VI-2 only takes surcharges into account; it does not take other items (essentially the baseprice), estimated to approximate $ *** per short ton per period, into account. Thus, changes in profitability in tableVI-2 are not exactly comparable to changes in profitability in table VI-1.
VI-2
increased, often by large amounts, from 2005 to 2007. Since there is an approximate two- to four-monthtime lag between the time the flat-rolled steel is ordered and the time the finished pipe is shipped, the costof pipe shipped at any point in time is based upon surcharge amounts in effect several months previous. Lastly, since pipe producers bill their customers the surcharge amount in effect when the finished pipe isshipped, if surcharges are increasing (as they generally did from 2005 through 2007), an importantcomponent of reported profits is the difference between higher surcharges in effect when the finished pipeis shipped and lower surcharges imbedded in the cost of the pipe. If surcharges decline, then the reversewill be true, and pipe producers will be charging lower prices for finished pipe that has higher costs.3
In an effort to quantify the monthly effect of the surcharges, the Commission staff has prepared(in table VI-2) an estimate of the revenue, cost, and resulting profit or (loss) reflecting the monthlystainless steel surcharges reported by Allegheny Ludlum and AK Steel, two major suppliers of flat-rolledstainless steel.4 The revenue data are the simple average of the grade 304 and grade 316 surcharges ineffect by the two producers for the given month, while the cost data are the simple average of the grade304 and grade 316 surcharges in effect by the two producers for the periods three, four, and five monthsprevious.5 Using July 2007 as an example, the revenue data ($5,754 per short ton) is the simple averageof the grade 304 and grade 316 surcharges reported by Allegheny Ludlum and AK Steel for the month ofJuly 2007, while the cost data ($4,007 per short ton) is the simple average of the grade 304 and grade 316surcharges reported by Allegheny Ludlum and AK Steel for the months of February, March, and April2007.6 The data both demonstrates the extent of the surcharges (a low of $1,650 per short ton in March2006 to a high of $5,754 per short ton in July 2007) and the fact that domestic producers benefitted fromincreasing surcharges and suffered when surcharges were declining (late 2005/early 2006 and again inlate 2007).
The annual data at the bottom of the table agree with the financial data reported in table VI-1 –the cost increase from 2005 to 2006 was moderate when compared to the cost increase from 2006 to2007, while the increase in profitability was much larger from 2005 to 2006 than from 2006 to 2007. Thus, the data are consistent with the argument that the profitability reported by the domestic WSSpressure pipe producers in 2006 and 2007 reflects their ability to pass along generally increasing costsurcharges.

VI-3
Table VI-2WSS pressure pipe: Estimated unit revenues, costs, and resulting profits or losses as a result ofstainless steel surcharges, calendar years 2005-07
Date Revenue Cost Gross profit Gross profitUnit value (per short ton) (percent)
January 2005 $1,771 $1,520 $251 14.2February 2005 1,881 1,555 326 17.3March 2005 1,947 1,599 349 17.9April 2005 1,897 1,671 226 11.9May 2005 2,104 1,791 313 14.9June 2005 2,098 1,866 232 11.1July 2005 2,237 1,908 328 14.7August 2005 2,105 1,983 122 5.8September 2005 1,793 2,033 (240) (13.4)October 2005 1,820 2,146 (327) (18.0)November 2005 1,922 2,147 (224) (11.7)December 2005 1,703 2,045 (342) (20.1)January 2006 1,672 1,906 (234) (14.0)February 2006 1,658 1,845 (187) (11.3)March 2006 1,650 1,815 (165) (10.0)April 2006 1,725 1,766 (41) (2.4)May 2006 1,712 1,678 35 2.0June 2006 2,035 1,660 375 18.4July 2006 2,420 1,678 743 30.7August 2006 2,390 1,696 694 29.0September 2006 2,943 1,824 1,119 38.0October 2006 3,365 2,056 1,309 38.9November 2006 3,312 2,282 1,030 31.1December 2006 3,505 2,584 921 26.3January 2007 3,454 2,899 554 16.1February 2007 3,690 3,206 483 13.1March 2007 3,922 3,394 528 13.5April 2007 4,411 3,423 987 22.4May 2007 5,065 3,549 1,515 29.9June 2007 5,500 3,688 1,812 32.9July 2007 5,754 4,007 1,747 30.4August 2007 4,877 4,466 411 8.4September 2007 4,039 4,992 (953) (23.6)October 2007 3,451 5,440 (1,989) (57.6)November 2007 3,661 5,377 (1,716) (46.9)December 2007 3,878 4,890 (1,013) (26.1)Annual 2005 1,940 1,855 84 4.4Annual 2006 2,366 1,899 467 19.7Annual 2007 4,308 4,111 197 4.6
Source: Edis document number 294181; AK Steel and Allegheny Ludlum are the source of the underlying surcharge data.
7 February 25, 2008 e-mail from ***. 8 February 26, 2008 e-mail from ***.
VI-4
Selected company-by-company data are presented in table VI-3. Virtually every companyreported the same experience – from 2005 to 2007 sales quantities decreased, sales values, unit salesvalues, and unit costs all increased, and, except for ***, profitability increased. All producers reportedlarge increases in raw materials costs ($ *** per short ton), a reflection of the increase in raw materialsurcharges detailed in table VI-2. With the exception of *** (whose direct labor costs and other factorycosts combined were higher than any other producer), direct labor costs for all producers were within arelatively narrow band, and overall increases were moderate. Other factory costs were not as contained,largely because of cost increases reported by *** (increased health insurance and energy costs)7 and ***(increased profit sharing, pension, and outside processing costs).8 In the aggregate, the industry’s otherfactory costs increased by approximately $ *** (*** percent) from 2005 to 2007 while the sales quantitiesdecreased by *** percent). The unit operating income for every producer was higher in 2007 than in2005, meaning that every producer was able to raise their unit revenues by an amount in excess ofincreased unit costs.
Table VI-3WSS pressure pipe: Selected financial data, by firm, fiscal years 2005-07
* * * * * * *
The variance analysis showing the effects of prices and volume on the producers’ sales of WSSpressure pipe, and of costs and volume on their total cost, is shown in table VI-4. The analysis confirmsthat the increase in profitability from year to year and from 2005 to 2007 was the result of per-unit pricesincreasing faster than costs and expenses. The summary at the bottom of the table illustrates that from2005 to 2007 the positive effect of increased prices ($ ***) was more than the negative effect of increasedcosts and expense ($ ***). The analysis also confirms that even though the magnitude of the change inprices, costs, and expenses was less from 2005 to 2006 than from 2006 to 2007, the impact was greaterfrom 2005 to 2006 than from 2006 to 2007.
Table VI-4WSS pressure pipe: Variance analysis of operations of U.S. producers, fiscal years 2005-07
* * * * * * *
Capital Expenditures and Research and Development Expenses
The capital expenditures and research and development (R&D) expenses are presented in tableVI-5. Capital expenditures were *** for the domestic industry (table VI-1), an indication that thedomestic industry is ***.
*** R&D expenses.
Table VI-5WSS pressure pipe: Capital expenditures and R&D expenses, fiscal years 2005-07
* * * * * * *

VI-5
Assets and Return on Investment
The domestic WSS pressure pipe industry’s assets and its return on investment are presented intable VI-6. The increase in the total value of assets from 2005 to 2007 was the result of increasedinventories; the original cost and book value of the producers’ productive assets decreased by a smallamount from 2005 to 2007. At the same time, the return on the assets turned from negative to positive asoperating income increased.
Table VI-6WSS pressure pipe: Value of assets and return on investment, fiscal years 2005-07
* * * * * * *
Capital and Investment
The Commission requested U.S. WSS pressure pipe producers to describe any actual or potentialnegative effects on their return on investment, or their growth, investment, ability to raise capital, existingdevelopment and production efforts, or the scale of capital investments as a result of imports of WSSpressure pipe from China. The firms’ comments are contained in appendix E.


1 Section 771(7)(F)(ii) of the Act (19 U.S.C. § 1677(7)(F)(ii)) provides that “The Commission shall consider[these factors] . . . as a whole in making a determination of whether further dumped or subsidized imports areimminent and whether material injury by reason of imports would occur unless an order is issued or a suspensionagreement is accepted under this title. The presence or absence of any factor which the Commission is required toconsider . . . shall not necessarily give decisive guidance with respect to the determination. Such a determinationmay not be made on the basis of mere conjecture or supposition.”
VII-1
PART VII: THREAT CONSIDERATIONS AND BRATSK INFORMATION
Section 771(7)(F)(i) of the Act (19 U.S.C. § 1677(7)(F)(i)) provides that--
In determining whether an industry in the United States is threatenedwith material injury by reason of imports (or sales for importation) of thesubject merchandise, the Commission shall consider, among otherrelevant economic factors1--
(I) if a countervailable subsidy is involved, such information as may bepresented to it by the administering authority as to the nature of thesubsidy (particularly as to whether the countervailable subsidy is asubsidy described in Article 3 or 6.1 of the Subsidies Agreement), andwhether imports of the subject merchandise are likely to increase,
(II) any existing unused production capacity or imminent, substantialincrease in production capacity in the exporting country indicating thelikelihood of substantially increased imports of the subject merchandiseinto the United States, taking into account the availability of other exportmarkets to absorb any additional exports,
(III) a significant rate of increase of the volume or market penetration ofimports of the subject merchandise indicating the likelihood ofsubstantially increased imports,
(IV) whether imports of the subject merchandise are entering at pricesthat are likely to have a significant depressing or suppressing effect ondomestic prices, and are likely to increase demand for further imports,
(V) inventories of the subject merchandise,
(VI) the potential for product-shifting if production facilities in theforeign country, which can be used to produce the subject merchandise,are currently being used to produce other products,
2 Section 771(7)(F)(iii) of the Act (19 U.S.C. § 1677(7)(F)(iii)) further provides that, in antidumpinginvestigations, “. . . the Commission shall consider whether dumping in the markets of foreign countries (asevidenced by dumping findings or antidumping remedies in other WTO member markets against the same class orkind of merchandise manufactured or exported by the same party as under investigation) suggests a threat of materialinjury to the domestic industry.” 3 Stainless steel grades A-304 or A-316. Conference transcript, p. 22 (Avento). 4 Pui Kwan Tse, The Mineral Industry of China, 2005 Mineral Yearbook, U.S. Geological Survey, 2005. 5 Zhou Zhijiang, Jiuli Group, “Basic Introduction of Production, Consumption and Demand of Stainless SteelPipes in China.” Second Asian Stainless Steel Conference, May 22-23, 2006, Shanghai, China. Petitioners’postconference brief, Exhibit 5.
VII-2
(VII) in any investigation under this title which involves imports of botha raw agricultural product (within the meaning of paragraph (4)(E)(iv))and any product processed from such raw agricultural product, thelikelihood that there will be increased imports, by reason of productshifting, if there is an affirmative determination by the Commissionunder section 705(b)(1) or 735(b)(1) with respect to either the rawagricultural product or the processed agricultural product (but not both),
(VIII) the actual and potential negative effects on the existingdevelopment and production efforts of the domestic industry, includingefforts to develop a derivative or more advanced version of the domesticlike product, and
(IX) any other demonstrable adverse trends that indicate the probabilitythat there is likely to be material injury by reason of imports (or sale forimportation) of the subject merchandise (whether or not it is actuallybeing imported at the time).2
Information on the nature of the alleged subsidies and sales at less than fair value was presentedearlier in this report; information on the volume and pricing of imports of the subject merchandise ispresented in Parts IV and V; and information on the effects of imports of the subject merchandise on U.S.producers’ existing development and production efforts is presented in Part VI. Information oninventories of the subject merchandise; foreign producers’ operations, including the potential for“product-shifting;” and dumping in third-country markets, follows. Also presented in this section of thereport is information obtained for consideration by the Commission in relation to Bratsk rulings.
THE INDUSTRY IN CHINA
Overview
China’s stainless steel tube production benefits from upstream Chinese industries. First, China isamong the top ten countries in the world in nickel reserves, and China also holds a quarter of the world’sreserves in molybdenum, the two key alloys in austenitic stainless steels. Together they account for mostof the production cost of stainless steel.3 In addition, according to the 2005 U.S. Geological Survey,Chinese companies have expanded their stainless steel capacity substantially over the past several years,4consistent with the country’s rapid growth in stainless steel consumption.5 In 2006, China surpassedJapan as the world’s largest stainless steel producer. In 2007, according to the Stainless Steel Council of
6 SteelGuru, “China remains largest SS producer in world 2007,” February 18, 2008, found athttp://www.steelguru.com/news/index/2008/02/18/MzcwNjc%3D/China_remains_largest_SS_producer_in_world_2007.html, retrieved on February 27, 2008. 7 Baofeng Steel Corp. is an affiliate of Baofeng Steel Group. 8 Capacity was reported as 5,000 metric tons with diameter of more than 114 mm. Welded Steel Tube and PipeMonthly, February 2008, pp. 2, 12. 9 Welded Steel Tube and Pipe Monthly, January 2008, pp. 11-12. 10 Welded Steel Tube and Pipe Monthly, December 2007, p. 10. 11 Petition, exh. I-6. 12 The Commission received responses from *** indicating they do not produce WSS pressure pipe. 13 Winner could not estimate the percentage of total production of WSS pipe in China for which it accounts. 14 Winner’s projections are based on ***. 15 As of January 1, 2008, China imposed a 15 percent export tax on WSS pressure pipe (the same export tax wasapplied to flat-rolled stainless steel). Conference transcript, pp. 33-34 (Schagrin).
VII-3
China Special Steel Enterprises Association, China remained the leading stainless steel producer in theworld with total production of 7.9 million tons.6
As with stainless steel generally, China has continued to expand its stainless steel tube productioncapacity. Recently reported activities include Baofeng Steel Corp.,7 an affiliate of Baofeng Steel Group,which plans to begin production at a 5,500 ton facility in June 2008, producing welded stainless tubularproducts with diameter larger than 4.5 inches.8 Tingshan, China’s leading private stainless steel producer,has formed a joint venture with Spain’s Irstal Group to install a welded stainless tubular plant with acapacity of 55,000 tons.9 In December 2007, ArcelorMittal and Hunan Valin jointly expanded productionof several value-added products, including welded stainless steel tubular products.10
The petition in these investigations identified nine producers and/or exporters of WSS pressurepipe in China.11 The Commission sent foreign producer questionnaires to 24 firms, received onecompleted questionnaire, and received two responses indicating that the firms do not produce the subjectproduct.12 The responding firm, Winner Stainless Steel Tube Co., Ltd. (“Winner”), estimated that itaccounts for *** percent of total exports of WSS pressure pipe from China to the United States.13 In themost recent fiscal year, Winner estimated that the share of its total sales represented by sales of WSSpressure pipe is *** percent, based on quantity. U.S. importers identified the following Chineseproducers as sources for their imports: ***.
WSS Pressure Pipe Operations
Information on Winner’s WSS pressure pipe operations is presented in table VII-1. Capacity ***during the period, while production and capacity utilization increased in 2006 and decreased in 2007. Projections for 2008-09 included a ***.14 Winner’s capacity was based on *** hours per week, ***weeks per year. Winner reported *** of WSS pipe. Home market sales *** of Winner’s shipments, anddeclined during 2005-07 as a share of total shipments, while the share held by total exports increasedduring the same period. As a share of total shipments, exports destined for the United States *** during2005-07. Projections for 2008 and 2009 forecast that exports to the United States and exports to all othermarkets would ***.15 Winner’s other major export markets are ***. Inventories held by Winnerdecreased *** between December 2005 and December 2007, and are projected to ***.
Table VII-1WSS pressure pipe: Winner’s production capacity, production, shipments, and inventories, 2005-07, and projected 2008-09
* * * * * * *

16 According to one domestic producer, “(M)ost of this investment (in WSS pressure pipe productive facilities)has been made since the turn of the century. Most of these facilities have been built in the last five to seven years,and they continually expand, year on year.” Conference transcript, p. 45 (Tidlow). 17 Those firms were ***. Five firms, ***, reported orders of WSS pressure pipe from other sources afterDecember 31, 2007. 18 *** reported inventories from China. *** reported inventories from other sources.
VII-4
Winner *** inventories of circular welded pipe in the United States, and ***. Winner reported *** plansto add, expand, curtail, or shut down production capacity and/or production of circular welded pipe inChina. However, U.S. importer *** reported that “a few new plants have opened in China” since January1, 2005. Witnesses testifying at the Commission’s staff conference also reported new production capacityin China.16
Alternative Products
In addition to WSS pressure pipe, Winner produces *** on the same equipment and machineryused to produce WSS pressure pipe.
U.S. IMPORTS SUBSEQUENT TO DECEMBER 31, 2007
Six U.S. importers reported that they had placed orders for WSS pressure pipe from China fordelivery into the United States after December 31, 2007.17 This information is presented in table VII-2.
Table VII-2WSS pressure pipe: U.S. importers’ orders after December 31, 2007
* * * * * * *
U.S. IMPORTERS’ INVENTORIES
Two U.S. importers reported inventories of imports of WSS pressure pipe from China during theperiod for which data were collected, and two firms reported inventories from other countries.18 Datacollected in these investigations on U.S. importers’ end-of-period inventories of WSS pressure pipe arepresented in table VII-3. Inventory from China decreased over the period. The ratio of inventory toimports and the ratios of inventory to U.S. and total shipments fell *** from 2005 to 2007. The ratio ofinventory to imports fell from *** percent in 2005 to *** percent in 2007. The ratios of inventory to U.S.and total shipments fell from *** percent in 2005 to *** percent in 2007.
Table VII-3WSS pressure pipe: U.S. importers’ end-of-period inventories of imports, 2005-07
* * * * * * *

19 Final affirmative determination, June 1, 2007. 20 Petition, exh. I-34. 21 Certain Welded Stainless Steel Pipe From Korea and Taiwan, Inv. Nos. 731-TA-540-541 (Second Review),USITC Publication 3877 (August 2006). Imports of subject merchandise from two Taiwan producers are not subjectto antidumping duties. In the original investigations, imports of subject merchandise by Chang Tieh Industry weredetermined to have a 0.00 percent dumping margin and thus no order was imposed. Id., p. I-2. After administrativereviews with de minimis dumping margins, Commerce revoked the order regarding imports of subject merchandiseby Ta Chen as of December 1, 1998. Id., p. I-9. 22 Silicon Metal from Russia, Inv. No. 731-TA-991 (Second Remand), USITC Publication 3910, March 2007, p. 2; citing Bratsk Aluminum Smelter v. United States, 444 F.3d at 1375.
VII-5
ANTIDUMPING AND COUNTERVAILING DUTY ORDERS IN THIRD-COUNTRY MARKETS
Based on available information, WSS pressure pipe from China has been subject to import reliefinvestigations in Argentina19 and South Africa.20 In the United States, there are two antidumping ordersin effect on a subset of the subject merchandise (specifically ASTM A-312 pipe) from Korea andTaiwan.21
INFORMATION ON NONSUBJECT SOURCES
“Bratsk” Considerations
As a result of the Court of Appeals for the Federal Circuit (“CAFC”) decision in BratskAluminum Smelter v. United States (“Bratsk”), the Commission is directed to:
undertake an “additional causation inquiry” whenever certaintriggering factors are met: “whenever the antidumping investigation iscentered on a commodity product, and price competitive non-subjectimports are a significant factor in the market.” The additional inquiryrequired by the Court, which we refer to as the Bratsk replacement /benefit test, is “whether non-subject imports would have replaced thesubject imports without any beneficial effect on domestic producers.”22
Nonsubject Source Information
During the preliminary phase of these investigations, the Commission sought pricing data fromU.S. importers of WSS pressure pipe from China, Taiwan, Korea, Malaysia, Thailand, and all othercountries. Those data are presented in appendix D of this report. With respect to foreign nonsubjectsources of supply, the Commission sought publicly available information regarding internationalsuppliers of WSS pressure pipe since 2005 from national import and export statistics, from conferencetestimony, and from interviews with industry sources.

23 Between 2005 and 2007, U.S. imports from Taiwan grew from less than one-half of the quantity of WSSpressure pipe imports from nonsubject countries to greater than 60 percent. 24 71 FR 96, January 3, 2006. 25 The Simdex Steel Tube Manufacturers Worldwide Guide (2007). Some companies do not report data oncapacity to Simdex and some do not specifically identify their stainless steel types. 26 Ibid.
VII-6
Overview
As discussed in Part IV of this report, the leading nonsubject source of WSS pressure pipe isTaiwan; other major nonsubject source countries include Korea and Malaysia, followed by Thailand.23 Imports from all nonsubject sources combined accounted for nearly 60 percent of total imports in 2005but, by 2007, had decreased as a share of total imports to below 50 percent. Figure VII-1 shows thevolume of subject and nonsubject imports for the period for which data were collected, while figure VII-2shows the respective average unit values of such imports during the same period.
Global Exports of Circular Welded Tubes, Pipes, and Hollow Profiles of Stainless Steel
Table VII-4 presents information on global exports of circular welded tubes, pipes, and hollowprofiles of stainless steel (HTS 7306.40) during 2004-06 (the most recent period available) as reported byGlobal Trade Atlas. Circular welded tubes, pipes, and hollow profiles of stainless steel encompass alarger commodity category, at the 6-digit international harmonization level, than subject WSS pressurepipe (including, for example, larger pipe sizes; mechanical tubing; tubing for boilers, heat exchangers,superheaters, refining furnaces, feedwater heaters, and condensers; and other specialized tubing).
Korea
In 2007, Korea was the third largest supplier of imported WSS pressure pipe to the United States.U.S. imports of ASTM A-312 pipe from Korea currently are subject to antidumping duties of up to 7.92percent.24 Nonetheless, as shown in table VII-5, the United States remains the leading market for exportsof circular welded tubes, pipes, and hollow profiles of stainless steel from Korea. As reported by Simdex,Korea has four manufacturers of the subject products with a total capacity of almost 2.75 million tons. These companies also produce other types of stainless steel products. The two largest companies areHuyndai HYSCO (annual capacity of 1.1 million tons) and SeAH Steel (annual capacity of 1.3 millionton).25
Malaysia
Malaysia ranks behind Korea as a supplier of WSS pressure pipe to the United States. Nonetheless, as shown in tables VII-4 and VII-6, Malaysia is one of the leading global exporters ofcircular welded tubes, pipes, and hollow profiles of stainless steel, and the United States is one ofMalaysia’s leading markets for its exports of such products. Simdex reports that, in Malaysia, there areeight manufacturers of the subject products with total capacity of approximately 600,000 tons. Thesecompanies also produce several other types of stainless steel products. The largest company is LeaderSteel with annual capacity of 220,000 tons.26

VII-7
Figure VII-1WSS pressure pipe: Quantity of U.S. imports, by sources, 2005-07
Source: Tables IV-2 and IV-3.

VII-8
Figure VII-2WSS pressure pipe: Average unit values of U.S. imports, by sources, 2005-07
Source: Tables IV-2 and IV-3.

27 71 FR 96, January 3, 2006. 28 The Simdex Steel Tube Manufacturers Worldwide Guide (2007) is published by Simdex, a French marketresearch and consulting firm in the steel and iron industry. Some companies do not report data on capacity toSimdex and some do not specifically identify their stainless steel types.
VII-9
Table VII-4Circular welded tubes, pipes, and hollow profiles of stainless steel: Global exports by leadingsources, by quantity and average unit value, 2004-06
Leadingsources
2004 2005 2006 2004 2005 2006
Exports (short tons) Unit value (U.S. dollars per short ton)Italy 230,369 236,791 270,518 3,265 3,366 4,067Taiwan 92,956 102,339 136,443 2,636 3,115 3,620Germany 68,633 83,820 98,283 5,246 5,252 5,936China 37,328 49,694 95,999 2,383 2,758 3,151United States 27,061 43,366 66,507 3,491 3,118 2,438Sweden 31,627 29,136 40,537 4,707 4,915 5,570France 24,230 27,537 32,323 4,775 5,079 4,941Korea 28,108 26,573 27,043 2,568 3,131 3,886Switzerland 34,233 34,058 23,563 2,836 2,971 3,391Finland 25,794 23,563 23,288 3,877 4,098 4,830Czech Republic 801 12,187 18,791 4,320 2,624 2,380Canada 18,474 16,408 16,831 4,552 4,986 5,882Malaysia 16,212 10,895 16,201 1,454 2,716 1,799Belgium 17,722 16,719 15,140 2,547 2,280 3,308Note.– Data were compiled from HTS 7306.40, which covers WSS pressure pipe as well as other forms of circularwelded tubes, pipes, and hollow profiles of stainless steel.
Source: Compiled from Global Trade Atlas.
Taiwan
Since 2005, China has replaced Taiwan as the largest supplier of WSS pressure pipe to the U.S.market, although Taiwan remains the second largest supplier. While U.S. imports of ASTM A-312 pipefrom Taiwan generally are subject to antidumping duties of up to 31.90 percent,27 imports of such pipefrom Taiwan producers Chang Tieh Industry and, since 1998, Ta Chen, are not covered. Despite theantidumping duty order on ASTM A-312 pipe, the United States remains a leading market for circularwelded tubes, pipes, and hollow profiles of stainless steel from Taiwan, as shown in table VII-7. According to Simdex, there are nine companies producing welded stainless steel tubular products inTaiwan with a total capacity of over 424,000 tons. These companies also produce other types of stainlesssteel products. The largest company is Yieh Hsing Enterprise with annual capacity of 220,000 tons.28
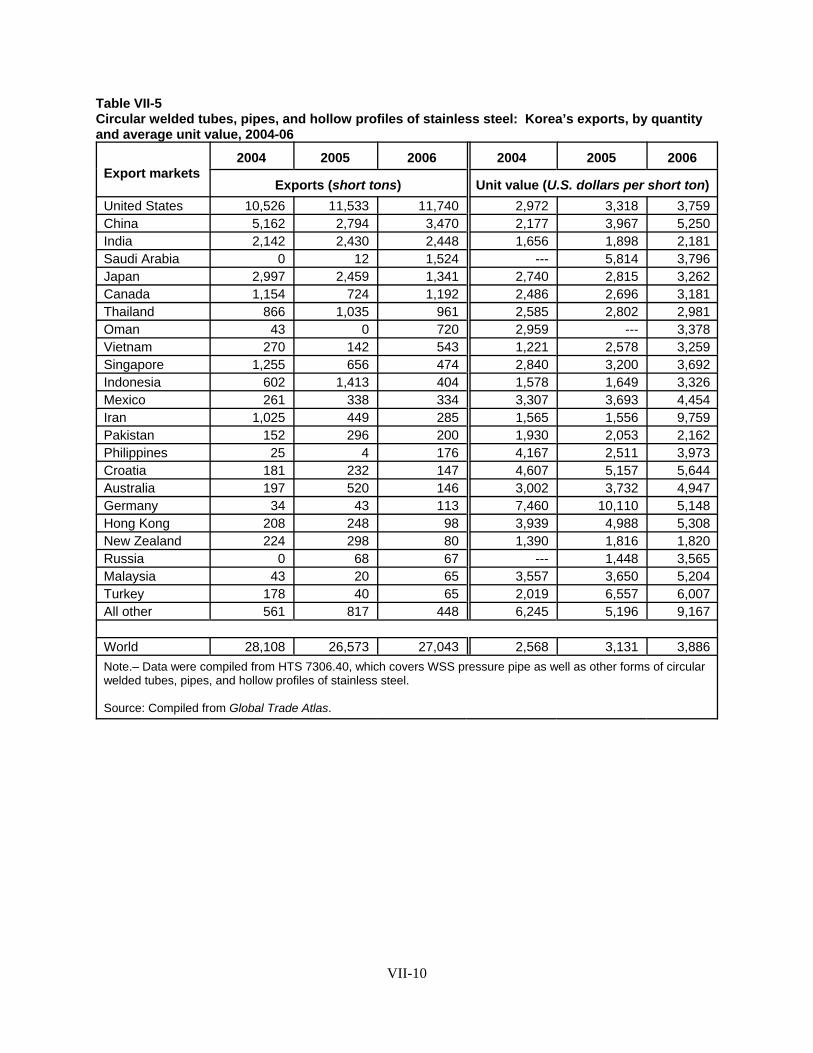
VII-10
Table VII-5Circular welded tubes, pipes, and hollow profiles of stainless steel: Korea’s exports, by quantityand average unit value, 2004-06
Export markets2004 2005 2006 2004 2005 2006
Exports (short tons) Unit value (U.S. dollars per short ton)United States 10,526 11,533 11,740 2,972 3,318 3,759China 5,162 2,794 3,470 2,177 3,967 5,250India 2,142 2,430 2,448 1,656 1,898 2,181Saudi Arabia 0 12 1,524 --- 5,814 3,796Japan 2,997 2,459 1,341 2,740 2,815 3,262Canada 1,154 724 1,192 2,486 2,696 3,181Thailand 866 1,035 961 2,585 2,802 2,981Oman 43 0 720 2,959 --- 3,378Vietnam 270 142 543 1,221 2,578 3,259Singapore 1,255 656 474 2,840 3,200 3,692Indonesia 602 1,413 404 1,578 1,649 3,326Mexico 261 338 334 3,307 3,693 4,454Iran 1,025 449 285 1,565 1,556 9,759Pakistan 152 296 200 1,930 2,053 2,162Philippines 25 4 176 4,167 2,511 3,973Croatia 181 232 147 4,607 5,157 5,644Australia 197 520 146 3,002 3,732 4,947Germany 34 43 113 7,460 10,110 5,148Hong Kong 208 248 98 3,939 4,988 5,308New Zealand 224 298 80 1,390 1,816 1,820Russia 0 68 67 --- 1,448 3,565Malaysia 43 20 65 3,557 3,650 5,204Turkey 178 40 65 2,019 6,557 6,007All other 561 817 448 6,245 5,196 9,167
World 28,108 26,573 27,043 2,568 3,131 3,886Note.– Data were compiled from HTS 7306.40, which covers WSS pressure pipe as well as other forms of circularwelded tubes, pipes, and hollow profiles of stainless steel.
Source: Compiled from Global Trade Atlas.
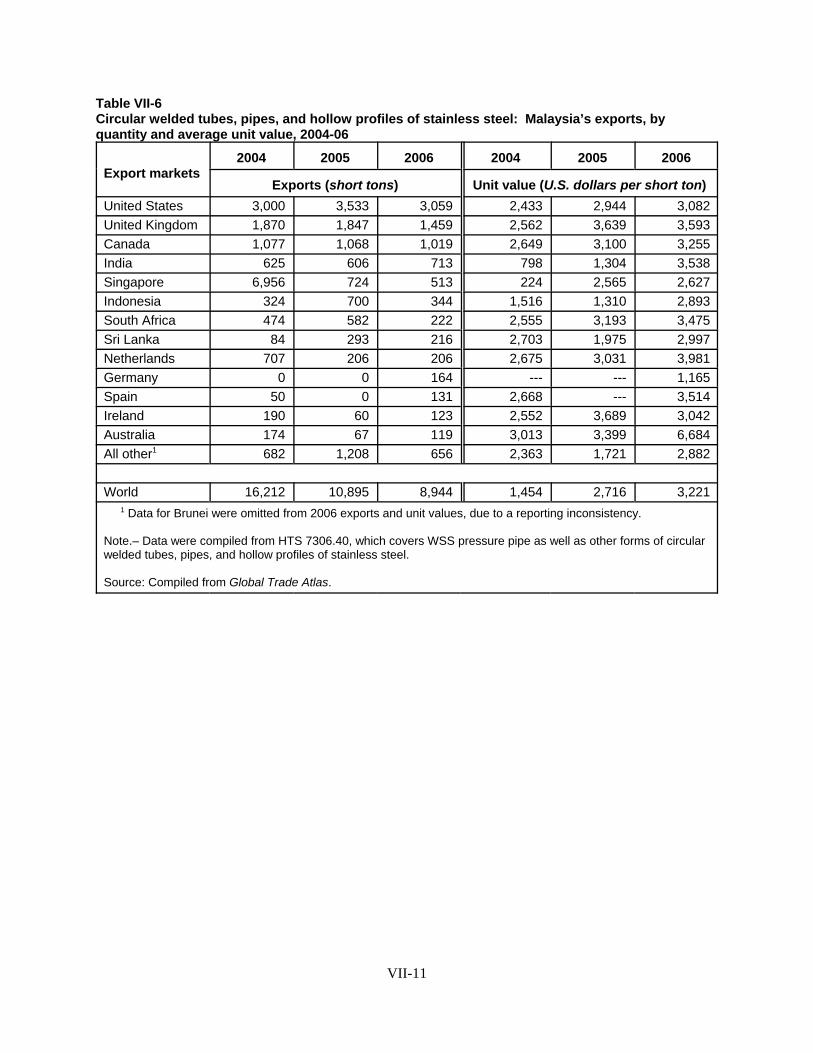
VII-11
Table VII-6Circular welded tubes, pipes, and hollow profiles of stainless steel: Malaysia’s exports, byquantity and average unit value, 2004-06
Export markets2004 2005 2006 2004 2005 2006
Exports (short tons) Unit value (U.S. dollars per short ton)United States 3,000 3,533 3,059 2,433 2,944 3,082United Kingdom 1,870 1,847 1,459 2,562 3,639 3,593Canada 1,077 1,068 1,019 2,649 3,100 3,255India 625 606 713 798 1,304 3,538Singapore 6,956 724 513 224 2,565 2,627Indonesia 324 700 344 1,516 1,310 2,893South Africa 474 582 222 2,555 3,193 3,475Sri Lanka 84 293 216 2,703 1,975 2,997Netherlands 707 206 206 2,675 3,031 3,981Germany 0 0 164 --- --- 1,165Spain 50 0 131 2,668 --- 3,514Ireland 190 60 123 2,552 3,689 3,042Australia 174 67 119 3,013 3,399 6,684All other1 682 1,208 656 2,363 1,721 2,882
World 16,212 10,895 8,944 1,454 2,716 3,221 1 Data for Brunei were omitted from 2006 exports and unit values, due to a reporting inconsistency.
Note.– Data were compiled from HTS 7306.40, which covers WSS pressure pipe as well as other forms of circularwelded tubes, pipes, and hollow profiles of stainless steel.
Source: Compiled from Global Trade Atlas.
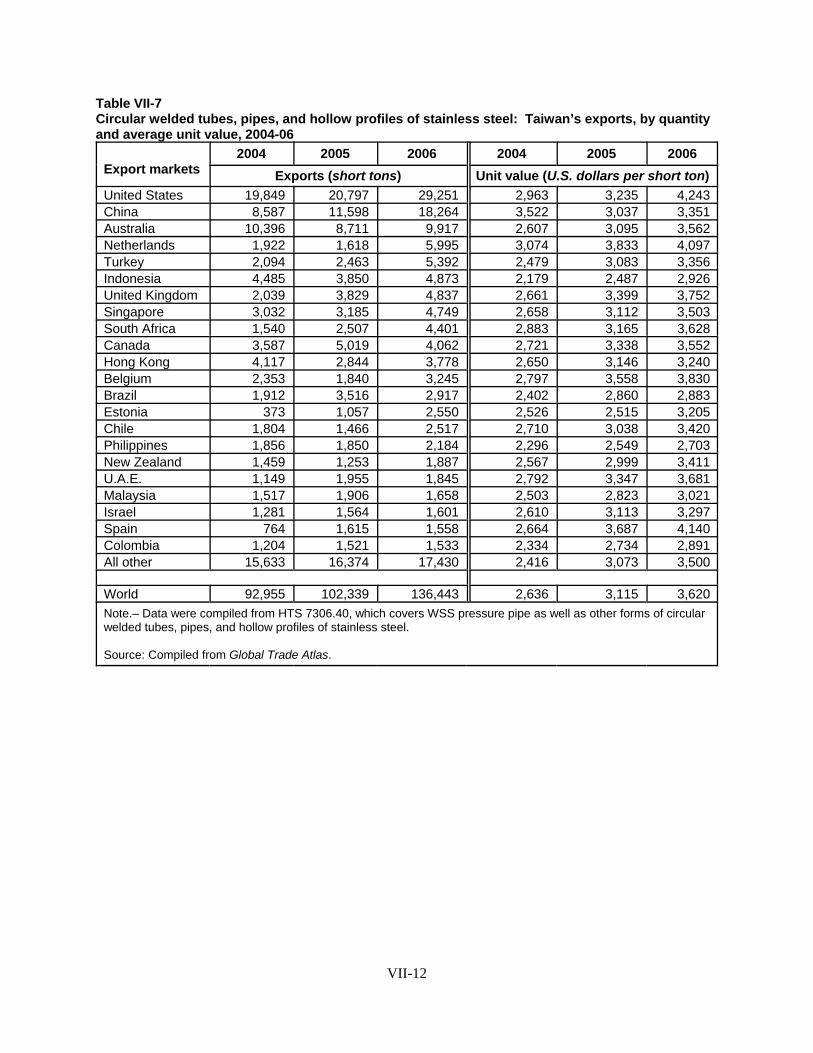
VII-12
Table VII-7Circular welded tubes, pipes, and hollow profiles of stainless steel: Taiwan’s exports, by quantityand average unit value, 2004-06
Export markets2004 2005 2006 2004 2005 2006
Exports (short tons) Unit value (U.S. dollars per short ton)United States 19,849 20,797 29,251 2,963 3,235 4,243China 8,587 11,598 18,264 3,522 3,037 3,351Australia 10,396 8,711 9,917 2,607 3,095 3,562Netherlands 1,922 1,618 5,995 3,074 3,833 4,097Turkey 2,094 2,463 5,392 2,479 3,083 3,356Indonesia 4,485 3,850 4,873 2,179 2,487 2,926United Kingdom 2,039 3,829 4,837 2,661 3,399 3,752Singapore 3,032 3,185 4,749 2,658 3,112 3,503South Africa 1,540 2,507 4,401 2,883 3,165 3,628Canada 3,587 5,019 4,062 2,721 3,338 3,552Hong Kong 4,117 2,844 3,778 2,650 3,146 3,240Belgium 2,353 1,840 3,245 2,797 3,558 3,830Brazil 1,912 3,516 2,917 2,402 2,860 2,883Estonia 373 1,057 2,550 2,526 2,515 3,205Chile 1,804 1,466 2,517 2,710 3,038 3,420Philippines 1,856 1,850 2,184 2,296 2,549 2,703New Zealand 1,459 1,253 1,887 2,567 2,999 3,411U.A.E. 1,149 1,955 1,845 2,792 3,347 3,681Malaysia 1,517 1,906 1,658 2,503 2,823 3,021Israel 1,281 1,564 1,601 2,610 3,113 3,297Spain 764 1,615 1,558 2,664 3,687 4,140Colombia 1,204 1,521 1,533 2,334 2,734 2,891All other 15,633 16,374 17,430 2,416 3,073 3,500
World 92,955 102,339 136,443 2,636 3,115 3,620Note.– Data were compiled from HTS 7306.40, which covers WSS pressure pipe as well as other forms of circularwelded tubes, pipes, and hollow profiles of stainless steel.
Source: Compiled from Global Trade Atlas.

A-1
APPENDIX AFEDERAL REGISTER NOTICES


6741 Federal Register / Vol. 73, No. 24 / Tuesday, February 5, 2008 / Notices
business days prior to the date of the hearing.
Written submissions.—Each party who is an interested party shall submit a prehearing brief to the Commission. Prehearing briefs must conform with the provisions of section 207.23 of the Commission’s rules; the deadline for filing is Friday, April 4, 2008. Parties may also file written testimony in connection with their presentation at the hearing, as provided in section 207.24 of the Commission’s rules, and posthearing briefs, which must conform with the provisions of section 207.25 of the Commission’s rules. The deadline for filing posthearing briefs is Friday, April 18, 2008; witness testimony must be filed no later than three days before the hearing. In addition, any person who has not entered an appearance as a party to the investigations may submit a written statement of information pertinent to the subject of the investigations, including statements of support or opposition to the petition, on or before April 18, 2008. On May 6, 2008, the Commission will make available to parties all information on which they have not had an opportunity to comment. Parties may submit final comments on this information on or before May 8, 2008, but such final comments must not contain new factual information and must otherwise comply with section 207.30 of the Commission’s rules. In addition, comments on the Department of Commerce’s final determinations with respect to subject imports from China and Korea will be permitted based on a schedule to be issued by the Commission no later than the publication in the Federal Register of such determinations by the Department of Commerce. All written submissions must conform with the provisions of section 201.8 of the Commission’s rules; any submissions that contain BPI must also conform with the requirements of sections 201.6, 207.3, and 207.7 of the Commission’s rules. The Commission’s rules do not authorize filing of submissions with the Secretary by facsimile or electronic means, except to the extent permitted by section 201.8 of the Commission’s rules, as amended, 67 Fed. Reg. 68036 (November 8, 2002). Even where electronic filing of a document is permitted, certain documents must also be filed in paper form, as specified in II (C) of the Commission’s Handbook on Electronic Filing Procedures, 67 Fed. Reg. 68168, 68173 (November 8, 2002).
Additional written submissions to the Commission, including requests pursuant to section 201.12 of the Commission’s rules, shall not be accepted unless good cause is shown for
accepting such submissions, or unless the submission is pursuant to a specific request by a Commissioner or Commission staff.
In accordance with sections 201.16(c) and 207.3 of the Commission’s rules, each document filed by a party to the investigations must be served on all other parties to the investigations (as identified by either the public or BPI service list), and a certificate of service must be timely filed. The Secretary will not accept a document for filing without a certificate of service.
Authority: These investigations are being conducted under authority of title VII of the Tariff Act of 1930; this notice is published pursuant to section 207.21 of the Commission’s rules.
By order of the Commission. Issued: January 31, 2008.
Marilyn R. Abbott, Secretary to the Commission. [FR Doc. E8–2052 Filed 2–4–08; 8:45 am] BILLING CODE 7020–02–P
INTERNATIONAL TRADE COMMISSION
[Investigation Nos. 701–TA–454 and 731– TA–1144 (Preliminary)]
Welded Stainless Steel Pressure Pipe From China
AGENCY: United States International Trade Commission. ACTION: Institution of countervailing duty and antidumping duty investigations and scheduling of preliminary phase investigations.
SUMMARY: The Commission hereby gives notice of the institution of an investigation and commencement of preliminary phase countervailing duty investigation No. 701–TA–454 (Preliminary) and antidumping duty investigation No. 731–TA–1144 (Preliminary) under sections 703(a) and 733(a) of the Tariff Act of 1930 (19 U.S.C. 1671b(a) and 1673b(a)) (the Act) to determine whether there is a reasonable indication that an industry in the United States is materially injured or threatened with material injury, or the establishment of an industry in the United States is materially retarded, by reason of imports from China of welded stainless steel pressure pipe, provided for in subheadings 7306.40.50 and 7306.40.10 of the Harmonized Tariff Schedule of the United States, that are alleged to be subsidized by the Government of China, and sold in the United States at less than fair value. Unless the Department of Commerce extends the time for
initiation pursuant to sections 702(c)(1)(B) or 732(c)(1)(B) of the Act (19 U.S.C. 1671a(c)(1)(B) or 1673a(c)(1)(B)), the Commission must reach a preliminary determination in these investigations in 45 days, or in this case by March 17, 2008. The Commission’s views are due at Commerce within five business days thereafter, or by March 24, 2008.
For further information concerning the conduct of these investigations and rules of general application, consult the Commission’s Rules of Practice and Procedure, part 201, subparts A through E (19 CFR part 201), and part 207, subparts A and B (19 CFR part 207). EFFECTIVE DATE: January 30, 2008. FOR FURTHER INFORMATION CONTACT: Elizabeth Haines (202–205–3200), Office of Investigations, U.S. International Trade Commission, 500 E Street, SW., Washington, DC 20436. Hearing- impaired persons can obtain information on this matter by contacting the Commission’s TDD terminal on 202– 205–1810. Persons with mobility impairments who will need special assistance in gaining access to the Commission should contact the Office of the Secretary at 202–205–2000. General information concerning the Commission may also be obtained by accessing its internet server (http:// www.usitc.gov). The public record for these investigations may be viewed on the Commission’s electronic docket (EDIS) at http://edis.usitc.gov. SUPPLEMENTARY INFORMATION:
Background.—These investigations are being instituted in response to a petition filed on January 30, 2008, by Bristol Metals (Bristol, TN), Felker Brothers Corp. (Marshfield, WI), Marcegaglia USA Inc. (Munhall, PA), Outoukumpu Stainless Pipe, Inc. (Schaumburg, IL), and the United Steel Workers of America (Pittsburgh, PA).
Participation in the investigations and public service list.—Persons (other than petitioners) wishing to participate in the investigations as parties must file an entry of appearance with the Secretary to the Commission, as provided in sections 201.11 and 207.10 of the Commission’s rules, not later than seven days after publication of this notice in the Federal Register. Industrial users and (if the merchandise under investigation is sold at the retail level) representative consumer organizations have the right to appear as parties in Commission countervailing duty and antidumping duty investigations. The Secretary will prepare a public service list containing the names and addresses of all persons, or their representatives, who are parties to this investigation
VerDate Aug<31>2005 15:34 Feb 04, 2008 Jkt 214001 PO 00000 Frm 00052 Fmt 4703 Sfmt 4703 E:\FR\FM\05FEN1.SGM 05FEN1rmaj
ette
on
PR
OD
1PC
64 w
ith N
OT
ICE
S
6742 Federal Register / Vol. 73, No. 24 / Tuesday, February 5, 2008 / Notices
upon the expiration of the period for filing entries of appearance.
Limited disclosure of business proprietary information (BPI) under an administrative protective order (APO) and BPI service list.—Pursuant to section 207.7(a) of the Commission’s rules, the Secretary will make BPI gathered in these investigations available to authorized applicants representing interested parties (as defined in 19 U.S.C. 1677(9)) who are parties to the investigations under the APO issued in the investigation, provided that the application is made not later than seven days after the publication of this notice in the Federal Register. A separate service list will be maintained by the Secretary for those parties authorized to receive BPI under the APO.
Conference.—The Commission’s Director of Operations has scheduled a conference in connection with these investigations for 9:30 a.m. on February 21, 2008, at the U.S. International Trade Commission Building, 500 E Street, SW., Washington, DC. Parties wishing to participate in the conference should contact Elizabeth Haines (202–205– 3200) not later than February 15, 2008, to arrange for their appearance. Parties in support of the imposition of countervailing and antidumping duties in these investigations and parties in opposition to the imposition of such duties will each be collectively allocated one hour within which to make an oral presentation at the conference. A nonparty who has testimony that may aid the Commission’s deliberations may request permission to present a short statement at the conference.
Written submissions.—As provided in sections 201.8 and 207.15 of the Commission’s rules, any person may submit to the Commission on or before February 26, 2008, a written brief containing information and arguments pertinent to the subject matter of the investigations. Parties may file written testimony in connection with their presentation at the conference no later than three days before the conference. If briefs or written testimony contain BPI, they must conform with the requirements of sections 201.6, 207.3, and 207.7 of the Commission’s rules. The Commission’s rules do not authorize filing of submissions with the Secretary by facsimile or electronic means, except to the extent permitted by section 201.8 of the Commission’s rules, as amended, 67 FR 68036 (November 8, 2002). Even where electronic filing of a document is permitted, certain documents must also be filed in paper form, as specified in II(C) of the
Commission’s Handbook on Electronic Filing Procedures, 67 Fed. Reg. 68168, 68173 (November 8, 2002).
In accordance with sections 201.16(c) and 207.3 of the rules, each document filed by a party to the investigation must be served on all other parties to the investigations (as identified by either the public or BPI service list), and a certificate of service must be timely filed. The Secretary will not accept a document for filing without a certificate of service.
Authority: These investigations are being conducted under authority of title VII of the Tariff Act of 1930; this notice is published pursuant to section 207.12 of the Commission’s rules.
By order of the Commission. Issued: January 31, 2008.
Marilyn R. Abbott, Secretary to the Commission. [FR Doc. E8–2054 Filed 2–4–08; 8:45 am] BILLING CODE 7020–02–P
DEPARTMENT OF LABOR
Occupational Safety and Health Administration
[Docket No. OSHA–2008–0001]
Grain Handling Facilities; Extension of the Office of Management and Budget’s (OMB) Approval of Information Collection (Paperwork) Requirements
AGENCY: Occupational Safety and Health Administration (OSHA), Labor. ACTION: Request for public comment.
SUMMARY: OSHA solicits public comment concerning its proposal to extend OMB approval of the information collection requirements specified in the Standard on Grain Handling Facilities (29 CFR 1910.272). DATES: Comments must be submitted (postmarked, sent, or received) by April 7, 2008. ADDRESSES: Electronically: You may submit comments and attachments electronically at http:// www.regulations.gov, which is the Federal eRulemaking Portal. Follow the instructions online for submitting comments.
Facsimile: If your comments, including attachments, are not longer than 10 pages, you may fax them to the OSHA Docket Office at (202) 693–1648.
Mail, hand delivery, express mail, messenger, or courier service: When using this method, you must submit three copies of your comments and attachments to the OSHA Docket Office, Docket No. OSHA–2008–0001, U.S.
Department of Labor, Occupational Safety and Health Administration, Room N–2625, 200 Constitution Avenue, NW., Washington, DC 20210. Deliveries (hand, express mail, messenger, and courier service) are accepted during the Department of Labor’s and Docket Office’s normal business hours, 8:15 a.m. to 4:45 p.m., e.t.
Instructions: All submissions must include the Agency name and OSHA docket number for the ICR (OSHA– 2008–0001). All comments, including any personal information you provide, are placed in the public docket without change, and may be made available online at http://www.regulations.gov. For further information on submitting comments see the ‘‘Public Participation’’ heading in the section of this notice titled SUPPLEMENTARY INFORMATION.
Docket: To read or download comments or other material in the docket, go to http://www.regulations.gov or the OSHA Docket Office at the address above. All documents in the docket (including this Federal Register notice) are listed in the http:// www.regulations.gov index; however, some information (e.g., copyrighted material) is not publicly available to read or download through the website. All submissions, including copyrighted material, are available for inspection and copying at the OSHA Docket Office. You may also contact Theda Kenney at the address below to obtain a copy of the ICR. FOR FURTHER INFORMATION CONTACT: Theda Kenney or Todd Owen, Directorate of Standards and Guidance, OSHA, U.S. Department of Labor, Room N–3609, 200 Constitution Avenue, NW., Washington, DC 20210; telephone (202) 693–2222. SUPPLEMENTARY INFORMATION:
I. Background
The Department of Labor, as part of its continuing effort to reduce paperwork and respondent (i.e., employer) burden, conducts a preclearance consultation program to provide the public with an opportunity to comment on proposed and continuing information collection requirements in accordance with the Paperwork Reduction Act of 1995 (44 U.S.C. 3506(c)(2)(A)). This program ensures that information is in the desired format, reporting burden (time and costs) is minimal, collection instruments are clearly understood, and OSHA’s estimate of the information collection burden is accurate. The Occupational Safety and Health Act of 1970 (the OSH Act) (29 U.S.C. 651 et
VerDate Aug<31>2005 15:34 Feb 04, 2008 Jkt 214001 PO 00000 Frm 00053 Fmt 4703 Sfmt 4703 E:\FR\FM\05FEN1.SGM 05FEN1rmaj
ette
on
PR
OD
1PC
64 w
ith N
OT
ICE
S

9994 Federal Register / Vol. 73, No. 37 / Monday, February 25, 2008 / Notices
Dated: February 19, 2008. David M. Spooner, Assistant Secretary for Import Administration.
Appendix I – Issues and Decision Memorandum
I. Analysis Of Programs
A. Programs Determined to Be Not Used
1. Provision of Fertilizer and Machinery
2. Provision of Credit 3. Tax Exemptions 4. Provision of Water and Irrigation
Equipment
5. Technical Support 6. Duty Refunds on Imported Raw or
Intermediate Materials Used in the Production of Export Goods
7. Program to Improve Quality of Exports of Dried Fruit
8. Iranian Export Guarantee Fund 9. GOI Grants and Loans to Pistachio
Farmers 10. Crop Insurance for Pistachios
II. Total Ad Valorem Rate
III. Analysis Of Comments
Comment 1: Whether Ahmadi’s Sale of Subject Merchandise Constitutes a Bona Fide Sale Comment 2: Whether the Department Should Assign an Adverse Facts Available Net Subsidy Rate to Ahmadi Because of the GOI’s Failure to Cooperate with the Department By Providing Incomplete Questionnaire Responses
Comment 3: Whether the Department Should Assign an Adverse Facts Available Net Subsidy Rate to Ahmadi on the Grounds That it Failed to Respond to the Department’s Questionnaires to the Best of its Ability Comment 4: Whether the All–Others Rate Stated in the Preliminary Results Is Inaccurate and Should Be Corrected [FR Doc. E8–3511 Filed 2–22–08; 8:45 am] BILLING CODE 3510–DS–S
DEPARTMENT OF COMMERCE
International Trade Administration
(C–570–931)
Circular Welded Austenitic Stainless Pressure Pipe from the People’s Republic of China: Notice of Initiation of Countervailing Duty Investigation
AGENCY: Import Administration, International Trade Administration, Department of Commerce. EFFECTIVE DATE: February 25, 2008.
FOR FURTHER INFORMATION CONTACT: Darla Brown or Eric Greynolds, AD/CVD Operations, Office 3, Import Administration, International Trade Administration, U.S. Department of Commerce, 14th Street and Constitution Avenue NW, Washington, DC 20230; telephone: (202) 482–2849 and (202) 482–6071, respectively. SUPPLEMENTARY INFORMATION:
The Petition
On January 30, 2008, the Department of Commerce (the ‘‘Department’’) received a petition filed in proper form by Bristol Metals, L.P., Felker Brothers Corp., Marcegaglia USA Inc., Outokumpu Stainless Pipe, Inc., and the United Steel Workers of America (the ‘‘petitioners’’), domestic producers of circular welded austenitic stainless pressure pipe (‘‘CWASPP’’ or ‘‘subject merchandise’’). In response to the Department’s request, the petitioners provided timely information supplementing the petition on February 5, February 11, and February 14, 2008.
In accordance with Section 702(b)(1) of the Tariff Act of 1930, as amended (‘‘the Act’’), the petitioners allege that manufacturers, producers, or exporters of CWASPP in the People’s Republic of China (‘‘PRC’’) receive countervailable subsidies within the meaning of Section 701 of the Act and that such imports are materially injuring, or threatening material injury to, an industry in the United States.
The Department finds that the petitioners filed the petition on behalf of the domestic industry because they are interested parties as defined in Section 771(9)(C) of the Act and the petitioners have demonstrated sufficient industry support with respect to the countervailing duty investigation (see ‘‘Determination of Industry Support for the Petition’’ section below).
Period of Investigation
The period of investigation (‘‘POI’’) is January 1, 2007, through December 31, 2007.
Scope of the Investigation
The merchandise covered by this investigation is circular welded austenitic stainless pressure pipe (‘‘CWASPP’’) not greater than 14 inches in outside diameter. This merchandise includes, but is not limited to, the American Society for Testing and Materials (ASTM) A–312 or ASTM A– 778 specifications, or comparable domestic or foreign specifications. ASTM A–358 products are only included when they are produced to meet ASTM A–312 or ASTM A–778
specifications, or comparable domestic or foreign specifications.
Excluded from the scope are: (1) Welded stainless mechanical tubing, meeting ASTM A–554 or comparable domestic or foreign specifications; (2) boiler, heat exchanger, superheater, refining furnace, feedwater heater, and condenser tubing, meeting ASTM A– 249, ASTM A–688 or comparable domestic or foreign specifications; and (3) specialized tubing, meeting ASTM A–269, ASTM A–270 or comparable domestic or foreign specifications.
The subject imports are normally classified in subheadings 7306.40.5005, 7306.40.5040, 7306.40.5062, 7306.40.5064, and 7306.40.5085 of the Harmonized Tariff Schedule of the United States (‘‘HTSUS’’). They may also enter under HTSUS subheadings 7306.40.1010, 7306.40.1015, 7306.40.5042, 7306.40.5044, 7306.40.5080, and 7306.40.5090. The HTSUS subheadings are provided for convenience and customs purposes only; the written description of the scope is dispositive.
Comments on Scope of Investigation During our review of the petition, we
discussed the scope with the petitioners to ensure that it is an accurate reflection of the products for which the domestic industry is seeking relief. Moreover, as discussed in the preamble to the regulations, we are setting aside a period for interested parties to raise issues regarding product coverage. See Antidumping Duties; Countervailing Duties; Final Rule, 62 FR 27296, 27323 (May 19, 1997). The Department encourages all interested parties to submit such comments within 20 calendar days of the publication of this notice. Comments should be addressed to Import Administration’s Central Records Unit (‘‘CRU’’), Room 1870, U.S. Department of Commerce, 14th Street and Constitution Avenue NW, Washington, DC 20230. The period of scope consultations is intended to provide the Department with ample opportunity to consider all comments and to consult with parties prior to the issuance of the preliminary determination.
Consultations Pursuant to Section 702(b)(4)(A)(ii) of
the Act, the Department invited representatives of the Government of the PRC for consultations with respect to the countervailing duty petition. The Department held these consultations in Beijing, China, with representatives of the Government of the PRC on February 15, 2008. See the February 15, 2008, Memorandum to The File, entitled,
VerDate Aug<31>2005 14:34 Feb 22, 2008 Jkt 214001 PO 00000 Frm 00011 Fmt 4703 Sfmt 4703 E:\FR\FM\25FEN1.SGM 25FEN1rfre
deric
k on
PR
OD
1PC
67 w
ith N
OT
ICE
S

9995 Federal Register / Vol. 73, No. 37 / Monday, February 25, 2008 / Notices
‘‘Consultations Regarding the Petition on Welded Stainless Steel Pressure Pipe from the People’s Republic of China’’ on file in the CRU of the Department of Commerce, Room 1117.
Determination of Industry Support for the Petition
Section 702(b)(1) of the Act requires that a petition be filed by or on behalf of the domestic industry. Section 702(c)(4)(A) of the Act provides that a petition meets this requirement if the domestic producers or workers who support the petition account for: (i) at least 25 percent of the total production of the domestic like product; and (ii) more than 50 percent of the production of the domestic like product produced by that portion of the industry expressing support for, or opposition to, the petition. Moreover, Section 702(c)(4)(D) of the Act provides that, if the petition does not establish support of domestic producers or workers accounting for more than 50 percent of the total production of the domestic like product, the Department shall: (i) poll the industry or rely on other information in order to determine if there is support for the petition, as required by subparagraph (A), or (ii) determine industry support using a statistically valid sampling method.
Section 771(4)(A) of the Act defines the ‘‘industry’’ as the producers as a whole of a domestic like product. Thus, to determine whether a petition has the requisite industry support, the statute directs the Department to look to producers and workers who produce the domestic like product. The International Trade Commission (‘‘ITC’’), which is responsible for determining whether ‘‘the domestic industry’’ has been injured, must also determine what constitutes a domestic like product in order to define the industry. While both the Department and the ITC must apply the same statutory definition regarding the domestic like product (Section 771(10) of the Act), they do so for different purposes and pursuant to a separate and distinct authority. In addition, the Department’s determination is subject to limitations of time and information. Although this may result in different definitions of the like product, such differences do not render the decision of either agency contrary to law. See USEC, Inc. v. United States, 132 F. Supp. 2d 1, 8 (CIT 2001), citing Algoma Steel Corp. Ltd. v. United States, 688 F. Supp. 639, 644 (CIT 1988), aff’d 865 F.2d 240 (Fed. Cir. 1989), cert. denied 492 U.S. 919 (1989).
Section 771(10) of the Act defines the domestic like product as ‘‘a product which is like, or in the absence of like,
most similar in characteristics and uses with, the article subject to an investigation under this title.’’ Thus, the reference point from which the domestic like product analysis begins is ‘‘the article subject to an investigation,’’ (i.e., the class or kind of merchandise to be investigated, which normally will be the scope as defined in the petition).
With regard to the domestic like product, the petitioners do not offer a definition of domestic like product distinct from the scope of the investigation. Based on our analysis of the information submitted on the record, we have determined that CWASPP constitutes a single domestic like product, which is defined further in the ‘‘Scope of the Investigation’’ section above, and we have analyzed industry support in terms of that domestic like product. For a discussion of the domestic like product analysis in this case, see Countervailing Duty Investigation Initiation Checklist: Circular Welded Austenitic Stainless Pressure Pipe from the People’s Republic of China (‘‘PRC Initiation Checklist’’) at Attachment II, on file in the CRU.
In determining whether the petitioners have standing (i.e., those domestic workers and producers supporting the petition account for (1) at least 25 percent of the total production of the domestic like product and (2) more than 50 percent of the production of the domestic like product produced by that portion of the industry expressing support for, or opposition to, the petition), we considered the industry support data contained in the petition with reference to the domestic like product as defined in Attachment I (Scope of the Petition), to the PRC Initiation Checklist. To establish industry support, the petitioners provided their shipments for the domestic like product for the year 2007 and compared them to shipments of the domestic like product for the industry. In their February 13, 2008, supplement to the petition, the petitioners demonstrated the correlation between shipments and production. See February 13, 2008, Supplement to the petition. Based on the fact that total industry production data for the domestic like product for 2007 is not reasonably available, and that the petitioners have established that shipments are a reasonable proxy for production data, we have relied upon shipment data for purposes of measuring industry support. For further discussion see PRC Initiation Checklist at Attachment II (Industry Support).
Our review of the data provided in the petition, supplemental submissions, and
other information readily available to the Department indicates that the petitioners have established industry support. First, the petition established support from domestic producers (or workers) accounting for more than 50 percent of the total production of the domestic like product and, as such, the Department is not required to take further action in order to evaluate industry support (e.g., polling). See Section 702(c)(4)(D) of the Act. Second, the domestic producers have met the statutory criteria for industry support under 702(c)(4)(A)(i) because the domestic producers (or workers) who support the petition account for at least 25 percent of the total production of the domestic like product. Finally, the domestic producers have met the statutory criteria for industry support under Section 702(c)(4)(A)(ii) because the domestic producers (or workers) who support the petition account for more than 50 percent of the production of the domestic like product produced by that portion of the industry expressing support for, or opposition to, the petition. Accordingly, the Department determines that the petition was filed on behalf of the domestic industry within the meaning of Section 702(b)(1) of the Act. See PRC Initiation Checklist at Attachment II (Industry Support).
The Department finds that the petitioners filed the petition on behalf of the domestic industry because they are an interested party as defined in section 771(9)(C) and (D) of the Act and they have demonstrated sufficient industry support with respect to the countervailing duty investigation that they are requesting the Department initiate. See PRC Initiation Checklist at Attachment II (Industry Support).
Injury Test Because the PRC is a ‘‘Subsidies
Agreement Country’’ within the meaning of Section 701(b) of the Act, Section 701(a)(2) of the Act applies to this investigation. Accordingly, the ITC must determine whether imports of the subject merchandise from the PRC materially injure, or threaten material injury to, a U.S. industry.
Allegations and Evidence of Material Injury and Causation
The petitioners allege that imports of CWASPP from the PRC are benefitting from countervailable subsidies and that such imports are causing, or threatening to cause, material injury to the domestic industry producing CWASPP. In addition, the petitioners allege that subsidized imports exceed the negligibility threshold provided for
VerDate Aug<31>2005 14:34 Feb 22, 2008 Jkt 214001 PO 00000 Frm 00012 Fmt 4703 Sfmt 4703 E:\FR\FM\25FEN1.SGM 25FEN1rfre
deric
k on
PR
OD
1PC
67 w
ith N
OT
ICE
S

9996 Federal Register / Vol. 73, No. 37 / Monday, February 25, 2008 / Notices
under Section 771(24)(A) of the Act. The petitioners contend that the industry’s injured condition is illustrated by reduced market share, lost sales, reduced production, capacity and capacity utilization rate, reduced shipments, underselling and price depression or suppression, lost revenue, reduced employment, decline in financial performance and increase in import penetration. We have assessed the allegations and supporting evidence regarding material injury and causation, and we have determined that these allegations are properly supported by adequate evidence and meet the statutory requirements for initiation. See PRC Initiation Checklist at Attachment III (Injury).
Initiation of Countervailing Duty Investigation
Section 702(b) of the Act requires the Department to initiate a countervailing duty proceeding whenever an interested party files a petition on behalf of an industry that (1) alleges the elements necessary for an imposition of a duty under Section 701(a) of the Act; and (2) is accompanied by information reasonably available to the petitioner(s) supporting the allegations. The Department has examined the countervailing duty petition on CWASPP from the PRC and finds that it complies with the requirements of Section 702(b) of the Act. Therefore, in accordance with Section 702(b) of the Act, we are initiating a countervailing duty investigation to determine whether manufacturers, producers, or exporters of CWASPP in the PRC receive countervailable subsidies. For a discussion of evidence supporting our initiation determination, see PRC Initiation Checklist.
We are including in our investigation the following programs alleged in the petition to have provided countervailable subsidies to producers and exporters of the subject merchandise in the PRC:
Preferential Lending
1. Loans and Export Credits Pursuant to the Northeast Revitalization Program
Income Tax Programs
2. ‘‘Two Free, Three Half’’ Program 3. Income Tax Reductions for Export–
oriented Foreign Investment Enterprises (‘‘FIEs’’)
4. Reduced Income Tax Rate for FIEs Located in Economic and Technological Development Zones and Other Special Economic Zones
5. Income Tax Credit or Refund for Reinvestment of FIE Profits
6. Provincial and Local Tax Exemptions and Reductions for Productive FIEs
7. Local Income Tax Reductions in Certain Development Zones
8. Preferential Tax Policies for Research and Development at FIEs
Indirect Tax Programs and Import Tariff Program
9. VAT Refunds on Purchases of Domestically–produced Equipment by FIEs
10. Tax Credits on Purchases of Domestically–produced Equipment by Domestically–owned Companies
Provincial Subsidy Programs
11. Guangdong Province’s ‘‘Outward Expansion’’ Program
12. Preferential Loans Pursuant to Liaoning Province’s Five–Year Framework
13. Preferential Tax Policies for Town and Village Enterprises (‘‘TVEs’’)
Provision of Goods or Services for Less than Adequate Remuneration
14. Provision of Stainless Steel Coil for Less than Adequate Remuneration
15. Provision of Land Use Rights for Less than Adequate Remuneration
Government Restraints on Exports
16. Export Restraints on Flat–rolled Steel
For further information explaining why the Department is investigating these programs, see the PRC Initiation Checklist.
We are not including in our investigation the following programs alleged to benefit producers and exporters of the subject merchandise in the PRC:
1. Guangshou High Technologic Enterprise: Petitioners allege that a producer of CWASPP located in Guangshou received subsidies by virtue of its status as a high technology enterprise, but failed to explain what those alleged subsidies were. Petitioners have not sufficiently alleged the elements necessary for the imposition of a countervailing duty and did not support the allegation with reasonably available information. Therefore, we do not plan to investigate this program.
2. Exemption of Export Taxes for CWASPP: Petitioners allege that producers of CWASPP are exempt from paying certain export taxes that the Government of China (‘‘GOC’’) levies on other steel products. Consistent with the Department’s decision in the initiation of Light–walled Rectangular Pipe and
Tube from the PRC, we find that petitioners have failed to adequately allege how CWASPP producers have been relieved of taxes they would otherwise have paid. See Notice of Initiation of Countervailing Duty Investigation: Light–walled Rectangular Pipe and Tube from the People’s Republic of China, 72 FR 40281, 40283 (July 24, 2007) (‘‘LWRP Initiation Notice’’).
3. City of Shenzhen’s Grants to Exporter to Cover Interest on Loans: Petitioners allege that the City of Shenzhen provides interest payment grants to exporters in the Shenzhen Special Economic Zone (‘‘SEZ’’). Consistent with the Department’s practice in recent initiations, we are declining to initiate on the allegation because petitioners have failed to provide information indicating that a producer of CWASPP is located in the Shenzhen SEZ. See, e.g., LWRP Initiation Notice 72 FR at 40284.
4. ‘‘Famous Brands’’ Program: Petitioners allege that the GOC designates the products of certain firms as ‘‘Famous Brands,’’ thereby making the firms eligible for grants and for enhanced trademark protection. In addition, petitioners allege that some provinces have coordinated efforts to build brands from their provinces. Petitioners have not sufficiently alleged the elements necessary for the imposition of a countervailing duty and did not support their allegation with reasonably available information. Therefore, we do not plan to investigate the ‘‘Famous Brands’’ program.
5. Reduced Income Tax Rate for Technology and Knowledge Intensive FIEs: Petitioners allege that FIEs that qualify as technology intensive or knowledge intensive and have major products listed in a catalogue issued by the Ministry of Science and Technology (‘‘MOST’’) pay a reduced income tax of 15 percent. However, there is no mention of ‘‘pipe’’ in the catalogue, a fact that petitioners acknowledge. Thus, based on record evidence, producers of subject merchandise cannot use this program. Therefore, we do not plan to investigate this program.
6. Provision of Electricity, Natural Gas, and Water for Less than Adequate Remuneration: Petitioners allege that the GOC controls electricity, natural gas, and water prices through the National Development and Reform Commission. Petitioners state that the government caps the price that power generation companies can charge. Petitioners maintain that the steel industry has benefited from preferential treatment in both the prices of these utilities as well as access to the utilities.
VerDate Aug<31>2005 14:34 Feb 22, 2008 Jkt 214001 PO 00000 Frm 00013 Fmt 4703 Sfmt 4703 E:\FR\FM\25FEN1.SGM 25FEN1rfre
deric
k on
PR
OD
1PC
67 w
ith N
OT
ICE
S
9997 Federal Register / Vol. 73, No. 37 / Monday, February 25, 2008 / Notices
Petitioners have not sufficiently alleged the elements necessary for the imposition of a countervailing duty and did not support their allegation with reasonably available information. Therefore, we are not investigating the provision of electricity, natural gas, and water for less than adequate remuneration.
7. The State Key Technologies Renovation Project Fund: Petitioners allege that the purpose of this subsidy program is to promote technological renovations and improvements in key industries through the grant of funds equal to two or three years of interest expense payments for the projects depending upon the region of the country in which the project occurs, not to exceed 15 percent of the total cost of the project. Petitioners have not sufficiently alleged the elements necessary for the imposition of a countervailing duty and did not support their allegation with reasonably available information. Therefore, we do not plan to investigate ‘‘The State Key Technologies Renovation Project Fund’’ program.
Because petitioner has not sufficiently alleged countervailable subsidies for these programs, we are not initiating on them at this time.
Application of the Countervailing Duty Law to the PRC
The Department has treated the PRC as a non–market economy (‘‘NME’’) country in all past antidumping duty investigations and administrative reviews. In accordance with Section 771(18)(C)(i) of the Act, any determination that a country is an NME country shall remain in effect until revoked by the administering authority. See, e.g., Tapered Roller Bearings and Parts Thereof, Finished and 10 Unfinished, (TRBs) From the People’s Republic of China: Preliminary Results of 2001–2002 Administrative Review and Partial Rescission of Review, 68 FR 7500, 7500–1 (February 14, 2003), unchanged in TRBs from the People’s Republic of China: Final Results of 2001–2002 Administrative Review, 68 FR 70488, 70488–89 (December 18, 2003).
In the final affirmative countervailing duty determination on coated free sheet paper from the PRC, the Department determined that the current nature of the PRC economy does not create obstacles to applying the necessary criteria in the CVD law. See Coated Free Sheet Paper from the People’s Republic of China: Final Affirmative Countervailing Duty Determination, 72 FR 60645 (October 25, 2007) and the accompanying Issues and Decision
Memorandum at Comment 1. Therefore, because the petitioners have provided sufficient allegations and support of their allegations to meet the statutory criteria for initiating a CVD investigation of CWASPP from the PRC, initiation of a CVD investigation is warranted in this case.
Respondent Selection
For this investigation, the Department expects to select respondents based on U.S. Customs and Border Protection (‘‘CBP’’) data for U.S. imports during the POI. We intend to make our decision regarding respondent selection within 20 days of publication of this Federal Register notice. The Department invites comments regarding the CBP data and respondent selection within seven calendar days of publication of this Federal Register notice.
Distribution of Copies of the Petition
In accordance with Section 702(b)(4)(A)(i) of the Act, a copy of the public version of the petition has been provided to the Government of the PRC. As soon as and to the extent practicable, we will attempt to provide a copy of the public version of the petition to each exporter named in the petition, consistent with 19 CFR 351.203(c)(2).
ITC Notification
We have notified the ITC of our initiation, as required by Section 702(d) of the Act.
Preliminary Determination by the ITC
The ITC will preliminarily determine, within 25 days after the date on which it receives notice of the initiation, whether there is a reasonable indication that imports of subsidized CWASPP from the PRC are causing material injury, or threatening to cause material injury, to a U.S. industry. See Section 703(a)(2) of the Act. A negative ITC determination will result in the investigation being terminated; otherwise, the investigation will proceed according to statutory and regulatory time limits.
This notice is issued and published pursuant to Section 777(i) of the Act.
Dated: February 19, 2008.
David M. Spooner, Assistant Secretary for Import Administration. [FR Doc. E8–3510 Filed 2–22–08; 8:45 am]
BILLING CODE 3510–DS–S
DEPARTMENT OF COMMERCE
International Trade Administration
[A–428–840, A–570–920]
Lightweight Thermal Paper From Germany and the People’s Republic of China: Postponement of Preliminary Determinations of Antidumping Duty Investigations
AGENCY: Import Administration, International Trade Administration, Department of Commerce. EFFECTIVE DATE: February 25, 2008. FOR FURTHER INFORMATION CONTACT: Cindy Robinson or George McMahon (Germany), or Frances Veith (the People’s Republic of China), AD/CVD Operations, Import Administration, International Trade Administration, U.S. Department of Commerce, 14th Street and Constitution Avenue, NW., Washington, DC 20230, telephone: (202) 482–3797, (202) 482–1167, (202) 482– 4295, respectively. SUPPLEMENTARY INFORMATION:
Postponement of Preliminary Determinations
On October 29, 2007, the Department of Commerce (the Department) initiated the antidumping duty investigations of lightweight thermal paper from Germany, the Republic of Korea, and the People’s Republic of China (PRC). See Notice of Initiation of Antidumping Duty Investigations: Lightweight Thermal Paper from Germany, the Republic of Korea, and the People’s Republic of China, 72 FR 62430 (November 5, 2007). The notice of initiation stated that the Department would issue its preliminary determinations for these investigations no later than 140 days after the date of issuance of the initiation, in accordance with section 733(b)(1)(A) of the Tariff Act of 1930, as amended (the Act). On December 5, 2007, the International Trade Commission (ITC) determined that imports of lightweight thermal paper from the Republic of Korea were negligible, and therefore, terminated the investigation with regard to the Republic of Korea. See Certain Lightweight Thermal Paper From China, Germany, and Korea, 72 FR 70343 (December 11, 2007). On February 6, 2008, the petitioner, Appleton Papers Inc. (Appleton), made a timely request pursuant to section 733(c)(1)(A) of the Act and 19 CFR 351.205(b)(2) and (e) for a 50-day postponement of the preliminary determinations. The petitioner requested postponement of the preliminary determinations for Germany and the PRC in order to allow
VerDate Aug<31>2005 14:34 Feb 22, 2008 Jkt 214001 PO 00000 Frm 00014 Fmt 4703 Sfmt 4703 E:\FR\FM\25FEN1.SGM 25FEN1rfre
deric
k on
PR
OD
1PC
67 w
ith N
OT
ICE
S
10221 Federal Register / Vol. 73, No. 38 / Tuesday, February 26, 2008 / Notices
Avenue, SW., Washington, DC 20250– 1590. Telephone: (202) 720–9556. SUPPLEMENTARY INFORMATION: The cost of money rate methodology develops a weighted average rate for the Bank’s cost of money considering total fiscal year loan advances, debentures and other obligations, and the costs to the Bank of obtaining funds from these sources. Because of the dissolution of the Bank, which was discussed at greater length in the Notice of 2006 fiscal year interest rate determination published November 30, 2006 (See 71 FR 69200), the only component described in 7 CFR 1610.10(c) that is still relevant to the determination of the Bank’s cost of money interest rate is the rate paid on the issuance of debentures and other obligations [see 7 CFR 1610.10(c)(4)]. The table that has been attached to this notice in prior years will no longer be provided since the only calculation necessary to determine the interest rate for advances is the comparison of the interest rate on Treasury borrowings to the statutory minimum rate.
Progress of Dissolution of the Bank At its quarterly meeting on August 4,
2005, the Board of Directors (the ‘‘Board’’) approved a resolution to dissolve the Bank. On November 10, 2005, the liquidation and dissolution process was initiated with the signing by President Bush of the 2006 Agriculture Appropriations bill, which contained a provision lifting the restriction on the retirement of more than 5 percent of the Class A stock held by the Government. This paved the way for all Bank stock to be redeemed.
The dissolution process is now largely complete. The Government’s Class A stock was redeemed on April 10, 2006; redemption payments to Class B and C shareholders began on April 11, 2006 and were completed by September 30, 2006. The final liquidation payments were made to Class A and B shareholders at the time of liquidation on November 13, 2007. The only action still to be taken is the completion of a final audit.
Sources and Costs of Funds Due to the dissolution of the Bank, the
only remaining source of funds is the borrowings from the Treasury, which are categorized as issuance of debentures or other obligations in accordance with the regulations pertaining to the setting of the interest rate for advances on Bank loans (7 CFR 1610.10(c)(4)). For fiscal year 2007, Treasury borrowings related to advances were $53,534,679 at an interest rate of 5.84%. Since this rate exceeds the minimum statutory rate of 5.00% for
Bank loans, the Bank’s cost of money rate for fiscal year 2007 advances is set at 5.84%.
James M. Andrew, Governor, Rural Telephone Bank. [FR Doc. E8–3561 Filed 2–25–08; 8:45 am] BILLING CODE 3410–15–P
DEPARTMENT OF COMMERCE
International Trade Administration
[A–570–930]
Circular Welded Austenitic Stainless Pressure Pipe from the People’s Republic of China: Initiation of Antidumping Duty Investigation
AGENCY: Import Administration, International Trade Administration, Department of Commerce. EFFECTIVE DATE: February 26, 2008. FOR FURTHER INFORMATION CONTACT: Melissa Blackledge, AD/CVD Operations, Office 4, Import Administration, International Trade Administration, U.S. Department of Commerce, 14th Street and Constitution Avenue, NW, Washington, DC 20230; telephone: (202) 482–3518. SUPPLEMENTARY INFORMATION:
The Petition On January 30, 2008, the Department
of Commerce (‘‘Department’’) received a petition concerning imports of circular welded austenitic stainless pressure pipe from the People’s Republic of China (‘‘PRC’’) filed in proper form by Bristol Metals, L.P., Felker Brothers Corp., Marcegaglia USA Inc., Outokumpu Stainless Pipe, Inc. and United Steel Workers of America (collectively ‘‘Petitioners’’). See Petition on Welded Stainless Pressure Pipe from the People’s Republic of China, dated January 30, 2008 (‘‘Petition’’). In February 2008, the Department issued multiple requests for additional information, seeking clarification of certain areas of the Petition. Based on the Department’s requests, Petitioners filed additional information on February 5 through February 13, 2008.
In accordance with section 732(b) of the Tariff Act of 1930, as amended (‘‘Act’’), Petitioners allege that imports of circular welded austenitic stainless pressure pipe from the PRC are being, or are likely to be, sold in the United States at less than fair value, within the meaning of section 731 of the Act, and that such imports are materially injuring, or threaten material injury to, an industry in the United States.
The Department finds that Petitioners filed this Petition on behalf of the
domestic industry because Petitioners are interested parties as defined in section 771(9)(C) and (D) of the Act, and have demonstrated sufficient industry support with respect to the antidumping duty investigation that Petitioners are requesting the Department initiate (see ‘‘Determination of Industry Support for the Petition’’ section below).
Period of Investigation The period of investigation (‘‘POI’’) is
July 1 through December 31, 2007. See 19 CFR 351.204(b).
Scope of Investigation The merchandise covered by this
investigation is circular welded austenitic stainless pressure pipe (‘‘CWASPP’’) not greater than 14 inches in outside diameter. This merchandise includes, but is not limited to, the American Society for Testing and Materials (‘‘ASTM’’) A–312 or ASTM A–778 specifications, or comparable domestic or foreign specifications. ASTM A–358 products are only included when they are produced to meet ASTM A–312 or ASTM A–778 specifications, or comparable domestic or foreign specifications.
Excluded from the scope are: (1) welded stainless mechanical tubing, meeting ASTM A–554 or comparable domestic or foreign specifications; (2) boiler, heat exchanger, superheater, refining furnace, feedwater heater, and condenser tubing, meeting ASTM A– 249, ASTM A–688 or comparable domestic or foreign specifications; and (3) specialized tubing, meeting ASTM A–269, ASTM A–270 or comparable domestic or foreign specifications.
The subject imports are normally classified in subheadings 7306.40.5005, 7306.40.5040, 7306.40.5062, 7306.40.5064, and 7306.40.5085 of the Harmonized Tariff Schedule of the United States (‘‘HTSUS’’). They may also enter under HTSUS subheadings 7306.40.1010, 7306.40.1015, 7306.40.5042, 7306.40.5044, 7306.40.5080, and 7306.40.5090. The HTSUS subheadings are provided for convenience and customs purposes only; the written description of the scope of this investigation is dispositive.
Comments on Scope of Investigation During our review of the Petition, we
discussed the scope with Petitioners to ensure that it is an accurate reflection of the products for which the domestic industry is seeking relief. Moreover, as discussed in the preamble to the regulations (Antidumping Duties; Countervailing Duties; Final Rule, 62 FR 27296, 27323 (May 19, 1997)), we are setting aside a period for interested
VerDate Aug<31>2005 19:29 Feb 25, 2008 Jkt 214001 PO 00000 Frm 00002 Fmt 4703 Sfmt 4703 E:\FR\FM\26FEN1.SGM 26FEN1mst
ocks
till o
n P
RO
D1P
C66
with
NO
TIC
ES

10222 Federal Register / Vol. 73, No. 38 / Tuesday, February 26, 2008 / Notices
parties to raise issues regarding product coverage. The Department encourages all interested parties to submit such comments within 20 days of signature of this notice. Comments should be addressed to Import Administration’s Central Records Unit (‘‘CRU’’), Room 1117, U.S. Department of Commerce, 14th Street and Constitution Avenue, NW, Washington, DC 20230, attention Melissa Blackledge, room 3067. The period of scope consultations is intended to provide the Department with ample opportunity to consider all comments and to consult with parties prior to the issuance of the preliminary determination.
Comments on Product Characteristics for Antidumping Duty Questionnaire
We are requesting comments from interested parties regarding the appropriate physical characteristics of CWASPP to be reported in response to the Department’s antidumping questionnaire. This information will be used to identify the key physical characteristics of the subject merchandise in order for respondents to accurately report the relevant factors of production, as well as develop appropriate product reporting criteria.
Interested parties may provide any information or comments that they feel are relevant to the development of an accurate list of physical characteristics. For example, they may provide comments as to which characteristics are appropriate to use as general product characteristics and product reporting criteria. We note that it is not always appropriate to use all product characteristics as product reporting criteria. We base product reporting criteria on meaningful differences among products. While there may be some physical product characteristics which manufacturers use to describe CWASPP, it may be that only a select few product characteristics take into account meaningful physical characteristics. In order to consider the suggestions of interested parties in developing the antidumping duty questionnaire, we must receive comments at the above–referenced address by March 10, 2008. Rebuttal comments must be received within 10 calendar days of the receipt of timely filed comments.
Determination of Industry Support for the Petition
Section 732(b)(1) of the Act requires that a petition be filed on behalf of the domestic industry. Section 732(c)(4)(A) of the Act provides that a petition meets this requirement if the domestic producers or workers who support the
petition account for: (i) at least 25 percent of the total production of the domestic like product; and (ii) more than 50 percent of the production of the domestic like product produced by that portion of the industry expressing support for, or opposition to, the petition. Moreover, section 732(c)(4)(D) of the Act provides that, if the petition does not establish support of domestic producers or workers accounting for more than 50 percent of the total production of the domestic like product, the Department shall (i) poll the industry or rely on other information in order to determine if there is support for the petition, as required by subparagraph (A), or (ii) determine industry support using a statistically valid sampling method.
Section 771(4)(A) of the Act defines the ‘‘industry’’ as the producers as a whole of a domestic like product. Thus, to determine whether a petition has the requisite industry support, the statute directs the Department to look to producers and workers who produce the domestic like product. The International Trade Commission (‘‘ITC’’), which is responsible for determining whether ‘‘the domestic industry’’ has been injured, must also determine what constitutes a domestic like product in order to define the industry. While both the Department and the ITC must apply the same statutory definition regarding the domestic like product (section 771(10) of the Act), they do so for different purposes and pursuant to a separate and distinct authority. In addition, the Department’s determination is subject to limitations of time and information. Although this may result in different definitions of the like product, such differences do not render the decision of either agency contrary to law. See USEC, Inc. v. United States, 132 F. Supp. 2d 1, 8 (CIT 2001), citing Algoma Steel Corp. Ltd. v. United States, 688 F. Supp. 639, 644 (1988), aff’d 865 F.2d 240 (Fed. Cir. 1989), cert. denied 492 U.S. 919 (1989).
Section 771(10) of the Act defines the domestic like product as ‘‘a product which is like, or in the absence of like, most similar in characteristics and uses with, the article subject to an investigation under this subtitle.’’ Thus, the reference point from which the domestic like product analysis begins is ‘‘the article subject to an investigation,’’ (i.e., the class or kind of merchandise to be investigated, which normally will be the scope as defined in the petition).
With regard to the domestic like product, Petitioners do not offer a definition of domestic like product distinct from the scope of the investigation. Based on our analysis of
the information submitted on the record, we have determined that CWASPP constitutes a single domestic like product and we have analyzed industry support in terms of that domestic like product. For a discussion of the domestic like product analysis in this case, see the Antidumping Investigation Initiation Checklist: Circular Welded Austenitic Stainless Pressure Pipe from the PRC (‘‘Initiation Checklist’’) at Attachment II (Industry Support) on file in the Central Records Unit, Room 1117 of the main Department of Commerce building.
In determining whether Petitioners have standing (i.e., those domestic workers and producers supporting the Petition account for (1) at least 25 percent of the total production of the domestic like product and (2) more than 50 percent of the production of the domestic like product produced by that portion of the industry expressing support for, or opposition to, the Petition), we considered the industry support data contained in the Petition with reference to the domestic like product as defined in Attachment I to the Initiation Checklist (Scope of the Petition). To establish industry support, Petitioners provided their shipments for the domestic like product for the year 2007, and compared them to shipments of the domestic like product for the industry. In their supplement to the Petition, dated February 13, 2008, Petitioners demonstrated the correlation between shipments and production. See Petitioners’ February 13, 2008, supplemental at 1 and Exhibit 1. Based on the fact that total industry production data for the domestic like product for 2007 is not reasonably available, and that Petitioners have established that shipments are a reasonable proxy for production data, we have relied upon shipment data for purposes of measuring industry support. For further discussion, see Initiation Checklist at Attachment II (Industry Support).
Our review of the data provided in the Petition, supplemental submissions, and other information readily available to the Department indicates that Petitioners have established industry support. First, the Petition established support from domestic producers (or workers) accounting for more than 50 percent of the total production of the domestic like product and, as such, the Department is not required to take further action in order to evaluate industry support (e.g., polling). See Section 732(c)(4)(D) of the Act. Second, the domestic producers have met the statutory criteria for industry support under 732(c)(4)(A)(i) because the
VerDate Aug<31>2005 19:29 Feb 25, 2008 Jkt 214001 PO 00000 Frm 00003 Fmt 4703 Sfmt 4703 E:\FR\FM\26FEN1.SGM 26FEN1mst
ocks
till o
n P
RO
D1P
C66
with
NO
TIC
ES
10223 Federal Register / Vol. 73, No. 38 / Tuesday, February 26, 2008 / Notices
domestic producers (or workers) who support the Petition account for at least 25 percent of the total production of the domestic like product. Finally, the domestic producers have met the statutory criteria for industry support under 732(c)(4)(A)(ii) because the domestic producers (or workers) who support the Petition account for more than 50 percent of the production of the domestic like product produced by that portion of the industry expressing support for, or opposition to, the Petition. Accordingly, the Department determines that the Petition was filed on behalf of the domestic industry within the meaning of section 732(b)(1) of the Act. See Initiation Checklist at Attachment II (Industry Support).
The Department finds that Petitioners filed the Petition on behalf of the domestic industry because it is an interested party as defined in section 771(9)(C) and (D) of the Act and it has demonstrated sufficient industry support with respect to the antidumping investigation that it is requesting the Department initiate. See Initiation Checklist at Attachment II (Industry Support).
Allegations and Evidence of Material Injury and Causation
Petitioners allege that the U.S. industry producing the domestic like product is being materially injured, or is threatened with material injury, by reason of the imports of the subject merchandise sold at less than normal value (‘‘NV’’). Petitioners contend that the domestic industry’s injured condition is illustrated by reduced market share, lost sales, reduced production, reduced capacity and capacity utilization rate, reduced shipments, underselling and price depressing and suppressing effects, lost revenue, reduced employment, decline in financial performance, and an increase in import penetration. We have assessed the allegations and supporting evidence regarding material injury and causation, and we have determined that these allegations are properly supported by adequate evidence and meet the statutory requirements for initiation. See Initiation Checklist at Attachment III (Injury).
Allegation of Sales at Less Than Fair Value
The following is a description of the allegation of sales at less than fair value upon which the Department based its decision to initiate this investigation of imports of CWASPP from the PRC. The sources of data for the deductions and adjustments relating to the U.S. price and the factors of production are also
discussed in the checklist. See Initiation Checklist. Should the need arise to use any of this information as facts available under section 776 of the Act in our preliminary or final determinations, we will reexamine the information and revise the margin calculations, if appropriate.
Export Price Petitioners relied on eight prices
obtained from U.S. distributors of CWASPP manufactured by PRC producers/exporters. The eight prices are for POI sales of CWASPP that falls within the scope of the Petition and include freight costs incurred to ship the merchandise from the PRC to the U.S. port. Petitioners deducted from the prices the costs associated with exporting and delivering the product to the customer in the United States, including international freight and handling, U.S. duty charges, and a trading company markup. Petitioners based international freight and handling and U.S. duty charges on the difference between the cost–freight-insurance and free–alongside-ship values for U.S. imports from the PRC under the HTSUS subheadings applicable to the subject merchandise. See Petition at 13–14 and Exhibit I–30 and Petitioners’ February 13, 2008, supplemental at 1 and Exhibits 2 and 6. Petitioners calculated a trading company mark–up based on their own experience and knowledge of the industry. See Petition at Exhibit I– 8 and Petitioners’ February 5, 2008, supplemental at 1 and Exhibits 2 and 3.
Normal Value In accordance with section
771(18)(C)(i) of the Act, the presumption of non–market economy (‘‘NME’’) status remains in effect until revoked by the Department. Petitioners note that the Department has not revoked the NME status of the PRC, and thus they treated the PRC as an NME country for purposes of their Petition. In May 2006, the Department examined the PRC’s market status and determined that NME status should continue for the PRC. See Memorandum from the Office of Policy to David M. Spooner, Assistant Secretary for Import Administration, Regarding The People’s Republic of China Status as a Non–Market Economy, dated May 15, 2006 (this document is available online at http://ia.ita.doc.gov/ ia–news–2006. html). This determination continues to be applied in the Department’s NME antidumping proceedings. See, e.g., Final Determination of Sales at Less Than Fair Value: Certain Activated Carbon from the People’s Republic of China, 72 FR 9508 (March 2, 2007), and Final
Determination of Sales at Less Than Fair Value and Partial Affirmative Determination of Critical Circumstances: Certain Polyester Staple Fiber from the People’s Republic of China, 72 FR 19690 (April 19, 2007). Because the presumption of NME status for the PRC has not been revoked by the Department it remains in effect for purposes of the initiation of this investigation. Accordingly, the NV of the product is appropriately based on factors of production valued in a surrogate market–economy country in accordance with section 773(c) of the Act. After initiation, all parties will have the opportunity to provide relevant information related to the issues of the PRC’s NME status and the granting of separate rates to individual exporters.
Petitioners selected India as the primary surrogate country arguing, pursuant to section 773(c)(4) of the Act, that India is an appropriate surrogate because it is a market–economy country that is at a level of economic development comparable to that of the PRC and is a significant producer of CWASPP. See Petition at 6–7. Based on the information provided by Petitioners, we find it appropriate to use India as a surrogate country for this initiation. After initiation, we will solicit comments regarding surrogate country selection.
Petitioners calculated NVs for each of the U.S. prices discussed above using the Department’s NME methodology as required by 19 CFR 351.202(b)(7)(i)(C) and 19 CFR 351.408. Because the quantities of the factors of production that are consumed by Chinese companies in manufacturing CWASPP are not available to Petitioners, Petitioners calculated NVs using consumption rates experienced by a U.S. producer of CWASPP. See Petition at 7. Petitioners provided information, which they claim demonstrates that Chinese and U.S. companies use the same process to produce CWASPP. See Petitioners’ February 5, 2008, supplemental at 3 and Exhibit 4 and Petitioners’ February 13, 2008, supplemental at 2. Additionally, Petitioners provided an affidavit to support their use of U.S. production data. See Petition at Exhibit I–13 and Petitioners’ February 5, 2008, supplemental at Exhibit 5. Petitioners valued the factors of production as noted below.
Petitioners valued stainless steel using POI world–prices from Management Engineering & Production Services (‘‘MEPS’’), an organization that they identified as a ‘‘leading source of pricing data in the stainless steel industry.’’ According to Petitioners, it
VerDate Aug<31>2005 19:29 Feb 25, 2008 Jkt 214001 PO 00000 Frm 00004 Fmt 4703 Sfmt 4703 E:\FR\FM\26FEN1.SGM 26FEN1mst
ocks
till o
n P
RO
D1P
C66
with
NO
TIC
ES
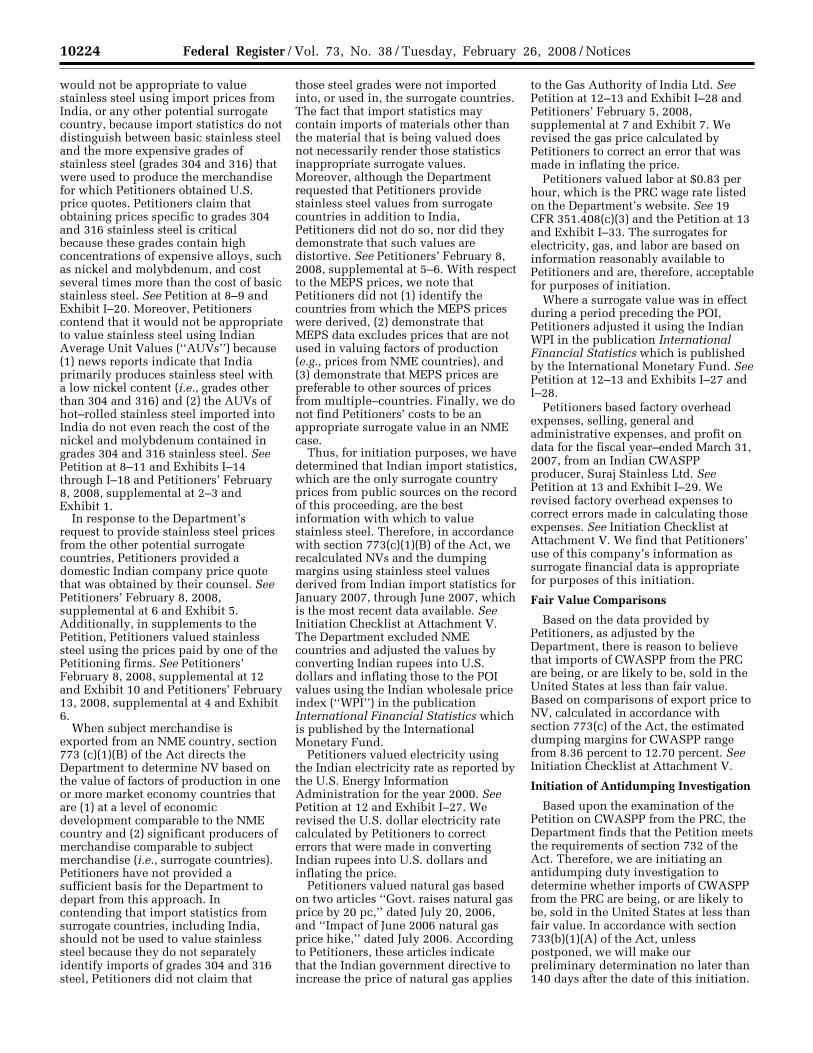
10224 Federal Register / Vol. 73, No. 38 / Tuesday, February 26, 2008 / Notices
would not be appropriate to value stainless steel using import prices from India, or any other potential surrogate country, because import statistics do not distinguish between basic stainless steel and the more expensive grades of stainless steel (grades 304 and 316) that were used to produce the merchandise for which Petitioners obtained U.S. price quotes. Petitioners claim that obtaining prices specific to grades 304 and 316 stainless steel is critical because these grades contain high concentrations of expensive alloys, such as nickel and molybdenum, and cost several times more than the cost of basic stainless steel. See Petition at 8–9 and Exhibit I–20. Moreover, Petitioners contend that it would not be appropriate to value stainless steel using Indian Average Unit Values (‘‘AUVs’’) because (1) news reports indicate that India primarily produces stainless steel with a low nickel content (i.e., grades other than 304 and 316) and (2) the AUVs of hot–rolled stainless steel imported into India do not even reach the cost of the nickel and molybdenum contained in grades 304 and 316 stainless steel. See Petition at 8–11 and Exhibits I–14 through I–18 and Petitioners’ February 8, 2008, supplemental at 2–3 and Exhibit 1.
In response to the Department’s request to provide stainless steel prices from the other potential surrogate countries, Petitioners provided a domestic Indian company price quote that was obtained by their counsel. See Petitioners’ February 8, 2008, supplemental at 6 and Exhibit 5. Additionally, in supplements to the Petition, Petitioners valued stainless steel using the prices paid by one of the Petitioning firms. See Petitioners’ February 8, 2008, supplemental at 12 and Exhibit 10 and Petitioners’ February 13, 2008, supplemental at 4 and Exhibit 6.
When subject merchandise is exported from an NME country, section 773 (c)(1)(B) of the Act directs the Department to determine NV based on the value of factors of production in one or more market economy countries that are (1) at a level of economic development comparable to the NME country and (2) significant producers of merchandise comparable to subject merchandise (i.e., surrogate countries). Petitioners have not provided a sufficient basis for the Department to depart from this approach. In contending that import statistics from surrogate countries, including India, should not be used to value stainless steel because they do not separately identify imports of grades 304 and 316 steel, Petitioners did not claim that
those steel grades were not imported into, or used in, the surrogate countries. The fact that import statistics may contain imports of materials other than the material that is being valued does not necessarily render those statistics inappropriate surrogate values. Moreover, although the Department requested that Petitioners provide stainless steel values from surrogate countries in addition to India, Petitioners did not do so, nor did they demonstrate that such values are distortive. See Petitioners’ February 8, 2008, supplemental at 5–6. With respect to the MEPS prices, we note that Petitioners did not (1) identify the countries from which the MEPS prices were derived, (2) demonstrate that MEPS data excludes prices that are not used in valuing factors of production (e.g., prices from NME countries), and (3) demonstrate that MEPS prices are preferable to other sources of prices from multiple–countries. Finally, we do not find Petitioners’ costs to be an appropriate surrogate value in an NME case.
Thus, for initiation purposes, we have determined that Indian import statistics, which are the only surrogate country prices from public sources on the record of this proceeding, are the best information with which to value stainless steel. Therefore, in accordance with section 773(c)(1)(B) of the Act, we recalculated NVs and the dumping margins using stainless steel values derived from Indian import statistics for January 2007, through June 2007, which is the most recent data available. See Initiation Checklist at Attachment V. The Department excluded NME countries and adjusted the values by converting Indian rupees into U.S. dollars and inflating those to the POI values using the Indian wholesale price index (‘‘WPI’’) in the publication International Financial Statistics which is published by the International Monetary Fund.
Petitioners valued electricity using the Indian electricity rate as reported by the U.S. Energy Information Administration for the year 2000. See Petition at 12 and Exhibit I–27. We revised the U.S. dollar electricity rate calculated by Petitioners to correct errors that were made in converting Indian rupees into U.S. dollars and inflating the price.
Petitioners valued natural gas based on two articles ‘‘Govt. raises natural gas price by 20 pc,’’ dated July 20, 2006, and ‘‘Impact of June 2006 natural gas price hike,’’ dated July 2006. According to Petitioners, these articles indicate that the Indian government directive to increase the price of natural gas applies
to the Gas Authority of India Ltd. See Petition at 12–13 and Exhibit I–28 and Petitioners’ February 5, 2008, supplemental at 7 and Exhibit 7. We revised the gas price calculated by Petitioners to correct an error that was made in inflating the price.
Petitioners valued labor at $0.83 per hour, which is the PRC wage rate listed on the Department’s website. See 19 CFR 351.408(c)(3) and the Petition at 13 and Exhibit I–33. The surrogates for electricity, gas, and labor are based on information reasonably available to Petitioners and are, therefore, acceptable for purposes of initiation.
Where a surrogate value was in effect during a period preceding the POI, Petitioners adjusted it using the Indian WPI in the publication International Financial Statistics which is published by the International Monetary Fund. See Petition at 12–13 and Exhibits I–27 and I–28.
Petitioners based factory overhead expenses, selling, general and administrative expenses, and profit on data for the fiscal year–ended March 31, 2007, from an Indian CWASPP producer, Suraj Stainless Ltd. See Petition at 13 and Exhibit I–29. We revised factory overhead expenses to correct errors made in calculating those expenses. See Initiation Checklist at Attachment V. We find that Petitioners’ use of this company’s information as surrogate financial data is appropriate for purposes of this initiation.
Fair Value Comparisons
Based on the data provided by Petitioners, as adjusted by the Department, there is reason to believe that imports of CWASPP from the PRC are being, or are likely to be, sold in the United States at less than fair value. Based on comparisons of export price to NV, calculated in accordance with section 773(c) of the Act, the estimated dumping margins for CWASPP range from 8.36 percent to 12.70 percent. See Initiation Checklist at Attachment V.
Initiation of Antidumping Investigation
Based upon the examination of the Petition on CWASPP from the PRC, the Department finds that the Petition meets the requirements of section 732 of the Act. Therefore, we are initiating an antidumping duty investigation to determine whether imports of CWASPP from the PRC are being, or are likely to be, sold in the United States at less than fair value. In accordance with section 733(b)(1)(A) of the Act, unless postponed, we will make our preliminary determination no later than 140 days after the date of this initiation.
VerDate Aug<31>2005 19:29 Feb 25, 2008 Jkt 214001 PO 00000 Frm 00005 Fmt 4703 Sfmt 4703 E:\FR\FM\26FEN1.SGM 26FEN1mst
ocks
till o
n P
RO
D1P
C66
with
NO
TIC
ES

10225 Federal Register / Vol. 73, No. 38 / Tuesday, February 26, 2008 / Notices
Separate Rates
In order to obtain separate–rate status in NME investigations, exporters and producers must submit a separate–rate status application. See Policy Bulletin 05.1: Separate–Rates Practice and Application of Combination Rates in Antidumping Investigations Involving Non–Market Economy Countries (April 5, 2005) (‘‘Separate Rates and Combination Rates Bulletin’’), available on the Department’s website at http:// ia.ita.doc.gov/policy/bull05–1.pdf. The specific requirements for submitting the separate–rate application in this investigation are outlined in detail in the application itself, which will be available on the Department’s website at http://ia.ita.doc.gov/ia–highlights-and– news.html on the date of publication of this initiation notice in the Federal Register. The separate–rate application will be due 60 days from publication of this initiation notice.
NME Respondent Selection and Quantity and Value Questionnaire
The Department will request quantity and value information from all known exporters identified in the Petition. The quantity and value data received from NME exporters will be used as the basis to select the mandatory respondents.
The Department requires that the respondents submit a response to both the quantity and value questionnaire and the separate–rate application by the respective deadlines in order to receive consideration for separate–rate status. See Initiation of Antidumping Duty Investigation: Certain Artist Canvas From the People’s Republic of China, 70 FR 21996, 21999 (April 28, 2005); Initiation of Antidumping Duty Investigations: Diamond Sawblades and Parts Thereof from the People’s Republic of China and the Republic of Korea, 70 FR 35625, 35629 (June 21, 2005); and Initiation of Antidumping Duty Investigation: Certain Activated Carbon from the People’s Republic of China, 71 FR 16757, 16760 (April 4, 2006). Appendix I of this notice contains the quantity and value questionnaire that must be submitted by all NME exporters and received by the
Department no later than March 12, 2008. In addition, the Department will post the quantity and value questionnaire along with the filing instructions on the Import Administration website (http:// ia.ita.doc.gov). The Department will send the quantity and value questionnaire to those PRC companies identified in Exhibit I–6 of the Petition.
Use of Combination Rates in an NME Investigation
The Department will calculate combination rates for certain respondents that are eligible for a separate rate in this investigation. The Separate Rates and Combination Rates Bulletin, states:
{w}hile continuing the practice of assigning separate rates only to exporters, all separate rates that the Department will now assign in its NME investigations will be specific to those producers that supplied the exporter during the period of investigation. Note, however, that one rate is calculated for the exporter and all of the producers which supplied subject merchandise to it during the period of investigation. This practice applies both to mandatory respondents receiving an individually calculated separate rate as well as the pool of non– investigated firms receiving the weighted–average of the individually calculated rates. This practice is referred to as the application of ‘‘combination rates’’ because such rates apply to specific combinations of exporters and one or more producers. The cash– deposit rate assigned to an exporter will apply only to merchandise both exported by the firm in question and produced by a firm that supplied the exporter during the period of investigation. (Emphasis in original.)
See Separate Rates and Combination Rates Bulletin at 12.
Distribution of Copies of the Petition In accordance with section
732(b)(3)(a) of the Act and 19 CFR
351.202(f), copies of the public version of the Petition have been provided to the representatives of the Government of the PRC. We will attempt to provide a copy of the public version of the Petition to the foreign producers/ exporters, consistent with 19 CFR 351.203(c)(2).
U.S. International Trade Commission Notification
We have notified the ITC of our initiation, as required by section 732(d) of the Act.
Preliminary Determination by the International Trade Commission
The ITC will preliminarily determine, no later than March 17, 2008, whether there is a reasonable indication that imports of CWASPP from the PRC are materially injuring, or threatening material injury to, the U.S. industry. A negative ITC determination will result in the investigation being terminated; otherwise, this investigation will proceed according to statutory and regulatory time limits.
This notice is issued and published pursuant to section 777(i) of the Act.
Dated: February 19, 2008. David M. Spooner, Assistant Secretaryfor Import Administration.
Appendix I
Where it is not practicable to examine all known producers/exporters of subject merchandise, section 777A(c)(2) of the Tariff Act of 1930 (as amended) permits us to investigate 1) a sample of exporters, producers or types of products that is statistically valid based on the information available at the time of selection, or 2) exporters and producers accounting for the largest volume and value of the subject merchandise that can reasonably be examined.
In the chart below, please provide the total quantity and total value of all your sales of merchandise covered by the scope of this investigation (See scope section of this notice), produced in the PRC and exported/shipped to the United States during the period July 1, 2007, through December 31, 2007.
Market Total Quantity Terms of Sale Total Value
United States ....................................................................................................... ................................ ................................ ................................1. Export Price Sales ........................................................................................... ................................ ................................ ................................2. .......................................................................................................................... ................................ ................................ ................................a. Exporter name ................................................................................................. ................................ ................................ ................................b. Address ............................................................................................................ ................................ ................................ ................................c. Contact ............................................................................................................. ................................ ................................ ................................d. Phone No. ........................................................................................................ ................................ ................................ ................................e. Fax No. ............................................................................................................ ................................ ................................ ................................3. Constructed Export Price Sales ...................................................................... ................................ ................................ ................................4. Further Manufactured Sales ............................................................................ ................................ ................................ ................................
VerDate Aug<31>2005 19:29 Feb 25, 2008 Jkt 214001 PO 00000 Frm 00006 Fmt 4703 Sfmt 4703 E:\FR\FM\26FEN1.SGM 26FEN1mst
ocks
till o
n P
RO
D1P
C66
with
NO
TIC
ES

10226 Federal Register / Vol. 73, No. 38 / Tuesday, February 26, 2008 / Notices
Market Total Quantity Terms of Sale Total Value
Total Sales ........................................................................................................... ................................ ................................ ................................
Total Quantity:
• Please report quantity on a metric ton basis. If any conversions were used, please provide the conversion formula and source.
Terms of Sale:
• Please report all sales on the same terms (e.g. free on board at port of export).
Total Value:
• All sales values should be reported in U.S. dollars. Please indicate any exchange rates used and their respective sources.
Export Price Sales:
• Generally, a U.S. sale is classified as an export price when the first sale to an unaffiliated customer occurs before importation into the United States.
• Please include any sales exported by your company directly to the United States.
• Please include any sales exported by your company to a third–market economy reseller where you had knowledge that the merchandise was destined to be resold to the United States.
• If you are a producer of subject merchandise, please include any sales manufactured by your company that were subsequently exported by an affiliated exporter to the United States.
• Please do not include any sales of merchandise manufactured in Hong Kong in your figures.
Constructed Export Price Sales:
• Generally, a U.S. sale is classified as a constructed export price sale when the first sale to an unaffiliated customer occurs after importation. However, if the first sale to the unaffiliated customer is made by a person in the United States affiliated with the foreign exporter, constructed export price applies even if the sale occurs prior to importation.
• Please include any sales exported by your company directly to the United States.
• Please include any sales exported by your company to a third–market economy reseller where you had knowledge that the merchandise was destined to be resold to the United States.
• If you are a producer of subject merchandise, please include any sales manufactured by your company that were subsequently exported by an affiliated exporter to the United States.
• Please do not include any sales of merchandise manufactured in Hong Kong in your figures.
Further Manufactured Sales:
• Sales of further manufactured or assembled (including re–packaged) merchandise is merchandise that undergoes further manufacture or assembly in the United States before being sold to the first unaffiliated customer.
• Further manufacture or assembly costs include amounts incurred for direct materials, labor and overhead, plus amounts for general and administrative expense, interest expense and additional packing expense incurred in the country of further manufacture, as well as all costs involved in moving the product from the U.S. port of entry to the further manufacturer.
[FR Doc. E8–3642 Filed 2–25–08; 8:45 am] BILLING CODE 3510–DS–S
DEPARTMENT OF COMMERCE
International Trade Administration
Recruitment Notice for Expressions of Interest From Qualified U.S. Travel and Tourism Industry Associations
AGENCY: International Trade Administration, U.S. Department of Commerce. ACTION: Notice.
SUMMARY: Notice is hereby given that the Department of Commerce is soliciting expressions of interest from U.S. Travel and Tourism industry associations with experience and/or core competency in self regulation to establish and implement a program to qualify inbound U.S. tour operators that meet the requirements of the China National Tourism Administration to facilitate packaged group leisure travel established by the ‘‘Memorandum of Understanding Between the Government of the People’s Republic of China and the Government of the United States of America to Facilitate Outbound Tourist Group Travel from China to The United States.’’ The
purpose of this program would be to provide quality assurance and a means for tour operators qualified under the program to be recognized by the China National Tourism Administration (CNTA) as able to do business with Chinese travel agencies approved by the CNTA to organize and market packaged group leisure travel from China to the United States.
Qualified Associations are those that are broadly representative of the U.S. travel and tourism industry, have experience in self regulation programs for the purpose of quality assurance (including the establishment of standards, systems to accept and adjudicate complaints, and procedures for membership revocation for those who do not comply), and have/or will have such programs identified as a mission of the organization.
The Memorandum of Understanding between the Government of the People’s Republic of China and the Government of the United States of America to Facilitate Outbound Tourist Group Travel from China to the United States can be found at http://trade.gov/press/ press_releases/2007/china-tourism- mou-english-121107.pdf.
Deadline: Expressions of interest will be accepted on an ongoing basis, and should be directed to Isabel Hill, Deputy Director for Planning and Policy, Office of Travel and Tourism Industries, U.S. Department of Commerce, Room 1003, 14th and Constitution Ave, NW., Washington, DC, 20230.
Interested Parties: Interested parties should send a letter of interest describing the interest and background of the organization as it relates to this notice. The letter should include a name, title and contact number for the individual responsible for communicating with the Department of Commerce on this matter.
Dated: February 20, 2008.
Helen N. Marano, Director, Office of Travel and Tourism Industries. [FR Doc. 08–850 Filed 2–21–08; 1:01 pm]
BILLING CODE 3510–DR–P
VerDate Aug<31>2005 19:29 Feb 25, 2008 Jkt 214001 PO 00000 Frm 00007 Fmt 4703 Sfmt 4703 E:\FR\FM\26FEN1.SGM 26FEN1mst
ocks
till o
n P
RO
D1P
C66
with
NO
TIC
ES

B-1
APPENDIX BCONFERENCE WITNESSES


CALENDAR OF PUBLIC CONFERENCE
Those listed below appeared as witnesses at the United States International TradeCommission’s conference:
Subject: Welded Stainless Steel Pressure Pipe From ChinaInv. Nos.: 701-TA-454 and 731-TA-1144 (Preliminary)Date and Time: February 21, 2008 - 9:30 a.m.
The conference in connection with these investigations was held in the Main Hearing Room(room 101), 500 E Street, SW, Washington, DC
OPENING REMARKS:
Petitioners (Roger B. Schagrin, Schagrin Associates)Respondents (Max F. Schutzman, Grunfeld, Desiderio, Lebowitz, Silverman & Klestadt LLP)
In Support of the Imposition of Countervailing and Antidumping Duties:
Schagrin Associates Washington, DCon behalf of
Bristol Metals LLC, Felker Brothers Corp., Marcegaglia USA, Inc., Outokumpu Stainless Pipe,Inc., and the United Steel Workers of America
Michael Boling, President, Bristol Metals LLCJohn Tidlow, Vice President of Purchasing & Planning, Bristol Metals LLC Thomas Henke, President, Felker Brothers Corp.David Cornelius, President, Marcegaglia USA, Inc.Rob Yepsen, Sales Manager, Marcegaglia USA, Inc.Joe Avento, Senior Consultant, Outokumpu Stainless Pipe, Inc.Holly Hart, Legislative Director, United Steelworkers
Roger B. Schagrin )– OF COUNSEL
In Opposition to the Imposition of Countervailing and Antidumping Duties:
Grunfeld, Desiderio, Lebowitz, Silverman & Klestadt LLPNew York, NYon behalf of
Silbo Industries, Inc.
Howard Jakob, Executive Vice President, Silbo Industries, Inc.
Max F. Schutzman )– OF COUNSEL


C-1
APPENDIX CSUMMARY DATA


Table C-1WSS pressure pipe: Summary data concerning the U.S. market, 2005-07
(Quantity=short tons, value=1,000 dollars, unit values, unit labor costs, and unit expenses are per short ton; period changes=percent, except where noted)
Reported data Period changes
Item 2005 2006 2007 2005-07 2005-06 2006-07
U.S. consumption quantity: Amount . . . . . . . . . . . . . . . . . . . . . *** *** *** *** *** *** Producers' share (1) . . . . . . . . . . . *** *** *** *** *** *** Importers' share (1): China . . . . . . . . . . . . . . . . . . . . . . *** *** *** *** *** *** All other sources . . . . . . . . . . . . . *** *** *** *** *** *** Total imports . . . . . . . . . . . . . . . *** *** *** *** *** ***
U.S. consumption value: Amount . . . . . . . . . . . . . . . . . . . . . *** *** *** *** *** *** Producers' share (1) . . . . . . . . . . . *** *** *** *** *** *** Importers' share (1): China . . . . . . . . . . . . . . . . . . . . . . *** *** *** *** *** *** All other sources . . . . . . . . . . . . . *** *** *** *** *** *** Total imports . . . . . . . . . . . . . . . *** *** *** *** *** ***
U.S. imports from: China: Quantity . . . . . . . . . . . . . . . . . . . . 14,486 23,751 30,574 111.1 64.0 28.7 Value . . . . . . . . . . . . . . . . . . . . . . 47,923 79,051 155,849 225.2 65.0 97.1 Unit value . . . . . . . . . . . . . . . . . . $3,308 $3,328 $5,097 54.1 0.6 53.2 Ending inventory quantity . . . . . . *** *** *** *** *** *** All other sources: Quantity . . . . . . . . . . . . . . . . . . . . 21,567 22,860 29,314 35.9 6.0 28.2 Value . . . . . . . . . . . . . . . . . . . . . . 75,650 93,018 159,869 111.3 23.0 71.9 Unit value . . . . . . . . . . . . . . . . . . $3,508 $4,069 $5,454 55.5 16.0 34.0 Ending inventory quantity . . . . . . *** *** *** *** *** *** All sources: Quantity . . . . . . . . . . . . . . . . . . . . 36,053 46,611 59,888 66.1 29.3 28.5 Value . . . . . . . . . . . . . . . . . . . . . . 123,573 172,069 315,718 155.5 39.2 83.5 Unit value . . . . . . . . . . . . . . . . . . $3,428 $3,692 $5,272 53.8 7.7 42.8 Ending inventory quantity . . . . . . *** *** *** *** *** ***
U.S. producers': Average capacity quantity . . . . . . . *** *** *** *** *** *** Production quantity . . . . . . . . . . . . *** *** *** *** *** *** Capacity utilization (1) . . . . . . . . . . *** *** *** *** *** *** U.S. shipments: Quantity . . . . . . . . . . . . . . . . . . . . *** *** *** *** *** *** Value . . . . . . . . . . . . . . . . . . . . . . *** *** *** *** *** *** Unit value . . . . . . . . . . . . . . . . . . *** *** *** *** *** *** Export shipments: Quantity . . . . . . . . . . . . . . . . . . . . *** *** *** *** *** *** Value . . . . . . . . . . . . . . . . . . . . . . *** *** *** *** *** *** Unit value . . . . . . . . . . . . . . . . . . *** *** *** *** *** *** Ending inventory quantity . . . . . . . *** *** *** *** *** *** Inventories/total shipments (1) . . . *** *** *** *** *** *** Production workers . . . . . . . . . . . . *** *** *** *** *** *** Hours worked (1,000s) . . . . . . . . . *** *** *** *** *** *** Wages paid ($1,000s) . . . . . . . . . *** *** *** *** *** *** Hourly wages . . . . . . . . . . . . . . . . *** *** *** *** *** *** Productivity (tons/1,000 hours) . . . *** *** *** *** *** *** Unit labor costs . . . . . . . . . . . . . . . *** *** *** *** *** *** Net sales: Quantity . . . . . . . . . . . . . . . . . . . . *** *** *** *** *** *** Value . . . . . . . . . . . . . . . . . . . . . . *** *** *** *** *** *** Unit value . . . . . . . . . . . . . . . . . . *** *** *** *** *** *** Cost of goods sold (COGS) . . . . . *** *** *** *** *** *** Gross profit or (loss) . . . . . . . . . . . *** *** *** *** *** *** SG&A expenses . . . . . . . . . . . . . . *** *** *** *** *** *** Operating income or (loss) . . . . . . *** *** *** *** *** *** Capital expenditures . . . . . . . . . . . *** *** *** *** *** *** Unit COGS . . . . . . . . . . . . . . . . . . *** *** *** *** *** *** Unit SG&A expenses . . . . . . . . . . *** *** *** *** *** *** Unit operating income or (loss) . . . *** *** *** *** *** *** COGS/sales (1) . . . . . . . . . . . . . . *** *** *** *** *** *** Operating income or (loss)/ sales (1) . . . . . . . . . . . . . . . . . . . *** *** *** *** *** ***
(1) "Reported data" are in percent and "period changes" are in percentage points. (2) Undefined.
Note.--Financial data are reported on a fiscal year basis and may not necessarily be comparable to data reported on a calendar year basis.Because of rounding, figures may not add to the totals shown. Unit values and shares are calculated from the unrounded figures.
Source: Compiled from data submitted in response to Commission questionnaires and from official Commerce statistics.
C-3
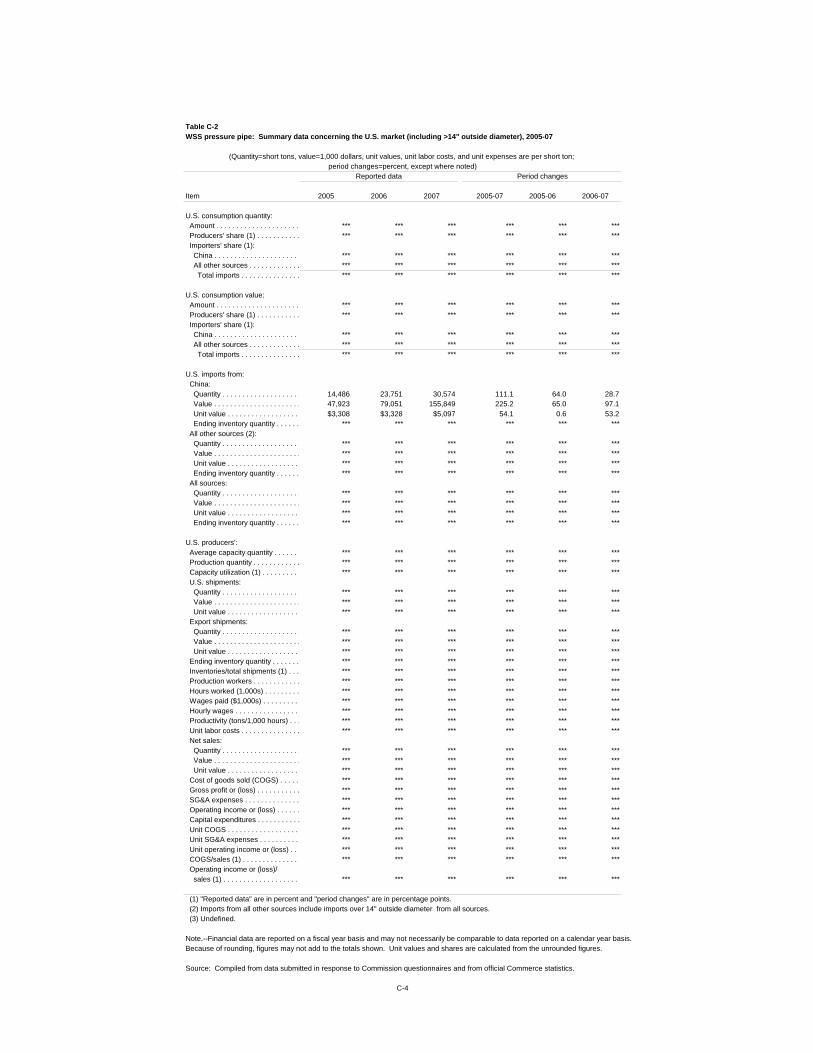
Table C-2WSS pressure pipe: Summary data concerning the U.S. market (including >14" outside diameter), 2005-07
(Quantity=short tons, value=1,000 dollars, unit values, unit labor costs, and unit expenses are per short ton; period changes=percent, except where noted)
Reported data Period changes
Item 2005 2006 2007 2005-07 2005-06 2006-07
U.S. consumption quantity: Amount . . . . . . . . . . . . . . . . . . . . . *** *** *** *** *** *** Producers' share (1) . . . . . . . . . . . *** *** *** *** *** *** Importers' share (1): China . . . . . . . . . . . . . . . . . . . . . . *** *** *** *** *** *** All other sources . . . . . . . . . . . . . *** *** *** *** *** *** Total imports . . . . . . . . . . . . . . . *** *** *** *** *** ***
U.S. consumption value: Amount . . . . . . . . . . . . . . . . . . . . . *** *** *** *** *** *** Producers' share (1) . . . . . . . . . . . *** *** *** *** *** *** Importers' share (1): China . . . . . . . . . . . . . . . . . . . . . . *** *** *** *** *** *** All other sources . . . . . . . . . . . . . *** *** *** *** *** *** Total imports . . . . . . . . . . . . . . . *** *** *** *** *** ***
U.S. imports from: China: Quantity . . . . . . . . . . . . . . . . . . . . 14,486 23,751 30,574 111.1 64.0 28.7 Value . . . . . . . . . . . . . . . . . . . . . . 47,923 79,051 155,849 225.2 65.0 97.1 Unit value . . . . . . . . . . . . . . . . . . $3,308 $3,328 $5,097 54.1 0.6 53.2 Ending inventory quantity . . . . . . *** *** *** *** *** *** All other sources (2): Quantity . . . . . . . . . . . . . . . . . . . . *** *** *** *** *** *** Value . . . . . . . . . . . . . . . . . . . . . . *** *** *** *** *** *** Unit value . . . . . . . . . . . . . . . . . . *** *** *** *** *** *** Ending inventory quantity . . . . . . *** *** *** *** *** *** All sources: Quantity . . . . . . . . . . . . . . . . . . . . *** *** *** *** *** *** Value . . . . . . . . . . . . . . . . . . . . . . *** *** *** *** *** *** Unit value . . . . . . . . . . . . . . . . . . *** *** *** *** *** *** Ending inventory quantity . . . . . . *** *** *** *** *** ***
U.S. producers': Average capacity quantity . . . . . . . *** *** *** *** *** *** Production quantity . . . . . . . . . . . . *** *** *** *** *** *** Capacity utilization (1) . . . . . . . . . . *** *** *** *** *** *** U.S. shipments: Quantity . . . . . . . . . . . . . . . . . . . . *** *** *** *** *** *** Value . . . . . . . . . . . . . . . . . . . . . . *** *** *** *** *** *** Unit value . . . . . . . . . . . . . . . . . . *** *** *** *** *** *** Export shipments: Quantity . . . . . . . . . . . . . . . . . . . . *** *** *** *** *** *** Value . . . . . . . . . . . . . . . . . . . . . . *** *** *** *** *** *** Unit value . . . . . . . . . . . . . . . . . . *** *** *** *** *** *** Ending inventory quantity . . . . . . . *** *** *** *** *** *** Inventories/total shipments (1) . . . *** *** *** *** *** *** Production workers . . . . . . . . . . . . *** *** *** *** *** *** Hours worked (1,000s) . . . . . . . . . *** *** *** *** *** *** Wages paid ($1,000s) . . . . . . . . . *** *** *** *** *** *** Hourly wages . . . . . . . . . . . . . . . . *** *** *** *** *** *** Productivity (tons/1,000 hours) . . . *** *** *** *** *** *** Unit labor costs . . . . . . . . . . . . . . . *** *** *** *** *** *** Net sales: Quantity . . . . . . . . . . . . . . . . . . . . *** *** *** *** *** *** Value . . . . . . . . . . . . . . . . . . . . . . *** *** *** *** *** *** Unit value . . . . . . . . . . . . . . . . . . *** *** *** *** *** *** Cost of goods sold (COGS) . . . . . *** *** *** *** *** *** Gross profit or (loss) . . . . . . . . . . . *** *** *** *** *** *** SG&A expenses . . . . . . . . . . . . . . *** *** *** *** *** *** Operating income or (loss) . . . . . . *** *** *** *** *** *** Capital expenditures . . . . . . . . . . . *** *** *** *** *** *** Unit COGS . . . . . . . . . . . . . . . . . . *** *** *** *** *** *** Unit SG&A expenses . . . . . . . . . . *** *** *** *** *** *** Unit operating income or (loss) . . . *** *** *** *** *** *** COGS/sales (1) . . . . . . . . . . . . . . *** *** *** *** *** *** Operating income or (loss)/ sales (1) . . . . . . . . . . . . . . . . . . . *** *** *** *** *** ***
(1) "Reported data" are in percent and "period changes" are in percentage points. (2) Imports from all other sources include imports over 14" outside diameter from all sources. (3) Undefined.
Note.--Financial data are reported on a fiscal year basis and may not necessarily be comparable to data reported on a calendar year basis.Because of rounding, figures may not add to the totals shown. Unit values and shares are calculated from the unrounded figures.
Source: Compiled from data submitted in response to Commission questionnaires and from official Commerce statistics.
C-4

APPENDIX D
SUPPLEMENTAL PRICE DATAFOR WSS PRESSURE PIPE PRODUCTS 1-5

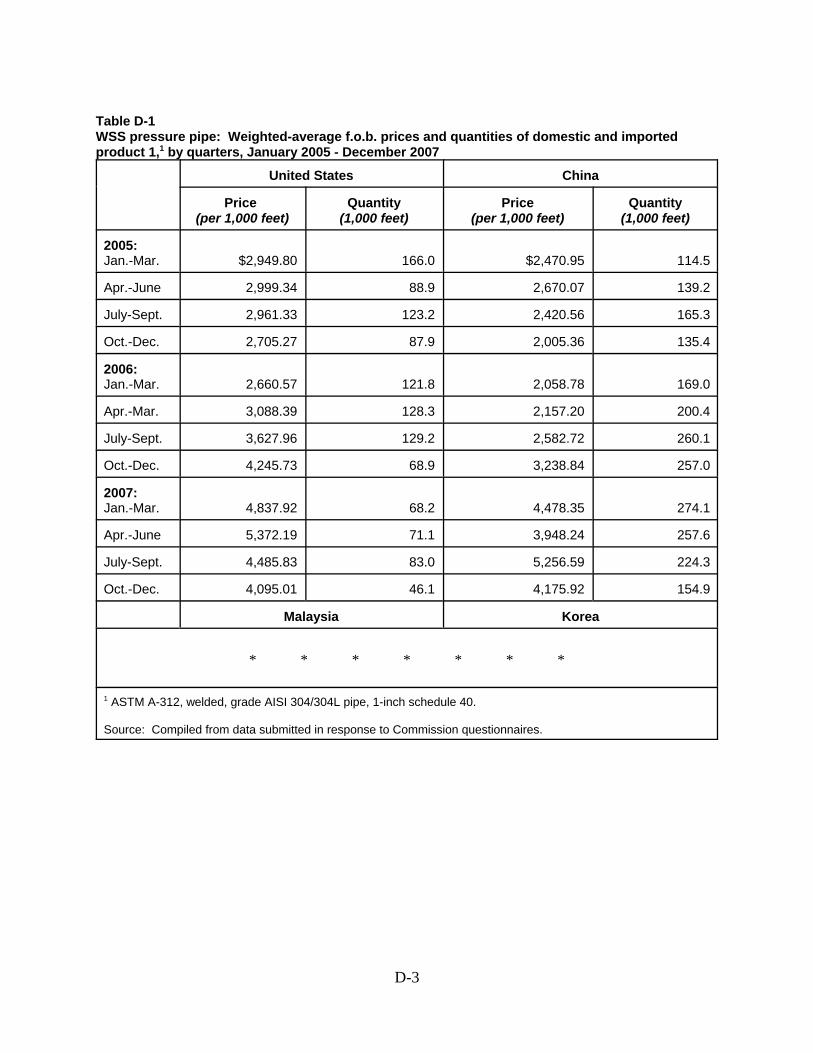
D-3
Table D-1WSS pressure pipe: Weighted-average f.o.b. prices and quantities of domestic and importedproduct 1,1 by quarters, January 2005 - December 2007
United States China
Price (per 1,000 feet)
Quantity(1,000 feet)
Price(per 1,000 feet)
Quantity(1,000 feet)
2005:Jan.-Mar. $2,949.80 166.0 $2,470.95 114.5
Apr.-June 2,999.34 88.9 2,670.07 139.2
July-Sept. 2,961.33 123.2 2,420.56 165.3
Oct.-Dec. 2,705.27 87.9 2,005.36 135.4
2006:Jan.-Mar. 2,660.57 121.8 2,058.78 169.0
Apr.-Mar. 3,088.39 128.3 2,157.20 200.4
July-Sept. 3,627.96 129.2 2,582.72 260.1
Oct.-Dec. 4,245.73 68.9 3,238.84 257.0
2007:Jan.-Mar. 4,837.92 68.2 4,478.35 274.1
Apr.-June 5,372.19 71.1 3,948.24 257.6
July-Sept. 4,485.83 83.0 5,256.59 224.3
Oct.-Dec. 4,095.01 46.1 4,175.92 154.9
Malaysia Korea
* * * * * * *
1 ASTM A-312, welded, grade AISI 304/304L pipe, 1-inch schedule 40.
Source: Compiled from data submitted in response to Commission questionnaires.

D-4
Table D-2WSS pressure pipe: Weighted-average f.o.b. prices and quantities of domestic and importedproduct 2,1 by quarters, January 2005 - December 2007
Period
United States China
Price (per 1,000 feet)
Quantity(1,000 feet)
Price(per 1,000 feet)
Quantity(1,000 feet)
2005:Jan.-Mar. $5,925.52 148.5 $5,294.78 88.2
Apr.-June 6,190.69 72.4 5,605.01 92.8
July-Sept. 5,809.50 78.8 5,219.46 112.6
Oct.-Dec. 5,470.45 56.6 4,263.81 98.5
2006:Jan.-Mar. 5,385.88 138.6 4,659.92 154.1
Apr.-Mar. 5,857.54 102.3 4,703.80 162.8
July-Sept. 7,855.54 111.4 6,038.67 189.2
Oct.-Dec. 9,422.27 80.5 6,856.51 178.4
2007:Jan.-Mar. 8,641.32 102.4 7,321.25 232.9
Apr.-June 8,625.55 69.5 7,881.03 206.1
July-Sept. 7,853.28 55.5 9,114.48 173.9
Oct.-Dec. *** *** *** ***
Malaysia Korea
* * * * * * *
1 ASTM A-312, welded, grade AISI 304/304L pipe, 2-inch schedule 40.
Source: Compiled from data submitted in response to Commission questionnaires.

D-5
Table D-3WSS pressure pipe: Weighted-average f.o.b. prices and quantities of domestic and importedproduct 3,1 by quarters, January 2005 - December 2007
Period
United States China
Price (per 1,000 feet)
Quantity(1,000 feet)
Price(per 1,000 feet)
Quantity(1,000 feet)
2005:Jan.-Mar. $*** *** $908.13 6.4
Apr.-June 1,524.26 6.1 1,365.12 4.1
July-Sept. *** *** 1,017.59 5.6
Oct.-Dec. 1,255.36 15.5 1,030.24 6.3
2006:Jan.-Mar. 1,396.07 8.9 917.41 12.7
Apr.-Mar. 1,395.25 15.8 1,142.30 8.3
July-Sept. 1,970.60 10.1 1,066.87 9.7
Oct.-Dec. *** *** 1,471.41 12.9
2007:Jan.-Mar. 2,130.63 9.6 1,572.48 27.9
Apr.-June 2,271.65 9.1 1,520.87 15.4
July-Sept. 1,898.83 26.5 1,698.16 17.1
Oct.-Dec. 1,532.79 21.5 1,889.58 9.0
Malaysia Korea
* * * * * * *
1 ASTM A-312, welded, grade AISI 304/304L pipe, 0.5-inch schedule 10.
Source: Compiled from data submitted in response to Commission questionnaires.
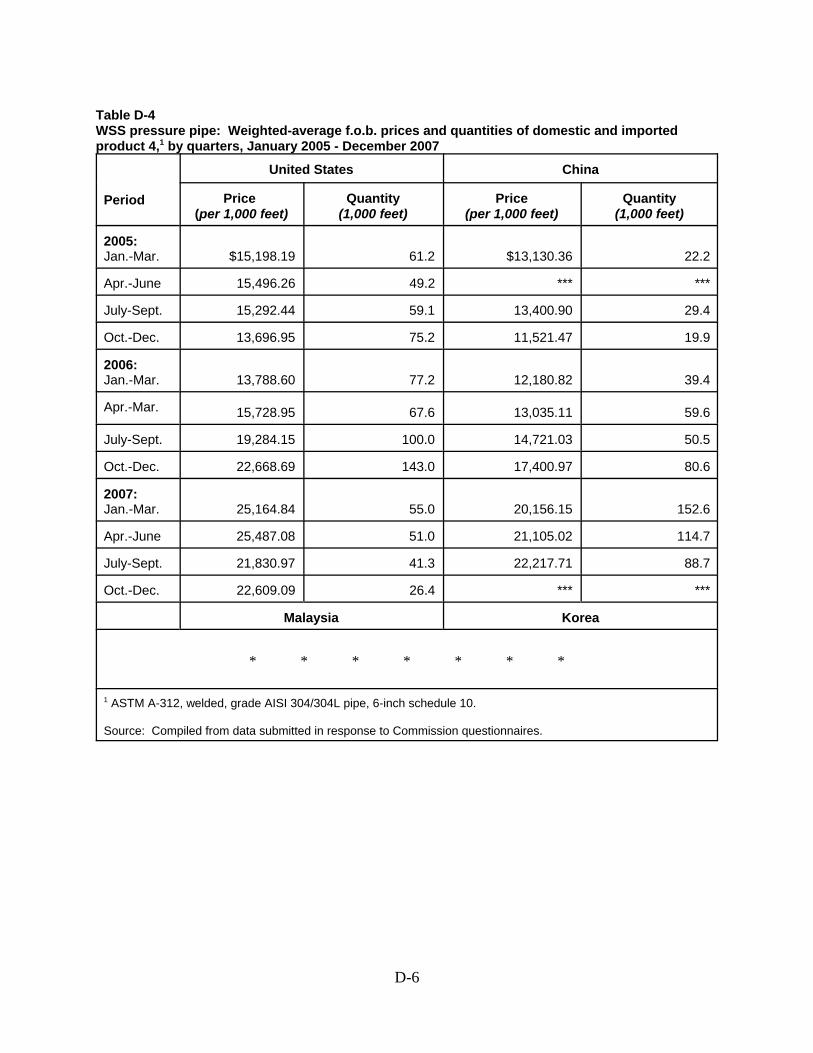
D-6
Table D-4WSS pressure pipe: Weighted-average f.o.b. prices and quantities of domestic and importedproduct 4,1 by quarters, January 2005 - December 2007
Period
United States China
Price (per 1,000 feet)
Quantity(1,000 feet)
Price(per 1,000 feet)
Quantity(1,000 feet)
2005:Jan.-Mar. $15,198.19 61.2 $13,130.36 22.2
Apr.-June 15,496.26 49.2 *** ***
July-Sept. 15,292.44 59.1 13,400.90 29.4
Oct.-Dec. 13,696.95 75.2 11,521.47 19.9
2006:Jan.-Mar. 13,788.60 77.2 12,180.82 39.4
Apr.-Mar. 15,728.95 67.6 13,035.11 59.6
July-Sept. 19,284.15 100.0 14,721.03 50.5
Oct.-Dec. 22,668.69 143.0 17,400.97 80.6
2007:Jan.-Mar. 25,164.84 55.0 20,156.15 152.6
Apr.-June 25,487.08 51.0 21,105.02 114.7
July-Sept. 21,830.97 41.3 22,217.71 88.7
Oct.-Dec. 22,609.09 26.4 *** ***
Malaysia Korea
* * * * * * *
1 ASTM A-312, welded, grade AISI 304/304L pipe, 6-inch schedule 10.
Source: Compiled from data submitted in response to Commission questionnaires.

D-7
Table D-5WSS pressure pipe: Weighted-average f.o.b. prices and quantities of domestic and importedproduct 5,1 by quarters, January 2005 - December 2007
Period
United States China
Price (per 1,000 feet)
Quantity(1,000 feet)
Price(per 1,000 feet)
Quantity(1,000 feet)
2005:Jan.-Mar. $9,736.70 49.7 $10,751.46 24.0
Apr.-June 10,309.42 61.8 8,774.53 47.2
July-Sept. 10,267.98 47.8 8,926.89 51.1
Oct.-Dec. 9,616.68 56.5 8,389.16 30.8
2006:Jan.-Mar. 9,174.41 55.2 7,564.61 38.6
Apr.-Mar. 9,648.69 56.5 7,869.98 55.0
July-Sept. 12,125.37 65.4 9,149.32 64.7
Oct.-Dec. 13,644.29 54.1 10,895.55 69.0
2007:Jan.-Mar. 13,096.37 35.3 12,419.58 50.0
Apr.-June 12,362.79 41.0 12,731.99 56.9
July-Sept. 13,447.11 33.1 14,556.16 26.3
Oct.-Dec. 12,570.00 22.6 *** ***
Malaysia Korea
* * * * * * *
1 ASTM A-312, welded, grade AISI 316/316L pipe, 2-inch schedule 40.
Source: Compiled from data submitted in response to Commission questionnaires.


APPENDIX E
ALLEGED EFFECTS OF IMPORTS ON U.S. PRODUCERS’ EXISTINGDEVELOPMENT AND PRODUCTION EFFORTS, GROWTH, INVESTMENT,
AND ABILITY TO RAISE CAPITAL


E-3
The Commission requested U.S. processors to describe any actual or potential negative effects sinceJanuary 1, 2005, on their return on investment, growth, investment, ability to raise capital, existingdevelopment and production efforts (including efforts to develop a derivative or more advancedversion of the product), or the scale of capital investments as a result of imports of WSS pressurepipe from China. Their responses are as follows:
Actual Negative Effects
*** Yes. Cancellation, postponement, or rejection of expansion projects; denial orrejection of investment proposal; and, reduction in the size of capitalinvestments.
*** No.
*** Yes, substantial impact has been realized through decreased demand and muchlower market pricing/profits for welded stainless steel pressure pipe. This willlimit our ability to continue to invest into new capital required to efficientlymanufacture this product line.
*** No.
*** Yes. Reduction in the size of capital investments. Past investments in equipmentare not providing the desired return because of a reduction in volume of U.S.produced pipe.
Anticipated Negative Effects
*** Yes, substantial impact has been realized through decreased demand and muchlower market pricing/profits for welded stainless steel pressure pipe. This willlimit our ability to continue to invest into new capital required to efficientlymanufacture this product line.
*** Yes, the pricing impact and volume impact have greatly hurt the financials of thisfirm, the number of employees working and the hours worked for theseemployees. Continued growth in Chinese imports will put our company ingrievous danger of shutdown and will eliminate many good paying jobs prior tothat time.

E-4
*** Yes. The low prices and high volumes of subject imported A-312 and A-778pipe do not allow domestic producers to make an acceptable return oninvestment. As a result there will be less domestic production of this product,fewer jobs and loss of profits. Elimination of these items from domestic productlines can be expected to occur.
*** A reduction in sales and margins could result in the idling of equipment,inventory impairment losses, equipment write-downs and reassignment, orpossible reduction, of the workforce.
*** Yes, we suffered both a steady decline in volume over the last several years, anda serious pressure on the sales price because of low-priced Chinese imports.