Welcome to the Port of Pittsburgh - Platts · and repairs on these projects. ... Plant operates 12...
48
Welcome to the Port of Pittsburgh
-
Upload
vuongxuyen -
Category
Documents
-
view
213 -
download
0
Transcript of Welcome to the Port of Pittsburgh - Platts · and repairs on these projects. ... Plant operates 12...

Welcome to the Port of Pittsburgh

PLATT’S COAL MARKETING DAYS September 20, 2012
“The Uncertain Future”
Port Capacity, Expansion, Seaborne Shipping, and Impacts on Coal Exports
• Port capacity, constraints, demand and expansion plans •Northwest - East coast - Inland •Panama Canal
• Permitting and regulatory challenges? • Technical/equipment advancements?
Moderator: James McCarville, Executive Director, Port of Pittsburgh Commission Everett King, President and Chief Executive Officer, Ambre Energy North America Finn Host, Executive Vice President, T. Parker Host Inc.

The Port of Pittsburgh is the second busiest inland river port in the nation and the 22 busiest port of any kind

TECO Bulk Terminal Capacity: 4.4 million tons
Oiltanking Capacity: 3.5 million tons
Armstrong Coal Capacity: 6 million tons
Myrtle Grove Midstream (Kinder Morgan/IMT) Capacity: 6 million tons
Louisiana Coal Terminals on the Lower Mississippi

If USX Clairton Coke Works were unable to take coal delivery by barge, it would require a truck a minute, 7 days per week to deliver the same quantity of raw material.
1/25/2012 TRB Policy Session: Inland Waterway Issues

Aging Infrastructure About 66% of Pittsburgh District’s navigation structures have exceeded their economic design life of 50 years and are in need of repair and rehabilitation. As these projects continue to age and deteriorate, failures are becoming more common and impacts to the economy of the region and the nation are increasing. Efficient funding for rehabilitation of these projects is critical so that they can continue to function as the most efficient, cost effective, and environmentally friendly mode of transportation available. Risk Assessment The Corps uses a risk-informed assessment to characterize dam safety risk. Projects may be classified as having major problems with a very high risk, significant problems with a moderate risk, or minor problems with a low risk. To date, the Corps has identified 13 projects with major dam safety problems that require urgent action to repair. Three of these projects (about 25%) are located in the Pittsburgh District’s inventory of navigation structures.
TRB Policy Session: Inland Waterway Issues 1/25/2012


Considering the number, age, and condition of all of the locks in the country (196 Locks with half over 50 years old), it is no surprise that the Corps has an increasing demand to perform major maintenance and repairs on these projects. More maintenance and repair requires an increased in funding over traditional levels. This is particularly true in the Pittsburgh District with its 23 Locks (approx 10% of the locks in the country). Over the last five years we have witnessed a trend that shows that our unscheduled lock closures, (many caused by breakdowns), are not only increasing but are surpassing all other locks in the country. The reliability of Pittsburgh District’s 23 locks is drastically decreasing. Unscheduled loss of service impacts everyone in the long run. With an increasing maintenance and repair workload and the same amount of maintenance funding, we move toward “breakdown maintenance” operating mode.
The Corps has initiated an asset management program to focus the available funding to the most effected areas by identifying the projects posing the greatest needs, greatest risks, and greatest impacts.
TRB Policy Session: Inland Waterway Issues 1/25/2012

Reduced O & M 2011-2012
Corps repair fleet operations forced to eliminate weekends and third shift:
Effectively doubling again the time to fix scheduled and unscheduled outages!
TRB Policy Session: Inland Waterway Issues 1/25/2012

Economic Benefits Foregone from Construction Delays, by Project
$0 $1,000 $2,000 $3,000 $4,000 $5,000 $6,000
$ Million
Lower Mon
Kentucky
Marmet
Olmsted
McAlpine
Inner Harbor
Foregone Recoverable

Lock and Dam 3 on the Mon River is a 100+ year structure. It was built on wood pilings and more than doubled its service life…, though it has taken millions of dollars to keep it going.
TRB Policy Session: Inland Waterway Issues 1/25/2012

You can see the water pour through the Lock wall at Mon 3 at Elizabeth, PA during a Maintenance pump out of the auxiliary chamber.
TRB Policy Session: Inland Waterway Issues 1/25/2012

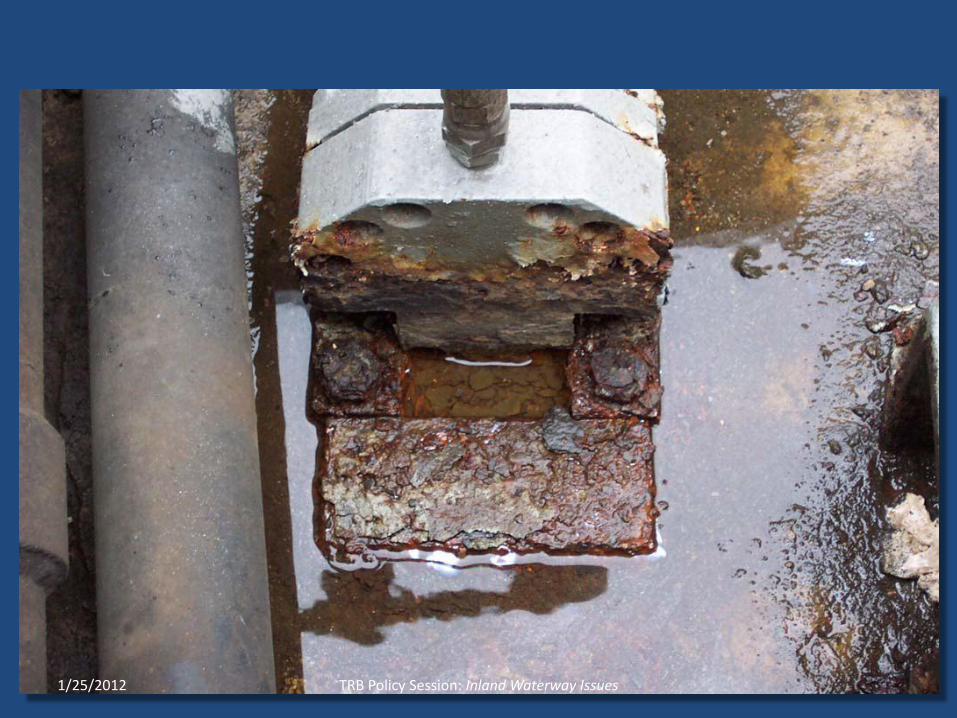
Corroded structural steel members highlights concerns that the dam gates at Montgomery Lock and Dam would not survive a barge strike or heavy ice loads.
TRB Policy Session: Inland Waterway Issues 1/25/2012

The Corps reported warned that the deteriorated condition of the riveted connections at Montgomery could result in a “sunny-day failure”.
TRB Policy Session: Inland Waterway Issues 1/25/2012

TRB Policy Session: Inland Waterway Issues 1/25/2012
TRB Policy Session: Inland Waterway Issues 1/25/2012

TRB Policy Session: Inland Waterway Issues 1/25/2012

TRB Policy Session: Inland Waterway Issues 1/25/2012

ECONOMIC IMPACTS OF THE PORT OF PITTSBURGH
•45,000 Direct jobs •218,000 Total jobs •$10.3B Local wages •$1.0B State and Local taxes •$2.2B Federal taxes
Direct jobs – transportation services
Direct jobs – shippers/consignees
Indirect jobs – generated from purchases by firms
Induced jobs – generated from purchases by direct employees
14,887 30,192
149,534
23,264
217,877 total
jobs
45,079 total
direct jobs
TRB Policy Session: Inland Waterway Issues 1/25/2012

Beneficiaries of Stable Pools
• Navigation Related Jobs • Raw Material Recovery • Low Cost Nav. Transport • Terminal Transfer of Cargo • Manufacture of the Cargo • Effects of Employee Re-
spending
• Non-Navigation • Industrial Cooling for
Electricity & Manufacturing • Intakes for Drinking Water and
Firefighting Water • Sewage Disposal and
Dissolution • Biking, Hiking, Camping • Boating, Fishing, Skiing and
Swimming • Flood Protection and
Protection of Riverfront Property Values
• Cleaner Air and Water
1/25/2012 TRB Policy Session: Inland Waterway Issues
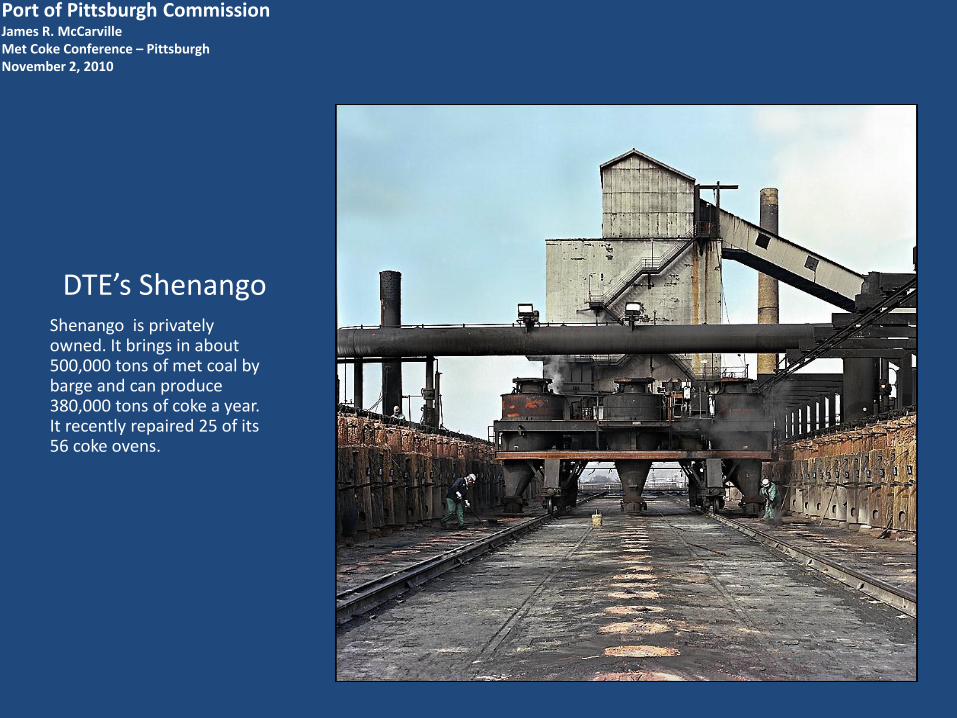
Port of Pittsburgh Commission James R. McCarville Met Coke Conference – Pittsburgh November 2, 2010
Shenango is privately owned. It brings in about 500,000 tons of met coal by barge and can produce 380,000 tons of coke a year. It recently repaired 25 of its 56 coke ovens.
DTE’s Shenango

Port of Pittsburgh Commission James R. McCarville Met Coke Conference – Pittsburgh November 2, 2010
ArcelorMittal acquired the Koppers, Inc. Coke plant in Monessen, PA, in August, 2008. The plant as built in 1941-42. It consists of two coke batteries, housing 56 ovens. In 2007, it had produced 380,000 tons of met coke. ArcelorMittal just announced it will restart it..
ArcelorMittal

Port of Pittsburgh Commission James R. McCarville Met Coke Conference – Pittsburgh November 2, 2010
Mon Valley Works is an integrated steelmaking operation that includes four separate facilities: Clairton Plant, Edgar Thomson Plant, Irvin Plant and Fairless Plant. Clairton Plant is located approximately 20 miles south of Pittsburgh in Clairton, Pa., and sits along the west bank of the Monongahela River. The largest coke manufacturing facility in the United States, Clairton Plant operates 12 coke oven batteries and produces approximately 4.7 million tons of coke annually, serving customers in the commercial coke market as well as U. S. Steel’s steelmaking facilities.
US Steel has agreed to build two additional low-emission quench towers and to enhance pollution controls on old Batteries 1, 2 and 3, which were previously scheduled for demolition. This will reduce the soot emissions by an additional 320 tons per year and is expected to allow Allegheny County to meet federal air quality compliance standards by 2013, two years ahead of schedule. The company has shut down an older oven battery and begun building a new one.
US Steel Clairton

The Result – The Plan
• 25 vs. 6 projects to be competed in 20 yrs
• 12/2009 IWBU outline review
• 4/13/2010 unanimous approval IWUB
• Delivery to ASA and every member of Congress

Construction Projects Funded Under Inland Waterways Capital Development Plan
– Chickamauga Lock complete in FY15
– Olmsted Lock complete in FY19
– Kentucky Lock complete in FY19
– Lower Mon 2, 3 & 4 complete in FY23
– Upper Mississippi River Lock 25 complete in FY19
– High Island to Brazos River, TX start FY13, complete FY15
– LaGrange Lock start FY17, complete FY24
– IHNC Lock in New Orleans start FY21, complete FY28
– Greenup Lock start FY22, complete FY27
– Upper Mississippi Lock 22 start FY22, complete 2030’s
– Upper Mississippi Lock 24 start FY24, complete 2030’s
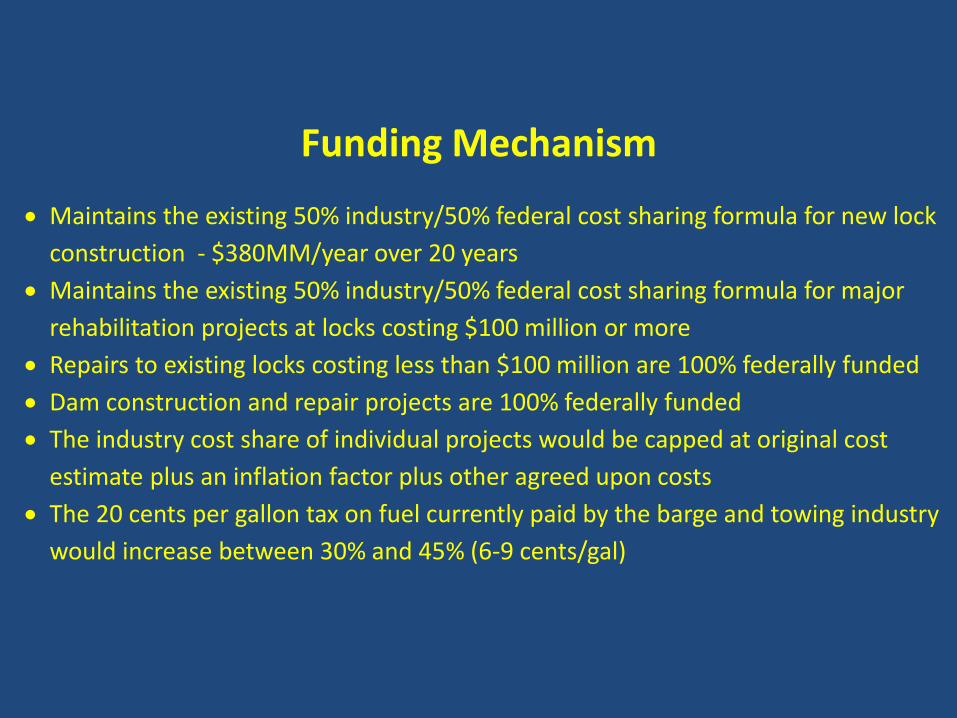
Funding Mechanism
Maintains the existing 50% industry/50% federal cost sharing formula for new lock
construction - $380MM/year over 20 years
Maintains the existing 50% industry/50% federal cost sharing formula for major
rehabilitation projects at locks costing $100 million or more
Repairs to existing locks costing less than $100 million are 100% federally funded
Dam construction and repair projects are 100% federally funded
The industry cost share of individual projects would be capped at original cost
estimate plus an inflation factor plus other agreed upon costs
The 20 cents per gallon tax on fuel currently paid by the barge and towing industry
would increase between 30% and 45% (6-9 cents/gal)

Rehabilitation Projects Funded Under Inland Waterways Capital Development Plan
– Emsworth completed FY13
– Markland completed FY11
– Upper Mississippi Lock & Dam 25 completed FY14
– Lower Monumental Lock & Dam completed FY13
– O’Brien Lock start FY13, complete FY15
– Greenup Dam start FY13, complete FY18
– John T. Myers start FY16, complete FY16
– Meldahl Dam start FY15, complete FY19
– Montgomery Dam start FY16, complete FY23
– Mel Price Lock start FY23, complete FY23
– Arkansas River Lock 2 start FY24, complete FY25
– Joe Harden Lock start FY24, complete FY24
– Willow Island Lock & Dam start FY26, complete FY29
– Marmet Lock & Dam start FY27, complete FY29
– Upper Mississippi Lock 22 start FY30, complete FY30


Initial Interoperability Test Bed PPC Operations Center
Emsworth Lock and Dam PEWARS
Network Expansion PPC Operations Center
Emsworth Lock and Dam PEWARS
Dashields Lock and Dam Montgomery Lock and Dam
Allegany Lock #2 Braddock Lock #2
Elizabeth Lock Charleroi Lock Maxwell Lock
Grays Landing Lock Point Marion Lock

Up to 1Gbps Backbone Radio Link
High Speed 4.9GHz Multipoint Radio Array
Long-Range Metro Wi-Fi Radios
Emsworth Lock and Dam

Interoperability Test Bed
• Quickly add/configure connections
– Sensors
– Cameras
– Test Equipment
– Users
• Test application and system interoperability
• Conduct research and development of emerging technologies
• Develop new technologies for Waterways use

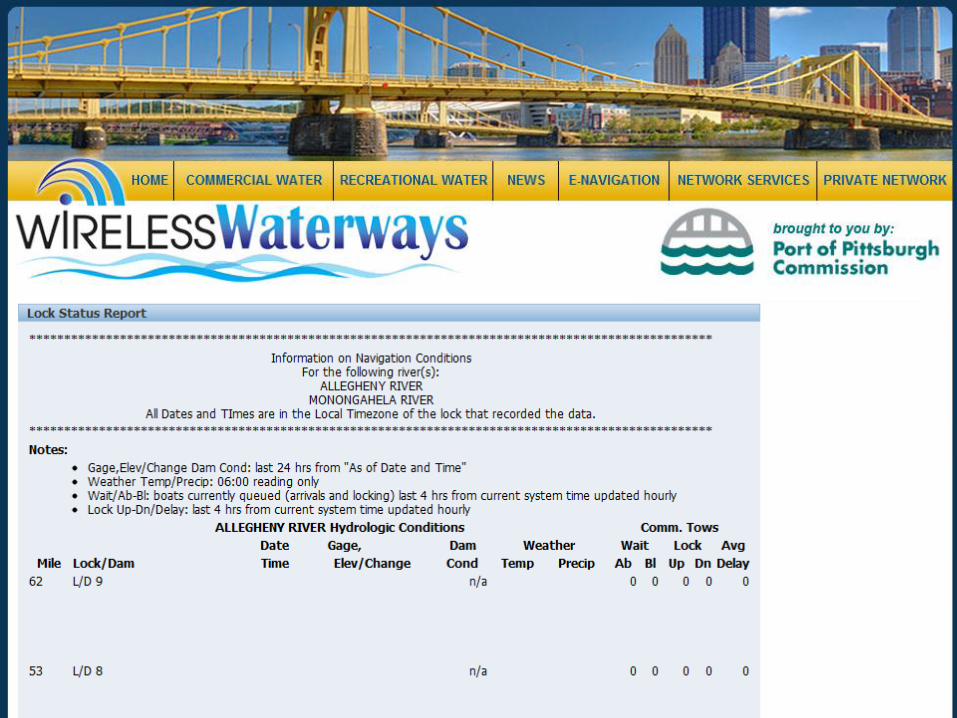
www.wirelesswaterways.com

USACE LOMA Access


Thanks
Questions?

XML – Standard Data Protocol
SSL – Integrity, Authenticity
DGPS – Real-time position data
WiFi – Multiple Uses
ENC – Navigation Uses
SmartLock Architecture • well-tested technologies • multiple uses • convergence

Transporting freight
by water is also the most
energy-efficient choice.
Barges can move one ton of
cargo 576 miles per gallon of
fuel. A rail car would move the
same ton of cargo 413 miles,
and a truck only 155 miles
Advantages of Inland Waterways Transport:
Moving Freight Efficiently Throughout America
Ton-miles Traveled per Gallon of Fuel
576
413
155

Advantages of Inland Waterways Transport:
The Greener Way to Go
• Inland barges produce less
carbon dioxide while
moving America’s cargoes
• In terms of CO2 produced
per ton of cargo moved,
inland barges have a
significant advantage over
trains and trucks.
Tons of CO2 per Million Ton-miles

Advantages of Inland Waterways Transport:
One 15-Barge Tow Equals 216 Rail Cars or 1,050 Trucks
One 15-Barge Tow
216 Rail Cars + 6 Locomotives
1,050 Large Semi Tractor-Trailers

186.7 198.3220.2
242.1
280.6304.6
337.1370.6
387.8411.2 412.6 399
382352.6
267.7
209.4
130.8
57.7
0
50
100
150
200
250
300
350
400
450
19
92
19
93
19
94
19
95
19
96
19
97
19
98
19
99
20
00
20
01
20
02
20
03
20
04
20
05
20
06
20
07
20
08
20
09
Inland Waterways Trust Fund Year-End Balances 1992 - 2009

ANSWER: A NATION THAT DOES NOT INVEST IN PROJECTS THAT CREATE WEALTH?
1/25/2012 TRB Policy Session: Inland Waterway Issues

ANSWER: A NATION THAT DOES NOT INVEST IN PROJECTS THAT CREATE WEALTH?
Question: What is it a third world country? Why would we want to go there?
1/25/2012 TRB Policy Session: Inland Waterway Issues