Welcome to Teaching + Learning Tuesdays
43
Welcome to Teaching + Learning Tuesdays January 16, 2018 2:30PM Please adjust your audio using the Audio Setup option under the Meeting menu.
Transcript of Welcome to Teaching + Learning Tuesdays

Welcome toTeaching + Learning Tuesdays
January 16, 2018
2:30PM
Please adjust your audio using the Audio Setup option under the Meeting menu.

2018 State of the Division
Academic and Student Affairs DivisionSC Technical College System
January 16, 2018

Meet the Division - Administrators
Dr. Hope Rivers
Executive Vice President
Dr. Stephanie Frazier
Associate Vice President, Curriculum & Instruction
Dr. Eric Brown
Associate Vice President, Student Affairs
Dr. Aimeé Carter
Director of Academic Partnerships

Meet the Division - Staff
Rosline Sumpter
Curriculum & Research
Coordinator
Salandra Bowman
Special Projects & Compliance Coordinator
Erin York
Teaching and Learning
Coordinator
Maria Butkus
Research and Planning Administrator
Betty Dixon
Administrative Coordinator

Meet the Division – Part-time Staff
Kimberly BurkettProgram Assistant
Jamie BoykinProgram Assistant
Steph LouisProgram Assistant, Graduate Student
NiAsia HazeltonProgram Assistant, Graduate Student
Chuck MaynardProgram Assistant,SC Rider Education

Presentation Overview
Data Highlights
Looking Back: 2017 in Review
Looking Ahead: 2018 at a Glance
Questions

Data Highlights
System Office can provide different types of data and system reporting that is available to support institutional research at every college
Data available include student-level demographics, enrollment, coursework and grades, programs and degrees, completions and placement, and financial aid information
Data can be accessed through the use of EDSS reports, TWEB Dashboards, Ad hoc requests, and research projects
The next slides will present five- and ten-year trends of fall enrollment, online learning, graduates and awards, and placement

2008 2009 2010 2011 2012 2013 2014 2015 2016 2017
ENROLLMENT 84,270 94,434 97,420 98,318 97,584 95,744 91,726 86,315 82,770 81,227
FTE 54,033 62,504 64,592 64,221 63,456 61,888 59,241 55,405 52,933 51,891
0
20,000
40,000
60,000
80,000
100,000
120,000
Data Highlights – Fall EnrollmentChart 1. Fall Enrollment and FTE Trends Across 10 Years
Degree-Seeking Enrollment
Continuing 44,332
First-time Freshman 16,989
First-time Transfer 5,729
Readmit 2,330
TOTAL 69,380
Non-Degree Seeking Enrollment
First-time Freshman 380
First-time Transfer 142
Continuing 200
High School Student taking College Course
10,053
Readmit 32
Special 450
Transient 590
TOTAL 11,847

69.1% 68.4% 66.9% 65.4% 63.9%
21.7% 22.1% 22.7% 23.7% 24.5%
6.8% 6.6% 7.6% 7.9% 8.3%
2.5% 2.9% 2.8% 3.0% 3.4%
2013 2014 2015 2016 2017
Data Highlights – Fall EnrollmentChart 2. Degree-Seeking Fall Enrollment Trend by Registration Status
Continuing First-time, Freshman First-time, Transfer Readmit

White, 56.8%African-American, 29.0%
Hispanic, 5.9%
Other, 8.4%
Data Highlights – Fall EnrollmentChart 3. Fall 2017 Enrollment by Race/Ethnicity
Data Highlights - Enrollment

135,845130,934
124,917
117,485112,233
61,999
63,00062,716
66,19866,541
59,000
60,000
61,000
62,000
63,000
64,000
65,000
66,000
67,000
0
20,000
40,000
60,000
80,000
100,000
120,000
140,000
160,000
AY 2012 AY 2013 AY 2014 AY 2015 AY 2016
Data Highlights – Distance EducationChart 4. Academic Year 2016-2017 Total Enrollment vs. Total Distance Education Enrollment
(Students enrolled in at least one distance education course)
TOTAL ENROLLMENT DISTANCE EDUCATION ENROLLMENT

TRAN
STEM
MKT
MFG
LAW
IT
HUS
HOS
HEA
GEN
FIN
EDU
BUS
ARTS
ARCH
AGR
Data Highlights – CompletionsChart 5. Percent of Graduate Awards by Cluster, Academic Year 2016-2017
N = 16,965
26.7%
14.9%
2.4%
1.0%
0.8%
1.4%
1.4%8.2%
2.0%
2.9%
26.2%
1.6%
1.6%
5.0%
3.3%
0.6%

34 14 81
930
347 227
2,441
3,736
130 230 159
338
113 39 45 16 91 125 83
273
9 53
1,662
558
56 30
488
190
1,663
24
317 140
-
500
1,000
1,500
2,000
2,500
3,000
3,500
4,000
AGR ARCH ARTS BUS EDU FIN GEN HEA HOS HUS IT LAW MFG MKT STEM TRAN
Data Highlights - GraduatesChart 5. Graduates by Cluster and Gender, Academic Year 2016-2017
N = 14,642
Female Male

2011-2012 2012-2013 2013-2014 2014-2015 2015-2016
Total Placed 14,542 14,434 14,805 14,378 15,048
Available Graduate Awards 16,919 16,772 16,880 16,554 16,960
13,000
13,500
14,000
14,500
15,000
15,500
16,000
16,500
17,000
17,500
Data Highlights - Graduate Placement RatesChart 6. Five-Year Trend of Graduate Placement Rates, 2011-2016
89%
87%88%86%86%

Looking Back: 2017 in ReviewLooking Back: 2017 in Review

2017 Presentations and Publications
EMT Accelerator Summit
Carolinas Energy Workforce Consortium
HOSA Student Leadership Conference
Association for the Study of Higher Education (ASHE)
SAS Southeastern Users Group
American Educational Studies Association (AESA)

2017 Division Achievements and Awards
Salandra Bowman and Rosline Sumpter – Top 40 Under 40 American Association of Women in the Community College (AAWCC)
Erin York – 30 Under 30 SC American Association of Women in the Community College (SCAAWCC)
Rosline Sumpter – SCTEA Employee of the Year, Staff
Aimeé Carter – SCTCS Leadership Academy participant
Stephanie Frazier – Leadership Columbia graduate

Placement Testing
Next Generation ACCUPLACER
January 2019 – Transition Date

Policy Related Updates
Department of Homeland Security rescinds the Deferred Action for Childhood Arrivals Act (DACA)
Department of Justice & Department of Education withdraws guidance on bathroom policy for transgender students

Student Life Peer Group Highlights
Admissions
Professional development for admissions recruiters and one-stop representatives
Guidance Counselor Institutes
Career Services
Frontloading Career Services
COL course integration
Counseling & Services for Students with Disabilities
TypeFocus professional development
Registrar
Parchment and electronic transcript submission
Student Life
Student Leadership Conference 2017
Enhancing student engagement initiatives

Student Affairs Highlights
Virtual Drive-In• Pregnancy & Parenting Webinar• Title IX Coordinators Meeting
Not Anymore Year 2
Student Leadership Conference
Phi Theta Kappa All State Academic Team Ceremony
Student – Community Involvement Project (SCIP)
Student Affairs InstituteNew CSSO Orientation
Policy & Procedure Reviews• Pregnant students• Service animals
• Student complaints
2015 - 2017 Biennial Report
AY 2018-2020 Targeting Plan
MOA Coordinators Conference
Title IXProfessional Development
& Technical AssistanceStudent Engagement Methods of Administration

2017 Events
2017 Events

Student Affairs Institute

Faculty Institute @ SCETV
Strengthening the Core
The Exquisite Corpse
Meet Generation Z
Hybrid Flexible Pedagogy
Effective Annotation Practices
Instructional Materials from the Institute available on T-Web under Professional Development

Additional Compliance
NC-SARA (National Council for State Authorization for Reciprocity Agreements)
In 2017, nine SCTCS colleges participated
Web Accessibility 2016-2017 Report Summary available
College estimated spending $1,000 to $158,000 on expenditures for software, assistive technology, services, and personnel.

2017 Curriculum Highlights
59 new certificates 74 new courses
8 new degrees
New Model: Baking and Pastry Arts
Hosted Curriculum Training
Peer Group Support

2017 Teaching and Learning Tuesday (TLT)
Month Topic # Registered # Attended % Attended
January 2017 State of the Division 46 21 45.7%
February 2017 Data Usage in the SCTCS 54 37 68.5%
March 2017 Open Educational Resources 82 42 51.2%
April 2017 Oh the Places We Can Go: Community Colleges Today 38 18 47.4%
May 2017 Generational Differences on Campus 49 33 67.3%
June 2017 Student Activities in the Community College Setting 57 27 47.4%
August 2017 Bridging the Gap: Transition Services for Students with Disabilities 38 16 42.1%
September 2017 Legal Issues Update 34 10 29.4%
October 2017 Beyond Student Engagement: A Unique Perspective on the First Year Experience 91 42 46.2%
November 2017 A Clear Path to a Degree for Every Student - The University of Hawaii’s Journey 24 11 45.8%
Total 513 257 50.1%

SC Rider Education
Awarded grant from the SC Department of Public Safety (DPS)
Hosted the Motorcycle Safety Foundation (MSF) for Quality Assurance Specialist training
Implemented monthly coaches newsletter
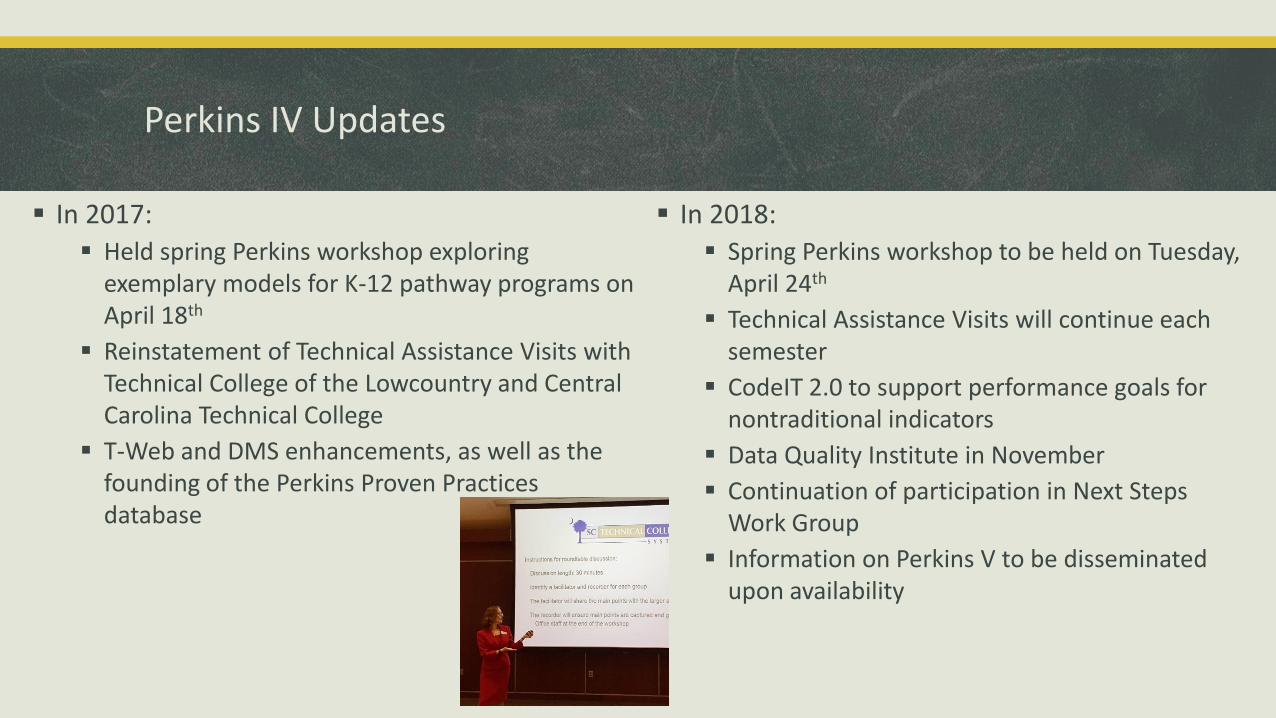
Perkins IV Updates
In 2017:
Held spring Perkins workshop exploring exemplary models for K-12 pathway programs on April 18th
Reinstatement of Technical Assistance Visits with Technical College of the Lowcountry and Central Carolina Technical College
T-Web and DMS enhancements, as well as the founding of the Perkins Proven Practices database
In 2018:
Spring Perkins workshop to be held on Tuesday, April 24th
Technical Assistance Visits will continue each semester
CodeIT 2.0 to support performance goals for nontraditional indicators
Data Quality Institute in November
Continuation of participation in Next Steps Work Group
Information on Perkins V to be disseminated upon availability

Academic Partnerships 2017 Progress
• 10 active system-wide with 11 engaged and developing partners
• Standardized agreement development and review process Grow system-wide agreements
• Launched Academic Partnerships Training Series
• Engaged students, colleagues, and partners at Transfer Fairs
• Developed Transfer & Articulation system-wide contact list
• Collaborated with Partners and Colleges to deliver professional training and student workshops
Support colleges and extend communication within and
beyond the system
• Finalizing revision to system dual enrollment policy and procedures
• Continuous improvement of annual dual enrollment system reporting
• Monitoring NACEP standards Assess policies and practices
for improved outcomes

System-wide Agreements

Developing Partnerships
DEVELOPINGin draft, under review, pending final approval
ENGAGEDidentified interest, request,
and/or letter of intent
• Claflin RN to BSN Program• SC Independent Colleges and
Universities• U of SC Palmetto College• Webster University
• Anderson University• Florida A&M University • Francis Marion University• Lander University• SC State University• The Citadel• Winthrop University

SC Trac & Statewide Partnerships Training
MUSC Pathway Preview Day
Enhancing Partnership, Practice & Purpose

Dual Enrollment2015-2016 Report
Dually enrolled students in
2015-16
10,769
Top transfer courses in
2015-2016
English
Math
PsychologyTop technical
courses in 2015-2016
Allied Health
Welding
Automotive Technology
Dual enrollment courses offered especially for HS students
22% Dual enrollment courses enrolling only HS students were enrolled by Juniors and Seniors
nearly
80%

Looking Ahead: 2018 at a Glance

Institutional Research
Dual Enrollment Research Project – Collaboration with Tri-County and York Technical Colleges Dual Enrollment students compared to Non-Dual Enrollment students across several outcome variables
Presentation of our project at the 2018 SCAIR Conference
Persistence Research Project – Collaboration with Midlands Technical College A comprehensive study of student success across an 8 year period for all first-time freshman and transfer
students
Distance Education Research Project An in-depth look at distance education students across time using literature review to focus on specific
non-traditional student trends
Institutional Research Summit – May 17th – 18th

Academic Partnerships: Looking Ahead
Continue to obtain transfer agreements
Continue development of external partnerships
Increase visibility of Academic Partnerships and its resources by:
a) continued training series
b) transfer fair presence
c) up-to-date, accessible online information
d) quarterly newsletter
Provide additional professional development training via 1 day sessions annually

Student Affairs 2018
Student Centered Initiatives
Title IX Professional Development Training
Disability Accommodations professional development
training
Student Affairs Institute

Digital Badging & Social Media
Credly Digital Badging Certified –Dr. Stephanie Frazier, Salandra Bowman, Ni’Asia Hazelton, and Erin York
Credly is the official digital badging platform for the System Office
The digital badging pilot for Faculty Institute will roll out Spring 2018
Follow us on social media!
Tweet us at:
Twitter: @SCTCS_FAP
Have a great idea for a blog post? Check out our Wordpress:
sctcsUPDATE.wordpress.com
Email proposals or blog posts to [email protected] or [email protected].

2018 TLT Topics
Teaching with Technology
Distance Education
Student Populations
Institutional Research and Assessment
Trending Issues Roundtable
Legal Issues

Questions?
Upcoming TLT Sessions
February 20, 2018 at 2:30 pm
Technology
March 20, 2018 at 2:30 pm
Distance Education
Want to showcase your expertise? Is there a teaching technique that has been effective in the classroom? Apply to be a TLT presenter!
For more information: www.sctechsystem.edu/tlt

Give us your feedback
• https://www.surveymonkey.com/r/January2018TLT