Welcome to READY Principals Spring 2015 NC Department of Public Instruction Educator Effectiveness...
30
Welcome to READY Principals Spring 2015 NC Department of Public Instruction Educator Effectiveness Division http://ncees.ncdpi.wikispaces.net
-
Upload
hollie-burns -
Category
Documents
-
view
223 -
download
3
Transcript of Welcome to READY Principals Spring 2015 NC Department of Public Instruction Educator Effectiveness...

Welcome toREADY PrincipalsSpring 2015
NC Department of Public Instruction Educator Effectiveness Division
http://ncees.ncdpi.wikispaces.net
Wireless Internet Connection
Network:
Username: Password:

Today is all about
DATA

Agenda for Today
TWCTeacher Working Conditions
UDLUniversal Design for Learning
EVAASEducator Value-Added Assessment System
Sessions
READY Principals 2015Tom TomberlinMarch 10, 2015
Educator Evaluation – Updates and Data
Teacher Evaluation Updates
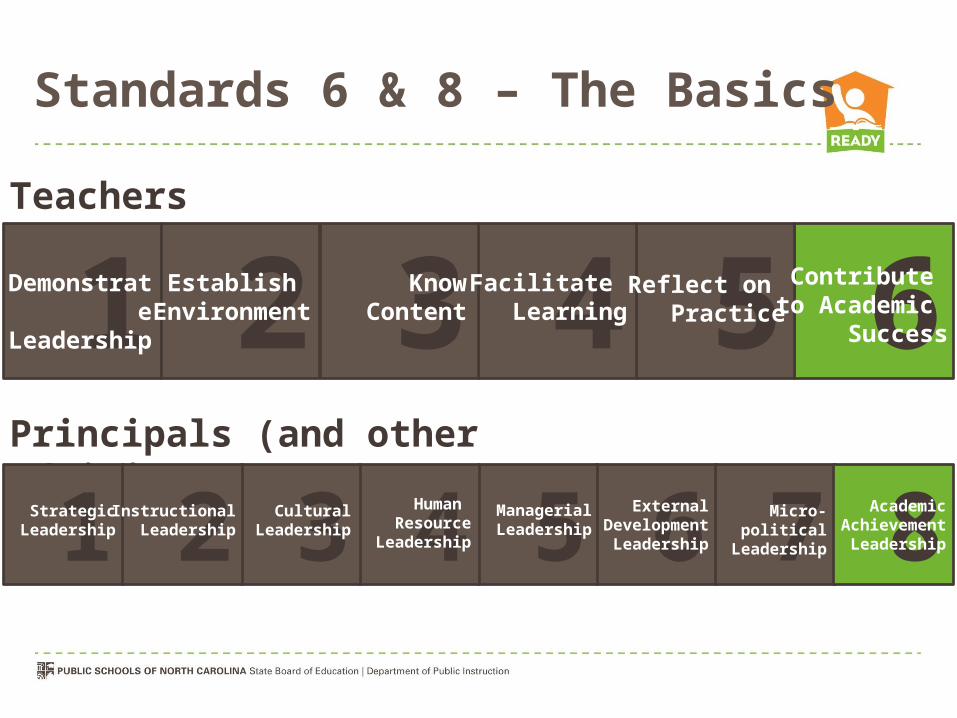
Standards 6 & 8 – The Basics
Teachers
1 65432Demonstrate Leadership
Establish Environment
KnowContent
Facilitate Learning
Reflect on Practice
Contribute to Academic
Success
Principals (and other Administrators)
1 65432 7 8Strategic Leadership
InstructionalLeadership
Cultural Leadership
Human Resource
Leadership
ManagerialLeadership
External Development
Leadership
Micro-political
Leadership
Academic Achievement
Leadership

3-Year Rolling Average Teacher
6 6 Contribute to Academic
Success
Contribute to Academic
Success61.0 + (-2.5) + 1.2
1.0Met Expected Growth
-2.5Did not meet Expected Growth
1.2Met Expected Growth
Rating from 2 years
ago
Rating from 1 year
ago
Rating from this year
Standard Standard Standard3
= -0.3 Met Expected Growth
3- year average rating on standard 6 for
determining status
Note: A similar methodology applies to principals as well.
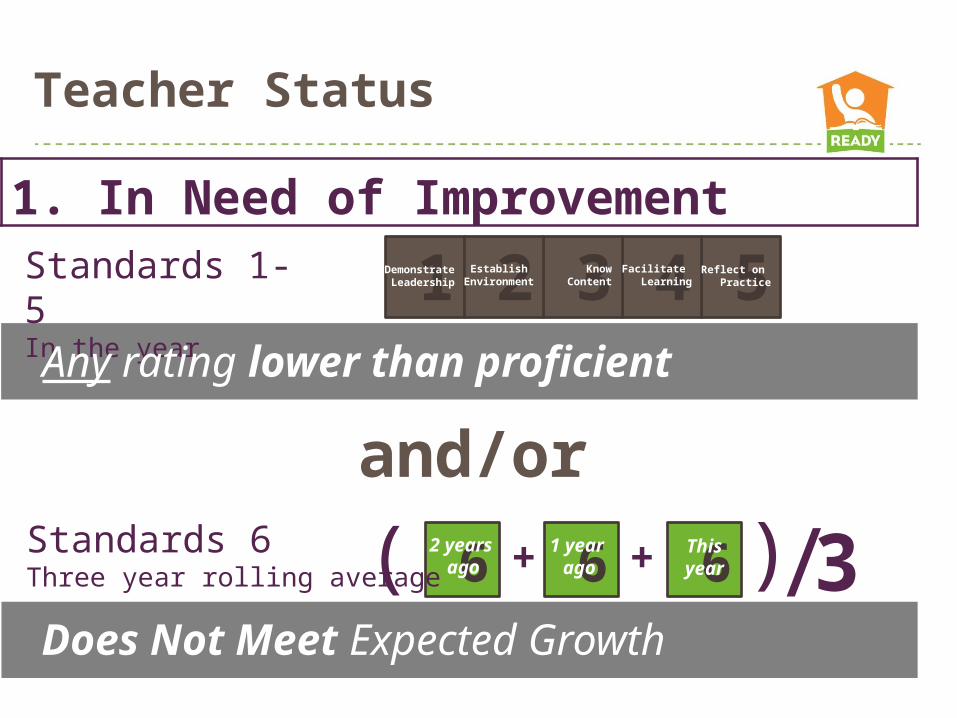
Teacher Status
6 6 62 years
ago1 year
agoThisyear
Standards 1-5In the year
Standards 6Three year rolling average
and/or
Does Not Meet Expected Growth
Any rating lower than proficient
+ + / 3))1. In Need of Improvement
1 5432Demonstrate Leadership
Establish Environment
KnowContent
Facilitate Learning
Reflect on Practice

Teacher Status
Standards 1-5In the year
Standard 6Three year rolling average
and
Meets or Exceeds Expected Growth
Proficient or Higher on Standards 1 - 5
2. Effective
1 5432Demonstrate Leadership
Establish Environment
KnowContent
Facilitate Learning
Reflect on Practice
6 6 62 years
ago1 year
agoThisyear+ + / 3))

Teacher Status
Standards 1-5In the year
Standard 6Three year rolling average
and
Exceeds Expected Growth
Accomplished or Higher on Standards 1 - 5
3. Highly Effective
6 6 62 years
ago1 year
agoThisyear+ + / 3))
1 5432Demonstrate Leadership
Establish Environment
KnowContent
Facilitate Learning
Reflect on Practice
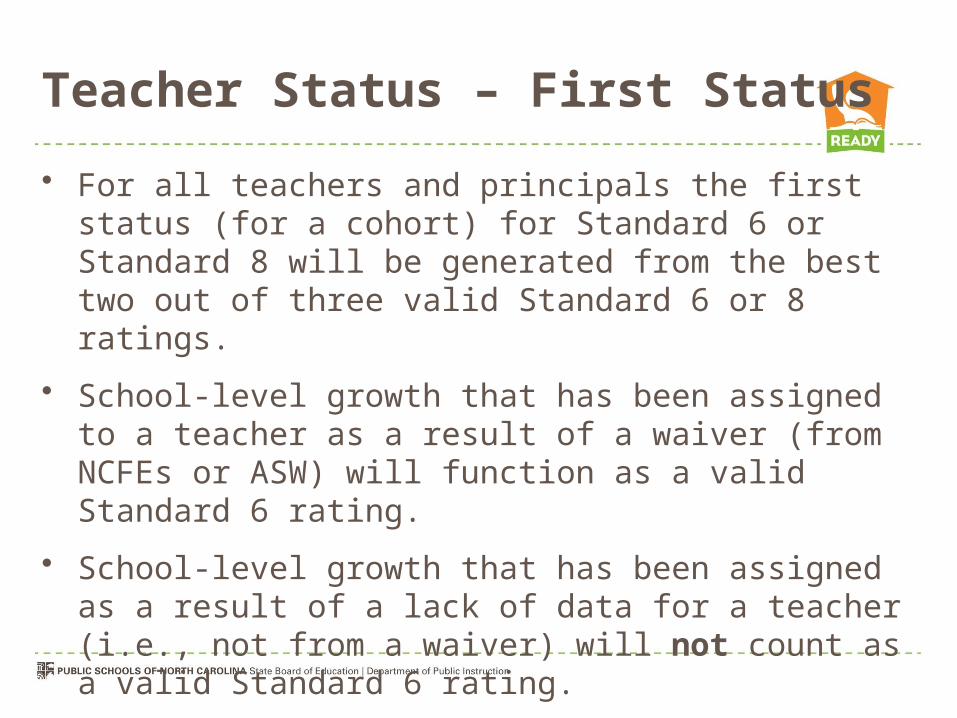
Teacher Status – First Status
• For all teachers and principals the first status (for a cohort) for Standard 6 or Standard 8 will be generated from the best two out of three valid Standard 6 or 8 ratings.
• School-level growth that has been assigned to a teacher as a result of a waiver (from NCFEs or ASW) will function as a valid Standard 6 rating.
• School-level growth that has been assigned as a result of a lack of data for a teacher (i.e., not from a waiver) will not count as a valid Standard 6 rating.

Status Scenarios
6 6 61.0Met Expected Growth
-2.5Did not meet Expected Growth
1.2Met Expected Growth
Rating from 2012-13
Rating from 2013-14
Rating from 2014-15
• Teacher has individual-level data for three years.
• Standard 6 from the 2013-14 school year is the lowest of the three ratings.
• Teacher’s Standard 6 status is 1.1 – “Meets Expected Growth”.
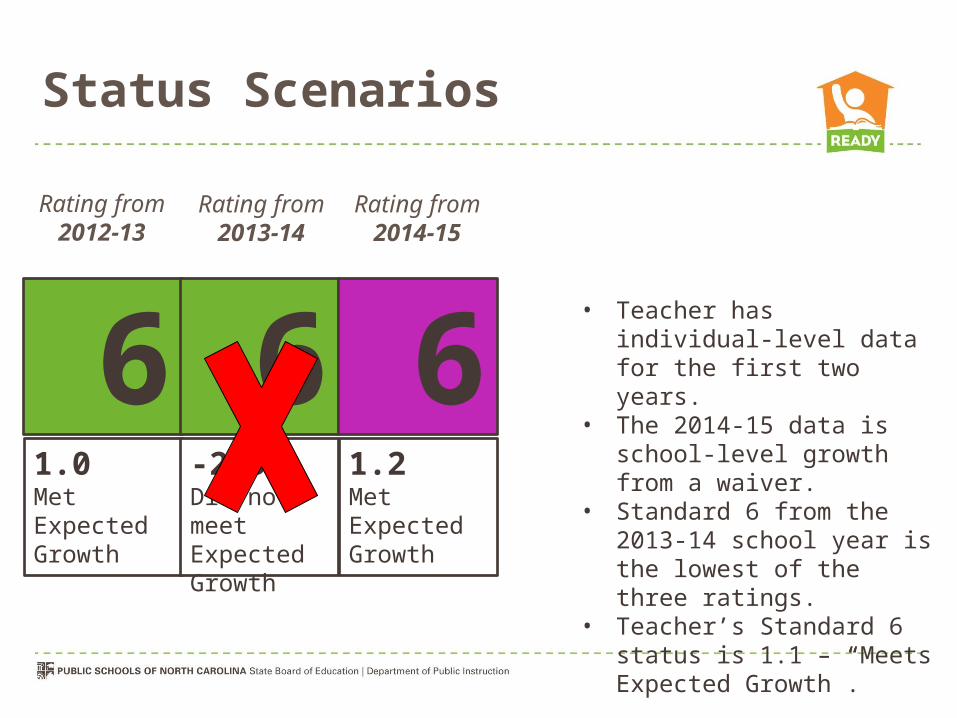
Status Scenarios
6 6 61.0Met Expected Growth
-2.5Did not meet Expected Growth
1.2Met Expected Growth
Rating from 2012-13
Rating from 2013-14
Rating from 2014-15
• Teacher has individual-level data for the first two years.
• The 2014-15 data is school-level growth from a waiver.
• Standard 6 from the 2013-14 school year is the lowest of the three ratings.
• Teacher’s Standard 6 status is 1.1 – “Meets Expected Growth”.
Status Scenarios
6 6 61.0Met Expected Growth
-2.5Did not meet Expected Growth
1.2Met Expected Growth
Rating from 2012-13
Rating from 2013-14
Rating from 2014-15
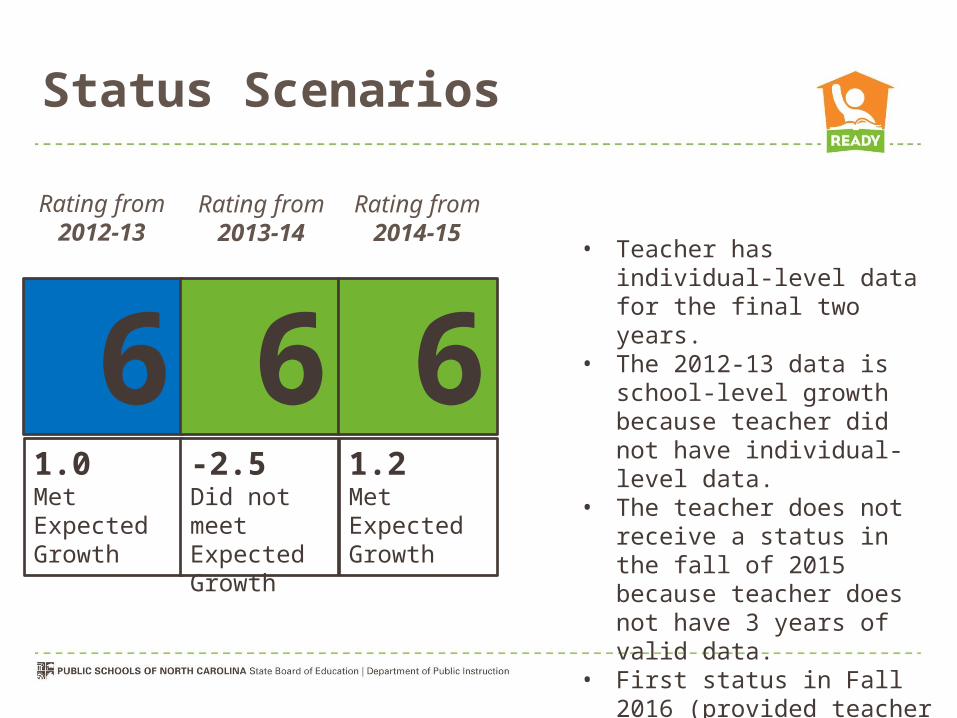
• Teacher has individual-level data for the final two years.
• The 2012-13 data is school-level growth because teacher did not have individual-level data.
• The teacher does not receive a status in the fall of 2015 because teacher does not have 3 years of valid data.
• First status in Fall 2016 (provided teacher has valid data in SY 2015-16).

Status Scenarios – Second Year
6 6 61.0Met Expected Growth
-2.5Did not meet Expected Growth
1.2Met Expected Growth
Rating from 2012-13
Rating from 2013-14
Rating from 2014-15
64.0Exceeded Expected Growth
Rating from 2015-16
• Teacher receives second status in fall of 2016.
• Rating from 2012-13 “rolls off”.
• Rating from 2013-14 returns to the rolling average (even though it was dropped from prior year’s calculation).
• Teacher’s status is “Meets Expected Growth” with an average of 0.9.

Student Growth and Teacher Effectiveness
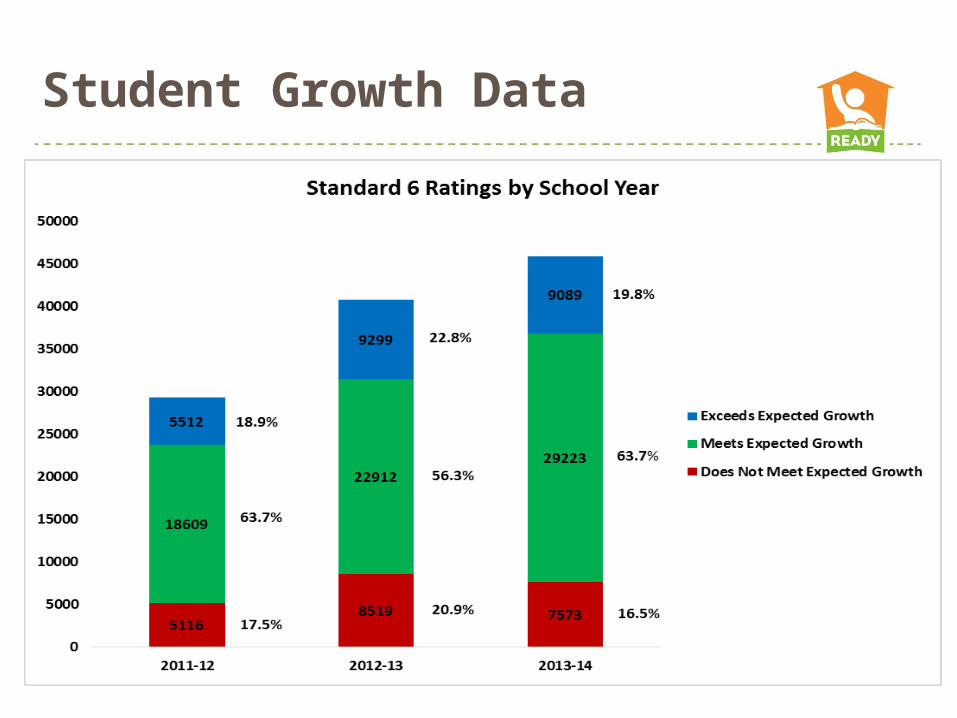
Student Growth Data
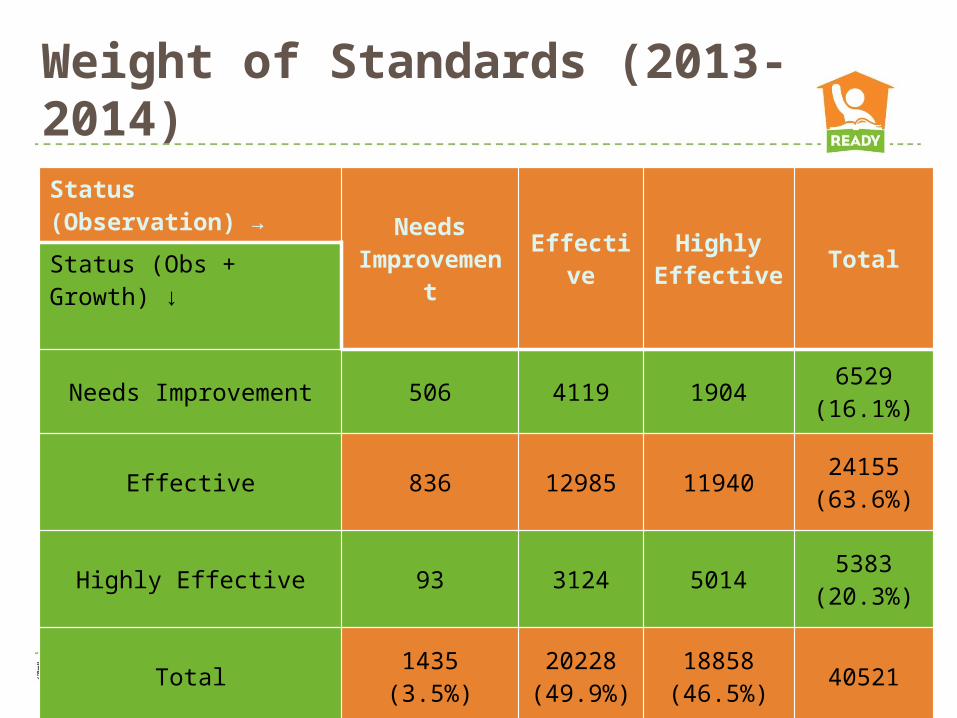
Weight of Standards (2013-2014)Status (Observation) →
Needs Improvement Effective Highly
Effective TotalStatus (Obs + Growth) ↓
Needs Improvement 506 4119 1904 6529(16.1%)
Effective 836 12985 11940 24155(63.6%)
Highly Effective 93 3124 5014 5383(20.3%)
Total 1435(3.5%)
20228(49.9%)
18858(46.5%) 40521

Average Index Score of Teachers

Evaluation and Change in Growth
Teacher Working Conditions and Student Growth
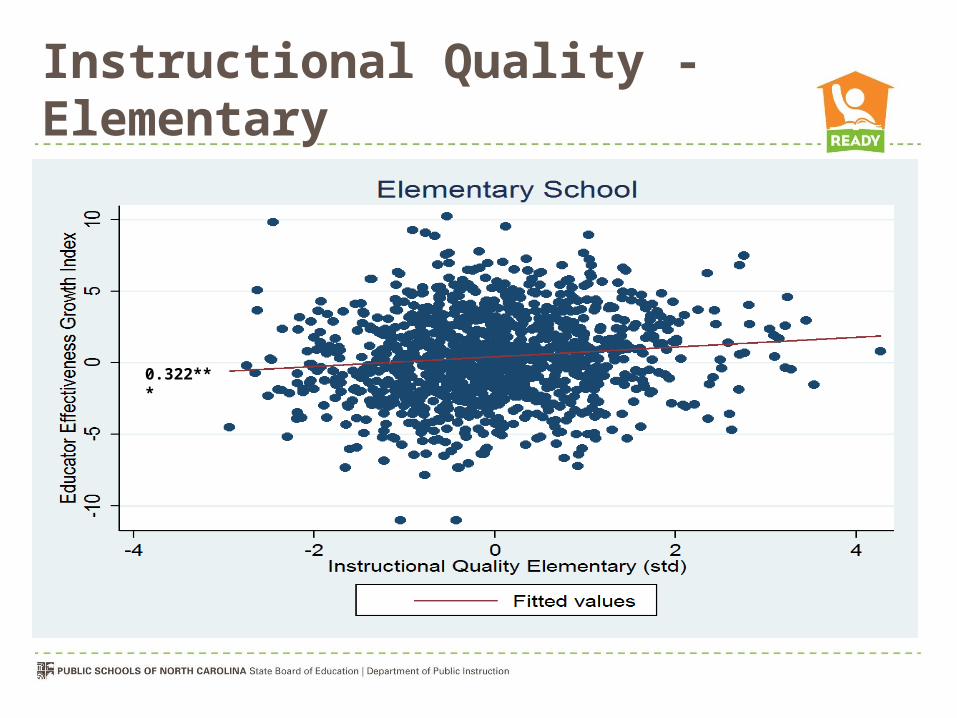
Instructional Quality - Elementary
0.322***

Student Growth by Elementary School Quartiles
• Third Quartile
• Top Quartile
• Second Quartile
• Bottom Quartile
-0.201 0.472
0.6110.799

Instructional Quality - Middle
1.613***

Student Growth by Middle School Quartiles
• Third Quartile
• Top Quartile
• Second Quartile
• Bottom Quartile
-1.623 -0.409
1.4372.794
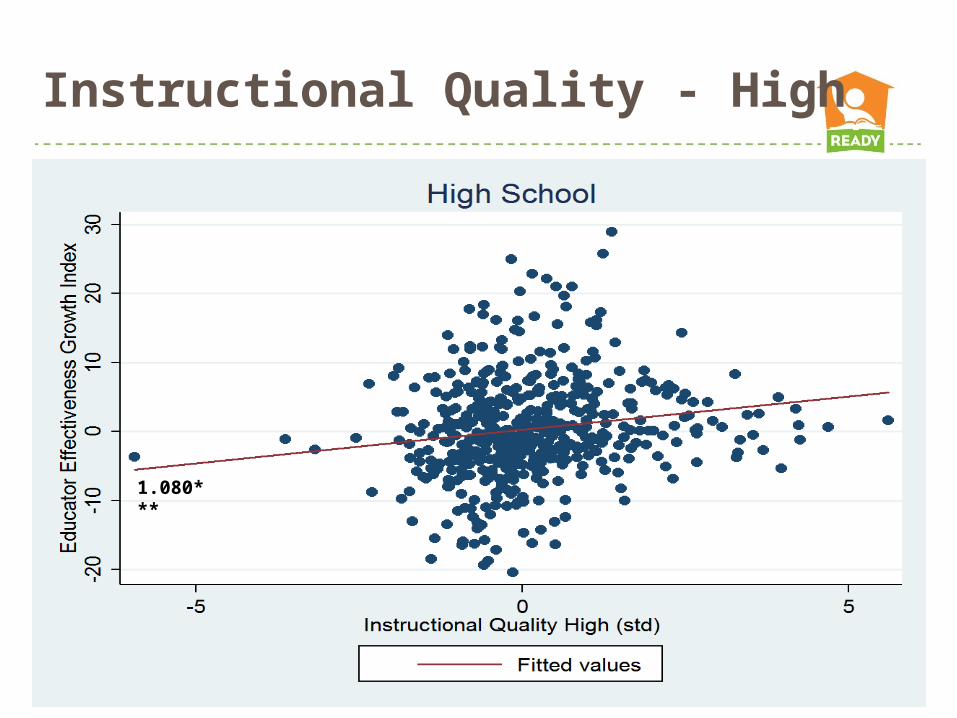
Instructional Quality - High
1.080***

Student Growth by HighSchool Quartiles
• Third Quartile
• Top Quartile
• Second Quartile
• Bottom Quartile
-1.549 -0.750
1.0232.768

Questions or Comments
Thomas Tomberlin
Paul Marshall (EVAAS)
Jennifer DeNeal (ASW)
919-807-3429

Interactive Group Sessions
Elementary Principals
Middle School Principals
High School Principals
Session #19:45-11:15
EVAASRoom
UDL Room
TWCRoom
Session #212:00-1:30
TWCRoom
EVAASRoom
UDLRoom
Session #31:45-3:15
UDLRoom
TWCRoom
EVAASRoom