Summary from Organic Chemistry Packet: Introduction to organic chemistry.

Welcome to Organic Chemistry II

Erika Bryant, [email protected]

Class Syllabus
3

CHAPTER 12: STRUCTURE DETERMINATION
4
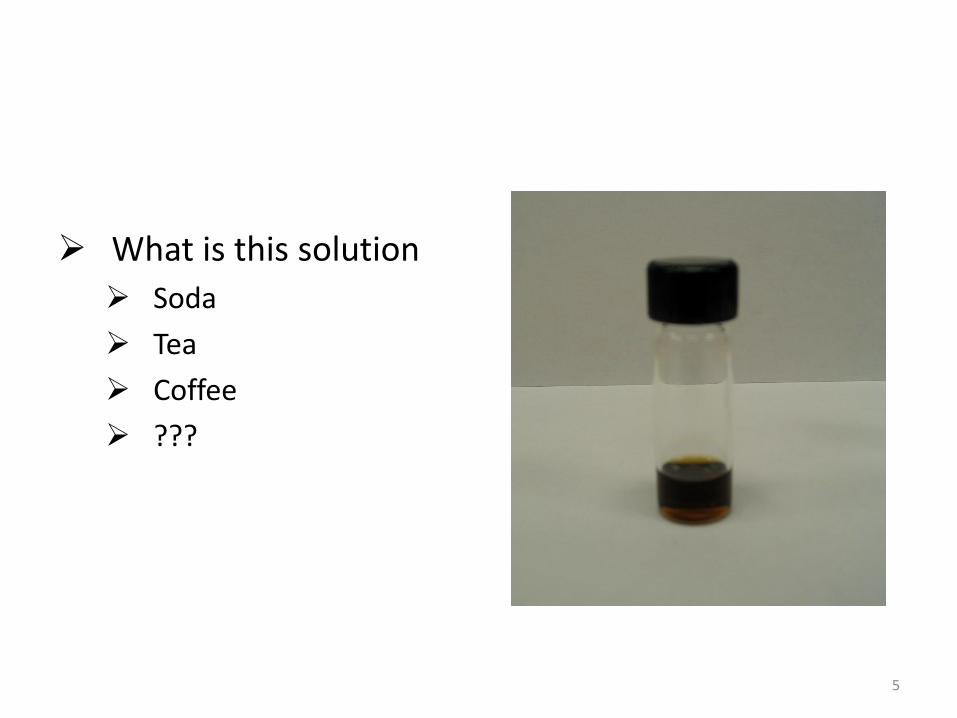
What is this solution
Soda
Tea
Coffee
???
5

• What is this solution– Soda
– Tea
– Coffee
– ???
• What is its size and formula
• What functional groups are present
• What is its carbon-hydrogen framework
• Are conjugate systems present
6

• What is this solution– Soda
– Tea
– Coffee
– ???
• What is its size and formula
• What functional groups are present
• Are conjugate systems present
• What is its chemical structure
Determine using mass
spectrometry
7

What is mass spectrometry
8

Mass Spectrometry
Gives sample an electrical charge
Separates ions by its mass-to-
charge ratio (m/z)
Detects and records separated
ions
9

Mass Spectrometry
Set up for one of the most common mass spectrometers
10

Mass Spectrometry
1. Inject sample
2. Sample is vaporized
3. Gaseous sample bombarded by high-energy electrons
• Energy of electron beam is commonly ~70 eV or 6700 kJ/mol
11
Mass Spectrometry
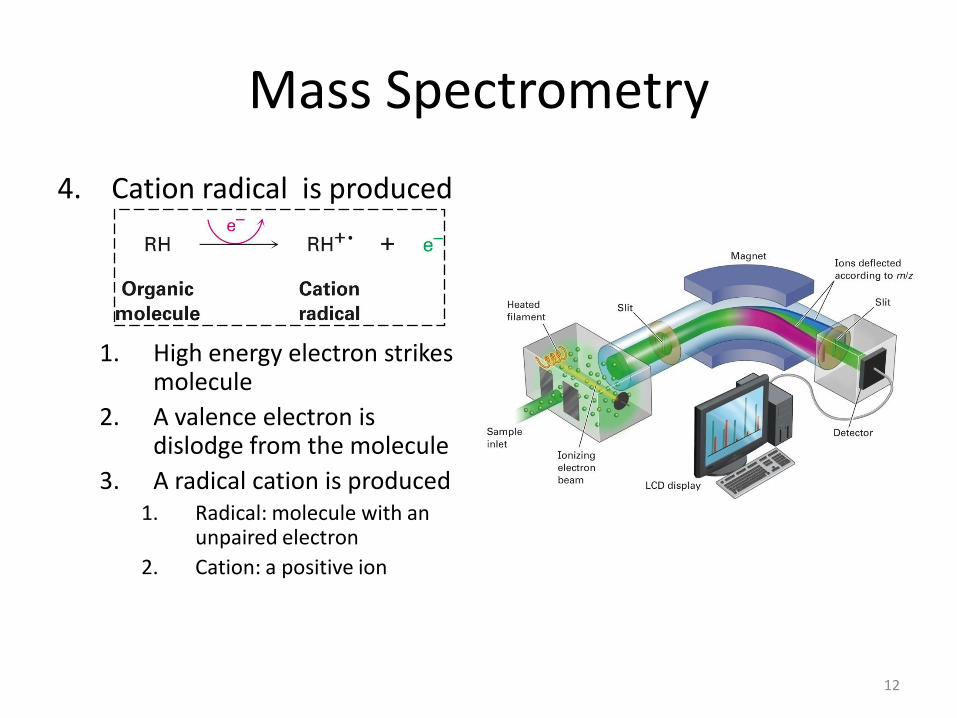
4. Cation radical is produced
1. High energy electron strikes molecule
2. A valence electron is dislodge from the molecule
3. A radical cation is produced1. Radical: molecule with an
unpaired electron
2. Cation: a positive ion
12

Mass Spectrometry
5. Cation radicals fragments due to energy transfer from electron bombardment
• Smaller pieces are cations and neutral molecules
13

Mass Spectrometry
6. Fragments flow through a curved pipe in a magnetic field
7. Fragments are deflected into different paths according to their m/z
• Neutral charges are not deflected and collide with pipe walls
14

Mass Spectrometry
8. Positively charged fragments are detected
9. Detected results are recorded as peaks at varying m/z ratios
15

Mass Spectrometry
10. m/z value is equal to the fragments mass
• Charge is usually 1
• Up to ~2500 amu can be analyzed by this type of instrument
16

Mass Spectrometry
17

Mass Spectrometry
A common type of mass spectrometerQuadrupole mass analyzer
http://www.murr.missouri.edu/images/ac_quadrpl.gif 18
Bars parallel to the ion beam

Mass Spectrometry
•Oscillating electrostatic field is generated between bars
•For a given field, only one m/z value will make it through the charge region
http://www.murr.missouri.edu/images/ac_quadrpl.gif 19
Bars parallel to the ion beam

• Magnetic-sector mass spectrometer and quadrupole mass analyzer have a similar resolution– Mass spectrometry can easily distinguish between molecular weights
within ones place
• High resolution spectrometry can distinguish between molecules within 0.0005 amu (as with specific isotopic compositions)– Double-focusing mass spectrometers: has two magnetic sections
• Example MW “72” is ambiguous: C5H12 and C4H8O but:– C5H12 72.0939 amu exact mass C4H8O 72.0575 amu exact mass
– Result from fractional mass differences of atoms 16O = 15.99491, 12C = 12.0000, 1H = 1.00783
Mass Spectrometry
20

Mass spectrometry
• Mass spectrometry may be used to
– Measure mass
– Determine molecular weight
– Gain structural information
– Determine the identity of an unknown substance
• By molecular fingerprinting
• Each organic compound fragments in a unique way
21

Interpreting Mass Spectra
22
Mass Spectrometry Results
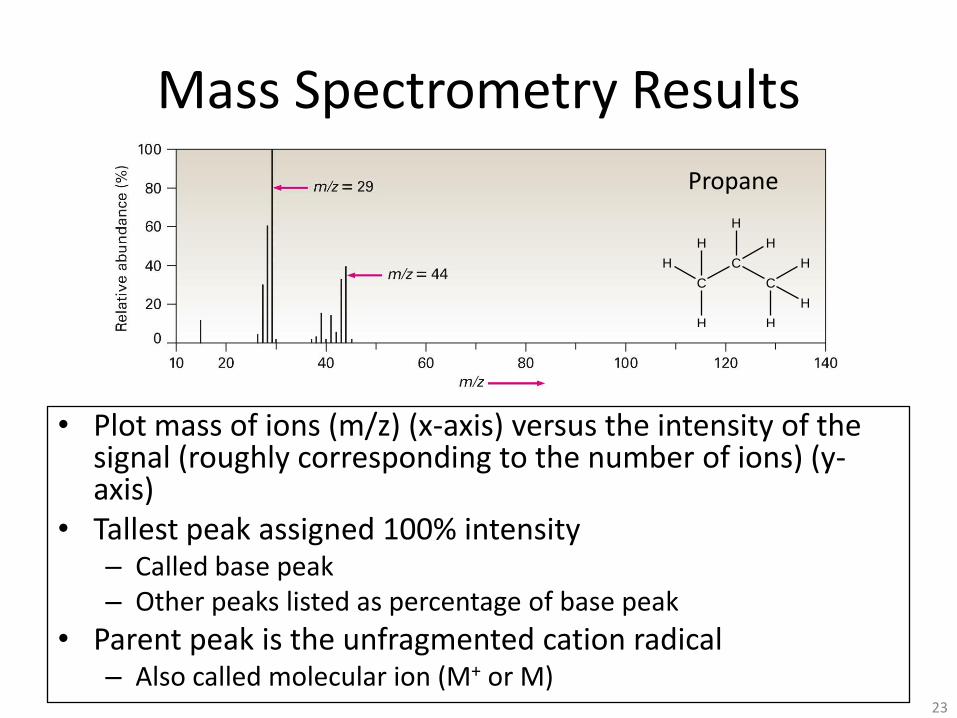
• Plot mass of ions (m/z) (x-axis) versus the intensity of the signal (roughly corresponding to the number of ions) (y-axis)
• Tallest peak assigned 100% intensity– Called base peak– Other peaks listed as percentage of base peak
• Parent peak is the unfragmented cation radical– Also called molecular ion (M+ or M)
23
Propane
C
C
C
HH
H
H
H
H
H
H

Mass Spectrometry
• Not all compounds shows a molecular ion– 2,2-dimethylpropane fragments easily and no molecular
ion is observed– If parent ion not present due to electron bombardment,
“softer” methods such as chemical ionization are used– (M+1) from 13C that is randomly present
24
2,2-dimethylpropane

How do you determine what fragmentation occurs
25

• Fragmentation occurs by spontaneous cleavage of chemical bond– One fragment retains the positive charge (charge
remains on more stable fragment)
– Other fragment is its neutral radical
Interpreting Mass-Spectral Fragmentation Patterns
26

• The way molecular ions break down can produce characteristic fragments that help in identification
– Serves as a “fingerprint” for comparison with known materials in analysis (used in forensics)
– Positive charge goes to fragments that best can stabilize it
Interpreting Mass-Spectral Fragmentation Patterns
27

Interpreting Mass-Spectral Fragmentation Patterns
• Difficult to assign structures to fragment ions because fragmentation patterns are complex
• Especially true in hydrocarbons
– Most hydrocarbons fragment in many ways
28

• Hexane (m/z = 86 for parent) has peaks at m/z = 71, 57, 43, 29
Mass Spectral Fragmentation of Hexane
29

Interpreting Mass-Spectral Fragmentation Patterns
• Difficult to assign structures to fragment ions because fragmentation patterns are complex
• Especially true in hydrocarbons
– Most hydrocarbons fragment in many ways
• Mass spectral fragmentations of functional groups can be interpreted to provide structural information
30

Alcohols:
• Alcohols undergo -cleavage (at the bond next to the C-OH) as well as loss of H-OH to give C=C
Mass Spectrometry of Some Common Functional Groups
31

• Amines undergo -cleavage, generating radicals
Nitrogen rule: compounds with an odd number of nitrogen have an odd numbered molecular
weight(Nitrogen is trivalent)
Mass Spectral Cleavage of Amines
32

Mass Spectral Cleavage of Halides
• Elements with two common isotopes give a distinctive appearance
• 35Cl and 37Cl have a 3:1 ratio
– Moleclar ion peaks are M:M + 2 (Figure 12-11)
• 79Br and 81Br have a nearly 1:1 ratio
– Molecular ion peaks are M:M + 2 (Figure 12-12
33

• A C-H that is three atoms away leads to an internal transfer of a proton to the C=O, called the McLafferty rearrangement
• Carbonyl compounds can also undergo cleavage
Fragmentation of Carbonyl Compounds
34

Fragmentation of Carbonyl Compounds
• Most biochemical analyses by MS use:
- Soft ionization methods (produce charges with little framentation
- Electrospray ionization (ESI)
- Matrix-assisted laser desorption ionization (MALDI)
- Linked to a time-of-flight mass analyzer
- More sensitive than the magnetic sector alternative
- Separate fragments to an accuracy of 3 ppm
- Biologists use the unit dalton (Da) instead of amu
- 1 dalton = 1 amu35
SPECTROSCOPY AND THE ELECTROMAGNETIC SPECTRUM
36

Spectroscopy and the Electromagnetic Spectrum
• Nondestructive spectroscopic techniques
– Infrared (IR)
– Ultraviolet (UV)
– Nuclear magnetic resonance (NMR)
37

Spectroscopy and the Electromagnetic Spectrum
• Nondestructive spectroscopic techniques
– Infrared (IR)
– Ultraviolet (UV)
– Nuclear magnetic resonance (NMR)
What wavelength of electromagnetic radiation do these techniques use?
38

Spectroscopy and the Electromagnetic Spectrum
• Electromagnetic spectrum is divided into regions
• Different types are classified by frequency or wavelength ranges
39

• Radiant energy is proportional to its frequency (cycles/s = Hz) as a wave (Amplitude is its height)
Spectroscopy and the Electromagnetic Spectrum
40

Spectroscopy and the Electromagnetic Spectrum
• Electromagnetic radiation has a dual behavior
– Properties of a particle (called a photon)
– Behaves as an energy wave
• Characterized by a wavelength, frequency and amplitude
41
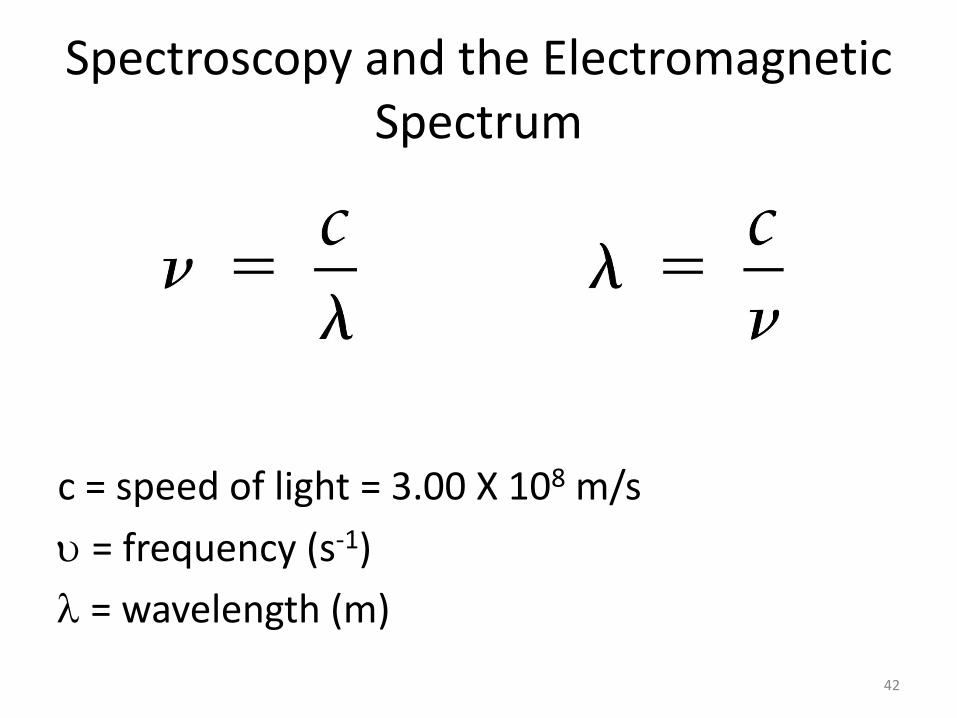
Spectroscopy and the Electromagnetic Spectrum
c = speed of light = 3.00 X 10⁸ m/s
= frequency (s-1)
= wavelength (m)
42

Spectroscopy and the Electromagnetic Spectrum
E= energy
NA = Avogadro’s number = 6.022 1023 number of particles/mol
h = Planck’s constant = 6.62 X 10⁻³⁴ J.s; = frequency (s-1)
c = speed of light = 3.00 X 10⁸ m/s; = wavelength (m)43
Energy of Avogadro’s number of photons of wavelength

Absorption Spectra
• An organic compound exposed to electromagnetic radiation can absorb energy of only certain wavelengths (unit of energy)– Transmits energy of other wavelengths
• Changing wavelengths to determine which are absorbed and which are transmitted produces an absorption spectrum
• Energy absorbed is distributed internally in a distinct and reproducible way
44

Infrared Spectroscopy
• IR region lower energy than visible light (below red – produces heating as with a heat lamp)
• 2.5 106 m to 2.5 105 m region used by organic chemists for structural analysis
45

Infrared Spectroscopy
• IR energy in a spectrum is usually measured as wavenumber (cm-1), the inverse of wavelength and proportional to frequency
• Specific IR absorbed by an organic molecule is related to its structure
46

• IR energy absorption corresponds to specific modes, corresponding to combinations of atomic movements, such as bending and stretching of bonds between groups of atoms called “normal modes”
• Energy is characteristic of the atoms in the group and their bonding
• Corresponds to vibrations and rotations
Infrared Energy Modes
47

• Most functional groups absorb at about the same energy and intensity independent of the molecule they are in
• Characteristic higher energy IR absorptions in Table 12.1 can be used to confirm the existence of the presence of a functional group in a molecule
Interpreting Infrared Spectra
48

• IR spectrum has lower energy region characteristic of molecule as a whole (“fingerprint” region)
• Let’s examine Figure 12-20
Interpreting Infrared Spectra
49

Figure 12.20
50

• 4000-2500 cm-1 N-H, C-H, O-H (stretching)
– 3300-3600 N-H, O-H– 3000 C-H
• 2500-2000 cm-1 CC and • C N (stretching)
• 2000-1500 cm-1 double bonds (stretching)
– C=O 1680-1750– C=C 1640-1680 cm-1
• Below 1500 cm-1
“fingerprint” region
Regions of the Infrared Spectrum
51

• Molecules vibrate and rotate in normal modes, which are combinations of motions (relates to force constants)
• Bond stretching dominates higher energy modes
• Light objects connected to heavy objects vibrate fastest: C–H, N–H, O–H
• For two heavy atoms, stronger bond requires more energy: C C, C N > C=C, C=O, C=N > C–C, C–O, C–N, C–halogen
Differences in Infrared Absorptions
52

Alkanes, Alkenes, Alkynes
• C-H, C-C, C=C, C C have characteristic peaks
– absence helps rule out C=C or C C
Infrared Spectra of Some Common Functional Groups
53

• Weak C–H stretch at 3030 cm1
• Weak absorptions 1660 - 2000 cm1 range
• Medium-intensity absorptions 1450 to 1600 cm1
• See spectrum of phenylacetylene, Figure 12.15
IR: Aromatic Compounds
54

• O–H 3400 to 3650 cm1
– Usually broad and intense
• N–H 3300 to 3500 cm1
– Sharper and less intense than an O–H
IR: Alcohols and Amines
55

• Strong, sharp C=O peak 1670 to 1780 cm1
• Exact absorption characteristic of type of carbonyl compound
– 1730 cm1 in saturated aldehydes
– 1705 cm1 in aldehydes next to double bond or aromatic ring
IR: Carbonyl Compounds
56

• 1715 cm1 in six-membered ring and acyclic ketones
• 1750 cm1 in 5-membered ring ketones
• 1690 cm1 in ketones next to a double bond or an aromatic ring
C=O in Esters• 1735 cm1 in saturated esters
• 1715 cm1 in esters next to aromatic ring or a double bond
C=O in Ketones
57

Let’s Work a Problem
Propose structures for a compound that fits the following data: It is an alcohol with M+ = 88 and fragments at m/z = 73, m/z = 70, and m/z = 59
58

Answer
Answer: We must first decide on the the formula of an alcohol that could undergo this type of fragmentation via mass spectrometry. We know that an alcohol possesses an O atom (MW=16), so that leads us to the formula C5H12O for an alcohol with M+ = 88, with a structure of:
One fragmentation peak at 70 is due to the loss of water, and alpha cleavage can result in m/z of 73 and 59.
59