
Welcome to Miami-Dade County · PDF fileCoastal Community at Sea Level • Total County...
25
Welcome to Miami-Dade County
Transcript of Welcome to Miami-Dade County · PDF fileCoastal Community at Sea Level • Total County...
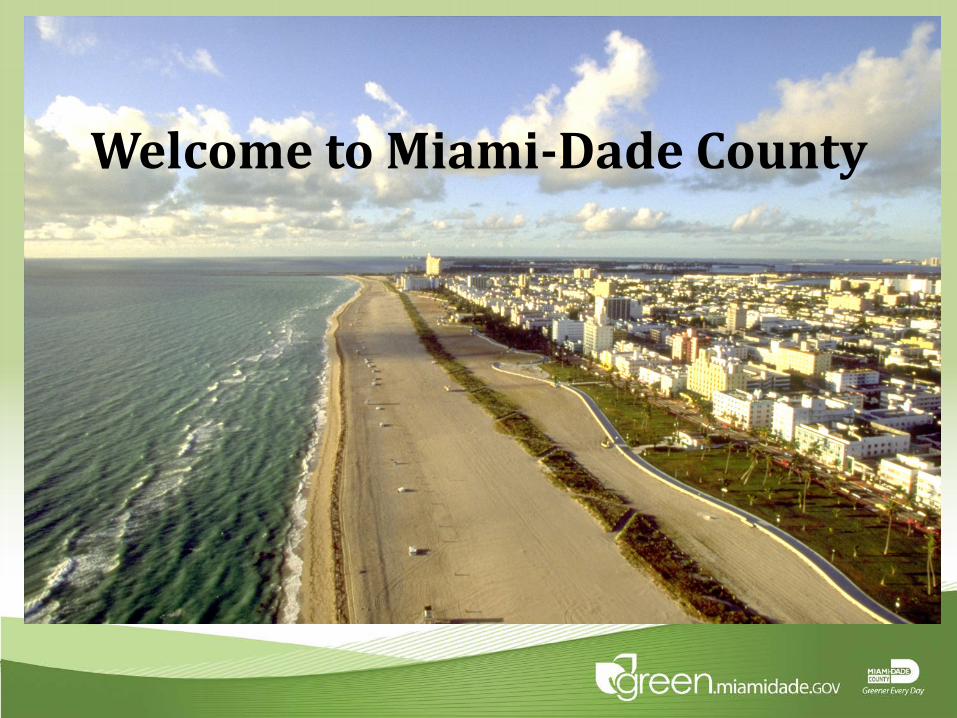
Welcome to Miami-Dade County
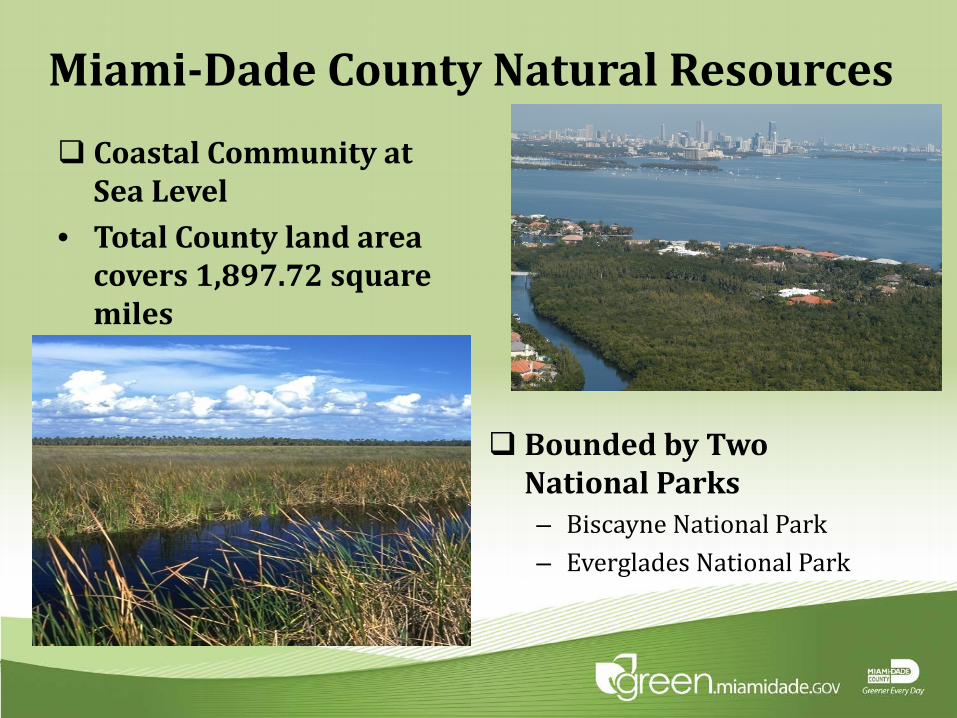
Miami-Dade County Natural Resources Coastal Community at
Sea Level• Total County land area
covers 1,897.72 square miles
Bounded by Two National Parks– Biscayne National Park– Everglades National Park
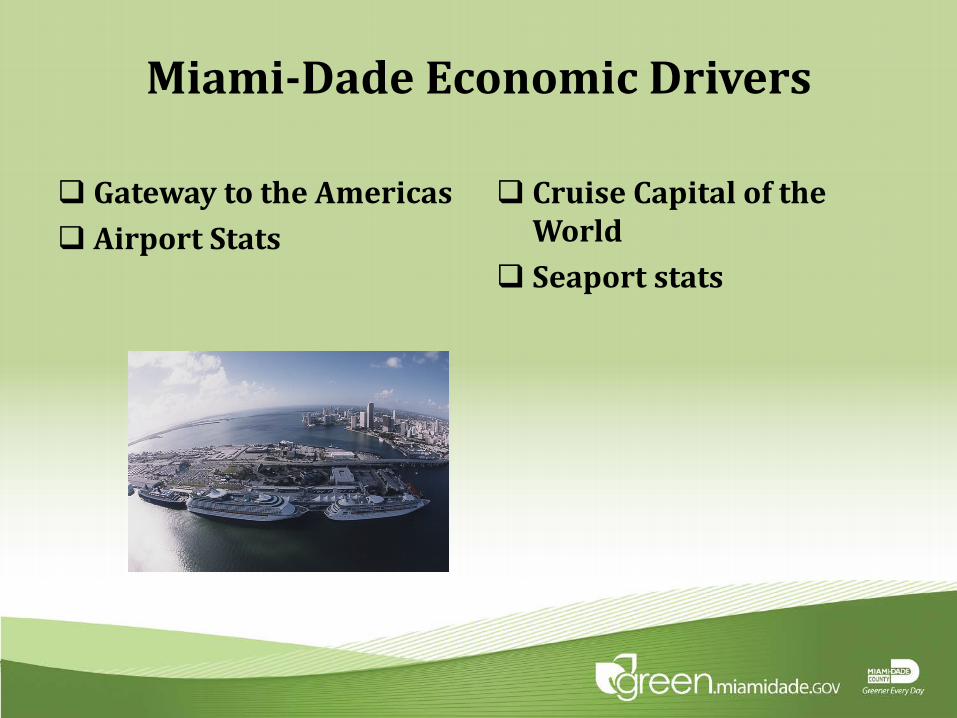
Miami-Dade Economic Drivers
Gateway to the Americas Airport Stats
Cruise Capital of the World
Seaport stats
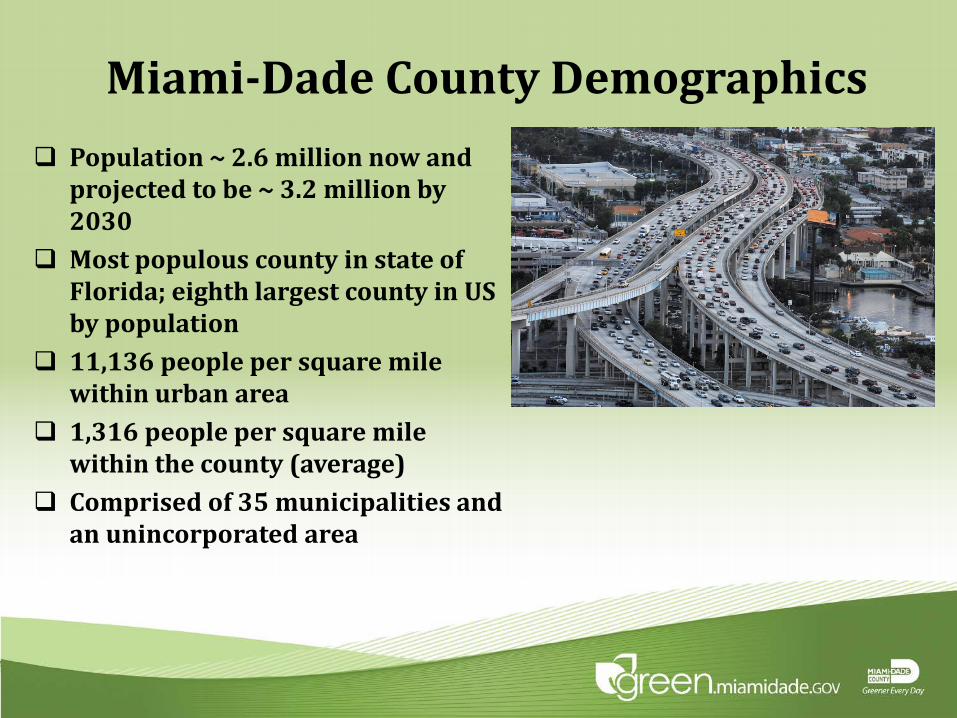
Miami-Dade County Demographics Population ~ 2.6 million now and
projected to be ~ 3.2 million by 2030
Most populous county in state of Florida; eighth largest county in US by population
11,136 people per square mile within urban area
1,316 people per square mile within the county (average)
Comprised of 35 municipalities and an unincorporated area
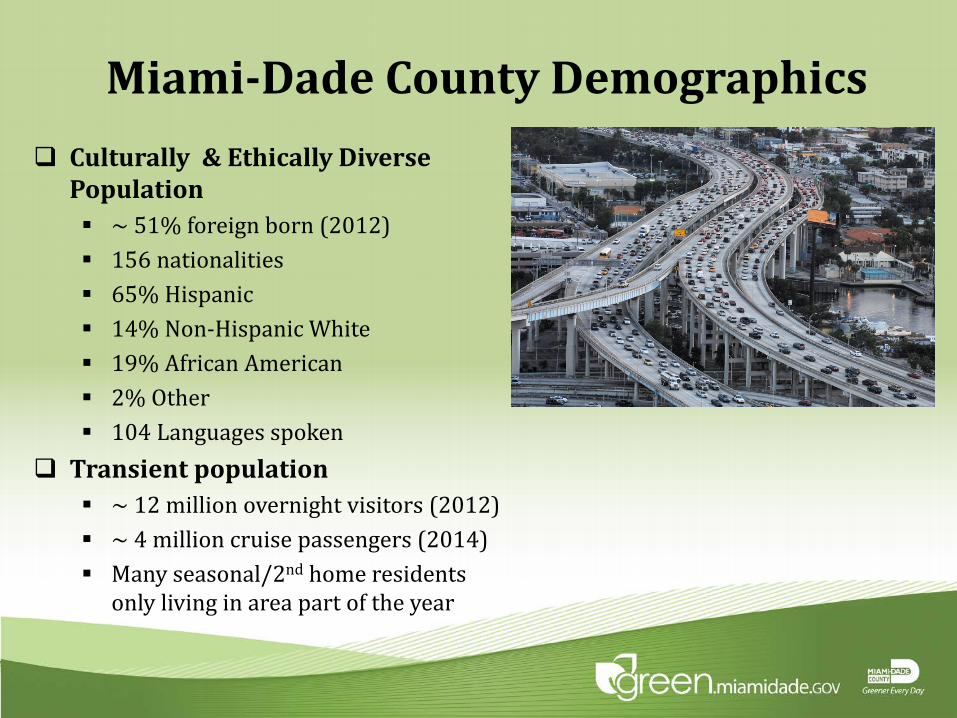
Miami-Dade County Demographics Culturally & Ethically Diverse
Population ~ 51% foreign born (2012) 156 nationalities 65% Hispanic 14% Non-Hispanic White 19% African American 2% Other 104 Languages spoken
Transient population ~ 12 million overnight visitors (2012) ~ 4 million cruise passengers (2014) Many seasonal/2nd home residents
only living in area part of the year

Miami-Dade County Government
Two tiers (levels) of government: City & County The Mayor is the head of the County The Board of County Commissioners One of the most complex form of Government in the USA BCC consists of 13 members elected by districts
4 year terms No term limits
The County’s Budget ~ $6.8 billion in 2014 Labor force ~ 1.1 million

Miami-Dade County Government/DERM
Miami-Dade County
Housing Health

Miami-Dade CountyA History of Environmental Leadership 2000 - Adopt-a-Tree Program = over 184,300 trees 2002 Began Purchasing hybrid vehicles – Currently have 524
electric/gasoline 2007 - Miami-Dade County established a Sustainable Buildings
Program (SBP) for County facilities 2009 - Creation of Office of Sustainability to track climate change,
energy efficiency, smart transportation and solid waste initiatives. 2009 – MDT began operating
Hybrid buses. Currently have 43diesel/electric buses
First in the State to have an enforceable vehicle emissions program .

CONT’D
Water Conservation Programs – over 30 million gallons per day saved since 2007
Single-Stream Recycling Program - 2x amount since 2008; Approximately 1.2 million tons of waste processed annually. 240,000 tons of materials being processed into Biomass
The energy generated from the County’s waste to energy plant is enough to supply the electrical needs of 90,000 homesin MDC
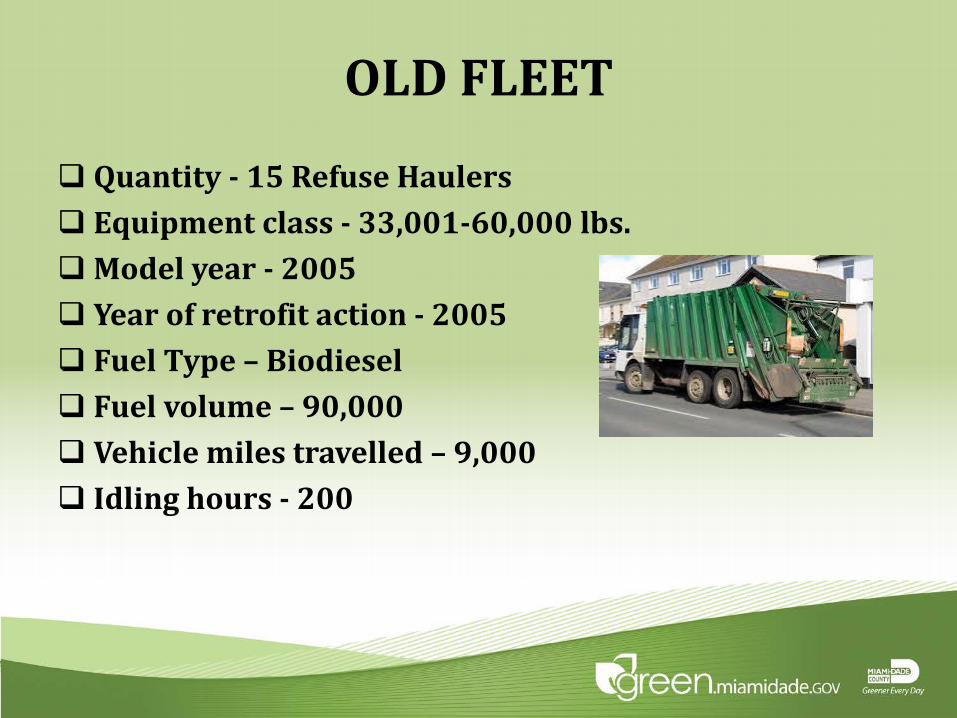
OLD FLEET
Quantity - 15 Refuse Haulers Equipment class - 33,001-60,000 lbs.Model year - 2005 Year of retrofit action - 2005 Fuel Type – Biodiesel Fuel volume – 90,000 Vehicle miles travelled – 9,000 Idling hours - 200

Accumulators
Hydrostatic unitsLubrication and cooling pumps
Power Drive Unit (PDU)
High pressure hydraulic lines
PDU Filter
System Filter PDU Control
Block
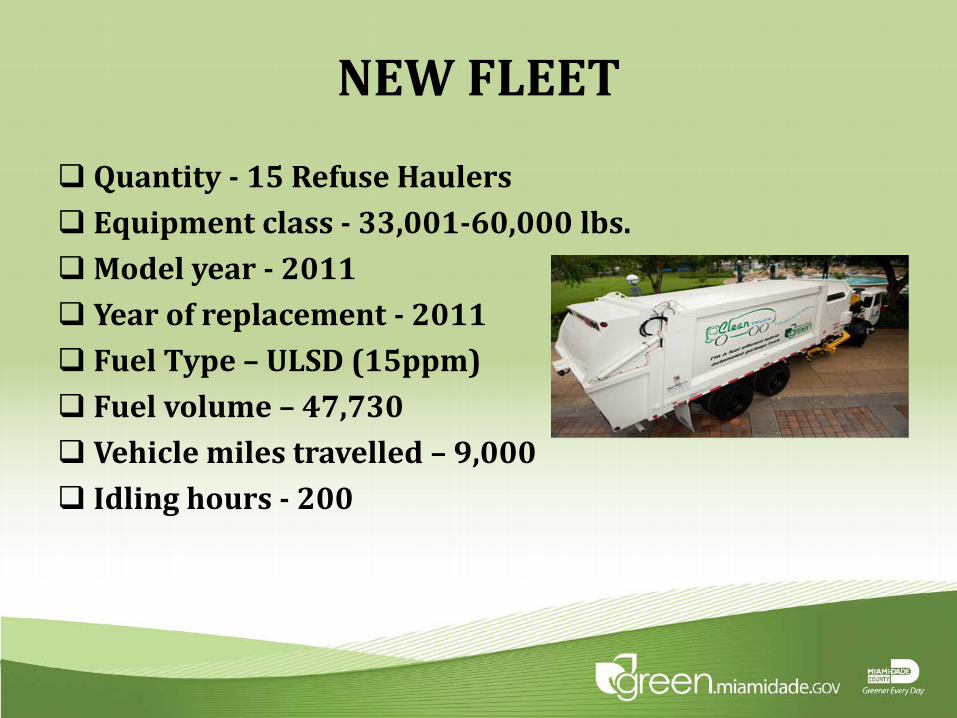
NEW FLEET
Quantity - 15 Refuse Haulers Equipment class - 33,001-60,000 lbs.Model year - 2011 Year of replacement - 2011 Fuel Type – ULSD (15ppm) Fuel volume – 47,730 Vehicle miles travelled – 9,000 Idling hours - 200
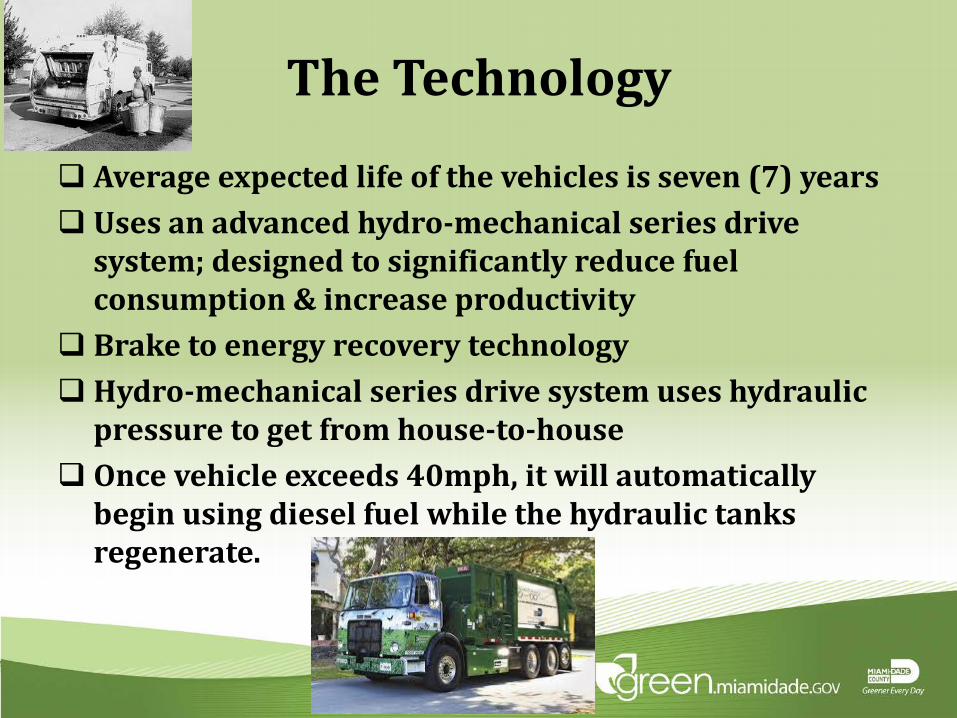
The Technology
Average expected life of the vehicles is seven (7) years Uses an advanced hydro-mechanical series drive
system; designed to significantly reduce fuel consumption & increase productivity
Brake to energy recovery technology Hydro-mechanical series drive system uses hydraulic
pressure to get from house-to-house Once vehicle exceeds 40mph, it will automatically
begin using diesel fuel while the hydraulic tanks regenerate.
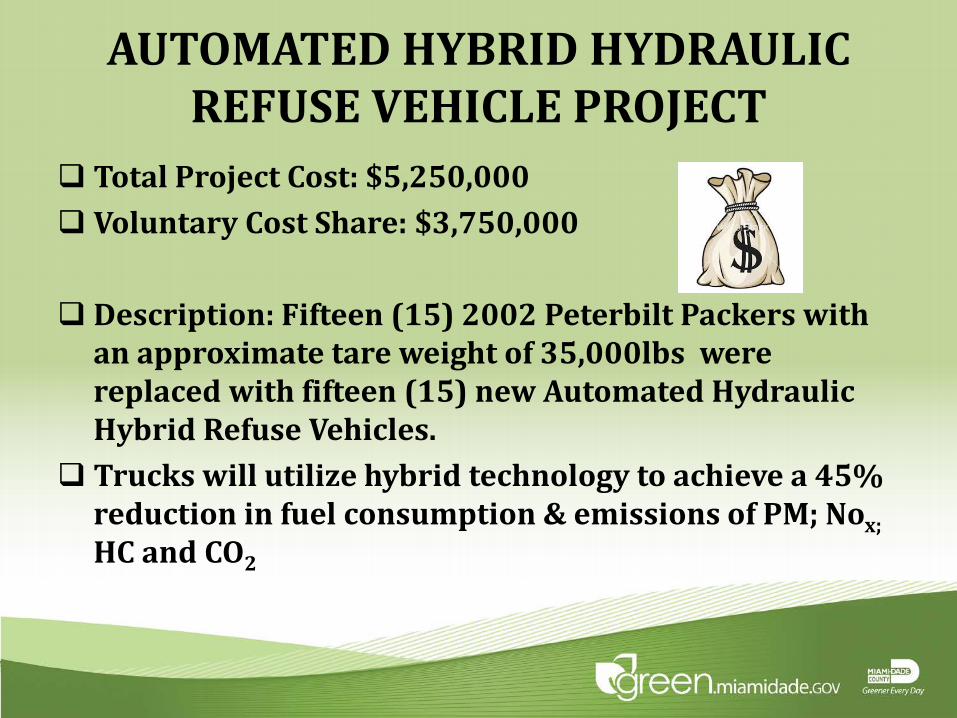
AUTOMATED HYBRID HYDRAULIC REFUSE VEHICLE PROJECT
Total Project Cost: $5,250,000 Voluntary Cost Share: $3,750,000
Description: Fifteen (15) 2002 Peterbilt Packers with an approximate tare weight of 35,000lbs were replaced with fifteen (15) new Automated Hydraulic Hybrid Refuse Vehicles.
Trucks will utilize hybrid technology to achieve a 45% reduction in fuel consumption & emissions of PM; Nox; HC and CO2

PROJECT DESCRIPTION
One of the largest government owned & operated waste collection & disposal system in the SE USA
Recycle services to over 320,000 households in unincorporated MDC & nine (9) municipalities
Helps to alleviate environmental impact on the degrading air quality
Targets routes serving neighborhoods with children at risk, elderly residents, others affected by respiratory illnesses, areas with poor air quality.
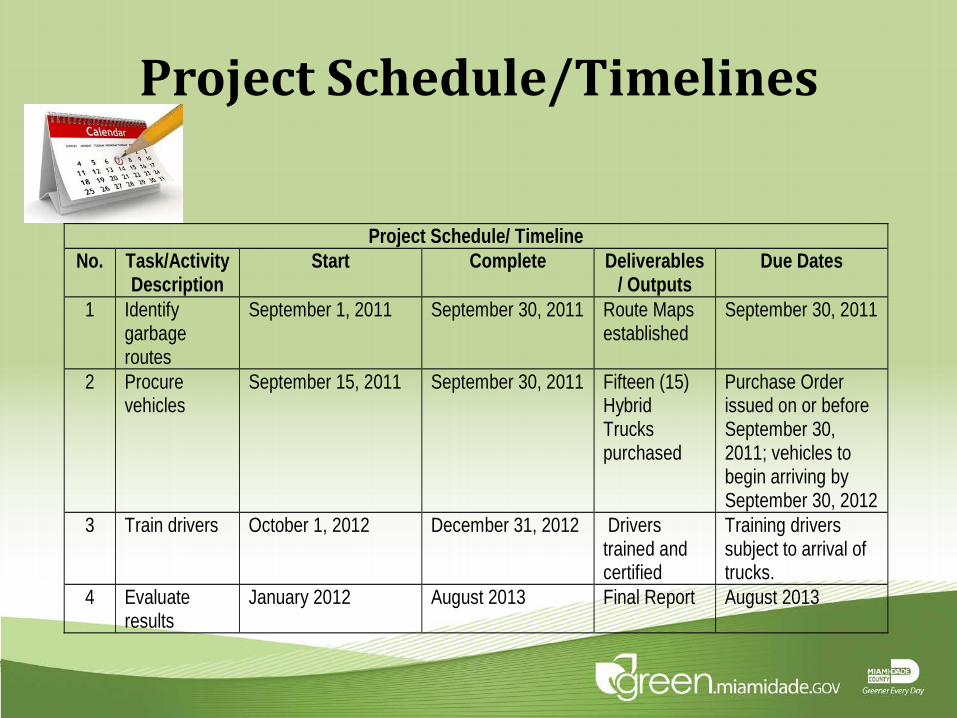
Project Schedule/Timelines
Project Schedule/ Timeline No. Task/Activity
Description Start Complete Deliverables
/ Outputs Due Dates
1 Identify garbage routes
September 1, 2011 September 30, 2011 Route Maps established
September 30, 2011
2 Procure vehicles
September 15, 2011 September 30, 2011 Fifteen (15) Hybrid Trucks purchased
Purchase Order issued on or before September 30, 2011; vehicles to begin arriving by September 30, 2012
3 Train drivers October 1, 2012
December 31, 2012 Drivers trained and certified
Training drivers subject to arrival of trucks.
4 Evaluate results
January 2012 August 2013 Final Report August 2013
COMPARISON DATA
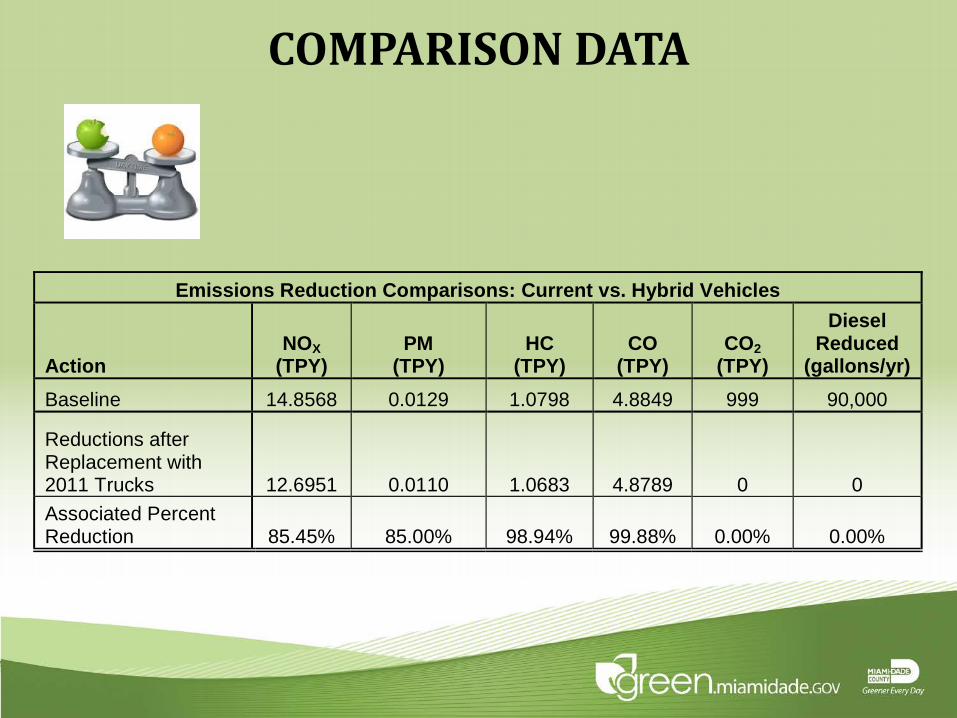
Emissions Reduction Comparisons: Current vs. Hybrid Vehicles
Action NOX
(TPY) PM
(TPY) HC
(TPY) CO
(TPY) CO2
(TPY)
Diesel Reduced
(gallons/yr) Baseline 14.8568 0.0129 1.0798 4.8849 999 90,000
Reductions after Replacement with 2011 Trucks 12.6951 0.0110 1.0683 4.8789 0 0 Associated Percent Reduction 85.45% 85.00% 98.94% 99.88% 0.00% 0.00%
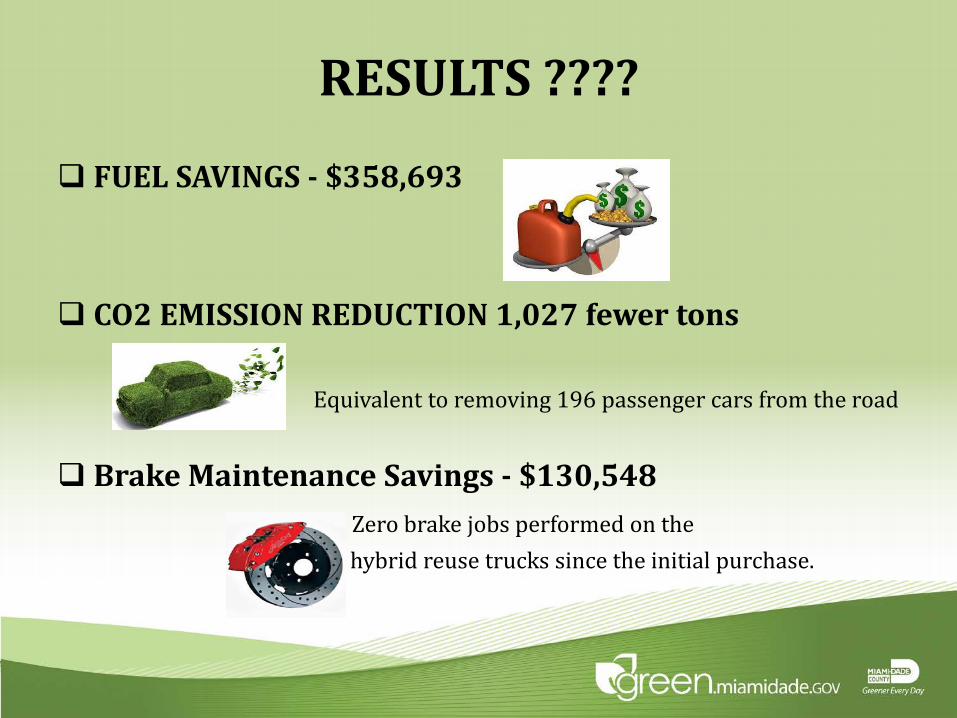
RESULTS ????
FUEL SAVINGS - $358,693
CO2 EMISSION REDUCTION 1,027 fewer tons
» E Equivalent to removing 196 passenger cars from the road
Brake Maintenance Savings - $130,548Zero brake jobs performed on the
» H hybrid reuse trucks since the initial purchase.

ANTICIPATED EMISSION REDUCTIONS
Emissions Reductions Based on Hybrid Vehicle Replacement
Action NOX
(TPY) PM
(TPY) HC
(TPY) CO
(TPY) CO2
(TPY)
Diesel Reduced
(gallons/yr) Reductions after Replacement with 2011 Hybrid Trucks with 45% Increase in Fuel Efficiency 13.3660 0.0116 1.0719 4.8807 310 27,930 Associated Percent Reduction 85.45% 85.00% 98.94% 98.76% 31.03% 31.03%

ACTUAL EMISSIONS SUMMARYNOx NOx
Diesel Equivalent
Diesel Equivalent
(short tons/year)
(short tons/year)
(gallons/year)(gallons/year)
Baseline of Entire Fleet
1.7503 0.6167 0.0451 0.016 0.0676 0.0096 0.3156 0.0504 995.2807 530 89,664.93 47,730
Percent Reduced (%)
0 0 0 85 0 90 0 90 0 0 0 0
Kilograms Reduced Per Day (kg/day)
0 0 0 0.0337 0 0.0214 0 0.1128 0 0 0 0
Baseline of Entire Fleet
50.7596 17,883 1.309 0.4633 1.96 0.2771 9.1525 1.4619 28,863.14 15,364.29 2,600,282.97 1,384,170
Percent Reduced (%)
0 0 0 85 0 90% 0 90 0 0 0 0
Amount Emitted After Retrofit, Entire Fleet
50.7596 17,883 1.309 0.0695 1.96 0.0277 9.1525 0.1462 28,863.14 15,364.29 2,600,282.97 1,384,170
CO (short tons/year)
CO2 (short tons/year)
CO2 (short tons/year)
SummaryP.M. 2.5 (short tons/year)
P.M. 2.5 (short tons/year)
HC (short tons/year)
HC (short tons/year)
CO (short tons/year)

OTHER BENEFITS
Gaining experience with diesel hydraulic hybrid technology
Sending an important message to the community Setting an example that bold steps need to be taken to
conserve our valuable resources Protect the climate, the environment & air quality A more stringent idle reduction policy Human health benefits in the reduction of illnesses,
such as emphysema, asthma and lung cancers Health benefits of $15,000 savings for 0.0110 Tons of
Annual diesel PM reduction
FAQ How much does it cost? We are targeting an ROI of 3 to 4 years over a
standard truckPerformance? Improved 0-25MPH acceleration when baseline
against different trucks with 350Hp engines and standard automatic transmissions
Fuel Saving? For typical 100 foot start-stop operations the fuel
savings are between 30% and 50% over baseline vehicles