Welcome to DNA Subway Classroom-friendly Bioinformatics.
35
Welcome to DNA Subway Classroom-friendly Bioinformatics
-
Upload
bernadette-mcdonald -
Category
Documents
-
view
214 -
download
0
Transcript of Welcome to DNA Subway Classroom-friendly Bioinformatics.
Welcome to DNA Subway
Classroom-friendly Bioinformatics

DNA Subway
Commonly used bioinformatics tools in streamlined workflows
Teach important concepts in biology and bioinformatics
Inquiry-based experiments for novel discovery and publication of data

DNA SubwayRed Line: Genome annotation
Red Line
• Analyze up to 150 KB of DNA sequence
• De novo gene prediction
• Construct evidence-based gene models
• Visualize genome sequence in browser

DNA SubwayYellow Line: Genome prospecting
Yellow Line
• Analyze DNA or protein sequence
• Search plant genomes using TARGeT
• Explore gene duplications, transposons, and non-coding sequences not detectable in conventional BLAST searches
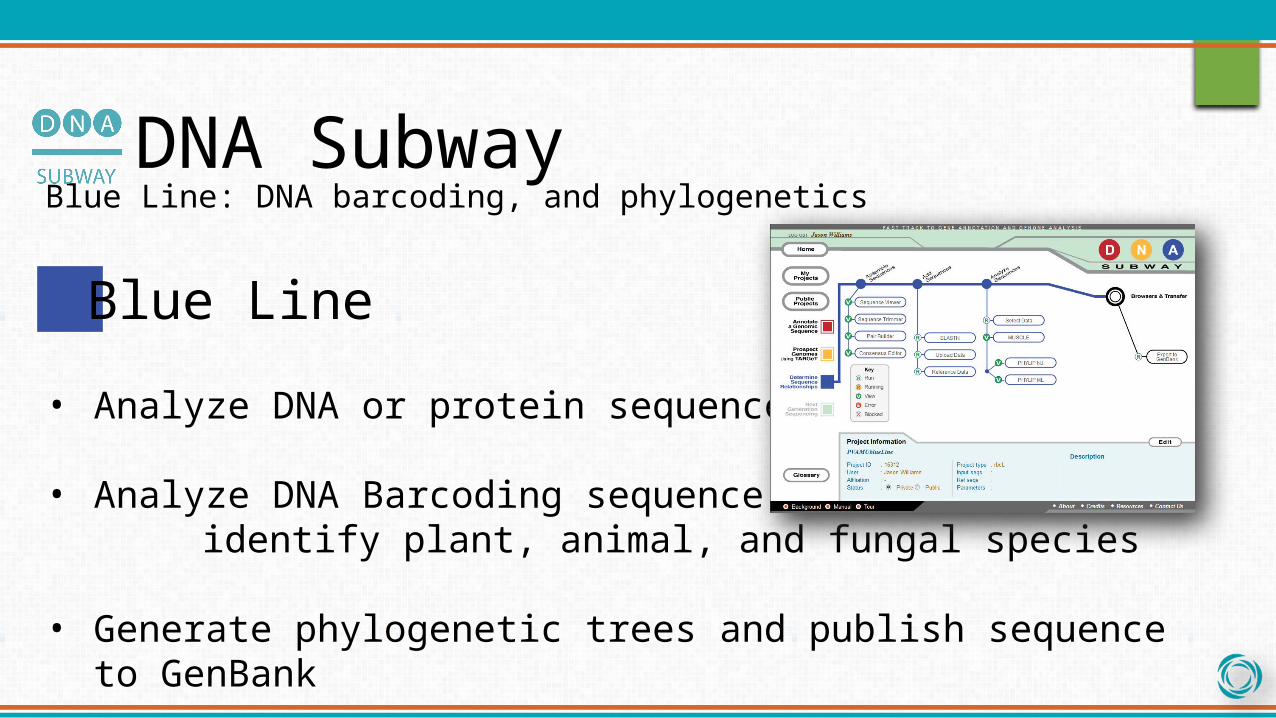
DNA SubwayBlue Line: DNA barcoding, and phylogenetics
Blue Line
• Analyze DNA or protein sequence
• Analyze DNA Barcoding sequence to identify plant, animal, and fungal species
• Generate phylogenetic trees and publish sequence to GenBank

DNA SubwayGreen Line: Transcriptome analysis
Blue Line
• Examine RNA-Seq data for differential expression
• Use High-performance computing to analyze complete datasets
• Generate lists of genes and fold-changes; add results to Red Line projects

Annotate Genome Sequence
Detect Genes and Build Gene Models
DNA Subway: Red Line

DNA SubwayRed Line: Genome annotation
Requires JAVA 6 or above
www.java.comCheck your web browser has java enabled

Log in to DNA Subway

Create a project
Detect all the genes present
Import data from BLAST results and visualize in local browser
Construct a gene model
Verify gene model at Phytozome
Task: Analyze a ~3KB sequence from Chromosome 1 of A.thaliana
DNA SubwayRed Line: Demo analysis – determine a structure for an Arabidopsis gene
Create a Red Line project
DNA SubwayRed Line: Demo analysis – determine a structure for an Arabidopsis gene

DNA SubwayRed Line: Genome annotation
Red Line
1. Click the Red Square to begin a project
2. Choose Plant and select Dicotyledon
3. Select sample sequence Arabidopsis thaliana (mouse-ear cress) Chr1, 3.40kb
4. Name the project and click Continue

Detect genes in the project sequence
DNA SubwayRed Line: Demo analysis – determine a structure for an Arabidopsis gene

DNA Subway
Red Line
5. Click Sequence to view the input sequence
Red Line: Demo analysis – determine a structure for an Arabidopsis gene

DNA Subway
Red Line
6. Click Repeat Masker
7. When View icon ( ) appears; click Repeat Masker again to examine results
Red Line: Demo analysis – determine a structure for an Arabidopsis gene

DNA Subway
Tip: Before gene prediction, RepeatMasker attempts to identify repetitive sequences such as low-complexity, simple repeat, AT/GC-rich, or several types of transposons. Results are presented in a table. The Attributes column describes what type of repeat was detected in the ‘description=‘ field
AT-rich sequence at 1667bps
Red Line: Demo analysis – determine a structure for an Arabidopsis gene
DNA Subway
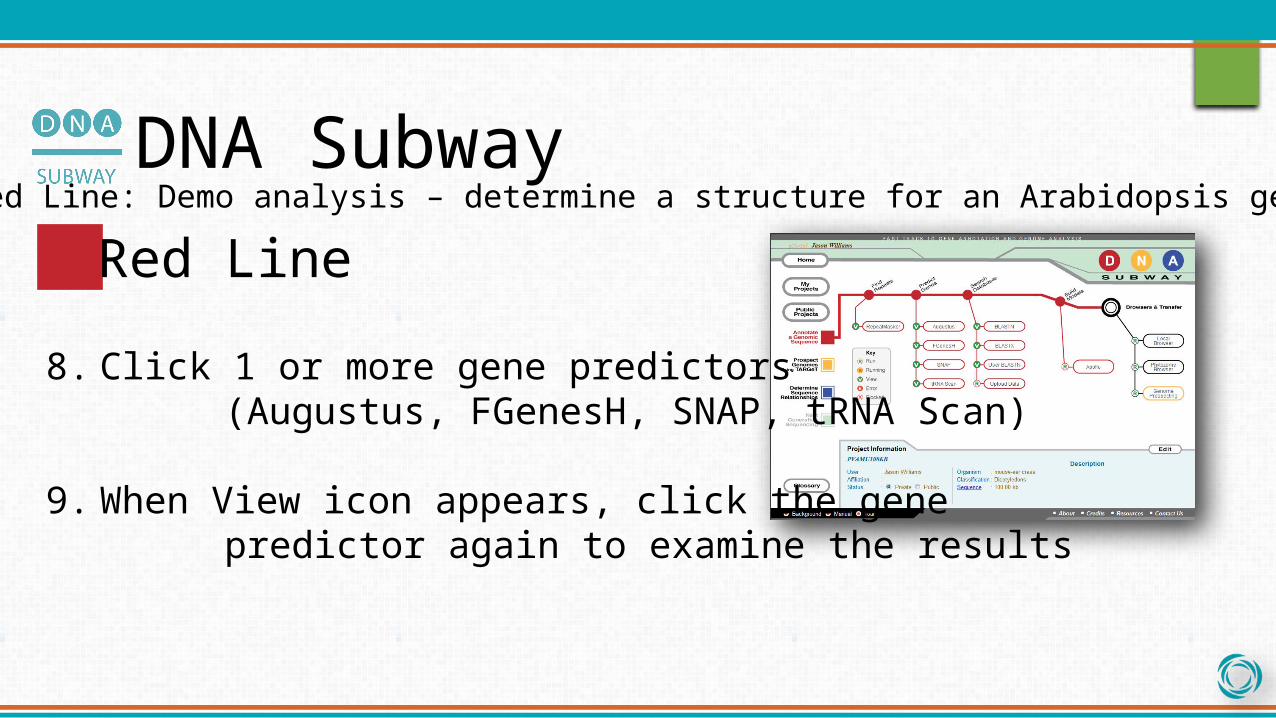
Red Line
8. Click 1 or more gene predictors (Augustus, FGenesH, SNAP, tRNA Scan)
9. When View icon appears, click the gene predictor again to examine the results
Red Line: Demo analysis – determine a structure for an Arabidopsis gene

DNA SubwayTip: de novo gene predictors predict genes within a given sequence. Each program is optimized differently; each program’s results vary. The Attributes column details features that make up a single predicted gene (e.g. the whole gene, mRNA, CDS, and exons). Sub-features are listed in the Type column.
Red Line: Demo analysis – determine a structure for an Arabidopsis gene
Augustus predicts a single gene (designated ‘g1’) with 4 exons

Import data from BLAST results and visualize in local browser
DNA SubwayRed Line: Demo analysis – determine a structure for an Arabidopsis gene

DNA SubwayRed Line: Demo analysis – determine a structure for an Arabidopsis gene
Red Line
10.Click BLASTN to search and import similar DNA sequences
11.Click BLASTX to search and import similar sequences based on protein evidence
12.When the searches complete; click again to examine results

DNA SubwayTip: BLAST results are derived from UNIGENE or UNIPROT databases, and contain experimentally derived evidence (e.g. cDNAs) that can be used to infer a probable gene structure. The Attributes column has details on the sequence matches that were found (e.g. gene name, GenBank IDs, etc.)
Red Line: Demo analysis – determine a structure for an Arabidopsis gene

DNA SubwayRed Line: Demo analysis – determine a structure for an Arabidopsis gene
Red Line
13. Click Local Browser to visualize results

DNA SubwayTip: You can use the local browser (Gbrowse) at any time to visualize the results of any tool’s output.
Red Line: Demo analysis – determine a structure for an Arabidopsis gene

Construct a gene model
DNA SubwayRed Line: Demo analysis – determine a structure for an Arabidopsis gene
DNA SubwayRed Line: Demo analysis – determine a structure for an Arabidopsis gene
Red Line
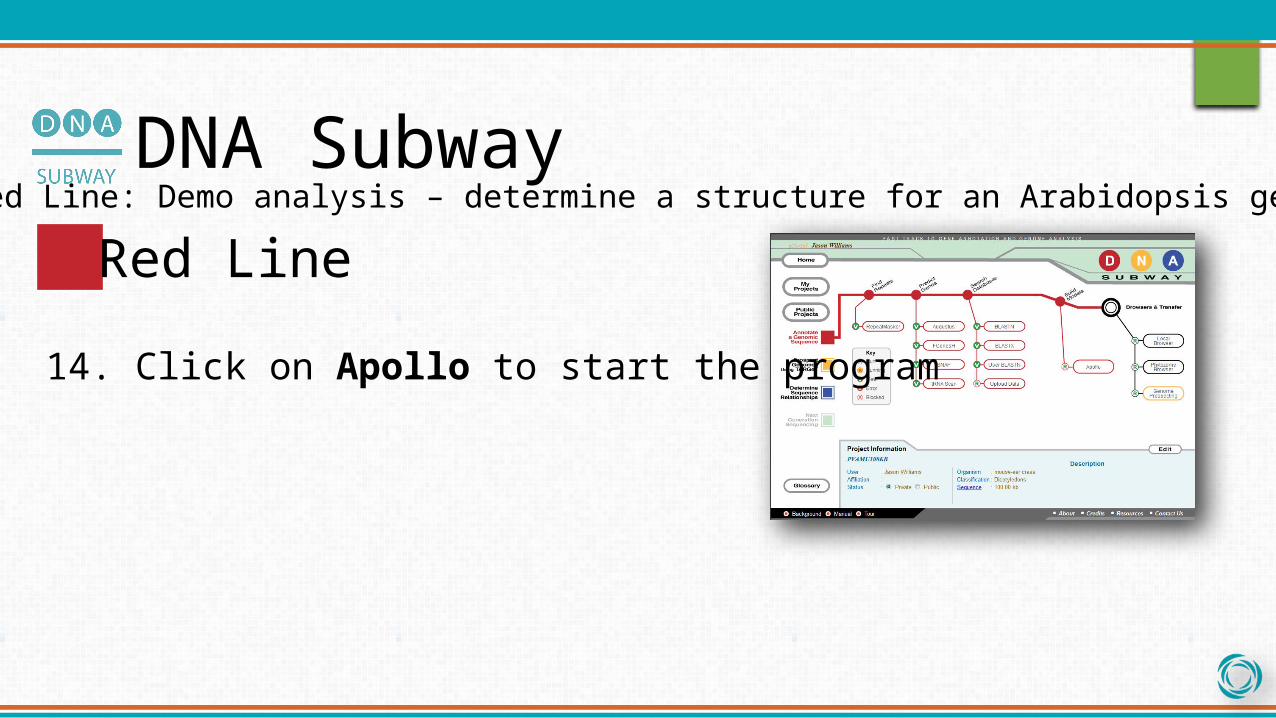
14. Click on Apollo to start the program

DNA SubwayRed Line: Demo analysis – determine a structure for an Arabidopsis gene
Red Line
15. Hide the reverse strand; click the View menu and select Hide Reverse Strand
16.Expand tiers; click the Tiers menu and select Expand all tiers
17.If there are too many tiers displayed, click the Tiers menu; select Show Types Panel and uncheck Show evidence you wish to hide

DNA SubwayRed Line: Demo analysis – determine a structure for an Arabidopsis gene
Red Line
18. Double-click the Augustus model and drag into workspace
19.Double-click the new temporary model; right-click to open the Annotation info editor
20. Name the model ‘Augustus1’ in both ‘Symbol’ fields.

DNA SubwayRed Line: Demo analysis – determine a structure for an Arabidopsis gene
Red Line
21. Double-click the BLASTN model and drag into workspace
22.Double-click the new temporary model; right-click to open the Annotation info editor
23. Name the model ‘BLASTN1’ in both ‘Symbol’ fields.

DNA SubwayRed Line: Demo analysis – determine a structure for an Arabidopsis gene
Red Line23. Zoom in to examine the 5’ and 3’ ends of the gene models
24.Double-click the Augustus1 model and right-click to open the Exon detail editor
25. Adjust the 5’ and 3’ of the Augustus1 model to match the evidence provided by the BLASTN1 model

DNA SubwayTip: The BLASTN evidence is most useful for determining the transcript length (e.g. the 5’ and 3’ ends).
Red Line: Demo analysis – determine a structure for an Arabidopsis gene

DNA SubwayRed Line: Demo analysis – determine a structure for an Arabidopsis gene
Red Line
26. Use any other available evidence* (e.g. BLASTN, User BLAST(N/X) ) to make alternative models if supported
27. Use the BLASTX evidence to determine start/stop codons. Drag any needed stop and start codon into your model.
*If you have hidden evidence, show it again from the show types panel in the Tiers menu

DNA SubwayRed Line: Demo analysis – determine a structure for an Arabidopsis gene
Red Line
28.Delete the BLASTN1 model and any other extraneous models
29.Save your work back to DNA Subway; click the File menu and select Upload to DNA Subway; close Apollo

Verify gene model at Phytozome
DNA SubwayRed Line: Demo analysis – determine a structure for an Arabidopsis gene

DNA SubwayRed Line: Demo analysis – determine a structure for an Arabidopsis gene
Red Line
30.Click Phytozome Browser and compare the created model(s) to the accepted transcript(s)

DNA Subway
Tip: Phytozome accepted transcripts are only available for DNA Subway sample sequences.
Red Line: Demo analysis – determine a structure for an Arabidopsis gene