
WELCOME TO CLEVELAND · • Avg. days/week: 2.5 • Avg. trip length: 8.4 miles. Travel Patterns...
15
WELCOME TO CLEVELAND
Transcript of WELCOME TO CLEVELAND · • Avg. days/week: 2.5 • Avg. trip length: 8.4 miles. Travel Patterns...

WELCOME TO CLEVELAND

Putting Data To WorkMalika Reed Wilkins, PhD, APRState Road and Tollway AuthorityGeorgia Regional Transportation Authority
Dr. Chris LewisAndrew Young School of Policy StudiesGeorgia State University
Mr. Craig BettmanCogensia
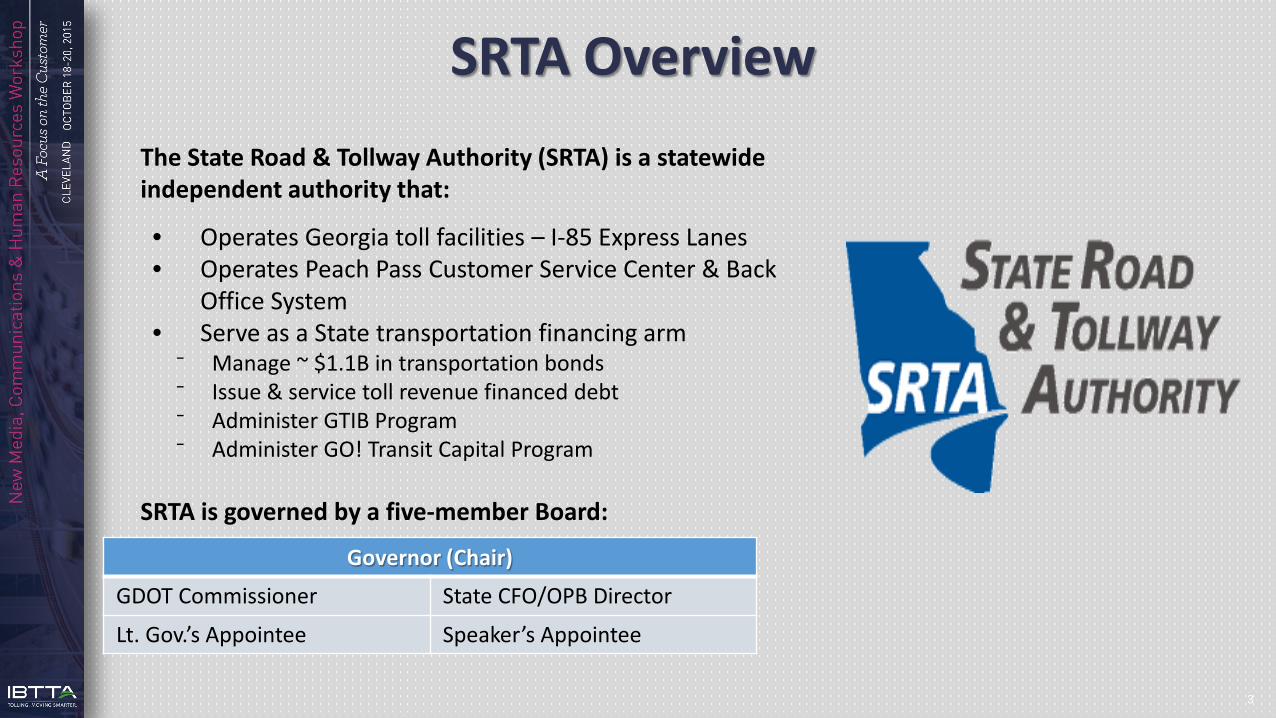
The State Road & Tollway Authority (SRTA) is a statewide independent authority that:
• Operates Georgia toll facilities – I-85 Express Lanes• Operates Peach Pass Customer Service Center & Back
Office System• Serve as a State transportation financing arm
⁻ Manage ~ $1.1B in transportation bonds⁻ Issue & service toll revenue financed debt⁻ Administer GTIB Program⁻ Administer GO! Transit Capital Program
SRTA is governed by a five-member Board:
3
SRTA Overview
Governor (Chair)
GDOT Commissioner State CFO/OPB Director
Lt. Gov.’s Appointee Speaker’s Appointee
Tolling Customer Segmentation
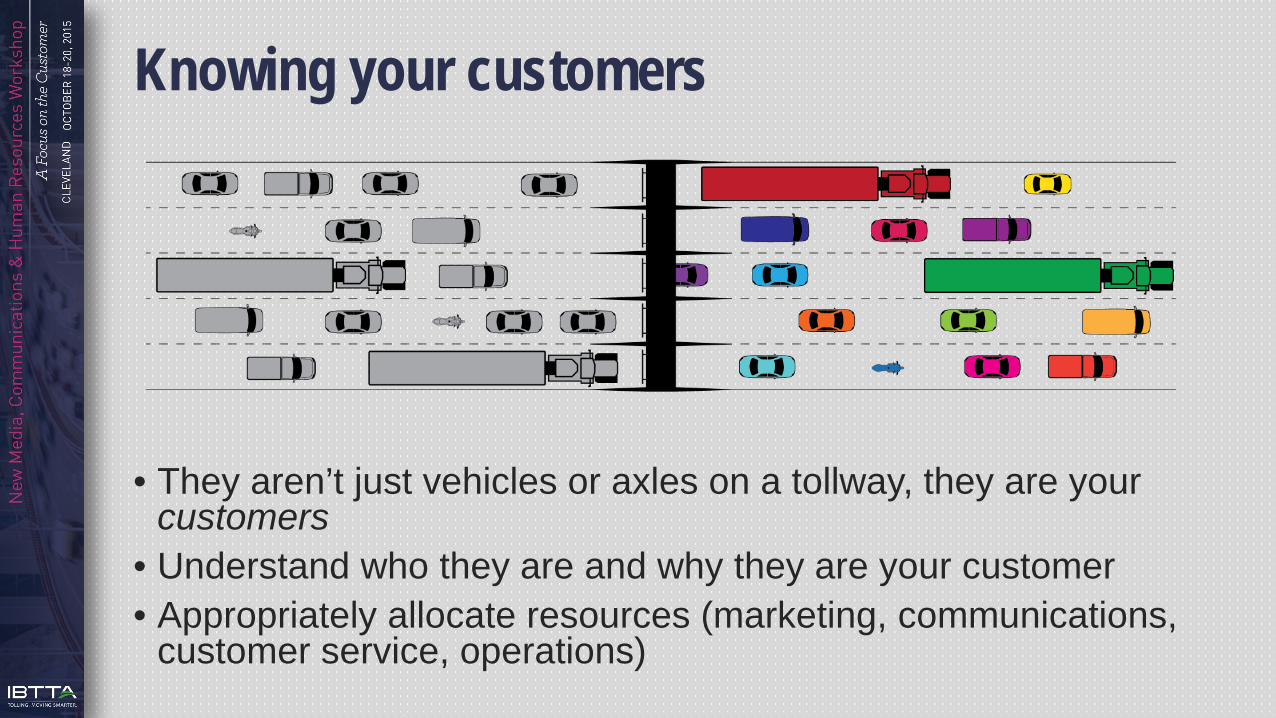
Knowing your customers
• They aren’t just vehicles or axles on a tollway, they are your customers
• Understand who they are and why they are your customer• Appropriately allocate resources (marketing, communications,
customer service, operations)
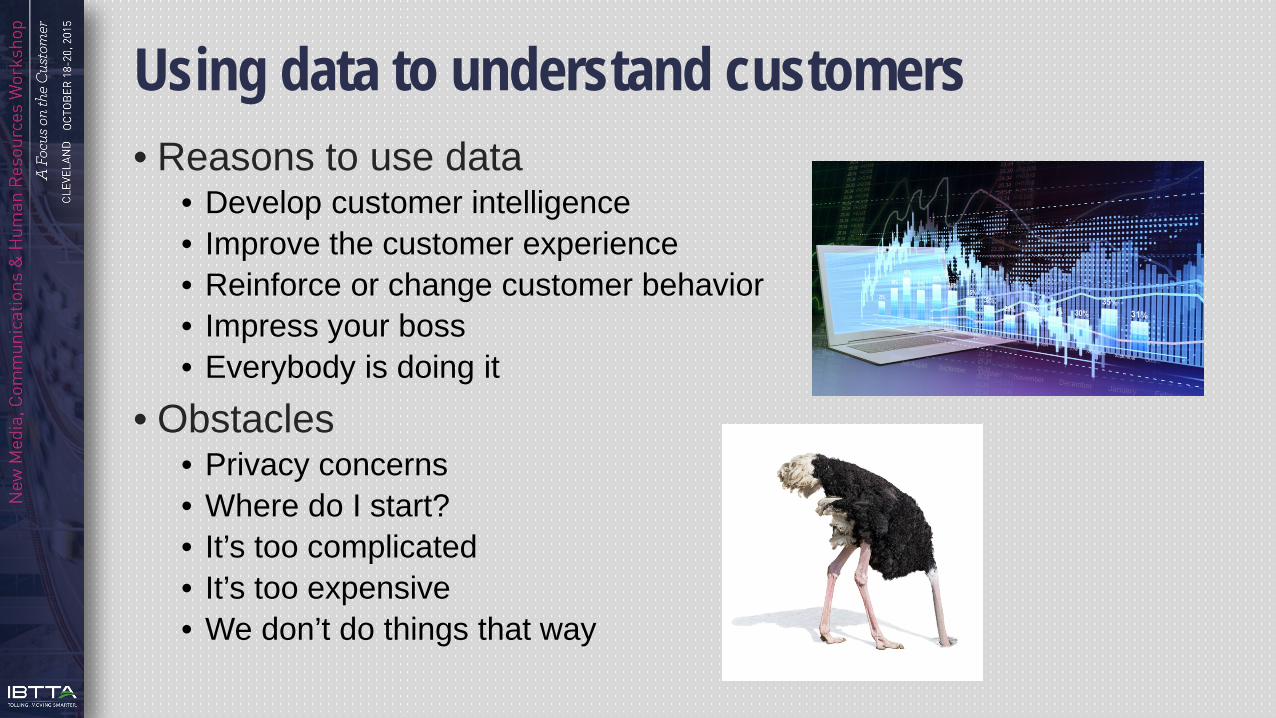
Using data to understand customers• Reasons to use data
• Develop customer intelligence• Improve the customer experience• Reinforce or change customer behavior• Impress your boss• Everybody is doing it
• Obstacles• Privacy concerns• Where do I start?• It’s too complicated• It’s too expensive• We don’t do things that way
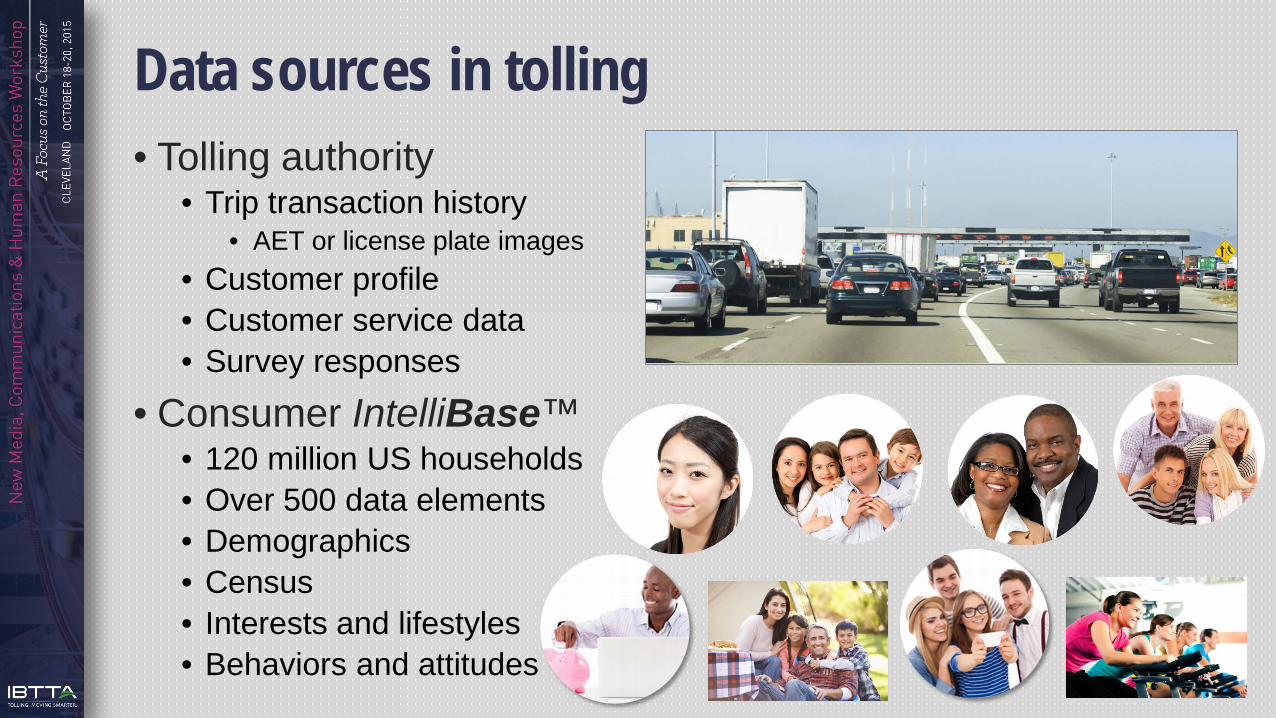
Data sources in tolling• Tolling authority
• Trip transaction history• AET or license plate images
• Customer profile • Customer service data• Survey responses
• Consumer IntelliBase™• 120 million US households• Over 500 data elements• Demographics• Census• Interests and lifestyles• Behaviors and attitudes
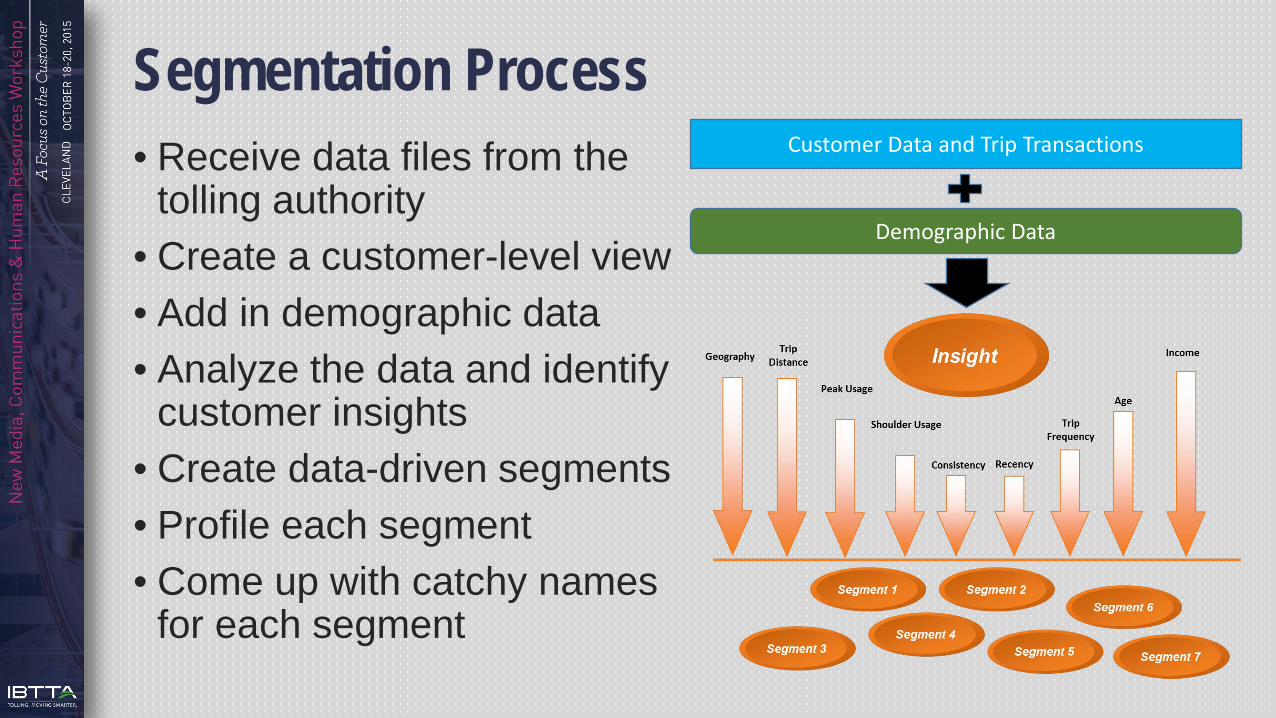
Segmentation Process• Receive data files from the
tolling authority• Create a customer-level view• Add in demographic data• Analyze the data and identify
customer insights• Create data-driven segments• Profile each segment• Come up with catchy names
for each segment
Customer Data and Trip Transactions
Demographic Data
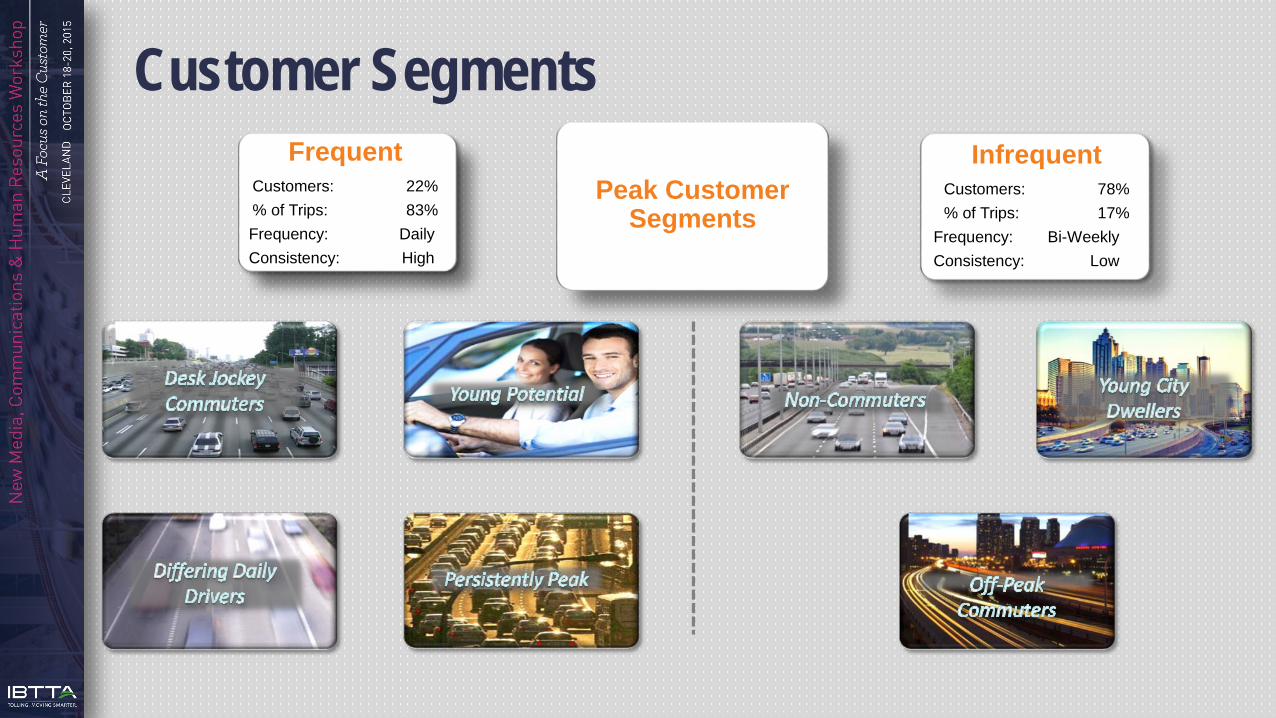
Customer SegmentsFrequent
Customers: 22% % of Trips: 83% Frequency: DailyConsistency: High
InfrequentCustomers: 78%% of Trips: 17%
Frequency: Bi-WeeklyConsistency: Low
Peak Customer Segments
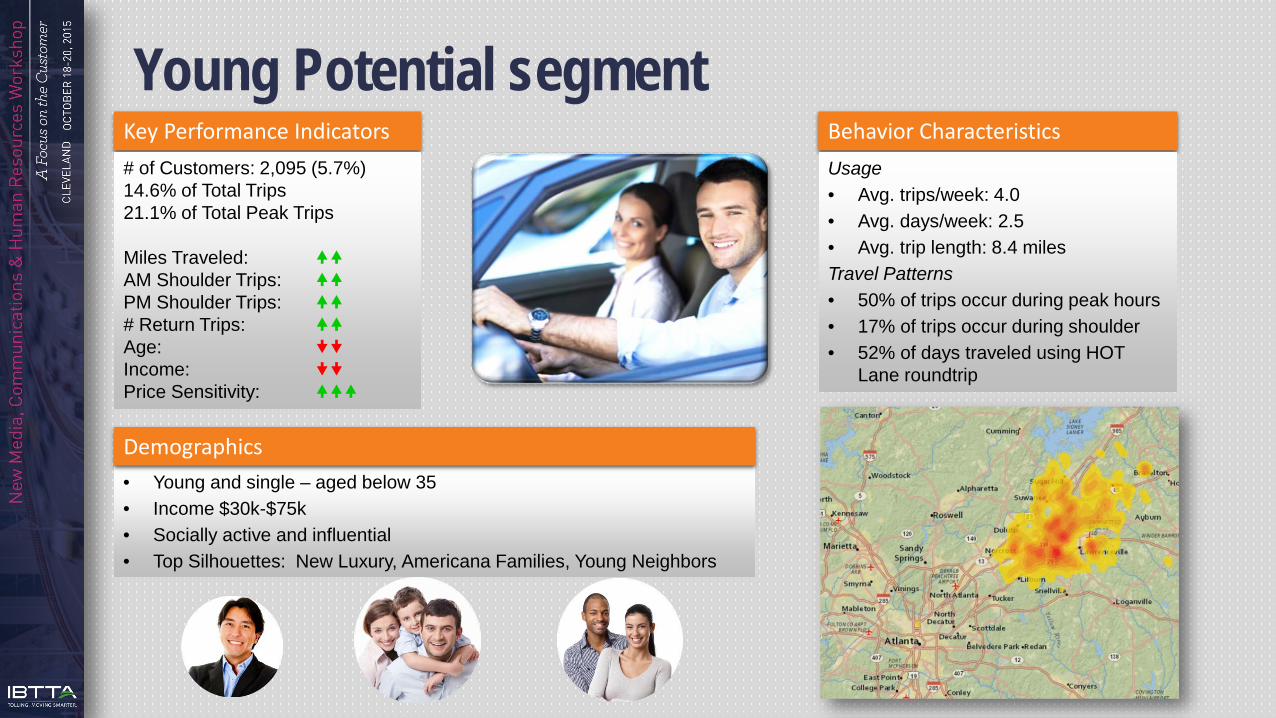
Young Potential segmentKey Performance Indicators# of Customers: 2,095 (5.7%)14.6% of Total Trips21.1% of Total Peak Trips
Miles Traveled: AM Shoulder Trips: PM Shoulder Trips: # Return Trips: Age: Income: Price Sensitivity:
Behavior CharacteristicsUsage• Avg. trips/week: 4.0• Avg. days/week: 2.5• Avg. trip length: 8.4 milesTravel Patterns• 50% of trips occur during peak hours• 17% of trips occur during shoulder• 52% of days traveled using HOT
Lane roundtrip
• Young and single – aged below 35• Income $30k-$75k• Socially active and influential• Top Silhouettes: New Luxury, Americana Families, Young Neighbors
Demographics
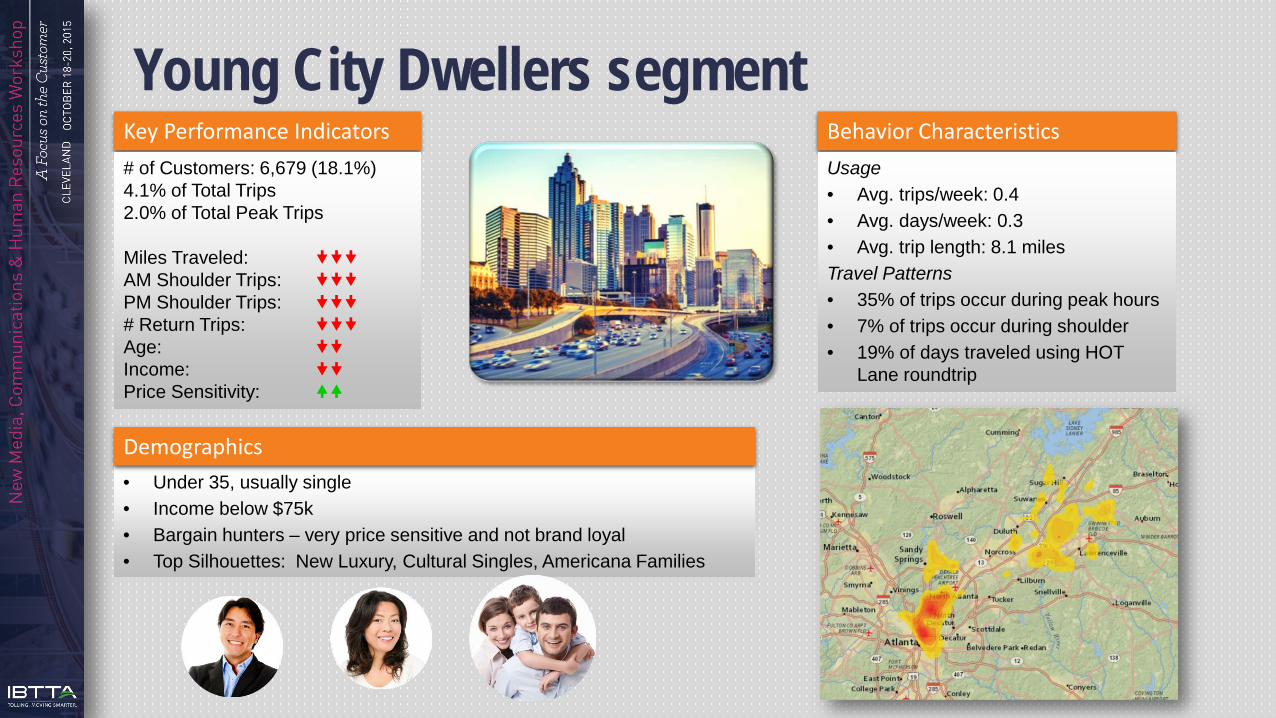
Young City Dwellers segmentKey Performance Indicators# of Customers: 6,679 (18.1%)4.1% of Total Trips2.0% of Total Peak Trips
Miles Traveled: AM Shoulder Trips: PM Shoulder Trips: # Return Trips: Age: Income: Price Sensitivity:
• Under 35, usually single• Income below $75k• Bargain hunters – very price sensitive and not brand loyal• Top Silhouettes: New Luxury, Cultural Singles, Americana Families
Demographics
Behavior CharacteristicsUsage• Avg. trips/week: 0.4• Avg. days/week: 0.3• Avg. trip length: 8.1 milesTravel Patterns• 35% of trips occur during peak hours• 7% of trips occur during shoulder• 19% of days traveled using HOT
Lane roundtrip
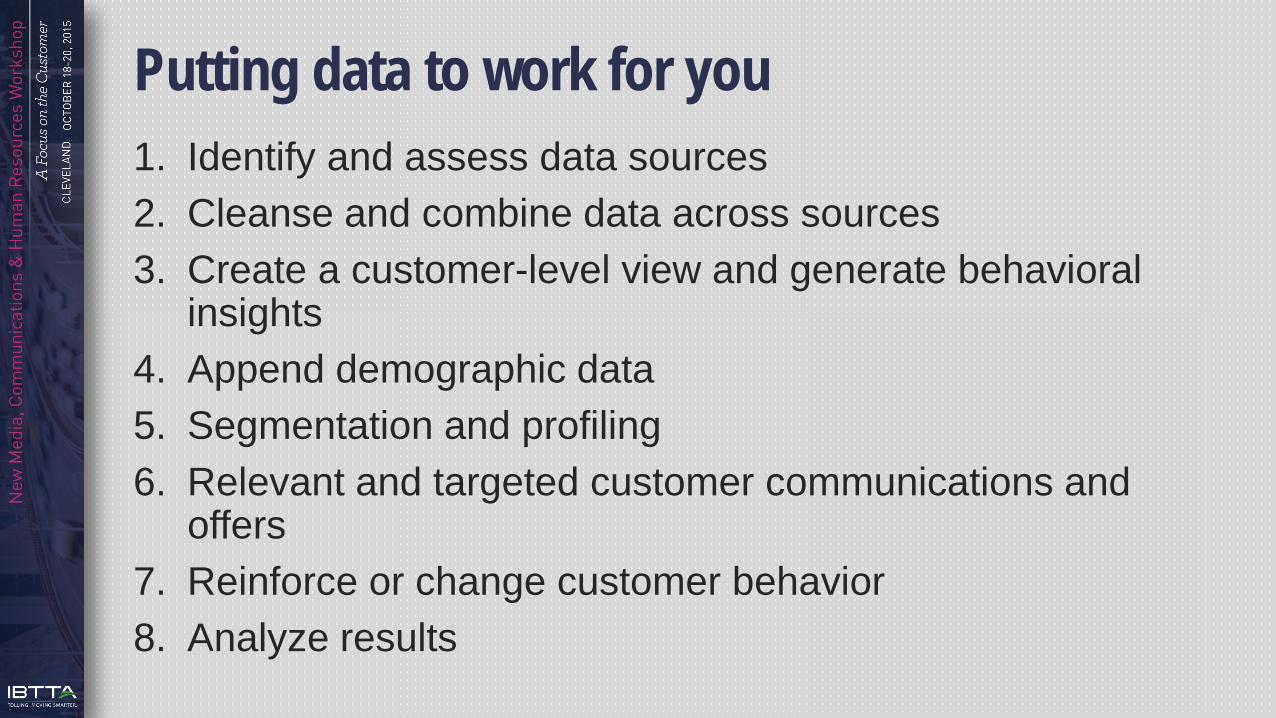
Putting data to work for you1. Identify and assess data sources2. Cleanse and combine data across sources3. Create a customer-level view and generate behavioral
insights4. Append demographic data5. Segmentation and profiling6. Relevant and targeted customer communications and
offers7. Reinforce or change customer behavior8. Analyze results
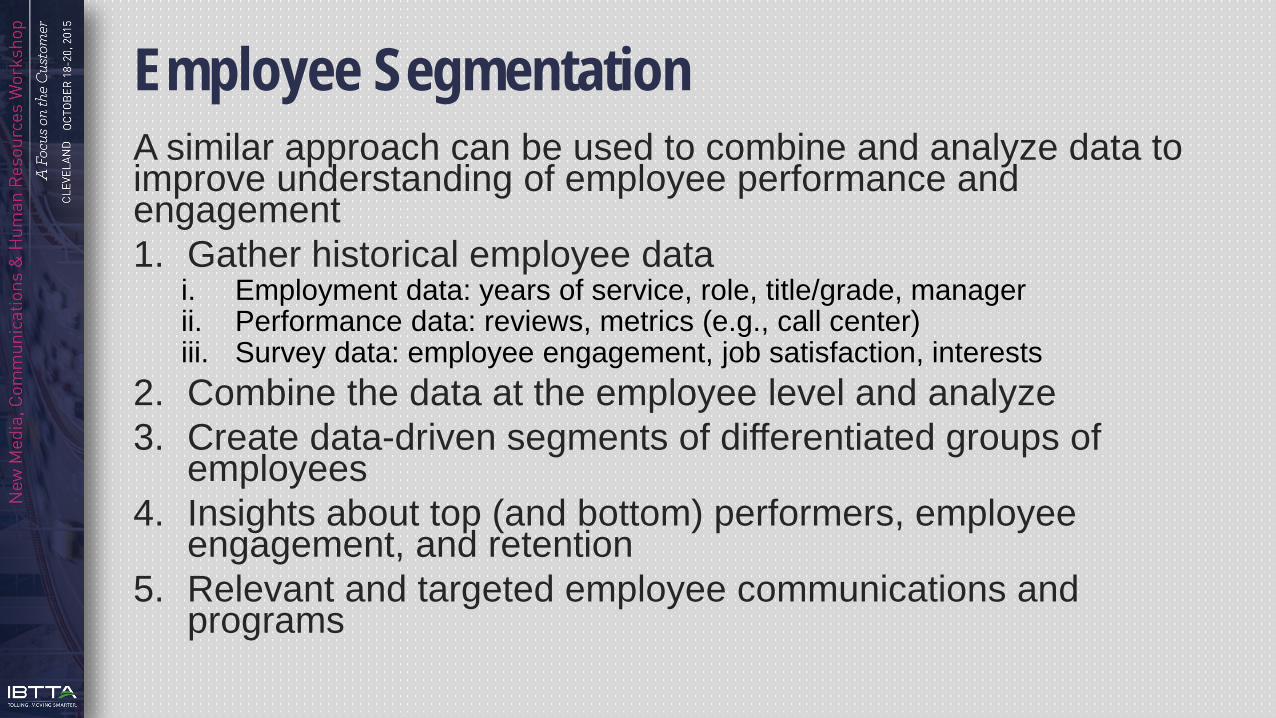
Employee SegmentationA similar approach can be used to combine and analyze data to improve understanding of employee performance and engagement1. Gather historical employee data
i. Employment data: years of service, role, title/grade, managerii. Performance data: reviews, metrics (e.g., call center)iii. Survey data: employee engagement, job satisfaction, interests
2. Combine the data at the employee level and analyze3. Create data-driven segments of differentiated groups of
employees4. Insights about top (and bottom) performers, employee
engagement, and retention5. Relevant and targeted employee communications and
programs
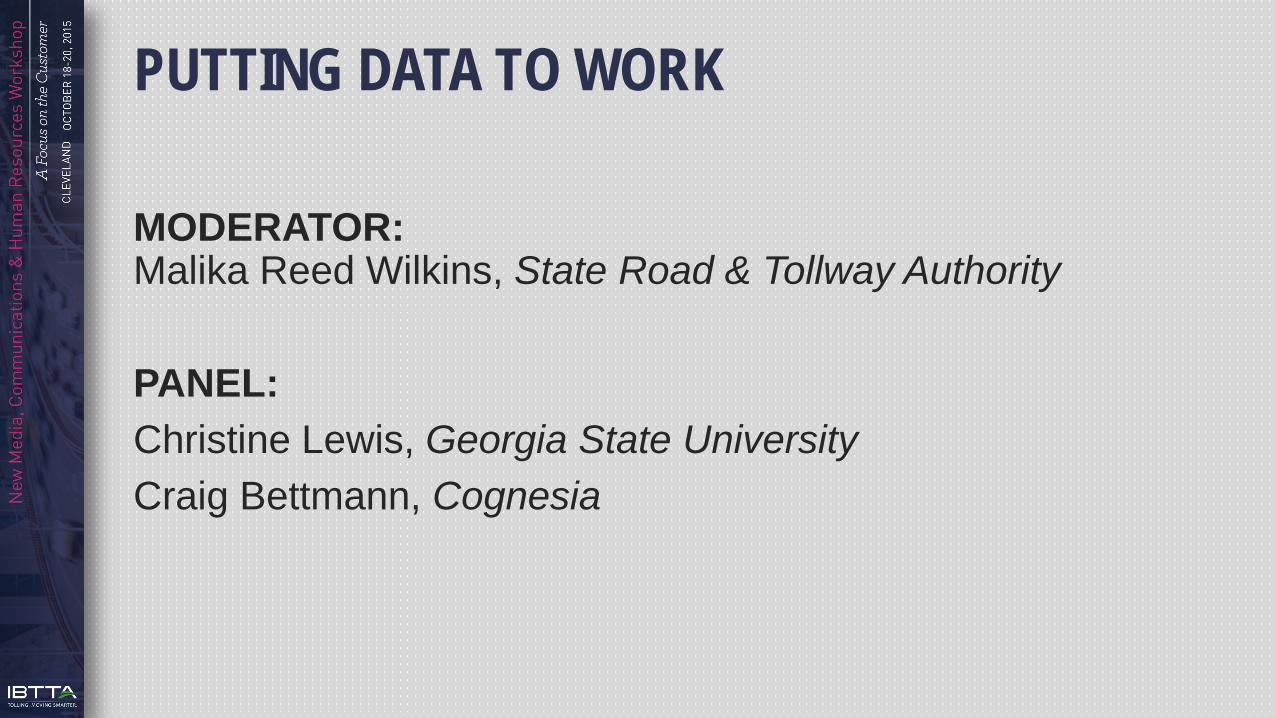
PUTTING DATA TO WORK
MODERATOR: Malika Reed Wilkins, State Road & Tollway Authority
PANEL:Christine Lewis, Georgia State UniversityCraig Bettmann, Cognesia
REFRESHMENT BREAKNEXT UP: Break-out SessionsORCHID EASTPutting Data to Work: Customer Surveys & Focus Groups
CALYPSOHappy Employees Will Improve your Bottom Line