WELCOME. Malay Mitra Lecturer in Computer Science & Application Jalpaiguri Polytechnic West Bengal.
23
WELCOME WELCOME
-
Upload
maryann-lucas -
Category
Documents
-
view
227 -
download
5
Transcript of WELCOME. Malay Mitra Lecturer in Computer Science & Application Jalpaiguri Polytechnic West Bengal.

WELCOMEWELCOME

Malay MitraLecturer in Computer Science & ApplicationJalpaiguri PolytechnicWest Bengal

A Neural Network Based Intelligent A Neural Network Based Intelligent System for Breast Cancer DiagnosisSystem for Breast Cancer Diagnosis
Supervised By : Prof. (Dr.) Ranjit Kumar Samanta
Department Of Computer Sc. & Appl. University Of North Bengal West Bengal, India.

Why on Breast CancerWhy on Breast Cancer
• According to ACS, the new breast cancer cases are 229,060 in US only in 2012.
• It ranks second as a cause of death in woman after lung cancer.
• One of the reasons of survival of 2.5 million breast cancer patients in US is early diagnosis.

Different methods for detecting Different methods for detecting Breast CancerBreast Cancer
• Biopsy
Accuracy : 100%
• Mammography
Accuracy : 68% to 79%
• FNAC
Accuracy : 65% to 98%
Points which are noted from Points which are noted from previous studiesprevious studies
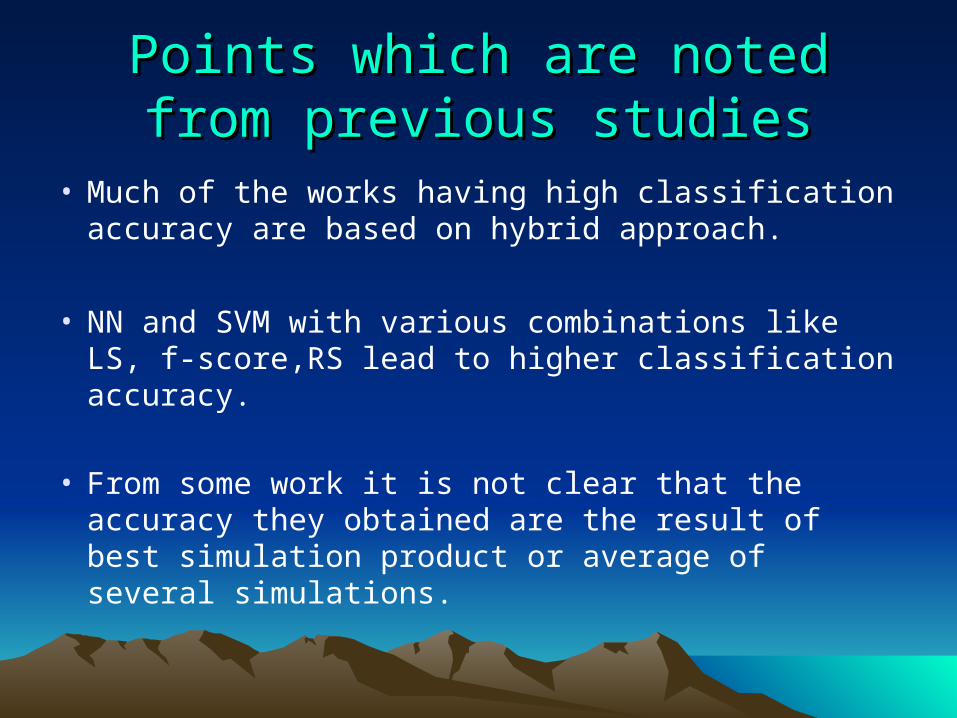
• Much of the works having high classification accuracy are based on hybrid approach.
• NN and SVM with various combinations like LS, f-score,RS lead to higher classification accuracy.
• From some work it is not clear that the accuracy they obtained are the result of best simulation product or average of several simulations.
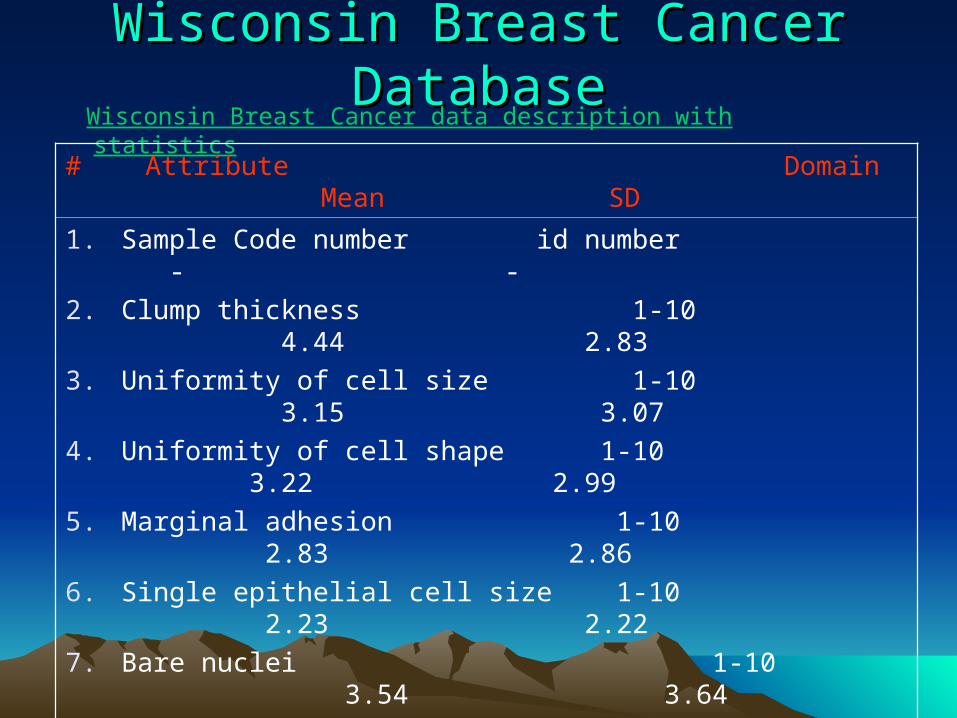
Wisconsin Breast Cancer DatabaseWisconsin Breast Cancer Database Wisconsin Breast Cancer data description with statistics
# Attribute Domain Mean SD
1. Sample Code number id number - -
2. Clump thickness 1-10 4.44 2.83
3. Uniformity of cell size 1-10 3.15 3.07
4. Uniformity of cell shape 1-10 3.22 2.99
5. Marginal adhesion 1-10 2.83 2.86
6. Single epithelial cell size 1-10 2.23 2.22
7. Bare nuclei 1-10 3.54 3.64
8. Bland chromatin 1-10 3.45 2.45
9. Normal nuclei 1-10 2.87 3.05
10. Mitosis 1-10 1.60 1.73
11. Class ( 2 for benign, 4 for malignant )

Feature Extraction and Feature Extraction and ReductionReduction
• CFS (Correlation based Feature Selection)
• AR (Association Rule)
• RS (Rough Set)

Correlation based feature subset Correlation based feature subset selectionselection
ff
fc
fc
rkkk
rkr
)1({
Where, fcr Correlation between summed features and class variable
k Number of features
ffr Average inter-correlation between features
Average of the correlation between featuresfcr
Rough SetRough Set
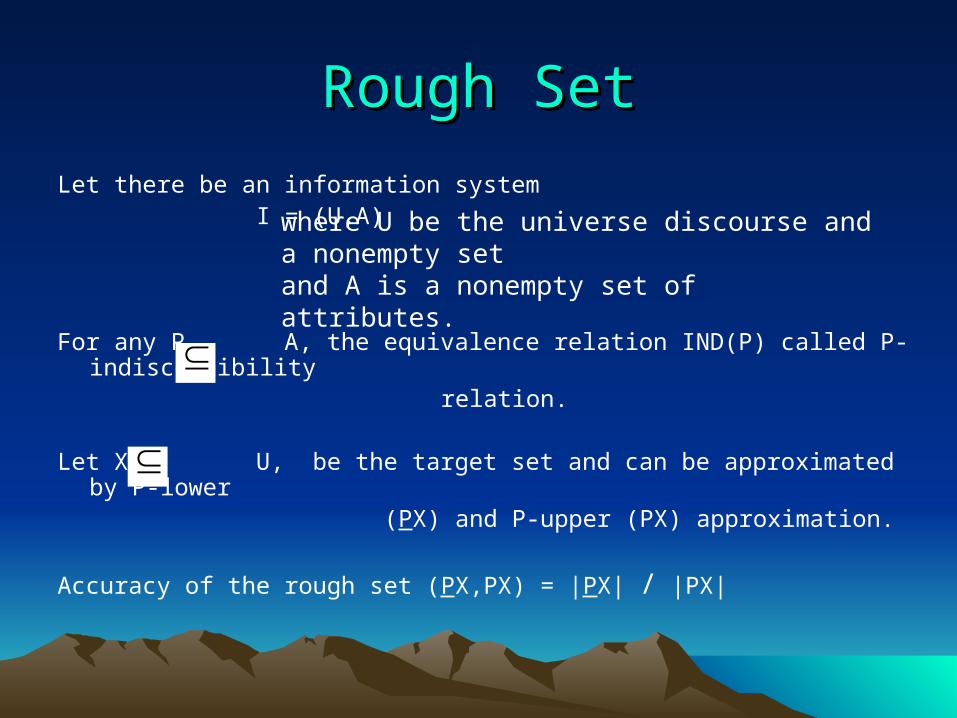
Let there be an information system I = (U,A)
For any P A, the equivalence relation IND(P) called P-indiscernibility relation.
Let X U, be the target set and can be approximated by P-lower (PX) and P-upper (PX) approximation.
Accuracy of the rough set (PX,PX) = |PX| / |PX|
where U be the universe discourse and a nonempty setand A is a nonempty set of attributes.

Artificial Neural Network (ANN)Artificial Neural Network (ANN)
Mc Culloch – Pitts model of a neuron :
1F2F
nF:
Summing Part Output Function
Feature vectors as inputs
Feature weights as synapse as bias
Activation value
Output

Modeling with ANNModeling with ANNModeling with ANN involves : i) Designing the network
ii) Training the networkDesign of network involves : i) fixing the number of layers ii) fixing the number of neurons in each layer iii) the node function for each neuron iv) the form of network whether feed-forward or feedback type v) the connectivity patterns between the layers and neurons.Training phase involves : i) Adjustments of weights as well as threshold values from a set of training
examples.
Levenberg Marquardt (LM) Levenberg Marquardt (LM) algorithmalgorithm
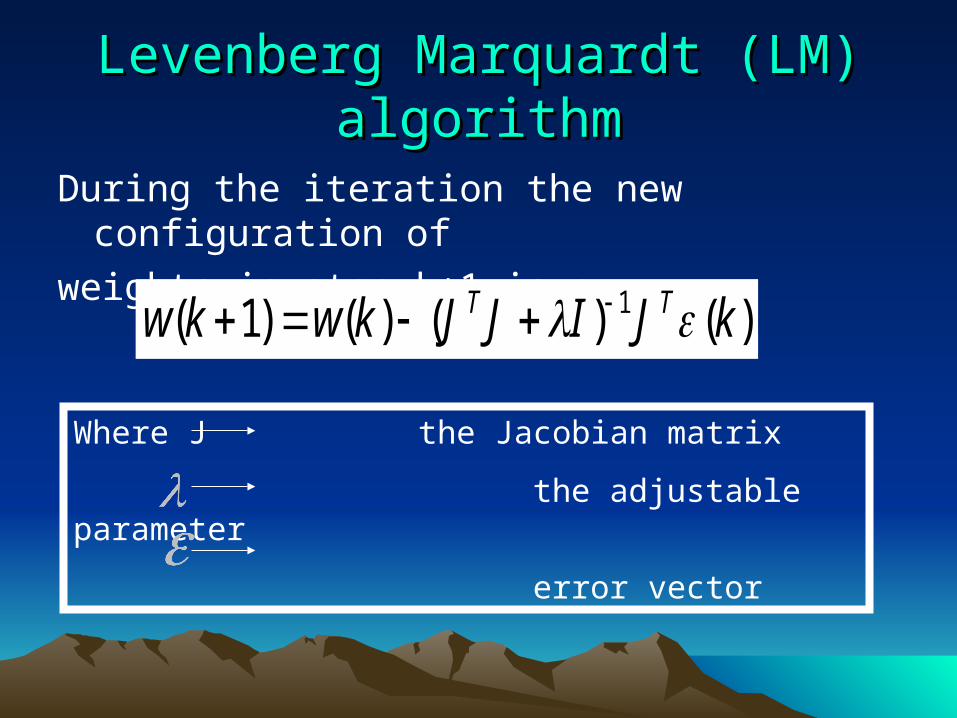
During the iteration the new configuration of
weights in step k+1 is :-
)()()()1( 1 kJIJJkwkw TT
Where J the Jacobian matrix
the adjustable parameter
error vector
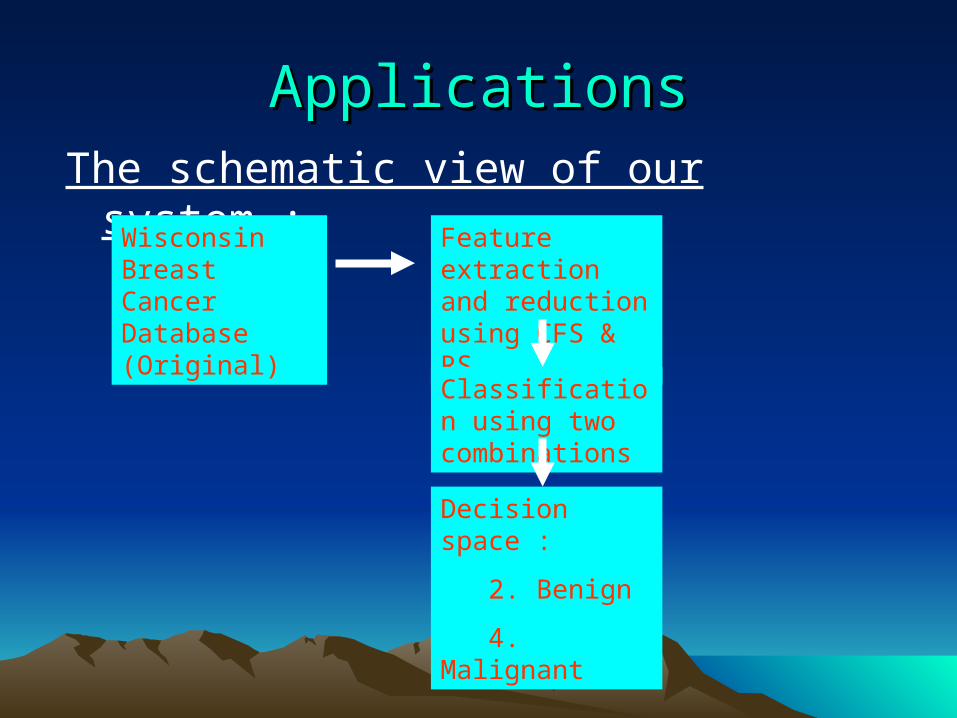
ApplicationsApplicationsThe schematic view of our system :-
Wisconsin Breast Cancer Database (Original)
Feature extraction and reduction using CFS & RS
Classification using two combinations
Decision space :
2. Benign
4. Malignant

Data PreprocessingData Preprocessing
• We completely randomize the dataset after discarding the records with missing values.
• There is no outlier in our dataset.
• The dataset is partitioned into three sets-
1. Training set ( 68% )
2. Validation set ( 16% )
3. Test set ( 16% )
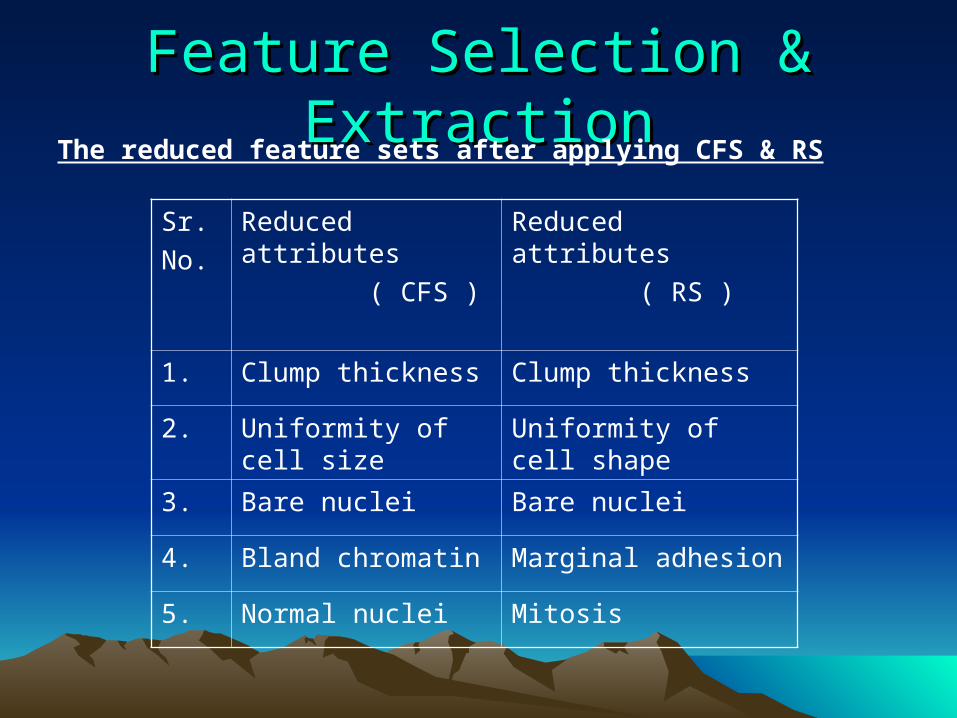
Feature Selection & ExtractionFeature Selection & ExtractionThe reduced feature sets after applying CFS & RS
Sr.
No.
Reduced attributes
( CFS )
Reduced attributes
( RS )
1. Clump thickness Clump thickness
2. Uniformity of cell size
Uniformity of cell shape
3. Bare nuclei Bare nuclei
4. Bland chromatin Marginal adhesion
5. Normal nuclei Mitosis

Network ArchitectureNetwork Architecturei) This work uses logistic function of the form f(x)=1/(1+ex) in the hidden
& output nodes.ii) This work uses one input layer, one hidden layer and one output
layer.iii) Number of neurons in hidden layer is evaluated from the formula
proposed by Goa
s=√(a1m2+a2mn+a3n2+a4m+a5n+a6)+a7
where s : number of neurons, m : number of inputs n : number of outputs
a1 to a7 are undefined coefficients. Using LMS, Huang derived a formula as: s=√(0.43mn+0.12n2+2.54m+0.77n+0.35)+0.51In this study m=5, n=1 and hence s=5 (after round off)
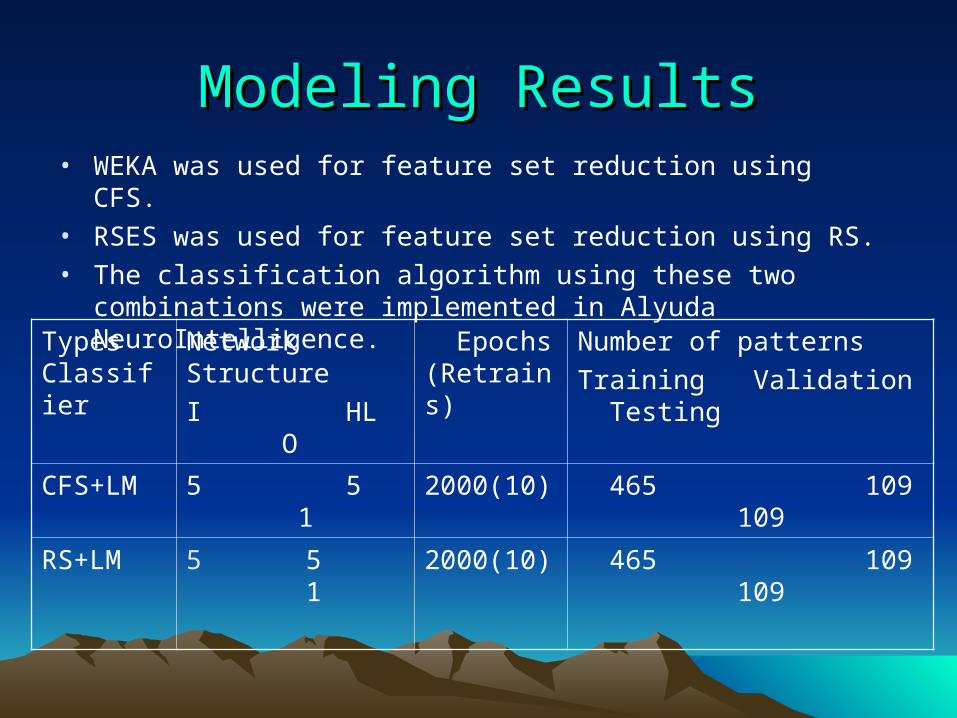
Modeling ResultsModeling Results• WEKA was used for feature set reduction using CFS.• RSES was used for feature set reduction using RS.• The classification algorithm using these two combinations were
implemented in Alyuda NeuroIntelligence.
Types Classifier
Network Structure
I HL O
Epochs (Retrains)
Number of patterns
Training Validation Testing
CFS+LM 5 5 1 2000(10) 465 109 109
RS+LM 5 5 1 2000(10) 465 109 109

Performance Evaluation MethodPerformance Evaluation Method
As performance measure we compute :
%100xFNTNFPTP
TNTPAccuracy
%100xFNTP
TPySensitivit
%100xFPTN
TNySpecificit
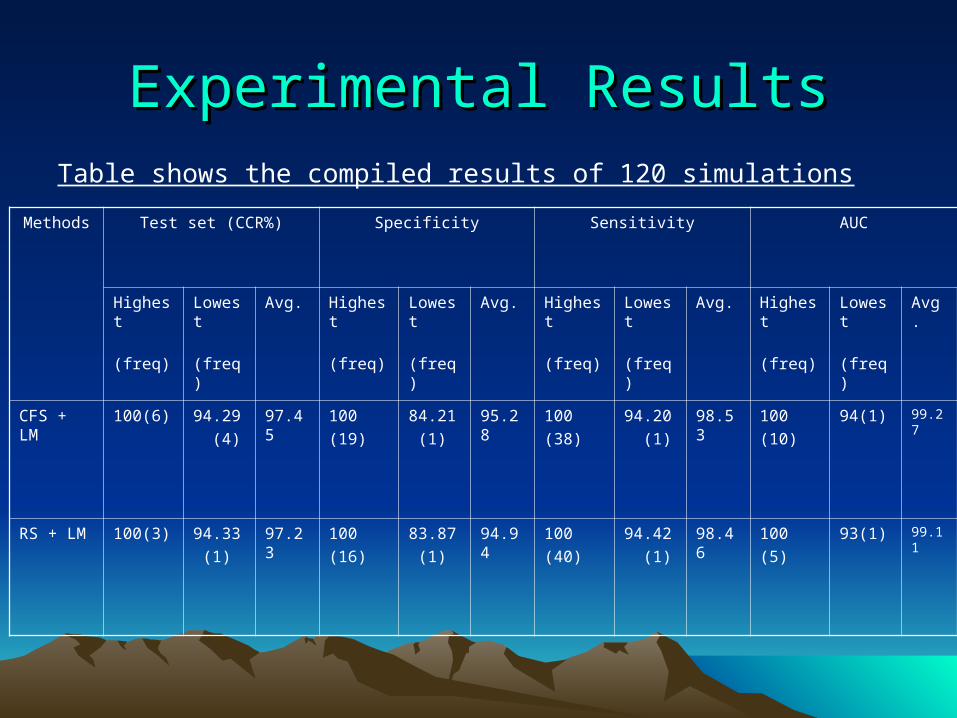
Experimental ResultsExperimental ResultsTable shows the compiled results of 120 simulations
Methods Test set (CCR%) Specificity Sensitivity AUC
Highest
(freq)
Lowest
(freq)
Avg. Highest
(freq)
Lowest
(freq)
Avg. Highest
(freq)
Lowest
(freq)
Avg. Highest
(freq)
Lowest
(freq)
Avg.
CFS + LM 100(6) 94.29
(4)
97.45 100
(19)
84.21
(1)
95.28 100
(38)
94.20
(1)
98.53 100
(10)
94(1) 99.27
RS + LM 100(3) 94.33
(1)
97.23 100
(16)
83.87
(1)
94.94 100
(40)
94.42
(1)
98.46 100
(5)
93(1) 99.11
Observations notedObservations noted
• Out of two methods CFS+LM shows better performance in terms of CCR, Sensitivity, Specificity and AUC.
• Our methods provide 100% CCR as the highest performance which is comparable to other studies.
• The lowest CCR is 94.29%.

ConclusionConclusion
• This work presents here the highest, lowest and average behavior of the methods used.
• This work provides a better result as compared to the result obtained from much of the previous studies.
• It is proposed that CFS-derived features set would have been worthwhile when the final decision is made by doctors.
• Moreover the highest, lowest and average performance of a DSS should be judged by a user of the system before using.

Thank YouThank You


![[XLS] · Web viewICICI BANK LTD., MODI ASSOCIATES, MAYA TALKIES RD., NEAR CHOWPATHY, ALIPURDUAR - 736121, DIST. - JALPAIGURI, WB 736121 MALAY MUKHERJEE 03564-275202 462. JALPAIGURI](https://static.fdocuments.us/doc/165x107/5ad1bee67f8b9a86158c5623/xls-viewicici-bank-ltd-modi-associates-maya-talkies-rd-near-chowpathy-alipurduar.jpg)