Welcome Columbus Investor Forum - SVN Wilson · Columbus Investor Forum May 11, 2017 . Columbus...
33
Welcome Columbus Investor Forum May 11, 2017
Transcript of Welcome Columbus Investor Forum - SVN Wilson · Columbus Investor Forum May 11, 2017 . Columbus...

Welcome Columbus Investor Forum
May 11, 2017
Columbus Investor Forum
Market of Focus:
Columbus, Ohio
Presented by:
Doug Wilson SVN, Managing Director, Columbus
Kristen Wilson Asman SVN, Senior Advisor
“Maximum Competition = Maximum Value”

Columbus Investor Forum
Thank You to our Sponsors:
Jason Wells
Chip Holcombe
Jennifer Alvarez

What to expect…
• Commercial Real Estate Market Overview • What is the “SVN Difference”
• Expansion of Columbus SVN • Presentation of Forum Sponsors:
– Chip Holcomb, Columbus 2020 – Jason Wells, Vice President, Business Banking, Columbus – Jim Havens, Owner & Esquire, Cardinal Title

Robert M. White Jr., CRE, FRICS
US Commercial Real Estate Capital Markets Update April 5, 2017

US CRE TRENDS - ANNUAL
-8%
-100%
-50%
0%
50%
100%
150%
'03 '04 '05 '06 '07 '08 '09 '10 '11 '12 '13 '14 '15 '16
Year-Over-Year Change
0
25
50
75
100
125
150
175
200
225
$0
$100
$200
$300
$400
$500
$600
'03 '04 '05 '06 '07 '08 '09 '10 '11 '12 '13 '14 '15 '16
Bill
ions
Individual Portfolio Entity CRE Prices*

MOST OF INTEREST INCREASE ABSORBED IN SPREAD
0%
1%
2%
3%
4%
5%
6%
7%
8%
'06 '07 '08 '09 '10 '11 '12 '13 '14 '15 '16
Equity spread Debt spread 10yr UST

5%
6%
7%
8%
9%
'11 '12 '13 '14 '15 '16
Off Ret Ind Apt Htl
CAP RATES SLIGHTLY LOWER FOR YEAR, BUT UP IN Q4

Cap Rates, Columbus
Source: Real Capital Analytics

MACRO: US GDP, Jobs & Money
• US GDP IS 70% CONSUMER DEMAND
• 2016 GDP growth @ 1.5% - 2.0%
• 2017 GDP Growth, likely in same range as 2016.
• Political uncertainties = “The Trump Thesis”
• Jobs @ 200K/month
• Consumer debt is declining
• Consumers spending is soft.
• Corporate profits: softening
• Investment markets still flooded with capital
• Expect little inflation + only modest interest rate change

CRE OVERVIEW
• Many Strengths in Mature Market vs 2008
• Slight Sales Volume Decline: Just a Pause; • Still lots of Capital, Confidence.
• Industrial: “Last Mile” to Repurpose Retail
• Office: Suburban Office, Breakout Sector, w/self storage, SFR Portfolio & NNN’s.
• Retail: Lifestyle services, & retail.
• Apts: The “New” Demographics, Europe
• Best Return without Risk: smaller markets

• NMM, Secondary, Tertiary: more growth,
sales, pricing of assets; more investment.
• Bank Restraint in Sales and Construction.
• Private Sector Shows most Confidence.
• 2017 Volume: down 10% from 2016, but
2017.1 shows strong activity
CRE OVERVIEW


3.5%
4.0%
4.5%
5.0%
5.5%
6.0%
6.5%
7.0%
7.5%
8.0%
'06 '07 '08 '09 '10 '11 '12 '13 '14 '15 '16 '17
7 / 10 yr Fixed Commercial Mortgage Rate
CAN CHEAP DEBT PUSH FURTHER PRICE GROWTH?
US Presidential Election
DESPITE THE RISING RATE ENVIRONMENT, MORTGAGE RATES ARE STILL LOW

HEADWIND: MORE CAPITAL FLOWING TO DEVELOPMENT
Dollars Invested in Construction
HOWEVER NEW FED SCRUTINY AND REGS ON CONSTRUCTION LOANS SHOULD KEEP BANKS DISCIPLINED…

0
1
2
3
4
5
6
7
8
9
-15
-10
-5
0
5
10
15
20
25
30
35
Q1'14 Q2'14 Q3'14 Q4'14 Q1'15 Q2'14 Q3'15 Q4'15 Q1'16 Q2'16 Q3'16 Q4'16
Bill
ions
Change in Lending Standards Development Site Sales
Net % of Respondents Reporting Tightening Standards Development Site Sales, $B
CONSTRUCTION LENDING PULLING BACK
BUT A SLIGHTLY EASIER TO GET A LOAN INTO Q4’16: SITE SALES RESPONDED
Sources: RCA, Federal Reserve Bank, Senior Loan Officer Survey

6MM Apartment
6MM CBD Office
6MM Industrial
6MM Retail6MM Suburban Office
NMM Apartment
NMM CBD Office
NMM Industrial
NMM Retail
NMM Suburban Office
Hotel
0%
5%
10%
15%
20%
-40% -30% -20% -10% 0% 10% 20%
CP
PIC
han
ge
'16
vs '1
5
Volume Change '16 vs '15
INVESTORS CHASED HIGHER YIELDS IN SECONDARY MARKETS
PRICE AND VOLUME TRENDS BY PROPERTY SECTOR

CMBS LENDING LOST MARKET SHARE IN 2016
AND BANKS OF ALL SORTS GAINED GROUND
12%
19%
28%
25%
22%
8%
8%
9%
7%
5%
21%
20%
19%
18%
27%
12%
12%
10%
11%
13%
7%
7%
7%
10%
7%
18%
16%
13%
17%
14%
20%
16%
12%
11%
9%
2016 ThruQ3
2015
2014
2013
2012

Composition of Buyers
US EQUITY CAPITAL SOURCES

CROSS-BORDER ACQUISITIONS
BUT CROSS-BORDER FLOWS HIGH AND DIVERSE
$0
$20
$40
$60
$80
$100
$120
'01 '02 '03 '04 '05 '06 '07 '08 '09 '10 '11 '12 '13 '14 '15 '16
Europe Canada Middle East & Africa Asia Australia Latin America
billions
TRAILING 12 MONTH TOTAL

Columbus Apartments-Price Per Square Foot and Number of Sale Transactions
Source: Xceligent

APARTMENT OVERVIEW:
• Strong Demand vs. Bubble Market?
• Growth of Households still outpacing new construction
• Fundamentals Still Strengthening: – Vacancy 4%, Rent Growth 3.5%
– Population Growth: 22,000/yr in the Columbus MSA
– Millennial Population exceeds Baby Boomer Population
– New Construction mostly single bedroom
– Only entry level housing boom slows apartments
• Large quantities of affordable capital driving investment market
• Columbus Pricing is VERY attractive compared to US average.
• Columbus apartments are on the radar of National Investors
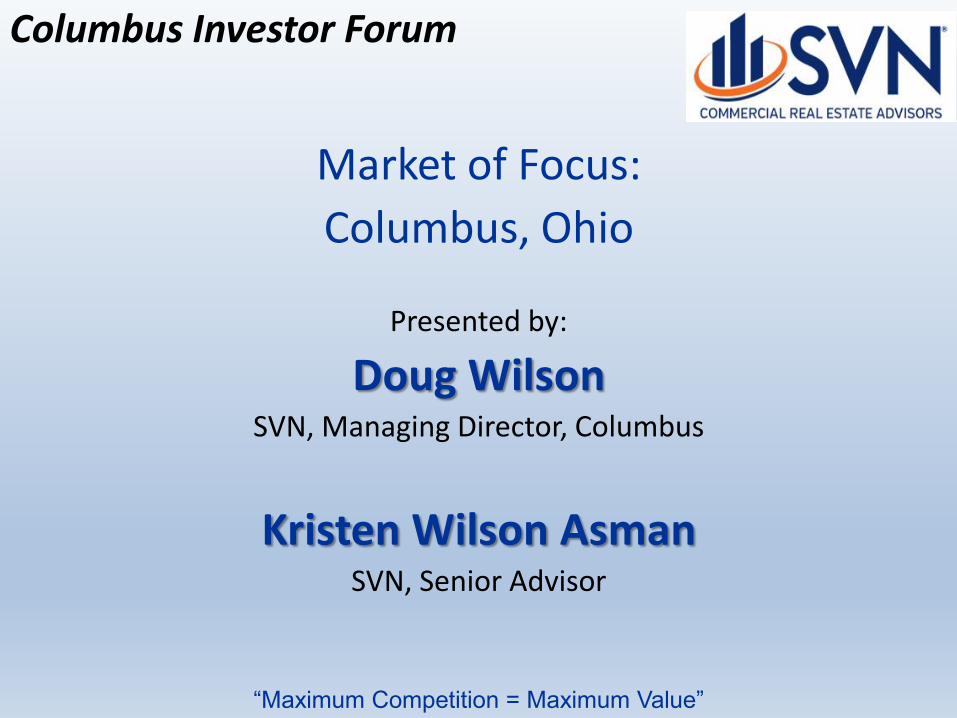
Completed Projects Under Construction Planned/Proposed
Columbus Submarkets 1 University/Downtown 2 Bexley 3 Sharon/Worthington
4 Dublin/Powell 5 Hilliard 6 Grove City
7 Whitehall/Gahanna/Reynoldsburg 8 Northeast/Minerva Park 9 Westerville
10 Southeast 11 Groveport/Canal Winchester 12 Upper Arlington/North Columbus
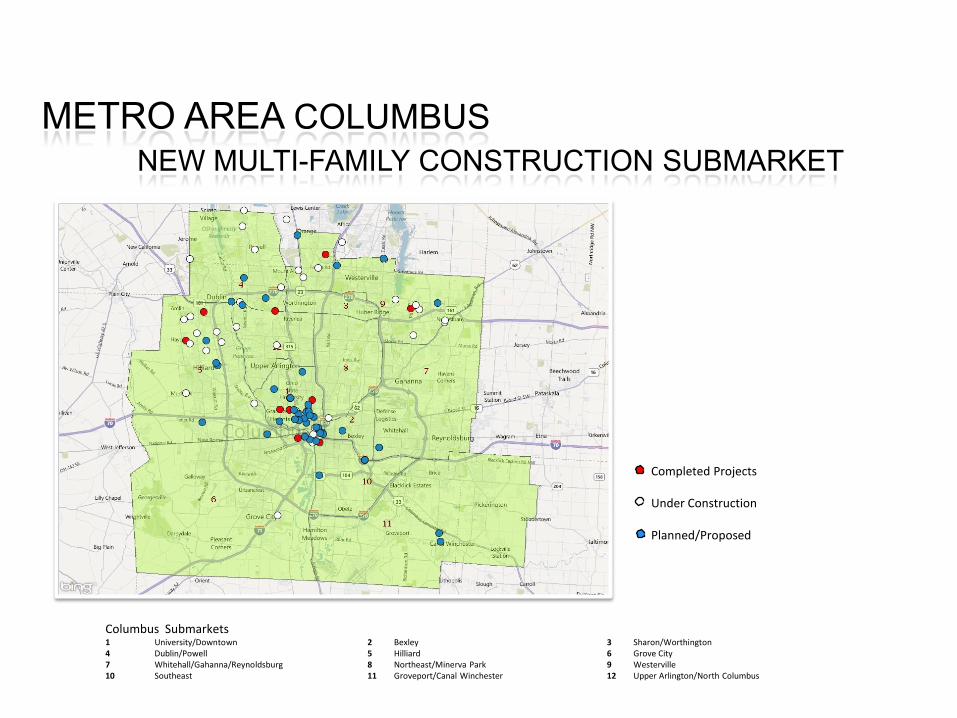
Columbus Retail Sales Volume and Number of Transactions
Source: Xceligent
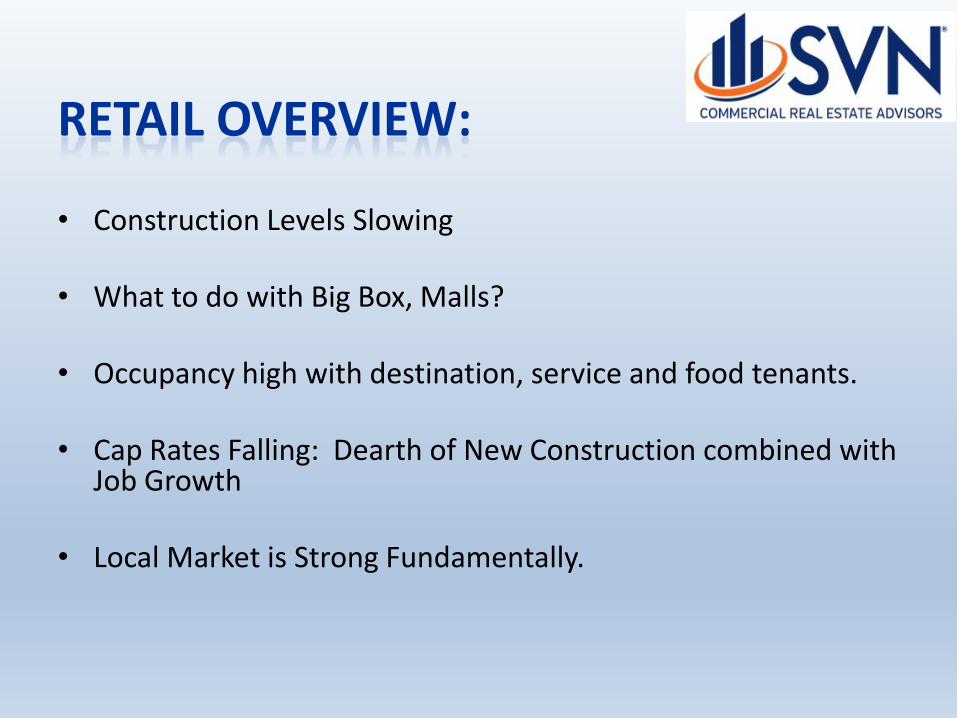
RETAIL OVERVIEW: • Construction Levels Slowing • What to do with Big Box, Malls? • Occupancy high with destination, service and food tenants. • Cap Rates Falling: Dearth of New Construction combined with
Job Growth • Local Market is Strong Fundamentally.

Columbus Office Sales Volume and Number of Transactions
Source: Xceligent

OFFICE OVERVIEW:
• Fundamentals Improving, Finally
• Vacancy Beginning to Wane, especially CBD
• Mixed Use Transactions Increasing, Especially CBD
• Suburban Transactions Increase, very little construction
• Cap Rates high and Prices very competitive Locally
• Institutional Buyers Active in Columbus “hyper markets” Now – Grandview Yard
– Easton
– Polaris

Columbus Industrial Sales Volume and Number of Transactions
Source: Xceligent

INDUSTRIAL OVERVIEW:
• 1st quarter 2017 shows strong sales of portfolios
• CAP Rate reflects compression pricing from low vacancy and little speculative construction.
• Amazon Fullfillment centers spur growth in Industrial sector.
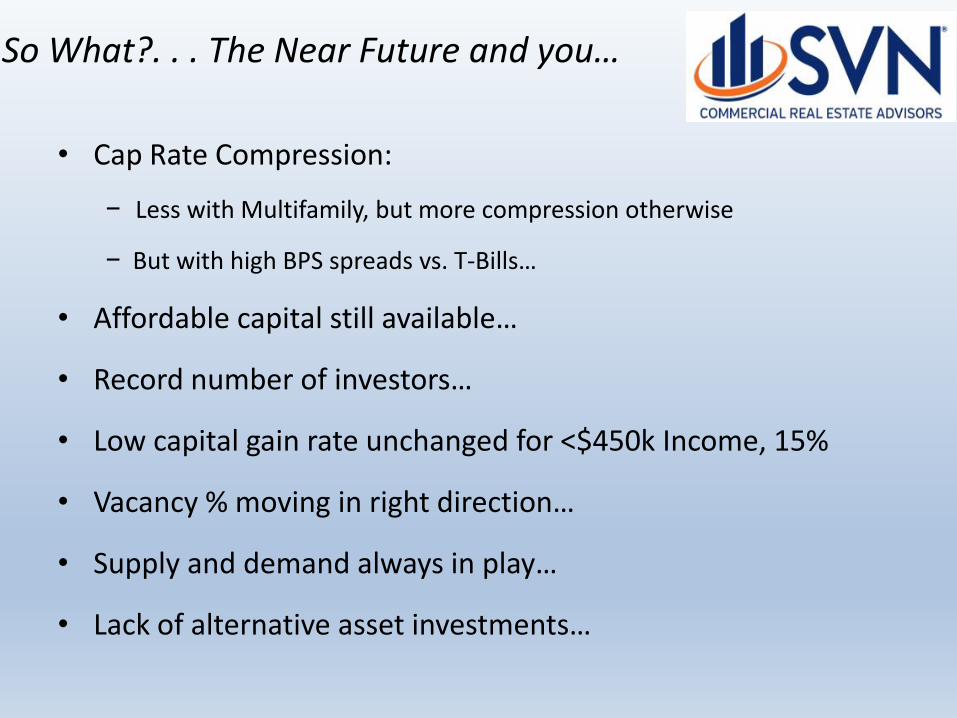
So What?. . . The Near Future and you…
• Cap Rate Compression:
− Less with Multifamily, but more compression otherwise
− But with high BPS spreads vs. T-Bills…
• Affordable capital still available…
• Record number of investors…
• Low capital gain rate unchanged for <$450k Income, 15%
• Vacancy % moving in right direction…
• Supply and demand always in play…
• Lack of alternative asset investments…

Real Estate National Outlook
• Real estate remain asset class of choice for at least next decade:
– .5%: Savings Accounts
– 1.0 – 1.5%: CD’S
– 3.5 – 4.0%: Corporate Bonds
– 5%: Stock Market
– 7% - 10%: Investment Real Estate (REAL ASSETS!).

The bottom line…
• Buy product you understand
• Buy in a market you understand
• Tolerate RISK on your terms
• Don’t buy and sell the same way
• Sell to outside “capital”
• Do not try to “finitely” time the market
• Diversify

Wilson Commercial Group
Doug Wilson, Managing Director Tim Treasure, Managing Broker
Kristen Asman, Senior Advisor Steven Heiser, Senior Advisor
Jack Turner, Senior Advisor Chris Salomone, Senior Advisor
Nail Dawaher, Senior Advisor Mike Bockbrader, Advisor
Rick Bergman, Advisor Beth Long, Advisor
Toyia Devine, Advisor Michele Reynolds, Advisor
Joe Smiley, Advisor Ann Lhota, Advisor
240 Offices Nationally, 1500 Advisors
“Local Listings with World Class Marketing”
GROWING TO MEET THE NEEDS OF CLIENTS AND THE COMMUNITY
4200 Regent Drive, Suite 200, Columbus, Ohio, 43219, 614-206-3881