
Curriculum Night August, 2014 Mrs. Venetia Lowe Welcome! Welcome! Welcome!
Upload
blaze-phelpsCategory
view
26download
0description


CLEAN TECHNOLOGY.
Any Product, Service And Process That Delivers Or Adds Value By Raising Productivity And Product Performance Using Limited Non Renewable Or Natural Resources Creates Significantly Less Waste Than Conventional Offerings And Impacts On Environment And Public Health.

WHY CLEAN TECHNOLOGY.
ENERGY PRICE SPIKE.
RESOURCE SHORTAGE.
GLOBAL ENVIRONMENTAL PROBLEM.(CLIMATE CHANGE & GLOBAL WARMING)

MAJOR CLEAN TECHNOLOGY SECTORS.
Waste Water (Grey Water)- Recycle &Reuse
Waste To Energy (Municipal, Flue Gases)
Green Building & Green Transportation.
Renewable Energy (Solar,wind,Bio Fuels,Bio Mass)

OUR MISSION
To Promote Adoption Of Renewable Energy to Reduce the Human Ecological Footprint, Using Proven Technologies, high Quality Engineering And Professional Installation Practices. We Enable Our Society in Transition To Clean Energy.

Annual mean solar radiation in India in (kwh/sq.m/day)

Some Idea About Solar System.
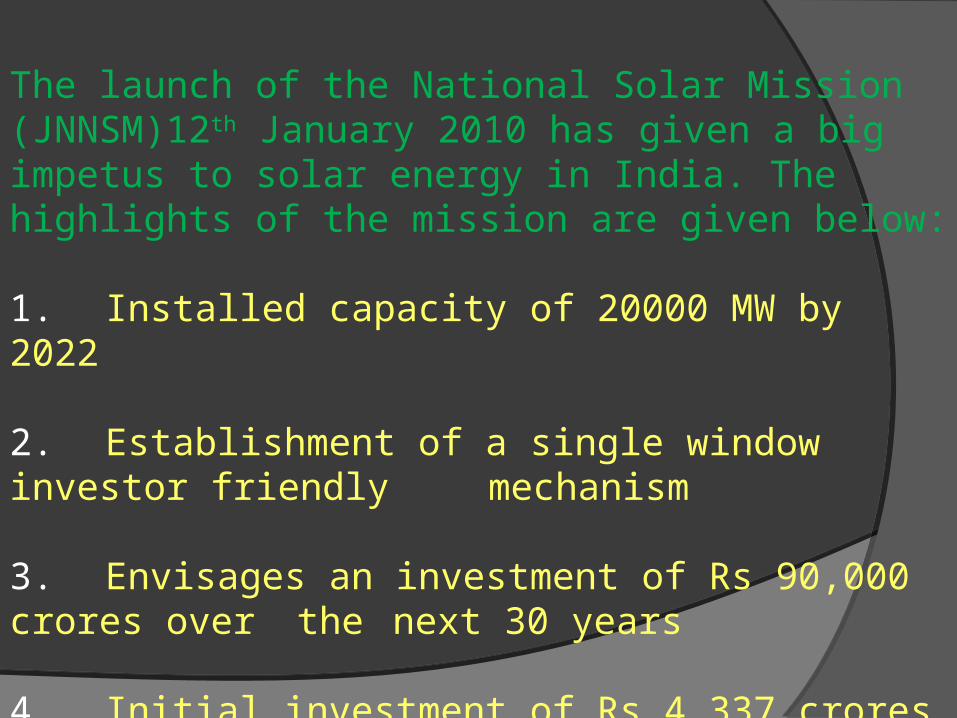
The launch of the National Solar Mission (JNNSM)12th January 2010 has given a big impetus to solar energy in India. The highlights of the mission are given below:
1. Installed capacity of 20000 MW by 2022
2. Establishment of a single window investor friendly mechanism
3. Envisages an investment of Rs 90,000 crores over the next 30 years
4. Initial investment of Rs 4,337 crores provided by the Government of India
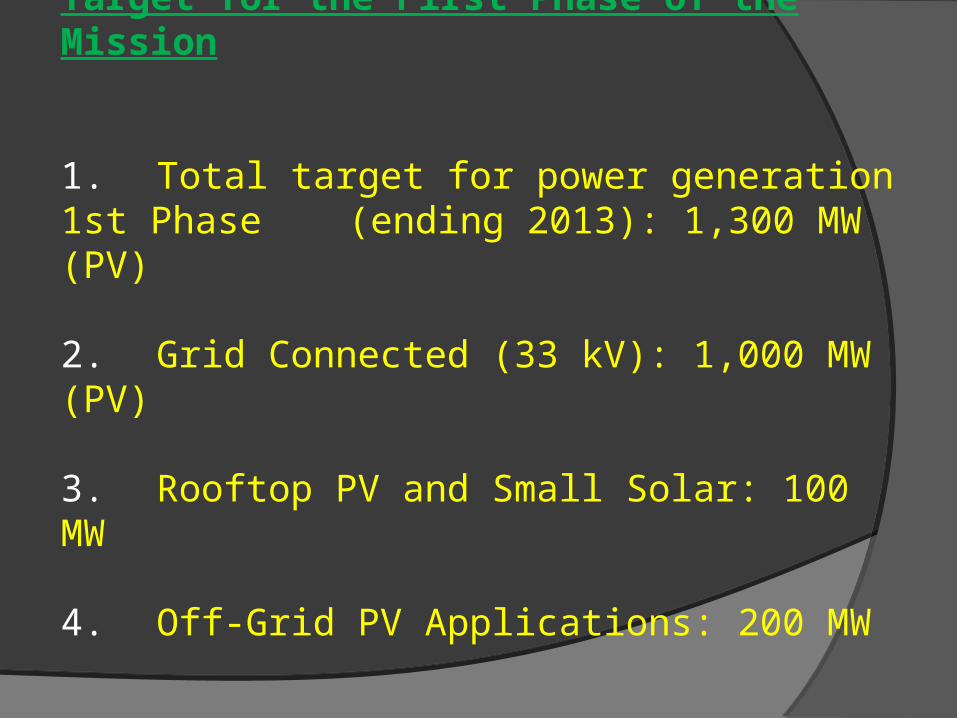
Target for the First Phase of the Mission
1. Total target for power generation 1st Phase (ending 2013): 1,300 MW (PV)
2. Grid Connected (33 kV): 1,000 MW (PV)
3. Rooftop PV and Small Solar: 100 MW
4. Off-Grid PV Applications: 200 MW

Break –up for The Capital Expenses Per MW :
Component Amount (lakhs) Percentage
PV Modules 600 50%
Balance of System (transformers, cables and wires, tracking devices…)
200.0
35%Installation (civil & general works)
110.0
Inverter 90.0
Others (evacuvation and other pre operative expenses)
110.0
15%
Total 1,110.0

Capital Cost for Solar PV in 2011
Capacity (MW)Capex (Rs Crores/MW)
1 11.1
5 54.4
10 103.3
15 152.3
20 196.3
REC tariff for solar power
Solar REC (INR / Mwh)
Upto 2012 2012 - 2017
CERC Price 17000 13400
Floor Price 12000 9300
SNM SOLAR PLANT
SNM GROUP.

Main Entrance Of Power Plant.

One Mega Watt Control Room

P.V. modules. Placed 20 degree. facing towards south.

Photovoltaic MODULE
RATING.= 230 Watt.V(max.)= 29.1 vI (max.)= 7.9 amp.No. of pv used= 4400Total capacity= 1mw
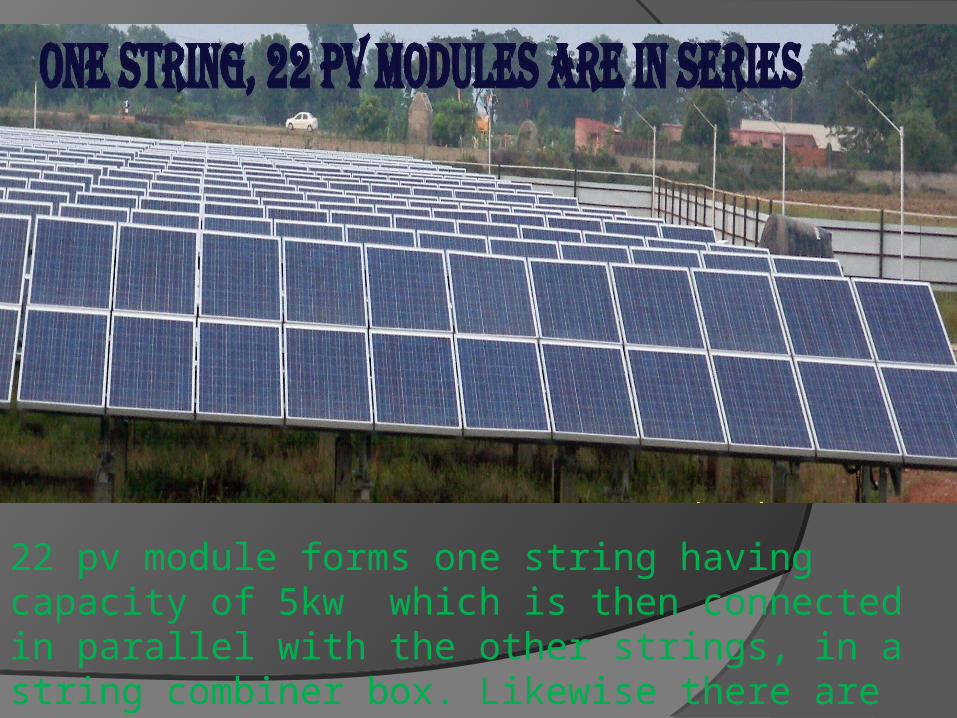
22 pv module forms one string having capacity of 5kw which is then connected in parallel with the other strings, in a string combiner box. Likewise there are 200 strings placed parallely.

String combiner box which combines 6 to 10 strings of an array according to the design.

Main junction box a and b is a junction box in between array area and inverter it divides the array into two equal parts having 500kw capacity each.

Inverter 1 and 2 having capacity of 500kw each. Which converts dc power to ac power. Out put voltage 300v (A.C)Grid synchronization is also done at inverter level

Compact substation . Capacity 1250kva, 0.3/11kv which steps up the voltage level to 11kv for Transmitting the power towards grid.

P.L.C and SCADA for remote monitoring of all the equipments and generation details.

WEATHER MONITORING STATION

SINGLE LINE DIAGRAM.

Sun is an inexhaustible source of energy but till the last decade its use was not widespread .
SNM Solar has come up with a new project of capturing and supplying solar energy to serve the society.

Thank you…


![WELCOME [enoggera.scoutsqld.com.au]enoggera.scoutsqld.com.au/Welcome Kit/Welcome Kit.pdfROVER CREW (18-26 yrs) ... WELCOME KIT LIST OF CONTENTS 1. WELCOME LETTER ... Proficiency Badges](https://static.fdocuments.us/doc/165x107/5ab4ec247f8b9ab47e8c5e81/welcome-kitwelcome-kitpdfrover-crew-18-26-yrs-welcome-kit-list-of-contents.jpg)