WEKA - Explorer (sumber: WEKA Explorer user Guide for Version 3-5-5)
21
WEKA - Explorer (sumber: WEKA Explorer user Guide for Version 3-5-5)
-
Upload
hector-pierce -
Category
Documents
-
view
235 -
download
3
Transcript of WEKA - Explorer (sumber: WEKA Explorer user Guide for Version 3-5-5)
WEKA - Explorer
(sumber: WEKA Explorer user Guide for Version 3-5-5)

Applications - Explorer
Explorer - Panels
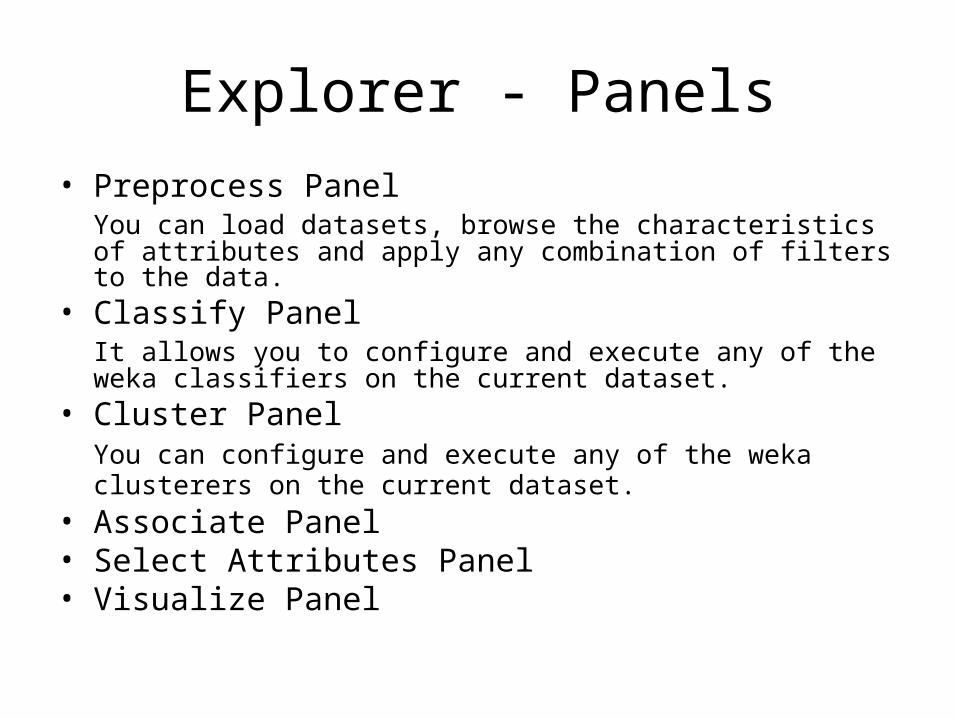
• Preprocess PanelYou can load datasets, browse the characteristics of attributes and apply any combination of filters to the data.
• Classify PanelIt allows you to configure and execute any of the weka classifiers on the current dataset.
• Cluster PanelYou can configure and execute any of the weka clusterers on the current dataset.
• Associate Panel• Select Attributes Panel• Visualize Panel

Explorer - Informations
• Status Box: appears at the very bottom of the window1. Memory information: display in the log box the amount of
memory available to WEKA.2. Run garbage collector: search for memory that is no longer
needed and free it up, allowing more memory for new tasks. Log Button: brings up a separate window containing a scrollable text field.
• Status Icon– No processes are running-> the bird sits down and takes a nap.– Any process is started-> the bird starts moving around.
Preprocess

Preprocess ..
• Open fileto browse for the data file (Weka's ARFF format, CSV format, C4.5 format, or serialized Instances format) on the local filesystem
• Open URLasks for a URL address for where the data is stored
• Open DBreads data from a database
• Generateto generate artificial data from a variety of DataGenerators
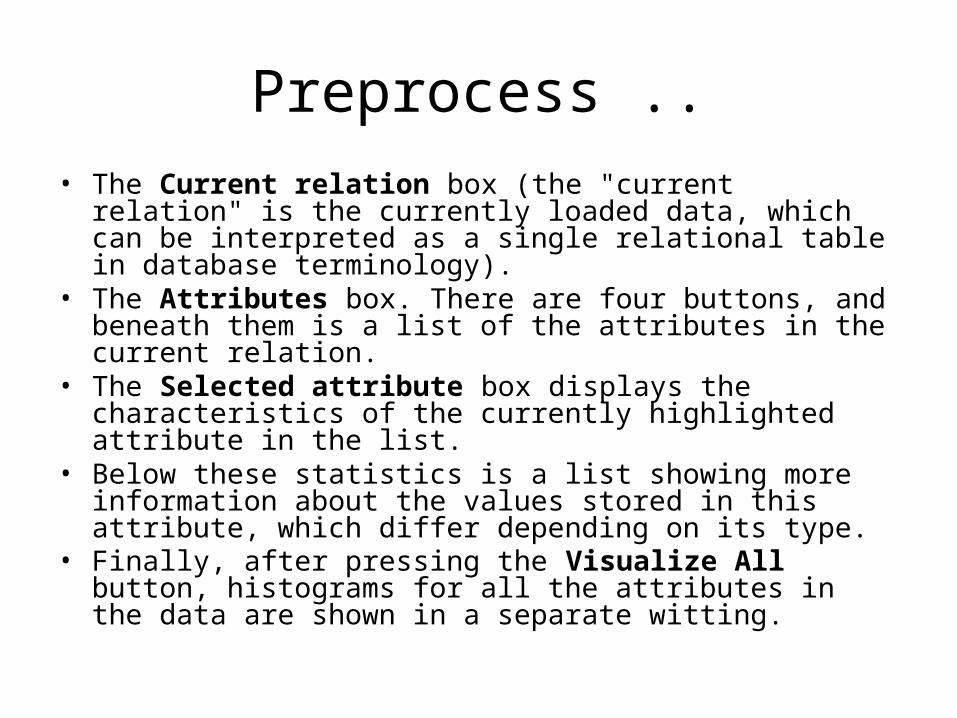
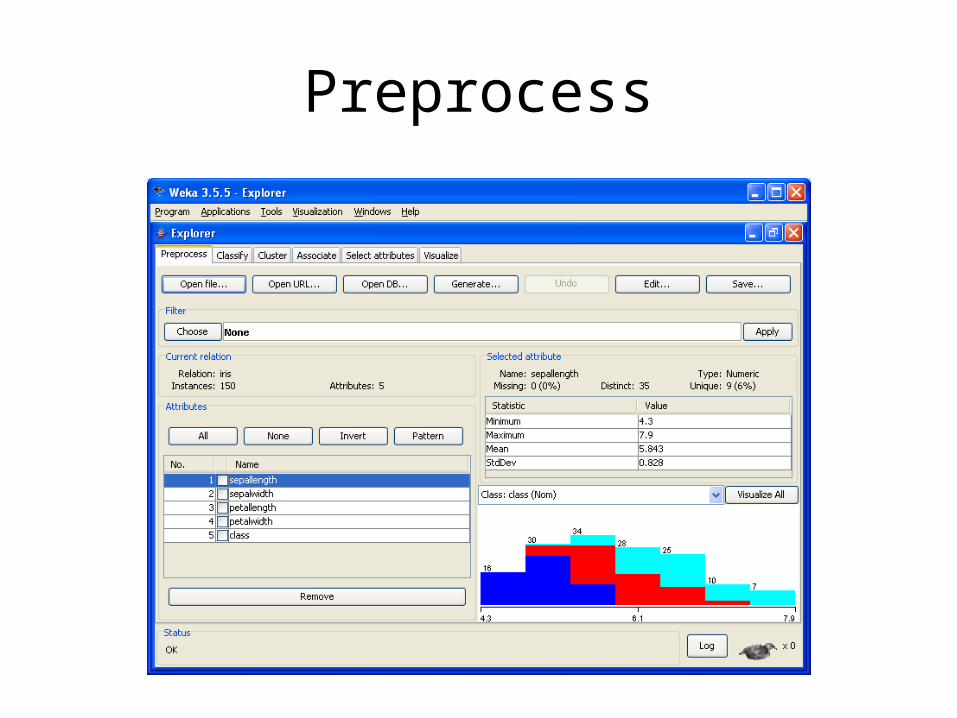
Preprocess ..• The Current relation box (the "current relation" is the
currently loaded data, which can be interpreted as a single relational table in database terminology).
• The Attributes box. There are four buttons, and beneath them is a list of the attributes in the current relation.
• The Selected attribute box displays the characteristics of the currently highlighted attribute in the list.
• Below these statistics is a list showing more information about the values stored in this attribute, which differ depending on its type.
• Finally, after pressing the Visualize All button, histograms for all the attributes in the data are shown in a separate witting.
Preprocess ..
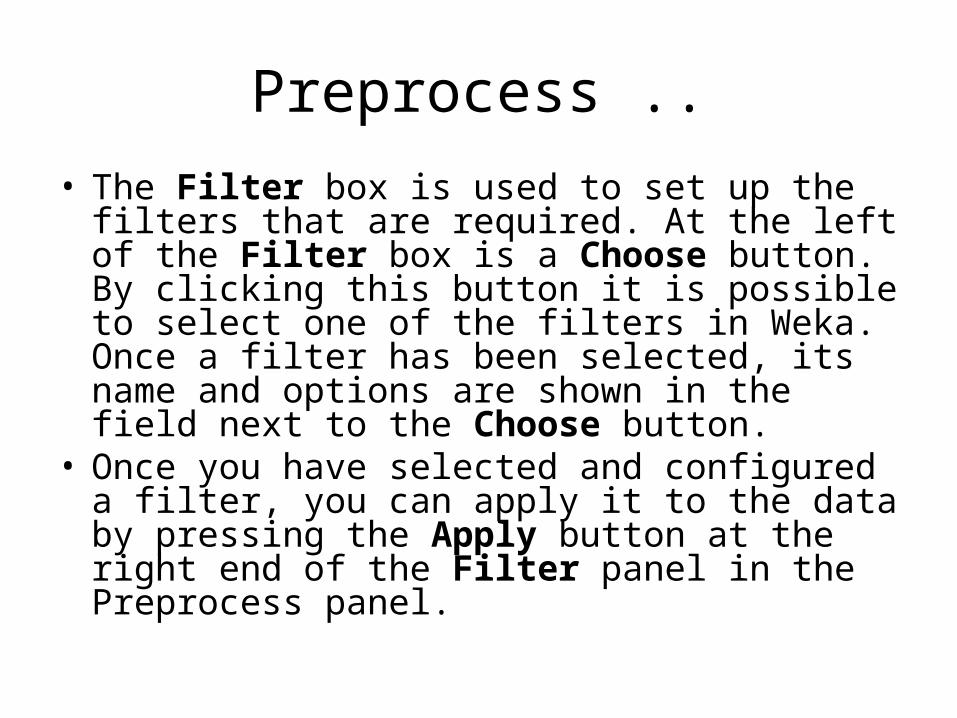
• The Filter box is used to set up the filters that are required. At the left of the Filter box is a Choose button. By clicking this button it is possible to select one of the filters in Weka. Once a filter has been selected, its name and options are shown in the field next to the Choose button.
• Once you have selected and configured a filter, you can apply it to the data by pressing the Apply button at the right end of the Filter panel in the Preprocess panel.
Classify

Classify ..• Selecting a Classifier
Clicking on the text box with the left mouse button brings up a GenericObjectEditor dialog box.
• Test Options– Use training set. evaluated on how well it predicts the class of
the instances it was trained on.– Supplied test set. evaluated on how well it predicts the class of
a set of instances loaded from a file.– Cross-validation. evaluated by cross-validation, using the
number of folds that are entered. – Percentage split. evaluated on how well it predicts a certain
percentage of the data which is held out for testing.

Classify ..
• More options …1. Output model. The classification model on the full
training set is output so that it can be viewed, visualized, etc.
2. Output per-class stats. The precision/recall and true/false statistics for each class are output.
3. Output entropy evaluation measures. Entropy evaluation measures are included in the output.
4. Output confusion matrix. The confusion matrix of the classifier's predictions is included in the output.

Classify ..
• More options …5. Store predictions for visualization. The classifier's
predictions are remembered so that they can be visualized.
6. Output predictions. The predictions on the evaluation data are output.
7. Cost-sensitive evaluation. The errors is evaluated with respect to a cost matrix. The Set... allows you to specify the cost matrix used.
8. Random seed for xval / % Split. This specifies the random seed used when randomizing the data before it is divided up for evaluation.
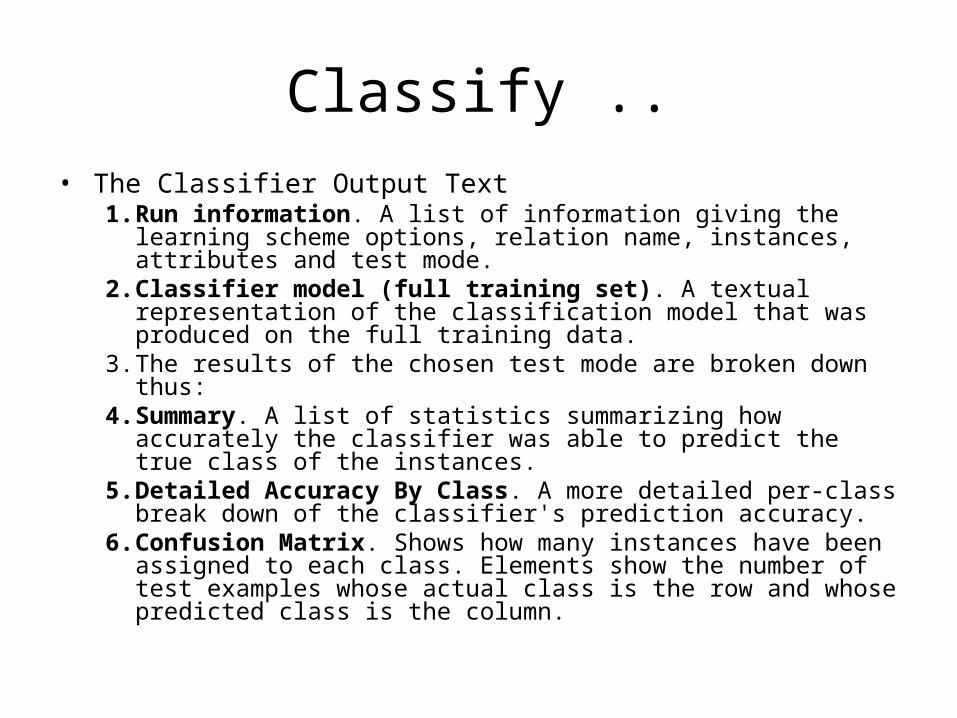
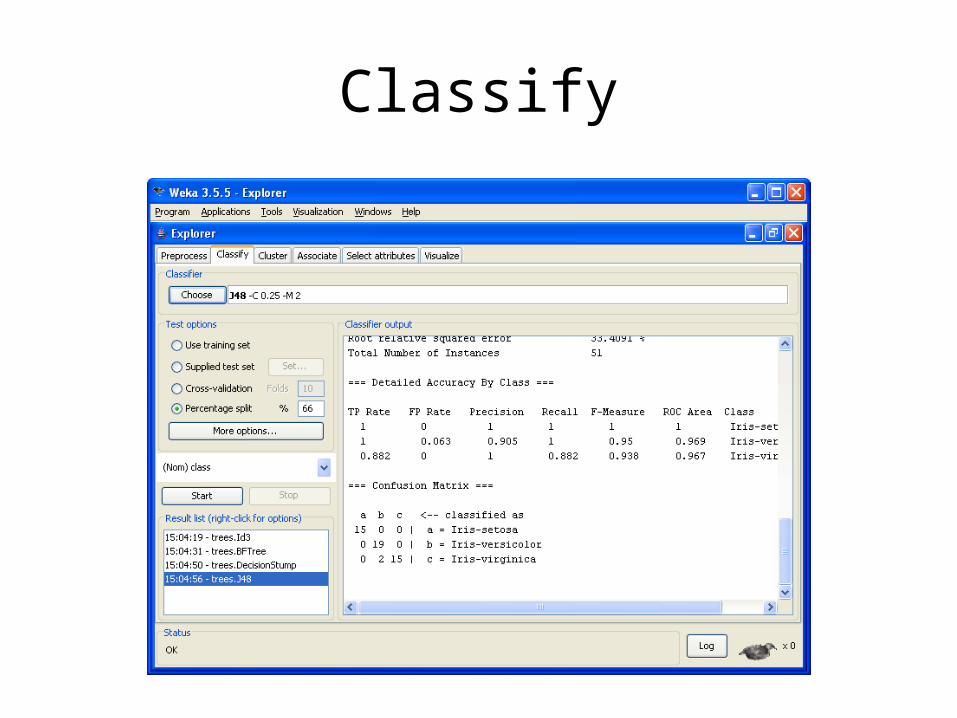
Classify ..• The Classifier Output Text
1. Run information. A list of information giving the learning scheme options, relation name, instances, attributes and test mode.
2. Classifier model (full training set). A textual representation of the classification model that was produced on the full training data.
3. The results of the chosen test mode are broken down thus: 4. Summary. A list of statistics summarizing how accurately the classifier
was able to predict the true class of the instances. 5. Detailed Accuracy By Class. A more detailed per-class break down of
the classifier's prediction accuracy.6. Confusion Matrix. Shows how many instances have been assigned to
each class. Elements show the number of test examples whose actual class is the row and whose predicted class is the column.

Classify ..
• The Result List1. View in main window.2. View in separate window.3. Save result buffer.4. Load model.5. Save model.6. Re-evaluate model on current test set. Takes the model that
has been built and tests its performance on the data set that has been specified with the Set.. button under the Supplied test set option.
7. Visualize classifier errors. Brings up a visualization window that plots the results of classification. Correctly classified instances are represented by crosses, whereas incorrectly classified ones show up as squares.

Classify ..
• The Result List1. Visualize tree or Visualize graph. 2. Visualize margin curve. Generates a plot illustrating the
prediction margin. The margin is defined as the difference between the probability predicted for the actual class and the highest probability predicted for the other classes.
3. Visualize threshold curve. Generates a plot illustrating the tradeoffs in prediction that are obtained by varying the threshold value between classes.
4. Visualize cost curve. Generates a plot that gives an explicit representation of the expected cost).
5. Plugins. This menu item only appears if there are Explorer visualization plugins available (by default: none).
Cluster
• Selecting a Clusterer• Cluster Modes
– Classes to clusters evaluation, compares how well the chosen clusters match up with a pre-assigned class in the data. The drop-down box below this option selects the class, just as in the Classify panel.
• Ignore Attributes - brings up a small window that allows you to select which attributes are ignored.

Explorer - Panels
• Preprocess Panel• Classify Panel• Cluster Panel• Associate Panel
You can mine the current dataset for association rules using the weka associators.
• Select Attributes PanelIt allows you to configure and apply any combination of weka attribute evaluator and search method to select the most pertinent attributes in the dataset.
• Visualize PanelIt displays a scatter plot matrix for the current dataset.

Associate
• Setting Up This panel contains schemes for learning association rules, and the learners are chosen and configured in the same way as the clusterers, filters, and classifiers in the other panels.
• Learning Associations Once appropriate parameters for the association rule learner have been set, click the Start button. When complete, right-clicking on an entry in the result list allows the results to be viewed or saved.

Select Attributes• Searching and Evaluating
Attribute selection involves searching through all possible combinations of attributes in the data to find which subset of attributes works best for prediction. – The evaluator determines what method is used to assign a worth
to each subset of attributes. – The search method determines what style of search is
performed.• Attribute Selection Mode
– Use full training set.– Cross-validation. The Fold and Seed fields set the number of
folds to use and the random seed used when shuffling the data.

Visualize
• The scatter plot matrix When you select the Visualize panel, it shows a scatter plot matrix for all the attributes, color coded according to the currently selected class. It is possible to change the size of each individual 2D plot and the point size, and to randomly jitter the data (to uncover obscured points). It also possible to change the attribute used to color the plots, to select only a subset of attributes for inclusion in the scatter plot matrix, and to sub sample the data.
• Selecting an individual 2D scatter plot When you click on a cell in the scatter plot matrix, this will bring up a separate window with a visualization of the scatter plot you selected.

Visualize ..• Selecting Instances
There may be situations where it is helpful to select a subset of the data using the visualization tool.
• A group of data points can be selected in four ways: – Select Instance. Clicking on an individual data point brings up
a window listing its attributes.– Rectangle. You can create a rectangle, by dragging, that
selects the points inside it. – Polygon. You can build a free-form polygon that selects the
points inside it. Left-click to add vertices to the polygon, right-click to complete it.
– Polyline. You can build a polyline that distinguishes the points on one side from those on the other. Left-click to add vertices to the polyline, right-click to finish.