WEEKLY SHIPPING MARKET REPORT - …files.irwebpage.com/reports/shipping/0jJNJj2XYB/Week 30...
18
WEEKLY SHIPPING MARKET REPORT WEEK 30 - 23 rd July – to 30 th July 2012 - Legal Disclamer The information contained herein has been obtained by various sources. Although every effort has been made to ensure that this information is accurate, complete and up to date, Shiptrade Services S.A. does not accept any responsibility whatsoever for any loss or damage occasioned or claimed, upon reliance on the information, opinions and analysis contained in this report. Researched and compiled by: Shiptrade Services SA, Market Research on behalf of the Sale & Purchase, Dry Cargo Chartering and Tanker Chartering Departments. For any questions please contact: [email protected] Shiptrade Services SA Tel +30 210 4181814 [email protected] 1st Floor, 110/112 Notara Street Fax +30 210 4181142 [email protected] 185 35 Piraeus, Greece www.shiptrade.gr [email protected]
Transcript of WEEKLY SHIPPING MARKET REPORT - …files.irwebpage.com/reports/shipping/0jJNJj2XYB/Week 30...
WEEKLY SHIPPING
MARKET REPORT WEEK 30
- 23rd July – to 30th July 2012 -
Legal Disclamer
The information contained herein has been obtained by various sources. Although every effort has been made to ensure that this information is accurate, complete and up to date, Shiptrade Services S.A. does not accept any responsibility whatsoever for any loss or damage occasioned or claimed, upon reliance on the information, opinions and analysis contained in this report.
Researched and compiled by: Shiptrade Services SA, Market Research on behalf of the Sale & Purchase, Dry Cargo Chartering and Tanker Chartering Departments. For any questions please contact: [email protected]
Shiptrade Services SA Tel +30 210 4181814 [email protected] 1st Floor, 110/112 Notara Street Fax +30 210 4181142 [email protected] 185 35 Piraeus, Greece www.shiptrade.gr [email protected]

1
West Australia’s Grain Harvest Seen Dropping 40% on Weather
Grain output in Western Australia, the country’s biggest wheat grower, may drop 40 percent as dry weather and frost threaten crops just as a drought in the U.S. pushes prices to the highest since 2008. Futures extended gains. Total production may be 9 million to 11 million metric tons in 2012-2013, according to Max Johnson, grain operations manager at CBH Group, the state’s biggest handler. That compares with a record harvest of 15 million tons a year earlier. About 65 percent to 70 percent of the crop may be wheat, Johnson said. Wheat is poised for the biggest monthly gain in two years, and corn extended a record rally today, as the U.S. drought and heat waves in Europe hurt harvest prospects. Surging prices have increased concern world food costs will rebound. Wheat yields in Russia have dropped 31 percent, Interfax reported last week. “We need an extended rainfall all the way through the end of September to even try and get it back on track,” Johnson said by phone from Perth on July 27. “We’ve seen frost after frost after frost all the way over the Wheatbelt that has retarded growth or put it in dormancy. That’s hurting us.” Wheat for September delivery gained as much 2.4 percent to $9.1975 a bushel on the Chicago Board of Trade and was at $9.1525 at 5:35 p.m. in Singapore, 21 percent higher this month. The price hit $9.4725 on July 23, the highest since August 2008. Corn rallied as much as 3 percent to $8.1725 a bushel today. Cooler Temperatures Most of Western Australia had below-average rainfall from April to June and has been exceptionally dry in July, according to David Jones, the Melbourne-based head of climate monitoring and prediction at the Bureau of Meteorology. The state also had cooler-than-normal minimum temperatures in January through June, according to the bureau. The harvest usually starts in October. Australia may produce 24.1 million tons of wheat in 2012- 2013, 6.2 percent lower than an earlier estimate, and less than last year’s record 29.5 million ton crop, the Australian Bureau of Agricultural and Resource Economics and Sciences said June 13. Western Australia may harvest 8.7 million tons of wheat from 11.7 million tons a year earlier, it said. In 2010-2011, dry weather cut Western Australia’s wheat production by 38 percent. World wheat output may drop to 664.6 million tons in 2012- 2013 from 695.9 million tons in 2011-2012, the International Grains Council said on July 26. The outlook for Russia’s harvest was cut to 45 million tons from 49 million tons at the start of the month and down from 56.2 million tons in 2011-2012. Russian Supply In Russia, with grain crops gathered from 24 percent of the sown area, the wheat harvest reached 19.4 million tons, about 11 percent more than a year earlier, the Agriculture Ministry said on its website today. Total grain output was 24.8 million tons as of July 26, down by about 2 percent, it said. About 60 percent of U.S. spring wheat was rated good or excellent as of July 22, from 65 percent a week earlier, U.S. Department of Agriculture data show, while corn is in the worst shape since 1988. The U.S. is the biggest shipper of both crops. Surging corn prices prompted Japan, the largest buyer, to boost feed-wheat purchases to 334,349 tons in the first five months of this year, from 62,415 tons a year earlier, according to data from the finance
ministry. In Western Australia, the state’s western grain-growing regions may get as much as 10 millimeters of rain in the four days to Aug. 2, according to the Bureau of Meteorology. “Three or four weeks of good weather and it could bounce up very quickly,” Johnson said. “Wheat is a very resilient grain.” (Bloomberg)
Clean tanker rates stay muted, freight demand light
Transatlantic tanker rates for refined petroleum products on top export routes inched lower with underlying weakness and a glut of vessels still capping gains in the transatlantic market. Rates for medium-range tankers for 37,000 tonne cargoes from Rotterdam to New York moved to W103.33, or $2,662 a day when translated into average earnings, from W105.00 or $3,183 a day on Friday and W91.46 or -$20 a day last Monday. Average earnings per day are calculated after a vessel covers its voyage costs such as bunker fuel and port fees. Negative rates indicate costs are greater than earnings. "MR rates modestly improved above their prior loss making levels, as U.S. Gulf export demand increased. However, earnings still remain at a depressed rate," Deutsche Bank said In April last year, rates reached their highest since 2008 on a jump in U.S. gasoline demand, helping reduce the number of tankers available for hire. Since then, average earnings have remained volatile. "An open transatlantic gasoline arbitrage and a subsequent influx of cargoes instilled a degree of bullishness in MR owners with tonnage in the UKC (UK Continent) last week. A number of charterers were forced to pay premiums for prompt tonnage that lifted the overall market," broker SSY said. "This only took (earnings) up to $3,000/day, however, emphasising how depressed the market has been of late." Analysts said reduced refinery capacity in the Atlantic Basin could boost long-haul demand for the wider products tanker sector in coming years, helped by the delivery of fewer tankers. Typical Long Range 2 or LR2, 75,000 tonne shipments on the Middle East Gulf to Japan route were at 107.91 on Monday in the worldscale measure of freight rates, from W108.05 on Friday and W107.86 last Monday. Earlier this month rates hit their highest level since late October of 2011. "LR2s have seen irregular and erratic levels of activity. The tonnage lists are unquestionably a lot tighter, however rates appear to be settled although owners are still pushing to get rates higher," broker Braemar Seascope said. Long Range 1 tankers, carrying 55,000 tonne loads from the Middle East Gulf to Japan, were at W130.50 on Monday, from W130.58 on Friday and W127.42 last Monday. "LR1s continue to outperform in the product sector, as Japanese product import demand, particularly naphtha, has buoyed rates," Deutsche Bank said. In the Mediterranean, 30,000 tonne shipments ex-Algeria to southern Europe were at W138.72 on Monday, versus W139.89 on Friday and W132.78 last Monday. (Reuters)
Shipping , Commodities & Financial News

2
In Brief: Negative week for all sizes worldwide Capes: Further decrease in rates. Rates kept falling in both basins with the BCI closed at 1209, reporting a decline of 67 points and the average of the 4TC routes ended up at USD 4,740 decreased more than USD 500 compare to last week. The atlantic market have suffered from the oversupply of tonnage mainly due to ballasters. In this respect, fronthaul have seen a reduction of USD 750 fixing at USD 22,000 whereas the transantlantic round voyage declined by USD 750 closing at USD 4,500. The same pattern applied in the pacific basin, despite the fact that Australian iron trade covered notable number of vessels. The round trips closed at USD 4,500 kept falling for one more week. Period activity has been stable fixing at around USD 10,500 levels.
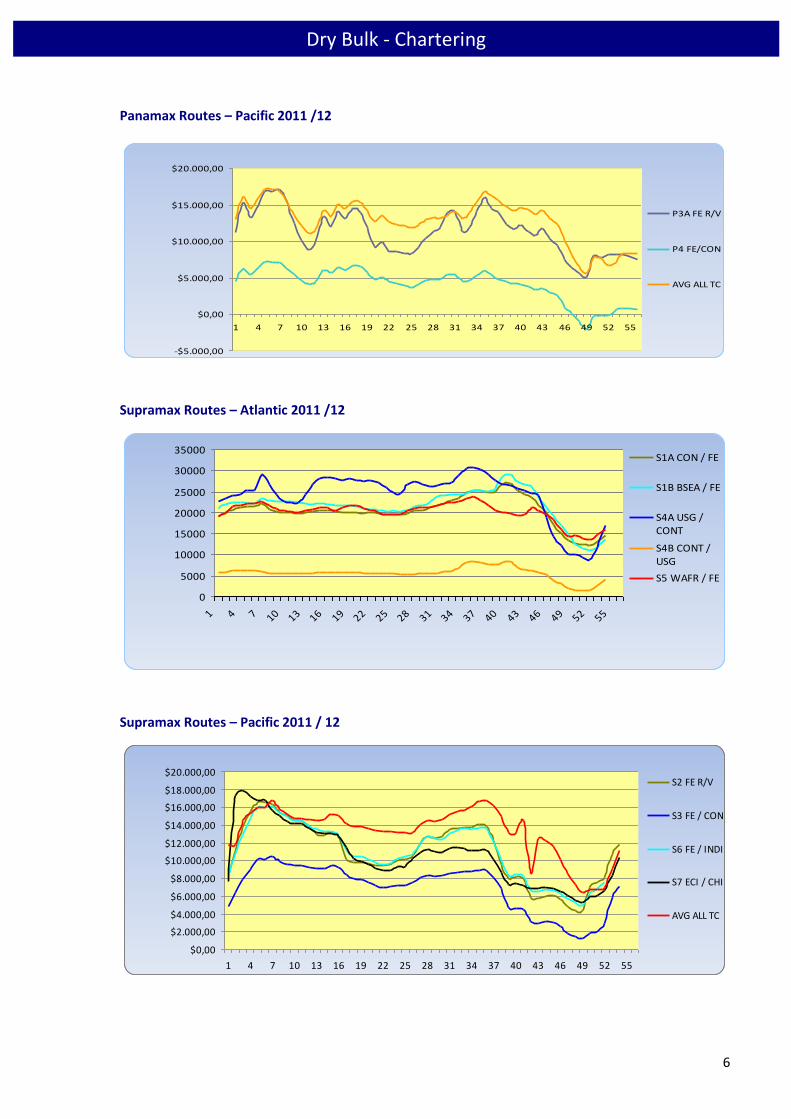
Panamax: Market declined softly in both basins. There was a rather negative sentiment during this week as far as rates were concerned, as we saw a lot of spot tonnage and very few requirements especially in the Atlantic. Transantlantic rounds were seen closing at USD 8,000-8,250 levels. Fronthauls basis delivery aps ECSA were mostly fixed at USD 16,000-17,000 + about 500k bb. In the Pacific basin rates kept sliding marginally compared to last week. Although there were some quick fixtures reported in the beginning of the week at USD 9,000, especially for NOPAC rounds, the overall negative scene was not much affected. Thus, rates for East Australia and Indonesian rounds were seen closing at USD 7,750-8,250. Short period market on the other hand is still not so attractive to owners. We saw very few fixtures at around USD 9,000 daily for 4/6 months.
Supramax: Negative sentiment in both basins
Market continued its slow but steady fall compared to last week in the Atlantic region. Transatlantic rounds were seen closing at USD 11,5/12,000. Most fronthaul trips were fixed at USD 21/21,500 levels whilst there were some fixtures reported ex USG to Continent at USD 20,000. In the pacific basin, India market is still very slow due to the monsoon season, with fixtures at USD 9,000 and USD 6,000 daily for WCI and ECI to China respectively. Indonesian and NOPAC rounds were seen closing at USD 8,000. Short period is yet not so active with fixtures at USD 10/10,500 levels. Handysize: Rates dropped further This was a very slow week for the handies as few firm orders came out while there was an oversupply of vessels in both basins. In the Atlantic, the round voyage was done at around USD 10/10,500 levels, and owners that were asking mid/high teens for trips ex ECSA to Med/Cont had to decrease their ideas to low teens in order to compete. Trips ex Brazil to India were paying around mid teens basis aps while Black Sea calmed down compared to the week before. Pacific continued to slump with many open vessels, especially in North China and ECI, and the round trip was done at around USD 5,5/6000. Clinker and iron ore orders ex SEASIA to ECI and China were once again paying very low ranging from USD 14/16 pmt. Periods were slow with a handy reported at USD 10,900 for 1 year basis delivery Continent.
Dry Bulk - Chartering

3
Baltic Indices – Dry Market (*Friday’s closing values)
Index Week 30 Week 29 Change (%) BDI 933 1037 -10,03
BCI 1209 1276 -5,25
BPI 1031 1156 -10,81
BSI 1069 1192 -10,32
BHSI 602 657 -8,37
T/C Rates (1 yr - $/day)
Type Size Week 30 Week 29 Change (%)
Capesize 160 / 175,000 10500 10500 0,00
Panamax 72 / 76,000 10000 10000 0,00
Supramax 52 / 57,000 10250 10000 2,50
Handysize 30 / 35,000 7250 7250 0,00
Average Spot Rates
Type Size Route Week 30 Week 29 Change %
Capesize 160 / 175,000
Far East – ATL -12000 -12000 -
Cont/Med – Far East 22000 22750 -3,30
Far East RV 4500 5250 -14,29
TransAtlantic RV 4500 5250 -14,29
Panamax 72 / 76,000
Far East – ATL -250 150 -
ATL / Far East 17000 17750 -4,23
Pacific RV 7750 8500 -8,82
TransAtlantic RV 8250 10250 -19.51
Supramax 52 / 57,000
Far East – ATL 3500 4000 -12,50
ATL / Far East 21500 24000 -10,42
Pacific RV 8000 8500 -5,88
TransAtlantic RV 11500 14750 -22,03
Handysize 30 / 35,000
Far East – ATL 4550 5000 -9,00
ATL / Far East 17500 18250 -4,11
Pacific RV 5750 6500 -11,54
TransAtlantic RV 10250 10500 -2,38
Dry Bulk - Chartering

4
ANNUAL
MAY 2012 – JULY 2012
Dry Bulk - Chartering

5
Dry Bulk - Chartering
Capesize Routes – Atlantic 2011 / 12
$0,00
$5.000,00
$10.000,00
$15.000,00
$20.000,00
$25.000,00
$30.000,00
$35.000,00
$40.000,00
1 4 7 10 13 16 19 22 25 28 31 34 37 40 43 46 49 52 55
C2 TUB/ ROT
C4RBAY /ROTC7 BOL/ ROT
C8 T/ARV
AVGALL TC
Capesize Routes – Pacific 2011 / 12
$0,00
$10.000,00
$20.000,00
$30.000,00
$40.000,00
$50.000,00
$60.000,00
1 4 7 10 13 16 19 22 25 28 31 34 37 40 43 46 49 52 55
C3 TUB /PRC
C5 WAUST /PRC
C9 CONT /FE
C10 FE R/V
Panamax Routes – Atlantic 2011 / 12
0
5000
10000
15000
20000
25000
30000
1 4 7 10 13 16 19 22 25 28 31 34 37 40 43 46 49 52 55
P1A T/A RV
P2ACONT/FE
6
Dry Bulk - Chartering
Panamax Routes – Pacific 2011 /12
-$5.000,00
$0,00
$5.000,00
$10.000,00
$15.000,00
$20.000,00
1 4 7 10 13 16 19 22 25 28 31 34 37 40 43 46 49 52 55
P3A FE R/V
P4 FE/CON
AVG ALL TC
Supramax Routes – Atlantic 2011 /12
0
5000
10000
15000
20000
25000
30000
35000
1 4 7 10 13 16 19 22 25 28 31 34 37 40 43 46 49 52 55
S1A CON / FE
S1B BSEA / FE
S4A USG /CONT
S4B CONT /USG
S5 WAFR / FE
Supramax Routes – Pacific 2011 / 12
$0,00
$2.000,00
$4.000,00
$6.000,00
$8.000,00
$10.000,00
$12.000,00
$14.000,00
$16.000,00
$18.000,00
$20.000,00
1 4 7 10 13 16 19 22 25 28 31 34 37 40 43 46 49 52 55
S2 FE R/V
S3 FE / CON
S6 FE / INDI
S7 ECI / CHI
AVG ALL TC

7
VLCC: With fresh requirements slowly entering the market, and owners competing for employment the trend
remained negative. Chinese bound voyages declined with only a few fixtures reported. And the only positive
picture was that in the Caribs USG range with vessels bound for India which strengthened the rates as cargoes
lost from Iran needed to be replaced.
Suezmax: The WAFR – USAC route remained steady this week, although the enrichment of availability of
tonnages in the area does not create room for positive expectations.
Aframax: Caribbean rates increased by a further 2.5 points last week with tonnages abrsorbing fresh cargoes.
Panamax: CBS-USAC rates gained 25 points due to increasing activity in the area which provides a positive
sentiment for the imminent future.
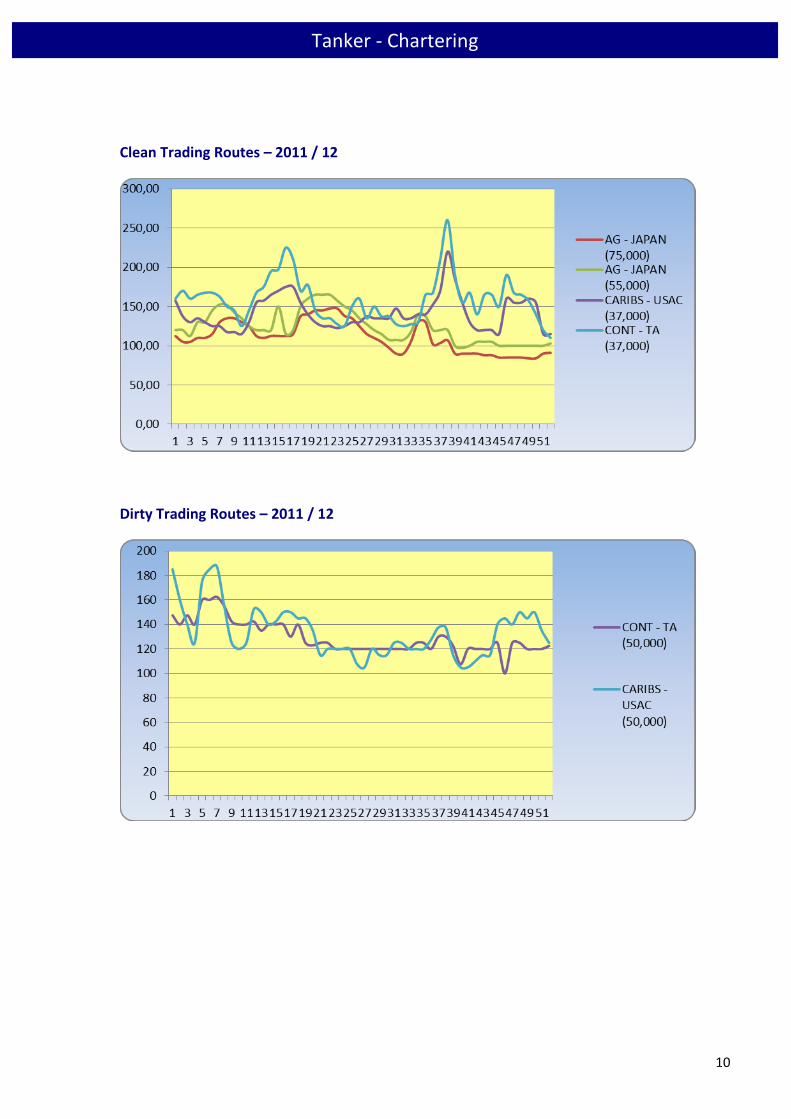
Products: Caribbean MR market slowed down last week as did the ex USG activity also. The positive sign of the
week was the European Market with CONT-USAC route gaining 15 points.
Baltic Indices – Wet Market (*Friday’s closing values)
Index Week 30 Week 29 Change (%)
BCTI 582 560 3,93
BDTI 643 624 3,04
T/C Rates (1 yr - $/day)
Type Size Week 30 Week 29 Change (%)
VLCC 300.000 23,000 23,000 0,00
Suezmax 150.000 19,500 16,750 16,42
Aframax 105.000 13,500 13,500 0,00
Panamax 70.000 12,750 12,750 0,00
MR 47.000 13,250 13,500 -1,85
Tanker - Chartering

8
Crude Tanker Average Spot Rates
Type Size (Dwt) Route Week 30 WS
Week 29 WS
Change %
VLCC
280,000 AG – USG 24 24 0,00
260,000 W.AFR – USG 41,5 41,5 0,00
260,000 AG – East / Japan 34 34 0,00
Suezmax 135,000 B.Sea – Med 72,5 72,5 0,00
130,000 WAF – USAC 62,5 62,5 0,00
Aframax
80,000 Med – Med 80 85 -5,88
80,000 N. Sea – UKC 87,5 87,5 0,00
80,000 AG – East 107 107 0,00
70,000 Caribs – USG 97,5 95 2,63
Product Tanker Average Spot Rates
Type Size (Dwt) Route Week 30 WS
Week 29 WS
Change %
Clean
75,000 AG – Japan 107 107 0,00
55,000 AG – Japan 131 121 8,26
38,000 Caribs – USAC 97,5 100 -2,50
37,000 Cont – TA 105 90 16,67
Dirty
55,000 Cont – TA 105 100 5,00
50,000 Caribs – USAC 115 90 27,78
Tanker - Chartering

9
VLCC Trading Routes 2011 / 12
Suezmax Trading Routes 2011 / 12
Aframax Trading Routes 2011 / 12
Tanker - Chartering
10
Clean Trading Routes – 2011 / 12
Dirty Trading Routes – 2011 / 12
Tanker - Chartering

11
S&P activity stabilizing
Although it was the last week of august the activity showed some signs of stability, with owners still there to offer and
acquire candidates at attractive pricings.
This weeks’ Shiptrade enquiry Index showed some increase for handysize tonnages this week, with interest for panamaxes
and handymax remaining in the dry sector. In the wet sector MR tankers remain the most required sizehowever there has
been some notable interest for stainless steel tankers.
Contrary to various reports, panamax bulk carrier “Golden Glory” )abt 70.000 dwt built 1996 Japan) has not been sold at the
reported levels of USD mid 9 mill. Although such levels have been achieved earlier this month when her owners where
inviting offers, but where considered to be on the low side by the sellers as she had a higher book value, and the vessel has
been withdrawn from the market.
Furthermore we are expecting to hear the news regarding the levels achieved for Handymax Bulk Carrier “Global Ocean”
(45.000 dwt built 1997 Japan) as offers where invited by today 31st
July.
NEWBUILDINGS
In the newbuilding market, we have seen 10 vessels reported to have been contracted.
4 Bulk carriers (Ultramax)
6 Container vessels (2000 TEU’s)
DEMOLITION
Bangladesh buyers remained on similar levels and have been keen to purchase tonnages in this last week. In India the Court
has ruled that vessels containing hazardous materials will not be allowed to beach any more. Pakistan was active in the last
week, providing indications to owners willing to sell. Chinese market was very slow, with indications remaining at quite low
levels with regard to competition.
Sale & Purchase

12
Indicative Market Values – ( 5 yrs old / Mill $ )
Bulk Carriers
Week 30 Week 29 Change %
Capesize 34 34 0.00
Panamax 22 22 0.00
Supramax 19 19 0.00
Handysize 17 17 0.00
Tankers
VLCC 58 58 0.00
Suezmax 44 44 0.00
Aframax 27 27 0.00
Panamax 27 27 0.00
MR 23 23 0.00
Weekly Purchase Enquiries
SHIPTRADE P/E WEEKLY INDEX
0
50
100
150
200
250
300
350
01-07/3/201
1
08-14/3/201
1
15-21/03/20
11
22-28/03/20
11
29/03
-4/4/201
1
5/4/-11/4/20
11
12-18/4/201
1
19-25/4/201
1
26/4-2/5/2011
3-9/5/2011
10-16/5/201
1
17-23/5/201
1
24-30/5/201
1
31/5-6/6/2011
7-13/6/2011
14-20/6/201
1
21-27/6/201
1
28/6-4/7/2011
5-11/7/2011
12-18/7/201
1
19-25/7/201
1
26/7-1/8/2011
2-8/8/2011
9-15/8/2011
16-21/8/201
1
22-29/8/201
1
30/8-05/9/201
1
06-12/9/201
1
13-19/9/201
1
20-26/9/201
1
27/9-3/10/201
1
4-10/10/201
1
11-17/10/20
11
18-24/10/20
11
25-31/10/20
11
1-7/11/2011
8-14/11/201
1
15-21/11/20
11
22-28/11/20
11
29/11
-5/12/20
11
6-12/12/201
1
13-19/12/20
11
20-26/12/20
11
27/12
/2011
-9/1/2012
10-16/1/201
2
17-23/1/201
2
24-30/1/201
2
31/1-6/2/2012
7-13/2/2012
14-20/02/20
12
21-27/02/20
12
28/2-5/03/201
2
6-12/03/201
2
13-19/03/20
12
20-26/03/20
12
27/3-2/4/2012
3-9/4/2012
10-16/4/201
2
17-23/4/201
2
24/4-1/5/2012
2-8/5/2012
9-15/5/2012
16-22/5/201
2
23-29/5/201
2
30/5-5/6/2012
6-12/6/2012
13-19/6/201
2
20-26/6/201
2
27/6-3/7/2012
4/7-10/7/2012
11/7-17/7/201
2
18-24/7/201
2
KOREA CHINA SPORE
KCS GREECE OTHER
SUM Series8 Series9
Series10 Series11 Series12
Series13 Series14
Sale & Purchase

13
Reported Second-hand Sales
Bulk Carriers Name Dwt DoB Yard SS Engine Gear Price Buyer
Sungdong resale 180.000 2012 Sungdong, KOR - MAN-B&W
- 39.5 mill Sinokor
Tsuneishi Zhoushan resale
98.000 2013 Tsuneishi, CHN - MAN-B&W
- 25.5 mill Diana
Hyundai Vinashin resale
55.700 2012 Hyundai, VIET - MAN-B&W
4 X 30 T 20.5 mill Precious
Stella Alnilam 34.529 2010 SPP, KOR 11/2015 MAN-B&W
4 X 35 T 18.3 mill Meadway
Tankers Name Dwt DoB Yard SS Engine Hull Price Buyer
Diamond Champ 107.200 2003 Imabari, JPN 09/2013 B&W DH 15 mill Tanker Pacific
STI Diamond 51.000 2008 STX, KOR 04/2013 MAN-B&W
DH 25.5 mill Greek
En Bloc STI Coral 51.000 2008 STX, KOR 01/2013
MAN-B&W
DH 25.5 mill
Sale & Purchase

14
Newbuilding Orders
No Type Dwt / Unit Yard Delivery Owner Price 4 BC 64.000 Jinling 2014 Queensland -
3 + 3 Container 2.000 Jinhai 2013 Graig -
Newbuilding Prices (Mill $) – Japanese/ S. Korean Yards
Newbuilding Resale Prices
Bulk Carriers
Capesize 45 42
Panamax 31 29
Supramax 29 27
Handysize 23 21
Tankers
VLCC 93 85
Suezmax 60 58
Aframax 47 42
Panamax 40 37
MR 34 31
Newbuilding Resale Prices
Bulk Carriers (2008 – Today) Tankers (2008 – Today)
Newbuildings

15
Demolition Sales
Vessel Type Built Dwt Ldt Buyer Country Price
Triumph Tanker 1984 39.990 10.118 India 425
“as is” Colombo
Pu Fa BC 1984 61.748 10.983 China 350
Demolition Prices ($ / Ldt)
Bangladesh China India Pakistan
Dry 380 310 375 370
Wet 410 330 405 400
Demolition Prices
Bulk Carriers (2008 – Today) Tankers (2008 – Today)
Demolitions
16
Shipping Stocks
Commodities
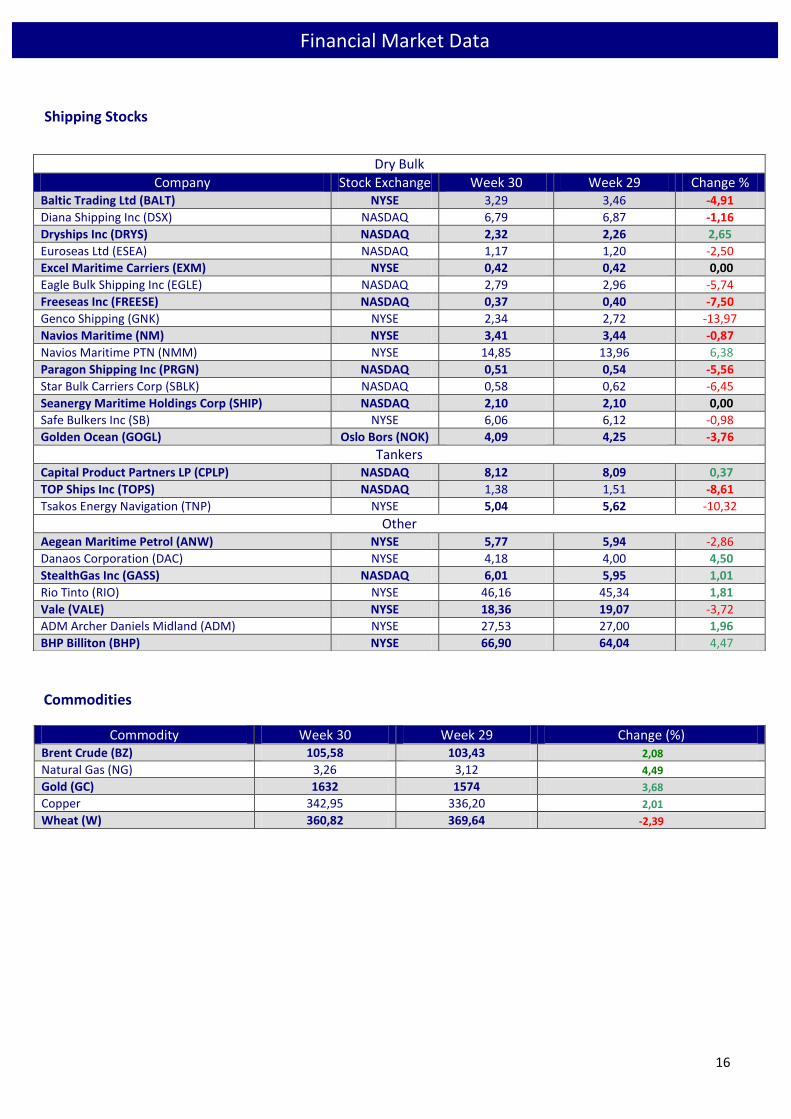
Commodity Week 30 Week 29 Change (%) Brent Crude (BZ) 105,58 103,43 2,08
Natural Gas (NG) 3,26 3,12 4,49
Gold (GC) 1632 1574 3,68
Copper 342,95 336,20 2,01
Wheat (W) 360,82 369,64 -2,39
Dry Bulk
Company Stock Exchange Week 30 Week 29 Change % Baltic Trading Ltd (BALT) NYSE 3,29 3,46 -4,91
Diana Shipping Inc (DSX) NASDAQ 6,79 6,87 -1,16
Dryships Inc (DRYS) NASDAQ 2,32 2,26 2,65
Euroseas Ltd (ESEA) NASDAQ 1,17 1,20 -2,50
Excel Maritime Carriers (EXM) NYSE 0,42 0,42 0,00
Eagle Bulk Shipping Inc (EGLE) NASDAQ 2,79 2,96 -5,74
Freeseas Inc (FREESE) NASDAQ 0,37 0,40 -7,50
Genco Shipping (GNK) NYSE 2,34 2,72 -13,97
Navios Maritime (NM) NYSE 3,41 3,44 -0,87
Navios Maritime PTN (NMM) NYSE 14,85 13,96 6,38
Paragon Shipping Inc (PRGN) NASDAQ 0,51 0,54 -5,56
Star Bulk Carriers Corp (SBLK) NASDAQ 0,58 0,62 -6,45
Seanergy Maritime Holdings Corp (SHIP) NASDAQ 2,10 2,10 0,00
Safe Bulkers Inc (SB) NYSE 6,06 6,12 -0,98
Golden Ocean (GOGL) Oslo Bors (NOK) 4,09 4,25 -3,76
Tankers Capital Product Partners LP (CPLP) NASDAQ 8,12 8,09 0,37
TOP Ships Inc (TOPS) NASDAQ 1,38 1,51 -8,61
Tsakos Energy Navigation (TNP) NYSE 5,04 5,62 -10,32
Other
Aegean Maritime Petrol (ANW) NYSE 5,77 5,94 -2,86
Danaos Corporation (DAC) NYSE 4,18 4,00 4,50
StealthGas Inc (GASS) NASDAQ 6,01 5,95 1,01
Rio Tinto (RIO) NYSE 46,16 45,34 1,81
Vale (VALE) NYSE 18,36 19,07 -3,72
ADM Archer Daniels Midland (ADM) NYSE 27,53 27,00 1,96
BHP Billiton (BHP) NYSE 66,90 64,04 4,47
Financial Market Data

17
Currencies
Week 30 Week 29 Change (%) EUR / USD 1,23 1,22 0,82
USD / JPY 78,46 78,81 -0,44
USD / KRW 1138 1143 -0,44
USD / NOK 6,04 6,09 -0,82
Bunker Prices
IFO 380 IFO 180 MGO Piraeus 625 655 930
Fujairah 630 655 995
Singapore 625 635 890
Rotterdam 608 634 901
Houston 625 655 955
Port Congestion*
Port No of Vessels
China Rizhao 17
Lianyungang 42
Qingdao 75
Zhanjiang 25
Yantai 35
India
Chennai 1
Haldia 18
New Mangalore 4
Kakinada 12
Krishnapatnam 11
Mormugao 7
Kandla 37
Mundra 8
Paradip 14
Vizag 67
South America
River Plate 337
Paranagua 86
Praia Mole 8
* The information above exhibits the number of vessels, of various types and sizes, that are at berth, awaiting anchorage, at
anchorage, working, loading or expected to arrive in various ports of China, India and South America during Week 30 of year
2012.
Financial Market Data / Bunker Prices / Port Congestion