Weekly ncdex report 27 1-2015
6
27/01/2015
-
Upload
capvision-investment-advisory -
Category
Economy & Finance
-
view
58 -
download
0
Transcript of Weekly ncdex report 27 1-2015
27/01/2015
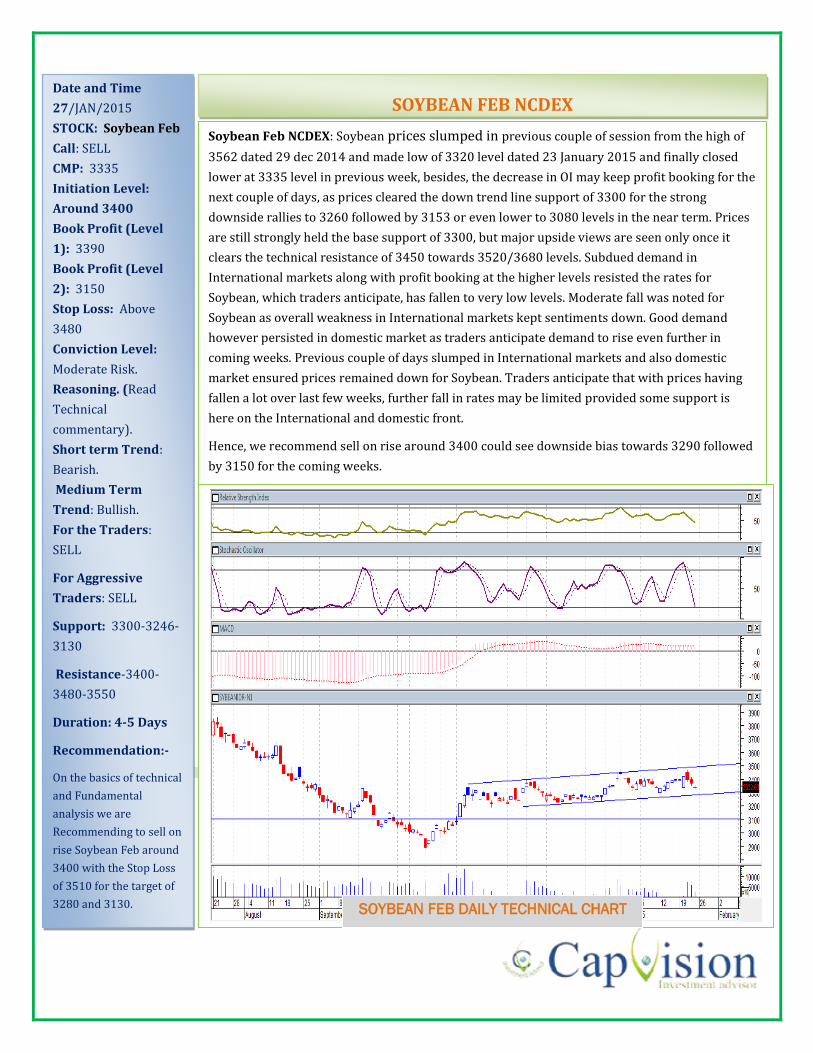
SOYBEAN FEB DAILY TECHNICAL CHART
Date and Time
27/JAN/2015
STOCK: Soybean Feb
Call: SELL
CMP: 3335
Initiation Level:
Around 3400
Book Profit (Level
1): 3390
Book Profit (Level
2): 3150
Stop Loss: Above
3480
Conviction Level:
Moderate Risk.
Reasoning. (Read
Technical
commentary).
Short term Trend:
Bearish.
Medium Term
Trend: Bullish.
For the Traders:
SELL
For Aggressive
Traders: SELL
Support: 3300-3246-
3130
Resistance-3400-
3480-3550
Duration: 4-5 Days
Recommendation:-
On the basics of technical
and Fundamental
analysis we are
Recommending to sell on
rise Soybean Feb around
3400 with the Stop Loss
of 3510 for the target of
3280 and 3130.
SOYBEAN FEB NCDEX
Soybean Feb NCDEX: Soybean prices slumped in previous couple of session from the high of
3562 dated 29 dec 2014 and made low of 3320 level dated 23 January 2015 and finally closed
lower at 3335 level in previous week, besides, the decrease in OI may keep profit booking for the
next couple of days, as prices cleared the down trend line support of 3300 for the strong
downside rallies to 3260 followed by 3153 or even lower to 3080 levels in the near term. Prices
are still strongly held the base support of 3300, but major upside views are seen only once it
clears the technical resistance of 3450 towards 3520/3680 levels. Subdued demand in
International markets along with profit booking at the higher levels resisted the rates for
Soybean, which traders anticipate, has fallen to very low levels. Moderate fall was noted for
Soybean as overall weakness in International markets kept sentiments down. Good demand
however persisted in domestic market as traders anticipate demand to rise even further in
coming weeks. Previous couple of days slumped in International markets and also domestic
market ensured prices remained down for Soybean. Traders anticipate that with prices having
fallen a lot over last few weeks, further fall in rates may be limited provided some support is
here on the International and domestic front.
Hence, we recommend sell on rise around 3400 could see downside bias towards 3290 followed
by 3150 for the coming weeks.
Date and Time
27/Jan/2015
STOCK: Guar seed
Feb
Call: BUY
CMP: 4267
Initiation Level:
AROUND 4230
Book Profit (Level 1):
4280
Book Profit (Level 2):
4380
Stop Loss Below: 4060
Conviction Level:
Moderate Risk.
Reasoning. (Read
Technical commentary).
Short term Trend:
Bearish.
Medium Term Trend:
Bearish.
For the Traders: BUY
For Aggressive
Traders: BUY
Support: 4240-4180-
4070
Resistance-4410-
4530-4680
Duration: 4-5 Days
Recommendation:-
On the basics of Technical
and fundamental analysis
we are Recommending Buy
Guar seed Feb around
4230 for the target of 4380
–4560 with a strict stop
loss of 4060.
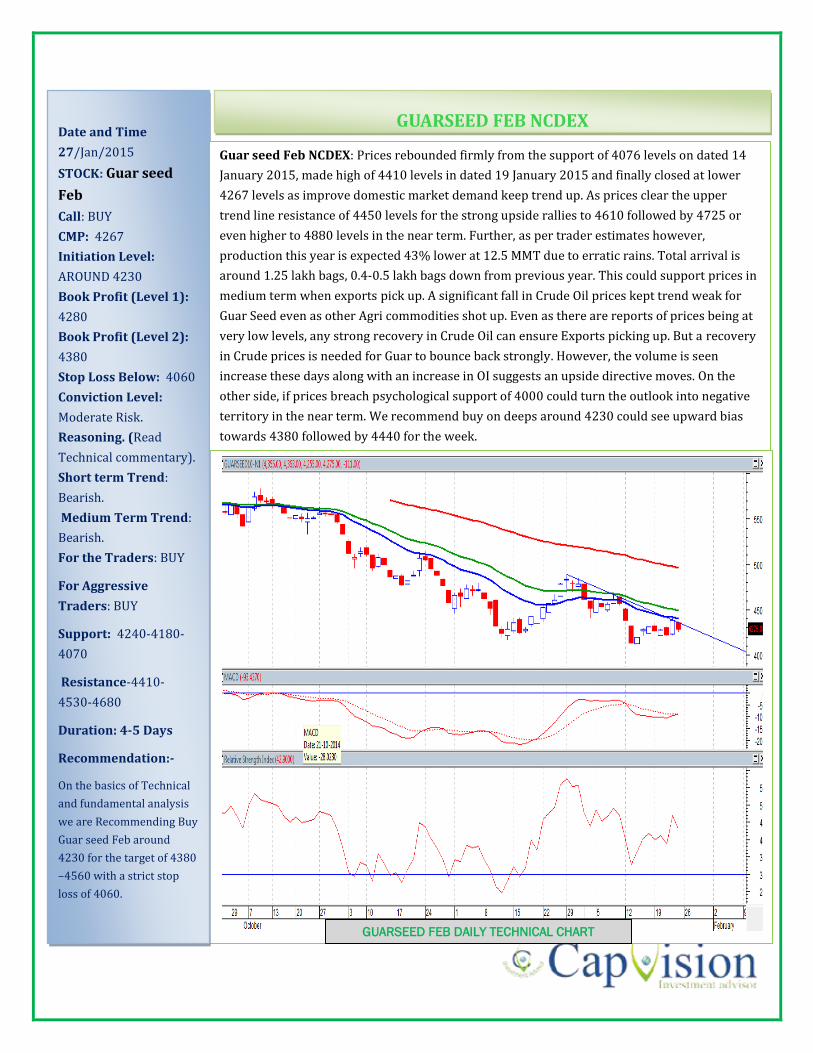
GUARSEED FEB NCDEX
Guar seed Feb NCDEX: Prices rebounded firmly from the support of 4076 levels on dated 14
January 2015, made high of 4410 levels in dated 19 January 2015 and finally closed at lower
4267 levels as improve domestic market demand keep trend up. As prices clear the upper
trend line resistance of 4450 levels for the strong upside rallies to 4610 followed by 4725 or
even higher to 4880 levels in the near term. Further, as per trader estimates however,
production this year is expected 43% lower at 12.5 MMT due to erratic rains. Total arrival is
around 1.25 lakh bags, 0.4-0.5 lakh bags down from previous year. This could support prices in
medium term when exports pick up. A significant fall in Crude Oil prices kept trend weak for
Guar Seed even as other Agri commodities shot up. Even as there are reports of prices being at
very low levels, any strong recovery in Crude Oil can ensure Exports picking up. But a recovery
in Crude prices is needed for Guar to bounce back strongly. However, the volume is seen
increase these days along with an increase in OI suggests an upside directive moves. On the
other side, if prices breach psychological support of 4000 could turn the outlook into negative
territory in the near term. We recommend buy on deeps around 4230 could see upward bias
towards 4380 followed by 4440 for the week.
GUARSEED FEB DAILY TECHNICAL CHART
Date and Time
27/Jan/2015
STOCK: Cardamom Feb
Call: SELL
CMP: 1033.30
Initiation Level: Around
1060
Book Profit (Level 1):
1010
Book Profit (Level 2):
935
Stop Loss: Above 1110
Conviction Level:
Moderate Risk.
Reasoning. (Read
Technical commentary).
Short term Trend:
Bearish.
Medium Term Trend:
Bullish.
For the Traders: SELL
For Aggressive Traders:
SELL
Support: 1000-960-910
Resistance-1080 - 1111
Duration: 4-5 Days
Recommendation:-
On the basics of Technical
and Fundamental analysis
we are Recommending sell
on rise Cardamom Feb
around 1070 for the target
of 1010 – 960 with a strict
stop loss of above 1110.
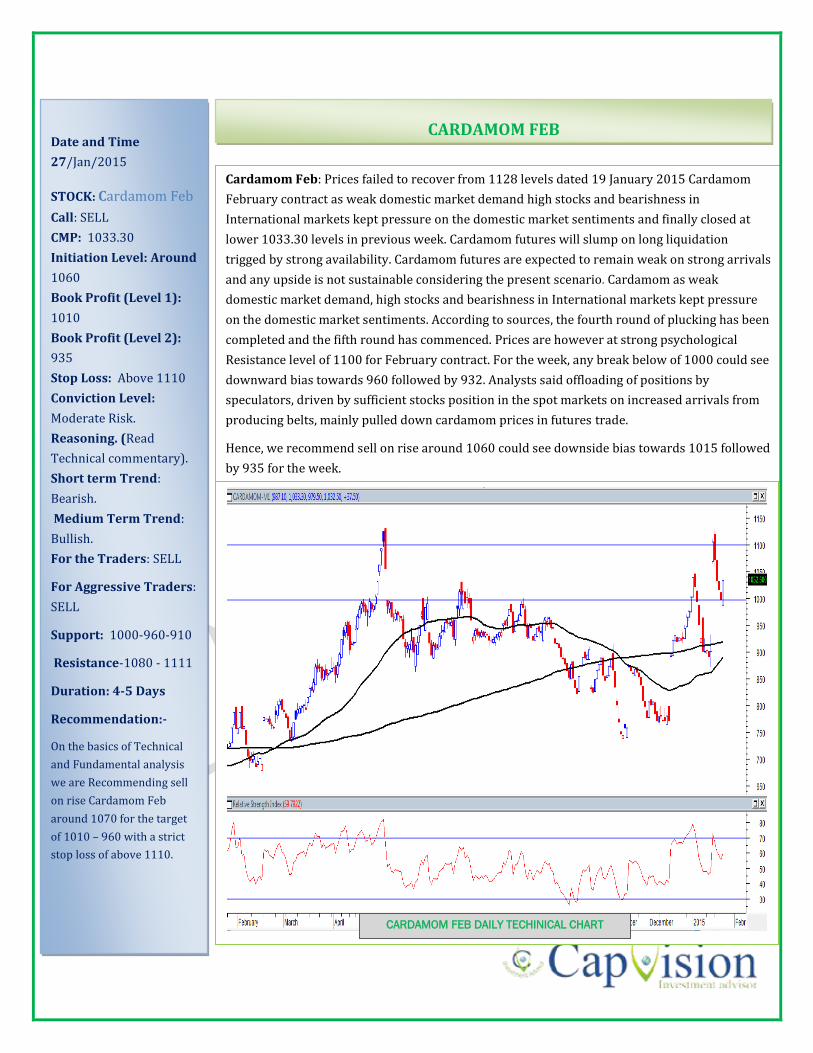
CARDAMOM FEB
Cardamom Feb: Prices failed to recover from 1128 levels dated 19 January 2015 Cardamom
February contract as weak domestic market demand high stocks and bearishness in
International markets kept pressure on the domestic market sentiments and finally closed at
lower 1033.30 levels in previous week. Cardamom futures will slump on long liquidation
trigged by strong availability. Cardamom futures are expected to remain weak on strong arrivals
and any upside is not sustainable considering the present scenario. Cardamom as weak
domestic market demand, high stocks and bearishness in International markets kept pressure
on the domestic market sentiments. According to sources, the fourth round of plucking has been
completed and the fifth round has commenced. Prices are however at strong psychological
Resistance level of 1100 for February contract. For the week, any break below of 1000 could see
downward bias towards 960 followed by 932. Analysts said offloading of positions by
speculators, driven by sufficient stocks position in the spot markets on increased arrivals from
producing belts, mainly pulled down cardamom prices in futures trade.
Hence, we recommend sell on rise around 1060 could see downside bias towards 1015 followed
by 935 for the week.
CARDAMOM FEB DAILY TECHINICAL CHART
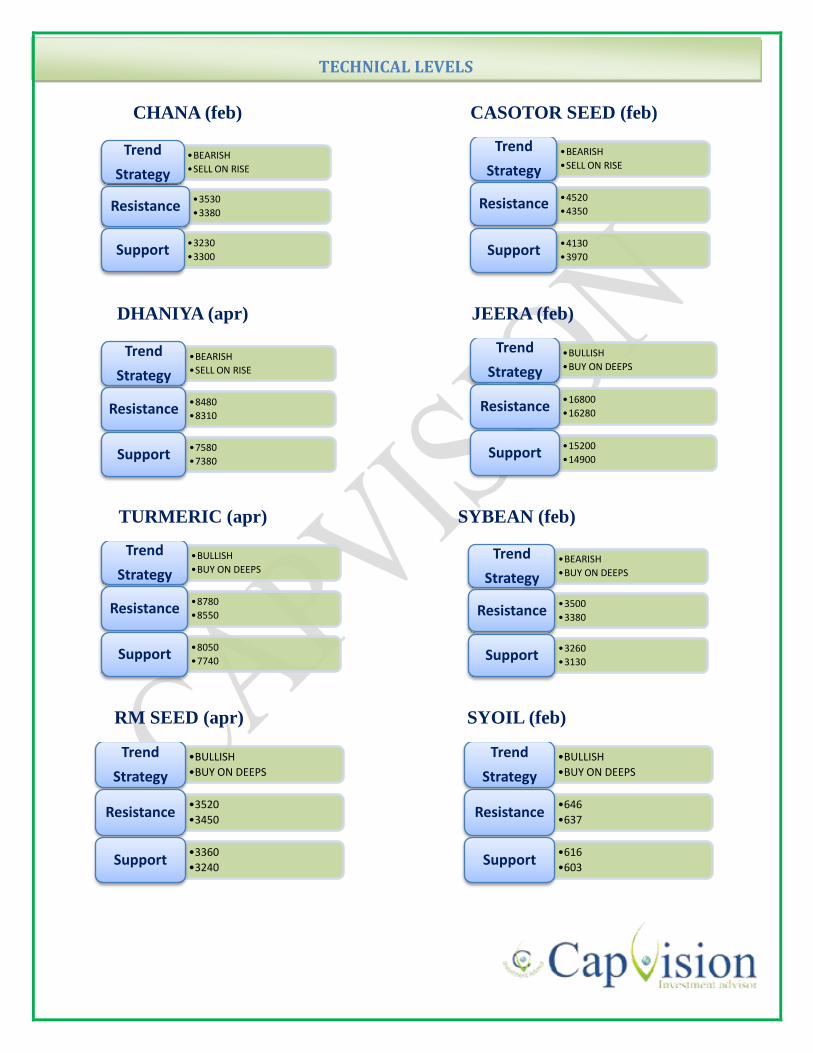
CHANA (feb) CASOTOR SEED (feb)
DHANIYA (apr) JEERA (feb)
TURMERIC (apr) SYBEAN (feb)
RM SEED (apr) SYOIL (feb)
•BEARISH
•SELL ON RISE
Trend
Strategy
•3530
•3380Resistance
•3230
•3300Support
•BEARISH
•SELL ON RISE
Trend
Strategy
•4520
•4350Resistance
•4130
•3970Support
•BEARISH
•SELL ON RISE
Trend
Strategy
•8480
•8310Resistance
•7580
•7380Support
•BULLISH
•BUY ON DEEPS
Trend
Strategy
•16800
•16280Resistance
•15200
•14900Support
•BULLISH
•BUY ON DEEPS
Trend
Strategy
•8780
•8550Resistance
•8050
•7740Support
•BEARISH
•BUY ON DEEPS
Trend
Strategy
•3500
•3380Resistance
•3260
•3130Support
•BULLISH
•BUY ON DEEPS
Trend
Strategy
•3520
•3450Resistance
•3360
•3240Support
•BULLISH
•BUY ON DEEPS
Trend
Strategy
•646
•637Resistance
•616
•603Support
TECHNICAL LEVELS

DISCLAIMER
The information and views in this report, our website & all the service we provide are believed to
be reliable, but we do not accept any responsibility (or liability) for errors of fact or opinion.
Users have the right to choose the product/s that suits them the most. Sincere efforts have been
made to present the right investment perspective. The information contained herein is based on
analysis and up on sources that we consider reliable.
Entering our site means that you have read, understood and agreed to everything that is written and implied in this
disclaimer note. RESEARCH is published solely for informational purposes and must in no way be construed as investment
advice for a specific individual. The information and views in this website & all the services we provide are believed to be
reliable, but we do not accept any responsibility (or liability) for errors of fact or opinion. Users have the right to choose the
product/s that suits them the most.
*Investment is subject to market risks.
Sincere efforts have been made to present the right investment perspective. The information
contained herein is based on analysis and on sources that we consider reliable. We, however, do
not vouch for the accuracy or the completeness thereof. This material is for personal information
and we are not responsible for any loss incurred due to it & take no responsibility whatsoever for
any financial profits or loss which may arise from the recommendations above.