Weekly MINISTRY OF INTERNATIONAL TRADE AND … Weekly...LNG, chemicals and chemical products, palm...
22
1 MITI Tower, No. 7, Jalan Sultan Haji Ahmad Shah, 50480 Kuala Lumpur, Malaysia Tel: +603 - 8000 8000 Fax: +603 - 6202 9446 VOLUME 525 MINISTRY OF INTERNATIONAL TRADE AND INDUSTRY Weekly BULLETIN 5 March 2019 | NO. ISSN : 2180-0448 Trade Performance for January 2019 Media Release manufactured and mining sector. Exports of manufactured goods recorded a y-o-y growth of 2.9% and mining goods posted a double- digit growth of 23.5%. Meanwhile, exports of agriculture goods contracted by 13.6%. In January 2019, exports of manufactured goods were valued at RM70.25 billion, accounting for 82.3% share of Malaysia’s total exports. The main contributors to the increase in exports were electrical and electronic (E&E) products which increased by 8.2%, followed by chemicals and chemical products (↑16.7%), jewellery (↑90.8%), optical and scientific equipment (↑7.1%), textiles, apparels and footwear (↑10.7%), as well as wood products (↑5.6%). Exports of mining goods totalled RM8.96 billion and constituted 10.5% of Malaysia’s total exports. Expansion in exports was contributed mainly by growth in exports of liquefied natural gas (LNG), which was attributed to higher Average Unit Value (AUV) and volume. Exports of agriculture goods amounted to RM5.62 billion and accounted for 6.6% of total exports. Contraction in exports was mainly due to the decline in exports of palm oil and palm oil-based agriculture products, Highest January Exports at RM85.41 billion Malaysia’s trade in January 2019 expanded by 2.1% to reach a value of RM159.3 billion from January 2018. Expansion in trade were seen with China, Taiwan, Saudi Arabia, the Republic of Korea (ROK), Thailand, the United Arab Emirates (UAE) and the United States (US). Exports posted a stronger year-on-year (y-o-y) growth compared to imports, registering an expansion of 3.1% to RM85.41 billion. This was the highest export value ever recorded for the month of January, surpassing RM82.82 billion registered in January 2018. Imports grew by 1% to RM73.89 billion, resulting in a trade surplus of RM11.52 billion, 19.2% higher compared to January 2018. This was the 255 th consecutive month of trade surplus recorded since November 1997. On a month-on-month (m-o-m) basis, total trade, exports and imports increased by 1.9%, 2.2% and 1.4%, respectively. Export Performance of Major Sectors Manufactured & Mining goods continued to Lead Export Growth Export expansion in January 2019 was driven mainly by growth in
Transcript of Weekly MINISTRY OF INTERNATIONAL TRADE AND … Weekly...LNG, chemicals and chemical products, palm...

1MITI Tower, No. 7, Jalan Sultan Haji Ahmad Shah, 50480 Kuala Lumpur, Malaysia Tel: +603 - 8000 8000 Fax: +603 - 6202 9446
VOLUME 525
MINISTRY OF INTERNATIONAL TRADE AND INDUSTRYWeekly
B U L L ET I N5 March 2019 | NO. ISSN : 2180-0448
Trade Performance for January 2019
Med
ia R
elea
se
manufactured and mining sector. Exports of manufactured goods recorded a y-o-y growth of 2.9% and mining goods posted a double-digit growth of 23.5%. Meanwhile, exports of agriculture goods contracted by 13.6%.
In January 2019, exports of manufactured goods were valued at RM70.25 billion, accounting for 82.3% share of Malaysia’s total exports. The main contributors to the increase in exports were electrical and electronic (E&E) products which increased by 8.2%, followed by chemicals and chemical products (↑16.7%), jewellery (↑90.8%), optical and scientific equipment (↑7.1%), textiles, apparels and footwear (↑10.7%), as well as wood products (↑5.6%).
Exports of mining goods totalled RM8.96 billion and constituted 10.5% of Malaysia’s total exports. Expansion in exports was contributed mainly by growth in exports of liquefied natural gas (LNG), which was attributed to higher Average Unit Value (AUV) and volume.
Exports of agriculture goods amounted to RM5.62 billion and accounted for 6.6% of total exports. Contraction in exports was mainly due to the decline in exports of palm oil and palm oil-based agriculture products,
Highest January Exports at RM85.41 billion
Malaysia’s trade in January 2019 expanded by 2.1% to reach a value of RM159.3 billion from January 2018. Expansion in trade were seen with China, Taiwan, Saudi Arabia, the Republic of Korea (ROK), Thailand, the United Arab Emirates (UAE) and the United States (US).
Exports posted a stronger year-on-year (y-o-y) growth compared to imports, registering an expansion of 3.1% to RM85.41 billion. This was the highest export value ever recorded for the month of January, surpassing RM82.82 billion registered in January 2018. Imports grew by 1% to RM73.89 billion, resulting in a trade surplus of RM11.52 billion, 19.2% higher compared to January 2018. This was the 255th consecutive month of trade surplus recorded since November 1997.
On a month-on-month (m-o-m) basis, total trade, exports and imports increased by 1.9%, 2.2% and 1.4%, respectively.
Export Performance of Major Sectors
Manufactured & Mining goods continued to Lead Export Growth Export expansion in January 2019 was driven mainly by growth in

2MITI Tower, No. 7, Jalan Sultan Haji Ahmad Shah, 50480 Kuala Lumpur, Malaysia Tel: +603 - 8000 8000 Fax: +603 - 6202 9446
MITI Weekly Bulletin | www.miti.gov.my
particularly palm oil. Exports of palm oil declined by 16.6% to RM3.27 billion, due to lower AUV.
Major exports in January 2019:
• E&E products, valued at RM34.28 billion and constituted 40.1% of total exports, increased by 8.2% from January 2018;
• Chemicals and chemical products, RM5.18 billion, 6.1% of total exports, increased by 16.7%;
• LNG, RM5.16 billion, 6% of total exports, increased by 37.5%;
• Petroleum products, RM4.61 billion, 5.4% of total exports, decreased by 24.1%; and
• Palm oil and palm oil-based agriculture products, RM3.72 billion, 4.4% of total exports, decreased by 19.5%.
Compared to December 2018, exports of manufactured, mining and agriculture goods expanded by 0.7%, 7.5% and 17.8%, respectively.
Trade Performance with Major Markets
Growing Exports to ASEAN
Trade with ASEAN in January 2019 which constituted 26.3% of Malaysia’s total trade declined by 2.2% to RM41.97 billion compared to January 2018. Exports to ASEAN grew by 3.4% to RM24.98 billion, mainly on the back of higher exports for E&E products, LNG, optical and scientific equipment and crude petroleum.
Breakdown of exports to ASEAN countries:• Singapore RM12.17 billion, increased by
5.4%• Thailand RM5.64 billion, ↑17.1%• Viet Nam RM2.79 billion, ↓8.6%• Indonesia RM2.43 billion, ↓13.8%• Philippines RM1.37 billion, ↓7.6%• Myanmar RM237.7 million, ↑46.7%• Brunei RM193.0 million, ↑5.4%• Cambodia RM149.5 million, ↑63.4%• Lao PDR RM2.9 million, ↑5.5%
Exports to major markets in ASEAN that recorded significant increases were Thailand, which expanded by RM823.3 million due to higher exports of E&E products while Singapore (↑RM627 million, E&E products) and Myanmar (↑RM75.7 million, petroleum products).
Imports from ASEAN were lower by 9.6% to RM16.99 billion. Major imports were E&E products, petroleum products, chemicals and chemical products, as well as machinery,
equipment and parts.
On a m-o-m basis, trade and exports were higher by 2.1% and 6.7%, respectively, while imports declined by 4%.
Exports to China Rebounded
In January 2019, trade with China which absorbed 18.2% of Malaysia’s total trade rose by 14.1% y-o-y to RM28.92 billion. Exports increased by 9.1% to RM11.02 billion on account of higher exports of LNG, chemicals and chemical products, palm oil and palm oil-based agriculture products, petroleum products, as well as metalliferous ores and metal scrap.
Imports from China surged by 17.5% to RM17.9 billion. Major imports were E&E products, machinery, equipment and parts, petroleum products, as well as chemicals and chemical products.
Compared to December 2018, trade and imports expanded by 7.2% and 15.7%, respectively, while exports contracted by 4.2%.
Manufactured Goods Dominated Exports to the EU
Trade with the European Union (EU) slipped by 1.5% y-o-y to RM15.29 billion or 9.6% of Malaysia’s total trade. Exports to the EU grew by 4.3% to RM8.73 billion in January 2019. In terms of products, higher exports were contributed by manufactured goods primarily E&E products, palm oil-based manufactured products, transport equipment, as well as textiles, apparels and footwear. Exports of manufactured goods to the EU rose by 7.1% to RM7.96 billion, accounting for 91.1% of Malaysia’s total exports to the region.
Among the top 10 EU markets which accounted for 91.7% of Malaysia’s total exports to the EU, exports to 6 countries registered increases namely, Spain (↑98.5%), the Czech Republic (↑82.9%), the Netherlands (↑3.2%), Poland (↑25.8%), Belgium (↑8.5%) and France (↑2%).
Imports from the EU contracted by 8.2% to RM6.56 billion. Main imports from this region were E&E products, machinery, equipment and parts, as well as chemicals and chemical products.
On a m-o-m basis, trade and exports to the EU rose by 2.5% and 10%, respectively, while imports decreased by 5.9%.
Med
ia R
elea
se

3MITI Tower, No. 7, Jalan Sultan Haji Ahmad Shah, 50480 Kuala Lumpur, Malaysia Tel: +603 - 8000 8000 Fax: +603 - 6202 9446
MITI Weekly Bulletin | www.miti.gov.my
Exports to the US Remained Firm
Total trade with the US posted an increase of 2.7% y-o-y to RM13.29 billion and accounted for 8.3% of Malaysia’s total trade. Exports rose by 9.4% to reach RM7.95 billion underpinned mainly by higher exports of manufactured goods which increased by 9.9%. Manufactured exports accounted for 96.1% or RM7.64 billion of Malaysia’s total exports to the US. Expansion in exports were seen for E&E products, optical and scientific equipment, wood products, as well as machinery, equipment and parts.
Imports from the US decreased by 5.9% to RM5.33 billion and the main import products were E&E products, machinery, equipment and parts, as well as chemicals and chemical products.
Compared to December 2018, exports increased by 0.9%, while trade and imports were down by 2.5% and 7.3%, respectively.
Exports to Japan Rose M-o-M
In January 2019, trade with Japan which constituted 7.2% of Malaysia’s total trade slipped by 1.8% y-o-y to RM11.51 billion. Exports decreased by 5% to RM6.67 billion owing mainly to lower exports of LNG, crude petroleum, E&E products as well as iron and steel products. However, higher exports were recorded for petroleum products, chemicals and chemical products, wood products and transport equipment.
Imports from Japan registered an increase of 2.9% to RM4.85 billion. Major imports were E&E products, transport equipment, as well as machinery, equipment and parts.
On a m-o-m basis, trade grew by 0.6% and exports accelerated by 9.5%, while imports reduced by 9.6%.
Resilient Trade with FTA Partners
In January 2019, trade with Free Trade Agreement (FTA) partners increased by 2.3% to a total value of RM99.94 billion and accounted for 62.7% of Malaysia’s total trade.
Exports to FTA partners amounted to RM52.61 billion, an increment of 3.2% and imports grew by 1.2% to RM47.33 billion.
Increases in exports were recorded to China, Thailand, the ROK, Singapore, Myanmar, Cambodia, New Zealand, Pakistan, Brunei and Lao PDR. These countries collectively contributed 63.7% of Malaysia’s exports to FTA partners.
Exports to the ROK surged by 30.5% to RM3.31 billion, attributed mainly to higher exports of LNG, Cambodia (↑63.4% to RM149.5 million, petroleum products), New Zealand (↑12.5% to RM403.8 million, crude petroleum) and Pakistan (↑8.1% to RM394.1 million, palm oil-based manufactured products).
Compared to December 2018, trade, exports and imports rose by 1.7%, 1.1% and 2.3%, respectively.
Other Markets Registering Higher Exports
In January 2019, other markets with significant growth in exports were Taiwan and the UAE. Exports to Taiwan recorded a sturdy growth of 22.3% y-o-y to RM2.84 billion, mainly driven by higher exports of E&E products. Exports to the UAE expanded by 32% to RM896.9 million, on account of higher exports of jewellery.
Import Performance
Total imports in January 2019 increased by 1% y-o-y to RM73.89 billion from RM73.15 billion in January 2018. The three main categories of imports by end use which accounted for 71.7% of total imports were:
• Intermediate goods, valued at RM37.46 billion or 50.7% share of total imports, decreased by 0.8%, following lower imports of parts and accessories of capital goods (except transport equipment) particularly electrical machinery, equipment and parts;
• Capital goods, valued at RM8.98 billion or 12.2% of total imports, declined by 3.3%, due mainly to lower imports of industrial transport equipment particularly aircraft and parts; and
• Consumption goods, valued at RM6.52 billion or 8.8% of total imports, increased by 3.3%, as a result of higher imports of non-durables mainly for pharmaceutical products
Ministry of International Trade and Industry4 March 2019
Med
ia R
elea
se

4MITI Tower, No. 7, Jalan Sultan Haji Ahmad Shah, 50480 Kuala Lumpur, Malaysia Tel: +603 - 8000 8000 Fax: +603 - 6202 9446
MITI Weekly Bulletin | www.miti.gov.my
Mal
aysi
a St
atis
tics
Source: Department of Statistics, Malaysia
Malaysia’s trade in January 2019 expanded by 2.1% to reach a value of RM159.3 billion from January 2018.
Exports posted a growth of 3.1% while imports were up by 1.0%.
Total Trade
RM159.3 bil.2.1%
Trade Balance
RM11.5 bil.19.2%
Exports3.1%, RM85.4 bil.
Imports1.0%, RM73.9 bil.
Major Exports Major ImportsE&E Products
2.3%RM21.9 bil.29.7%share
E&E Products
8.2%RM34.3 bil.40.1%share
Petroleum Products
20.0%RM5.5 bil.7.5% share
Petroleum Products
24.1%RM4.6 bil.5.4%share
Chemicals & Chemical Products
16.7%RM5.2 bil.6.1%share
Chemicals & Chemical Products
11.8%RM7.3 bil.9.9%share
Imports
Exports
RM85.4 bil.
RM73.9bil.
LNG
37.5%RM5.2 bil.6.0%share
Palm Oil & Palm Oil Based Agriculture Products
19.5%RM3.7 bil.4.4%share
Machinery, Equipment & Parts
2.8%RM6.8 bil.9.2%share
Manufactures of Metal
4.6%RM4.3 bil.5.8% share
Trade Performance, January 2019
Note: Percentage refers to y-o-y growth
=-= +

5MITI Tower, No. 7, Jalan Sultan Haji Ahmad Shah, 50480 Kuala Lumpur, Malaysia Tel: +603 - 8000 8000 Fax: +603 - 6202 9446
MITI Weekly Bulletin | www.miti.gov.my
20.0%RM5.5 bil.7.5% share
11.8%RM7.3 bil.9.9%share
2.8%RM6.8 bil.9.2%share
Trade Performance, January 2019M
alay
sia
Stat
isti
cs
Source: Department of Statistics, Malaysia
Major Export Destinations, January 2019M
alay
sia
Stat
isti
csLargest export destinations are to Singapore
14.2%
P.R.China12.9%
USA9.3%
Japan7.8%
Hong Kong SAR7.6%
Thailand6.6%
R.O.Korea3.9%
India3.5%
Chinese Taipei3.3%
Viet Nam3.3%
Others27.6%
Total ExportsRM85.4 bil.
Biggest import sources are from P.R. China24.2%
Singapore10.3%
Chinese Taipei7.3%
USA7.2%
Japan6.6%
Thailand5.1%
Indonesia4.2%
R.O.Korea4.2%
Germany3.2%
Saudi Arabia3.0%
Others24.7%
Total ImportsRM73.9 bil.
Major Import Sources, January 2019Note: Percentage refers to share to total exports
Note: Percentage refers to share to total imports

6MITI Tower, No. 7, Jalan Sultan Haji Ahmad Shah, 50480 Kuala Lumpur, Malaysia Tel: +603 - 8000 8000 Fax: +603 - 6202 9446
MITI Weekly Bulletin | www.miti.gov.my
Mal
aysi
a St
atis
tics

7MITI Tower, No. 7, Jalan Sultan Haji Ahmad Shah, 50480 Kuala Lumpur, Malaysia Tel: +603 - 8000 8000 Fax: +603 - 6202 9446
MITI Weekly Bulletin | www.miti.gov.my
Trade Performance, January 2019
Mal
aysi
a St
atis
tics
8MITI Tower, No. 7, Jalan Sultan Haji Ahmad Shah, 50480 Kuala Lumpur, Malaysia Tel: +603 - 8000 8000 Fax: +603 - 6202 9446
MITI Weekly Bulletin | www.miti.gov.my
Mal
aysi
a St
atis
tics
Inte
rnat
iona
l St
atis
tics
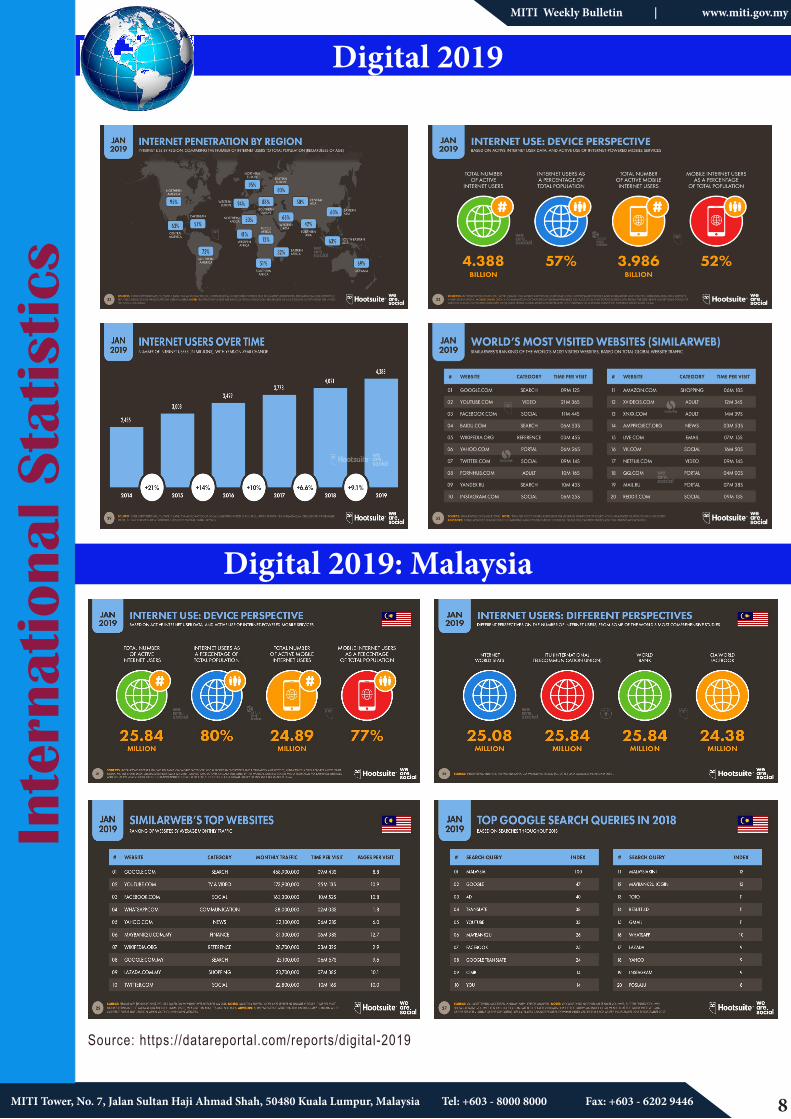
Digital 2019
Digital 2019: Malaysia
Source: https://datareportal.com/reports/digital-2019

9MITI Tower, No. 7, Jalan Sultan Haji Ahmad Shah, 50480 Kuala Lumpur, Malaysia Tel: +603 - 8000 8000 Fax: +603 - 6202 9446
MITI Weekly Bulletin | www.miti.gov.my
Inte
rnat
iona
l St
atis
tics
Hong Kong SAR Economic Indicators 20177.4 millionP o p u l a t i o n
0.7% annualG r o w t h r a t e
0.3% Employment in Agriculture
13.0% Employment in Industry
86.7% Employment in Services
US$280.3 billionGDP at constant prices
3.8% annualG r o w t h r a t e
US$104.3b i l l i o n
F D I F l o w InwardF D I F l o w Outward
US$82.8 b i l l i o n
US$1.97 t r i l l i o n
F D I Stock InwardF D I S t o c k Outward
US$1.80t r i l l i o n
US$77.1 b i l l i o nCommercialS e r v i c e sI m p o r t s
US$103.6 b i l l i o nCommercialS e r v i c e sE x p o r t s
US$589.9 billionMerchandiseG o o d sI m p o r t s
US$550.3billionMerchandiseG o o d sE x p o r t s
Malaysia's Trade with Hong Kong SAR 2008 - 2018
Source: Department of Statistics, Malaysia
Source: www.statistics.apec.org
and YOU...
21 Members
28.2
29.1 32.4
31.3
30.1
31.3 37
.0
36.9
37.6 47
.7
74.6
13.5
10.8
12.7
13.6
13.3
10.5
10.8
11.5
12.7
14.0
15.0
41.7 39.945.1 44.9 43.4 41.7
47.8 48.4 50.361.7
89.6
0.0
20.0
40.0
60.0
80.0
100.0
2008 2009 2010 2011 2012 2013 2014 2015 2016 2017 2018
RM b
illio
n
Exports Imports Total Trade
10MITI Tower, No. 7, Jalan Sultan Haji Ahmad Shah, 50480 Kuala Lumpur, Malaysia Tel: +603 - 8000 8000 Fax: +603 - 6202 9446
MITI Weekly Bulletin | www.miti.gov.myMITI Weekly Bulletin | www.miti.gov.my
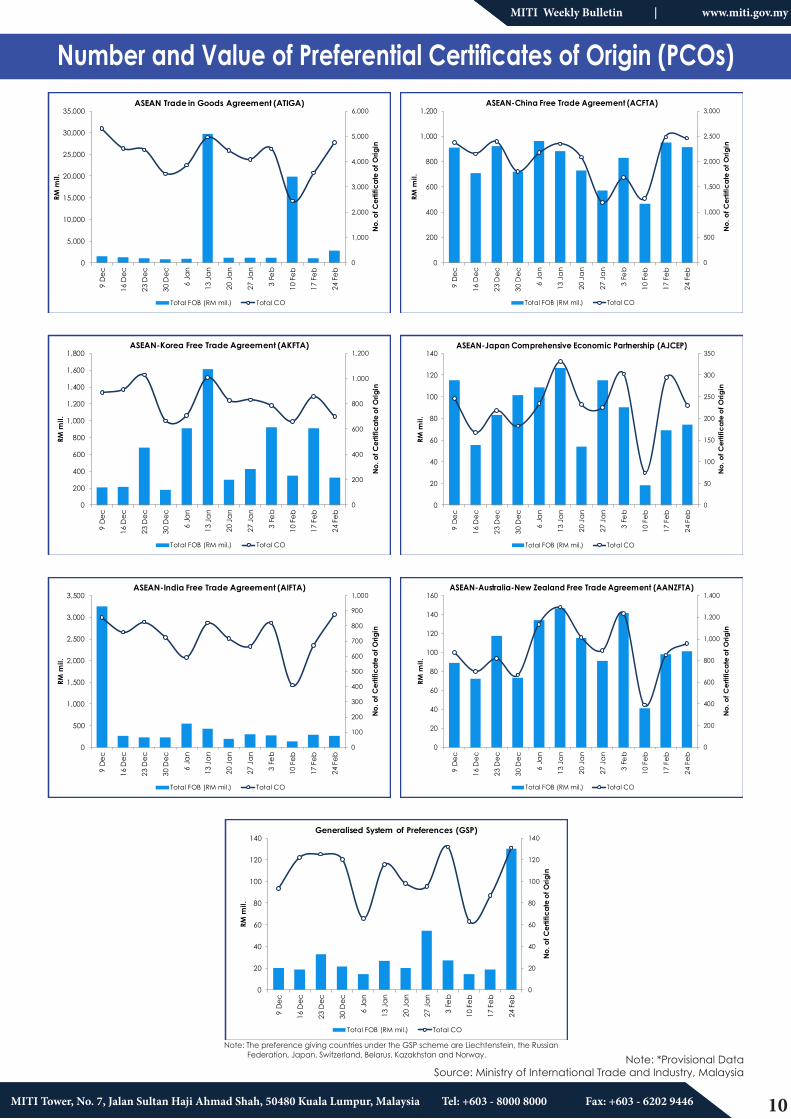
Number and Value of Preferential Certificates of Origin (PCOs)
Note: *Provisional Data Source: Ministry of International Trade and Industry, Malaysia
0
20
40
60
80
100
120
140
0
20
40
60
80
100
120
140
9 D
ec
16 D
ec
23 D
ec
30 D
ec
6 Ja
n
13 J
an
20 J
an
27 J
an
3 Fe
b
10 F
eb
17 F
eb
24 F
eb
No. o
f Cer
tific
ate
of O
rigin
RM m
il.
Generalised System of Preferences (GSP)
Total FOB (RM mil.) Total CO
Note: The preference giving countries under the GSP scheme are Liechtenstein, the Russian Federation, Japan, Switzerland, Belarus, Kazakhstan and Norway.
0
1,000
2,000
3,000
4,000
5,000
6,000
0
5,000
10,000
15,000
20,000
25,000
30,000
35,0009
Dec
16 D
ec
23 D
ec
30 D
ec
6 Ja
n
13 J
an
20 J
an
27 J
an
3 Fe
b
10 F
eb
17 F
eb
24 F
eb
No. o
f Cer
tific
ate
of O
rigin
RM m
il.
ASEAN Trade in Goods Agreement (ATIGA)
Total FOB (RM mil.) Total CO
0
500
1,000
1,500
2,000
2,500
3,000
0
200
400
600
800
1,000
1,200
9 D
ec
16 D
ec
23 D
ec
30 D
ec
6 Ja
n
13 J
an
20 J
an
27 J
an
3 Fe
b
10 F
eb
17 F
eb
24 F
eb
No.
of C
ertif
icat
e of
Orig
in
RM m
il.
ASEAN-China Free Trade Agreement (ACFTA)
Total FOB (RM mil.) Total CO
0
200
400
600
800
1,000
1,200
0
200
400
600
800
1,000
1,200
1,400
1,600
1,800
9 D
ec
16 D
ec
23 D
ec
30 D
ec
6 Ja
n
13 J
an
20 J
an
27 J
an
3 Fe
b
10 F
eb
17 F
eb
24 F
eb
No. o
f Cer
tific
ate
of O
rigin
RM m
il.
ASEAN-Korea Free Trade Agreement (AKFTA)
Total FOB (RM mil.) Total CO
0
50
100
150
200
250
300
350
0
20
40
60
80
100
120
140
9 D
ec
16 D
ec
23 D
ec
30 D
ec
6 Ja
n
13 J
an
20 J
an
27 J
an
3 Fe
b
10 F
eb
17 F
eb
24 F
eb
No.
of C
ertif
icat
e of
Orig
in
RM m
il.
ASEAN-Japan Comprehensive Economic Partnership (AJCEP)
Total FOB (RM mil.) Total CO
0
100
200
300
400
500
600
700
800
900
1,000
0
500
1,000
1,500
2,000
2,500
3,000
3,500
9 D
ec
16 D
ec
23 D
ec
30 D
ec
6 Ja
n
13 J
an
20 J
an
27 J
an
3 Fe
b
10 F
eb
17 F
eb
24 F
eb
No. o
f Cer
tific
ate
of O
rigin
RM m
il.
ASEAN-India Free Trade Agreement (AIFTA)
Total FOB (RM mil.) Total CO
0
200
400
600
800
1,000
1,200
1,400
0
20
40
60
80
100
120
140
160
9 D
ec
16 D
ec
23 D
ec
30 D
ec
6 Ja
n
13 J
an
20 J
an
27 J
an
3 Fe
b
10 F
eb
17 F
eb
24 F
eb
No.
of C
ertif
icat
e of
Orig
in
RM m
il.
ASEAN-Australia-New Zealand Free Trade Agreement (AANZFTA)
Total FOB (RM mil.) Total CO

11MITI Tower, No. 7, Jalan Sultan Haji Ahmad Shah, 50480 Kuala Lumpur, Malaysia Tel: +603 - 8000 8000 Fax: +603 - 6202 9446
MITI Weekly Bulletin | www.miti.gov.my
Number and Value of Preferential Certificates of Origin (PCOs)
0
200
400
600
800
1,000
1,200
0
2,000
4,000
6,000
8,000
10,000
12,000
14,000
16,000
18,0009
Dec
16 D
ec
23 D
ec
30 D
ec
6 Ja
n
13 J
an
20 J
an
27 J
an
3 Fe
b
10 F
eb
17 F
eb
24 F
eb
No.
of C
ertif
icat
e of
Orig
in
RM m
il.
Malaysia-Japan Economic Partnership Agreement (MJEPA)
Total FOB (RM mil.) Total CO
0
50
100
150
200
250
300
0
20
40
60
80
100
120
9 D
ec
16 D
ec
23 D
ec
30 D
ec
6 Ja
n
13 J
an
20 J
an
27 J
an
3 Fe
b
10 F
eb
17 F
eb
24 F
eb
No. o
f Cer
tific
ate
of O
rigin
RM m
il.
Malaysia-Pakistan Closer Economic Partnership Agreement (MPCEPA)
Total FOB (RM mil.) Total CO
0
2
4
6
8
10
12
14
16
0.00
0.10
0.20
0.30
0.40
0.50
0.60
9 D
ec
16 D
ec
23 D
ec
30 D
ec
6 Ja
n
13 J
an
20 J
an
27 J
an
3 Fe
b
10 F
eb
17 F
eb
24 F
eb
No.
of C
ertif
icat
e of
Orig
in
RM m
il.
Malaysia-New Zealand Free Trade Agreement (MNZFTA)
Total FOB (RM mil.) Total CO
0
20
40
60
80
100
120
0
200
400
600
800
1,000
1,200
1,400
1,600
9 D
ec
16 D
ec
23 D
ec
30 D
ec
6 Ja
n
13 J
an
20 J
an
27 J
an
3 Fe
b
10 F
eb
17 F
eb
24 F
eb
No. o
f Cer
tific
ate
of O
rigin
RM m
il.
Malaysia-Chile Free Trade Agreement (MCFTA)
Total FOB (RM mil.) Total CO
0
100
200
300
400
500
600
0
50
100
150
200
250
300
350
400
450
500
9 D
ec
16 D
ec
23 D
ec
30 D
ec
6 Ja
n
13 J
an
20 J
an
27 J
an
3 Fe
b
10 F
eb
17 F
eb
24 F
eb
No.
of C
ertif
icat
e of
Orig
in
RM m
il.
Malaysia-India Comprehensive Economic Cooperation Agreement (MICECA)
Total FOB (RM mil.) Total CO
0
100
200
300
400
500
600
0
10
20
30
40
50
60
70
9 D
ec
16 D
ec
23 D
ec
30 D
ec
6 Ja
n
13 J
an
20 J
an
27 J
an
3 Fe
b
10 F
eb
17 F
eb
24 F
eb
No. o
f Cer
tific
ate
of O
rigin
RM m
il.
Malaysia-Australia Free Trade Agreement (MAFTA)
Total FOB (RM mil.) Total CO
0
50
100
150
200
250
300
0
50
100
150
200
250
300
9 D
ec
16 D
ec
23 D
ec
30 D
ec
6 Ja
n
13 J
an
20 J
an
27 J
an
3 Fe
b
10 F
eb
17 F
eb
24 F
eb
No.
of C
ertif
icat
e of
Orig
in
RM m
il.
Malaysia-Turkey Free Trade Agreement (MTFTA)
Total FOB (RM mil.) Total CO
Note: *Provisional Data Source: Ministry of International Trade and Industry, Malaysia

12MITI Tower, No. 7, Jalan Sultan Haji Ahmad Shah, 50480 Kuala Lumpur, Malaysia Tel: +603 - 8000 8000 Fax: +603 - 6202 9446
MITI Weekly Bulletin | www.miti.gov.my
Source : Bank Negara Malaysia
Malaysian Ringgit Exchange Rate with Selected Countries,January 2018 - February 2019
US Dollar
Chinese Yuan
Thai Baht
Japanese Yen
Singapore Dollar
New Taiwan Dollar
3.9578
3.8862
4.1867
4.0746
3.70
3.75
3.80
3.85
3.90
3.95
4.00
4.05
4.10
4.15
4.20
4.25
Jan Feb Mar Apr May Jun Jul Aug Sep Oct Nov Dec Jan Feb
2018 2019
RM
USD 1 = RM
0.6150
0.6221
0.5974
0.6048
0.59
0.59
0.60
0.60
0.61
0.61
0.62
0.62
0.63
Jan Feb Mar Apr May Jun Jul Aug Sep Oct Nov Dec Jan Feb
2018 2019
RM
CNY 1 = RM
12.3963
12.1699
13.0154
11.60
11.80
12.00
12.20
12.40
12.60
12.80
13.00
13.20
Jan Feb Mar Apr May Jun Jul Aug Sep Oct Nov Dec Jan Feb
2018 2019
RM
THB 100 = RM
3.5615
3.7814
3.6880
3.45
3.50
3.55
3.60
3.65
3.70
3.75
3.80
Jan Feb Mar Apr May Jun Jul Aug Sep Oct Nov Dec Jan Feb
2018 2019RM
JPY 100 = RM
2.9925
2.9555
3.0453
3.0092
2.90
2.92
2.94
2.96
2.98
3.00
3.02
3.04
3.06
Jan Feb Mar Apr May Jun Jul Aug Sep Oct Nov Dec Jan Feb
2018 2019
RM
SGD 1 = RM
13.4522
13.2323
13.5766
13.2225
12.50
12.70
12.90
13.10
13.30
13.50
13.70
Jan Feb Mar Apr May Jun Jul Aug Sep Oct Nov Dec Jan Feb
2018 2019
RM
TWD 100 = RM

13MITI Tower, No. 7, Jalan Sultan Haji Ahmad Shah, 50480 Kuala Lumpur, Malaysia Tel: +603 - 8000 8000 Fax: +603 - 6202 9446
MITI Weekly Bulletin | www.miti.gov.my
Commodity Prices
%*US$380.0
(high)
1 Mar 2019
%*US$350.0
(low)
Sources: Ministry of International Trade and Industry Malaysia, Malaysian Palm Oil Board, Malaysian Rubber Board, Malaysian Cocoa Board, Malaysian Iron and Steel Industry Federation, and Bloomberg.
Notes: All figures have been rounded to the nearest decimal point * Refer to % change from the previous week’s price i Average price in the year except otherwise indicated
CRUDE PETROLEUM (BRENT) -per bbl-
3.1%*US$65.1
1 Mar 2019
CRUDE PALM OIL -per MT-
0.1%*US$566.5
1 Mar 2019
RUBBER SMR 20 -per MT-
4.6%*US$1,493.5
COCOA SMC 2 -per MT-
0.5%* US$1,657.3
COAL -per MT-
1.4%*US$70.6
SUGAR -per lbs-
5.1%*US¢12.6
SCRAP IRON HMS -per MT-
5 Oct 2018 : US$84.2
Highest2018/2019
22 Feb 2019 : US$67.1
4 Jan 2019 : US$57.1 28 Dec 2018 : US$52.2
Lowest2018/2019
9 Mar 2018 : US$691.5
Highest2018/2019
22 Feb 2019 : US$567.0
4 Jan 2019 : US$503.8 23 Nov 2018 : US$448.5
Lowest2018/2019
Average Price 2018 i : US$71.5 Average Price 2018 i : US$600.1
Average Price 2018 i : US$1,371.0 Average Price 2018 i : US$1,535.6 Average Price 2018 i : US¢12.3
Average Price 2018 i : US$380.7 (high)Average Price 2018 i : US$359.6 (low)Average Price 2018 i : US$66.9
Domestic Prices1 March 2019
Steel Bars(per MT)
RM2,100– RM2,250
Billets(per MT)
RM2,000 - RM2,100
1 Mar 2019 1 Mar 2019 1 Mar 2019
1 Mar 2019

14MITI Tower, No. 7, Jalan Sultan Haji Ahmad Shah, 50480 Kuala Lumpur, Malaysia Tel: +603 - 8000 8000 Fax: +603 - 6202 9446
MITI Weekly Bulletin | www.miti.gov.my
Commodity Prices Trends
Sources: Ministry of International Trade and Industry Malaysia, Malaysian Palm Oil Board, Malaysian Rubber Board, Malaysian Cocoa Board, Malaysian Pepper Board, Bloomberg and Czarnikow Group, World Bank, World Gold Council, The Wall Street Journal.
1,518.61,537.3
1,594.1
1,600.4
1,580.8
1,561.0
1,523.2
1,473.5 1,479.4
1,599.1
1,665.6
1,657.3
1,300
1,350
1,400
1,450
1,500
1,550
1,600
1,650
1,700
14 Dec 21 Dec 28 Dec 4 Jan 11 Jan 18 Jan 25 Jan 1 Feb 8 Feb 15 Feb 22 Feb 1 Mar
US$
/mt
Cocoa
2,240
2,241
2,253
2,262
2,286
2,275
2,264
2,2902,300
2,2952,294
2,299
2,200.0
2,220.0
2,240.0
2,260.0
2,280.0
2,300.0
2,320.0
14 Dec 21 Dec 28 Dec 4 Jan 11 Jan 18Jan 25 Jan 31 Jan 8 Feb 15 Feb 22 Feb 1 Mar
US$
/mt
Pepper
1,249.5
1,289.0
1,281.5
1,369.5
1,379.5
1,343.0
1,341.0
1,335.51,319.0
1,353.0
1,428.0
1,493.5
1,200
1,250
1,300
1,350
1,400
1,450
1,500
14 Dec 21 Dec 28 Dec 4 Jan 11 Jan 18 Jan 25 Jan 31 Jan 8 Feb 15 Feb 22 Feb 1 Mar
US$
/mt
Rubber SMR 20
51.2
45.6 45.3
48.0
51.6
53.8 53.7
55.3
52.7
55.6
57.3
55.8
60.3
53.8
52.2
57.1
60.5
62.761.6
62.862.1
66.367.1
65.1
40
45
50
55
60
65
70
14 Dec 21 Dec 28 Dec 4 Jan 11 Jan 18 Jan 25 Jan 1 Feb 8 Feb 15 Feb 22 Feb 1 Mar
US$
/bbl
Crude Petroleum
Crude Petroleum (WTI)/bbl Crude Petroleum (Brent)/bbl
475.0480.5
503.5503.8
524.0
530.5532.0
529.0
542.0
551.5
567.0 566.5
440
460
480
500
520
540
560
580
14 Dec 21 Dec 28 Dec 4 Jan 11 Jan 18 Jan 25 Jan 1 Feb 8 Feb 15 Feb 22 Feb 1 Mar
US$
/mt
Crude Palm Oil
12.7
12.312.4
11.9
12.8
13.0
12.4
12.612.7
13.0
13.3
12.6
11.5
11.7
11.9
12.1
12.3
12.5
12.7
12.9
13.1
13.3
13.5
14 Dec 21 Dec 28 Dec 4 Jan 11 Jan 18 Jan 25 Jan 1 Feb 8 Feb 15 Feb 22 Feb 1 Mar
US¢
/lbs
Sugar

15MITI Tower, No. 7, Jalan Sultan Haji Ahmad Shah, 50480 Kuala Lumpur, Malaysia Tel: +603 - 8000 8000 Fax: +603 - 6202 9446
MITI Weekly Bulletin | www.miti.gov.my
Commodity Prices Trends
14.6 14.7
15.4
15.815.7
15.4
15.7
15.9
15.8 15.7
16.0
15.3
14.0
14.5
15.0
15.5
16.0
16.5
14 Dec 21 Dec 28 Dec 4 Jan 11 Jan 18 Jan 25 Jan 1 Feb 8 Feb 15 Feb 22 Feb 1 Mar
US$
/oz
Silver
39.7
40.5
41.1
41.1
41.4 41.3
41.3
42.5
42.1 42.3
42.7
42.2
38.0
38.5
39.0
39.5
40.0
40.5
41.0
41.5
42.0
42.5
43.0
14 Dec 21 Dec 28 Dec 4 Jan 11 Jan 18 Jan 25 Jan 31 Jan 8 Feb 15 Feb 22 Feb 1 Mar
US$
/oz
Gold
Sources: Ministry of International Trade and Industry Malaysia, , Malaysian Iron and Steel Industry Federation, Bloomberg and Czarnikow Group, World Bank, World Gold Council, The Wall Street Journal.
2,21
0
2,18
2
2,06
9
2,25
5 2,30
0
2,23
8
2,08
2
2,05
2
2,02
6
2,03
0
1,93
9
1,92
0
1,85
4
1,86
3
1,400
1,500
1,600
1,700
1,800
1,900
2,000
2,100
2,200
2,300
2,400
Jan Feb Mar Apr May Jun Jul Aug Sep Oct Nov Dec Jan Feb
2018 2019
US$
/ to
nn
e
Aluminium
7,06
6
7,00
7
6,79
9
6,85
2
6,82
5 6,96
6
6,25
1
6,05
1
6,05
1 6,22
0
6,19
6
6,07
5
5,93
9
6,30
0
4,000
4,500
5,000
5,500
6,000
6,500
7,000
7,500
Jan Feb Mar Apr May Jun Jul Aug Sep Oct Nov Dec Jan Feb
2018 2019
US$
/ to
nne
Copper
12,8
65 13
,596
13,3
93
13,9
38
14,3
66 15
,106
13,7
94
13,4
11
12,5
10
12,3
15
11,2
40
10,8
35 11
,523
12,6
85
7,000
8,000
9,000
10,000
11,000
12,000
13,000
14,000
15,000
16,000
Jan Feb Mar Apr May Jun Jul Aug Sep Oct Nov Dec Jan Feb
2018 2019
US$
/ to
nn
e
Nickel
76
.34
77
.46
70
.35
65
.75
66
.10
65
.04
64
.56
67
.15 68
.44
73
.41
73
.26
69
.15
76
.16
88
.22
60.0
65.0
70.0
75.0
80.0
85.0
90.0
Jan Feb Mar Apr May Jun Jul Aug Sep Oct Nov Dec Jan Feb
2018 2019
US$
/dm
tu
Iron Ore
785.3
799.1
796.4
827.2
818.0
802.1
818.3
826.7
802.5
806.9
845.9
863.7
770.0
780.0
790.0
800.0
810.0
820.0
830.0
840.0
850.0
860.0
870.0
14 Dec 21 Dec 28 Dec 4 Jan 11 Jan 18 Jan 25 Jan 1 Feb 8 Feb 15 Feb 22 Feb 1 Mar
US
$/o
z
Platinum
380.0
350.0 350.0 350.0 350.0
340.0
330.0 330.0
300.0 300.0 300.0
330.0
380.0 380.0
350.0
320.0 320.0 320.0 320.0
310.0
300.0
310.0
290.0 290.0 290.0
310.0
350.0
350.0
250
270
290
310
330
350
370
390
410
30 Nov 7 Dec 14 Dec 21 Dec 28 Dec 4 Jan 11 Jan 18 Jan 25 Jan 1 Feb 8 Feb 15 Feb 22 Feb 1 Mar
US
$/m
t
Scrap Iron Scrap Iron/MT (High) Scrap Iron/MT(Low)
76.1 76.1
75.2
75.6 75.6
76.376.6
76.3
75.1
73.8
71.6
70.670.0
71.0
72.0
73.0
74.0
75.0
76.0
77.0
78.0
14 Dec 21 Dec 28 Dec 4 Jan 11 Jan 18 Jan 25 Jan 1 Feb 8 Feb 15 Feb 22 Feb 1 Mar
US
$/t
Coal

16MITI Tower, No. 7, Jalan Sultan Haji Ahmad Shah, 50480 Kuala Lumpur, Malaysia Tel: +603 - 8000 8000 Fax: +603 - 6202 9446
MITI Weekly Bulletin | www.miti.gov.my
MIT
I PR
OG
RAM
MES
MITI and Agencies Monthly Assembly28 February 2019

17MITI Tower, No. 7, Jalan Sultan Haji Ahmad Shah, 50480 Kuala Lumpur, Malaysia Tel: +603 - 8000 8000 Fax: +603 - 6202 9446
MITI Weekly Bulletin | www.miti.gov.my
MIT
I PR
OG
RAM
MES
MITI Minister attended 7th RCEP Intersessional Ministerial Meeting inCambodia, 1-2 March 2019

18MITI Tower, No. 7, Jalan Sultan Haji Ahmad Shah, 50480 Kuala Lumpur, Malaysia Tel: +603 - 8000 8000 Fax: +603 - 6202 9446
MITI Weekly Bulletin | www.miti.gov.my
Direct InvestmentDirect investment is a category of international investment that reflects the objective of a resident entity in one economy obtaining a lasting interest in an enterprise resident in another economy. The lasting interest implies the existence of a long-term relationship between the direct investor and the enterprise and a significant degree of influence on the management of the enterprise. An ownership of at least 10 per cent of the voting power of the enterprise is evidence of such relationship. Direct investment covers all transactions between direct investors and direct investment enterprises within the Foreign Direct Investment Relationship (FDIR). Financial instruments covered under direct investment include equity, reinvestment of earnings and debt instruments (such as inter-company loans and advances, trade credits).
Under sixth edition of the Balance of Payments and International Investment Position Manual (BPM6), direct investment is presented according to assets and liabilities basis. Asset refer to all investment abroad by both direct investors and direct investment enterprises in Malaysia, while liabilities refer to all investment in Malaysia by both direct investor and direct investment enterprises abroad.
Under fifth edition of the Balance of Payments and International Investment Position Manual (BPM5). direct investment is presented according to directional principle basis. DIA is derived by netting off the assets of Malaysia’s direct investor with its liabilities, while FDI is derived by netting off the liabilities of Malaysia’s direct investment enterprises with its assets.Source : External Sector Source Detail : Quarterly Balance Of Payment, DOSM
Disposal of WasteWaste elimination techniques comprising landfills, containment, underground disposal, dumping at sea and all other disposal methods. Source : Environment Source Detail : Compendium of Enviroment Statistics, DOSM
Dissolve Oxygen (DO)Amount of gaseous oxygen (O2) actually present in water expressed in terms either of its presence in the volume of water (milligrams of O2 per litre) or of its share in saturated water (percentage).Source : Environment Source Detail : Compendium of Enviroment Statistics, DOSM
Domestic OutputDomestic output is output produced by resident enterprises.Source : National Accounts Source Detail : Gross Domestics Product (GDP), DOSM
Double DeflationDouble deflation is a method whereby gross value added is measured at constant prices by subtracting intermediate consumption at constant prices from output at constant prices.Source : National Accounts Source Detail : Gross Domestics Product (GDP), DOSM

19MITI Tower, No. 7, Jalan Sultan Haji Ahmad Shah, 50480 Kuala Lumpur, Malaysia Tel: +603 - 8000 8000 Fax: +603 - 6202 9446
Inthrani ShammugamDirector | (CIO)
Che Hafizah Abd LatifPA to Director
Julia Inne Azrina MohammadAdministrative Assistant
Hawa AbdullahSenior Administrative Assistant
Saripah SubairiAdministrative Assistant
Nor Hasimah Che MatManager (Technical Support)
Shaharmilah Tharsini a/p BanifaceSenior Assistant Director
Nur Asma Wanis JusohAdministrative Assistant
Aidil Azizi ZulkiflyOperational Assistant
Abdul Halim IliasSenior Manager (EKP)
Mangaleswari a/p ArjunanSenior Assistant Director
Daniel Musa Mohd. DaudSenior Assistant Director
Azuna Hasbullah atau Abd Rahman
Assistant Information Technology Officer
Fauziah OsmanAssistant Information
Technology Officer
Az Azmeerudin Haji AlidinManager (Trade Application)
Rajeswary a/p VasuSenior Assistant Information
Technology Officer
Syamsul AbdullahSenior Assistant Information
Technology Officer
Zainatul Akma Che Mat ZainAssistant Information
Technology Officer
Nawal NordinAssistant Information Technology Officer
Mohd Nadzri YusofManager (Networking & ICT
Security)
Siti binti MustafaPrincipal Assistant
Information Technology Officer
Saiful Anuar BakhtiarSenior Assistant
Information Technology Officer
Nurul Nadiah ZaineAssistant Information
Technology Officer
Muhammad Abd GhaniAssistant Information
Technology Officer
Saharudin Abdul Rahman
Assistant Information Technology Officer
Mohd Farhan OmarAssistant Information
Technology Officer
Muhamad Syafiq Sahudin
Assistant Information Technology Officer
Wan Mohd Nadzir Hadzril Wan Ismail
Senior Assistant Director
Khairul IsmailAssistant
Information Technology
Officer
Mohd. Hafiz Mohd.
HawariComputer Technician
Marina ZainalAssistant
Information Technology Officer
Mohd Hasri HassanAssistant Director
Rosnurniza HamzahManager (Industry
Application)
Halidawati IbrahimAssistant
Information Technology
Officer
Azreen Elny Ahmad Tarmizi
Assistant Director
Siti Noor Aina Abdul HamidAssistant Information Technology Officer
Kamilah Adnan Manager (AU & EG)
Siti Norhayati Md YusofSenior Assistant Director
Sumaiah RamliSenior Assistant Director
Azwady Mohd KassimSenior Assistant Information
Technology Officer
Mohd Faizal AliSenior Assistant Director
Kumaravel a/l KangaratnamSenior Assistant Director
Muhammad Farid Md JanComputer Technician
Mabel Anak Dominic MadaiSenior Assistant Director
Nur Wahidah MohamedSenior Assistant Director
Sivaganasan a/l Rama-lingan
Senior Assistant Director
Information Management
MITI at Your Service

20MITI Tower, No. 7, Jalan Sultan Haji Ahmad Shah, 50480 Kuala Lumpur, Malaysia Tel: +603 - 8000 8000 Fax: +603 - 6202 9446
MITI Weekly Bulletin | www.miti.gov.my
For more information, kindly click the following links:http://www.miti.gov.my/index.php/pages/view/4761Vintage_English.pdf
PROGRAMME
For more information, kindly click the following links:https://www.miti.gov.my/index.php/pages/view/industry4WRD
For more information, kindly visit:https://www.dosm.gov.my/v1/index.php?r=column/cone&menu_id=N0FVaDR4Y1hGMk1NNi9jS2ZQRFFLZz09#
For more information, kindly visit http://www.isi2019.org/
ANNO
UNCEM
ENTS

21MITI Tower, No. 7, Jalan Sultan Haji Ahmad Shah, 50480 Kuala Lumpur, Malaysia Tel: +603 - 8000 8000 Fax: +603 - 6202 9446
MITI Weekly Bulletin | www.miti.gov.my
For more information, kindly click the following links:http://www.miti.gov.my/index.php/pages/view/4761Vintage_English.pdf
For more information, kindly click the following links:https://www.miti.gov.my/index.php/pages/view/industry4WRD
Tentative Schedule for MITI Pocket Talks 2019
Please click here to register
NO DATE VENUE TOPIC
114 March
(Thursday)MITI
PENANG
Introduction to FTA & Preferential certificate of Origin (PCO)
211 April
(Thursday)MITI HQ
(SEMINAR 1)
316 May
(Thursday)MITI JOHOR
420 June
(Thursday)MITI HQ
(SEMINAR 1)
518 July
(Thursday)MITI
PAHANG
622 August (Thursday)
MITI HQ (SEMINAR 1)
719 September
(Thursday)MITI PERAK
817 October (Thursday)
MITI HQ (SEMINAR 1)
914 November
(Thursday)MITI
KELANTAN
For more information, kindly click the following links:http://www.miti.gov.my/miti/resources/Approve%20Permit/AP%20Announcement/Lampiran_GP_Classic_and_Vintage_English.pdf
ANNO
UNCEM
ENTS
For more information, kindly click the following links:https://www.miti.gov.my/miti/resources/Preferential%20Certificate%20of%20Origin/Announcement/LAMPIRAN-ASW_
NOTICE_082018_-_Update_on_Number_of_Characters_for_Importing_HS_Code.pdf

22MITI Tower, No. 7, Jalan Sultan Haji Ahmad Shah, 50480 Kuala Lumpur, Malaysia Tel: +603 - 8000 8000 Fax: +603 - 6202 9446
ANNO
UNCEM
ENTS
Dear Readers,
Kindly click the link below for any comments in this issue. MWB reserves the right to edit and republish letters as reprints. http://www.miti.gov.my/index.php/forms/form/13
MITI Weekly Bulletin (MWB) Mobile AppsMITI MWB APPs is now available for IOS, Android and Windows platforms. MWB APPs can be download from Gallery of Malaysian Government Mobile APPs (GAMMA) at the link: http://gamma.malaysia.gov.my/#/appDetails/85
MITI Weekly Bulletin | www.miti.gov.my
We Remember...Sofuan Ibrahim08.03.2014
MH370ALWAYS FLYINGIN OUR HEARTS