Weekly MINISTRY OF INTERNATIONAL TRADE AND … Weekly Bulletin/MITI_Weekly... · MITI Tower, No. 7,...
17
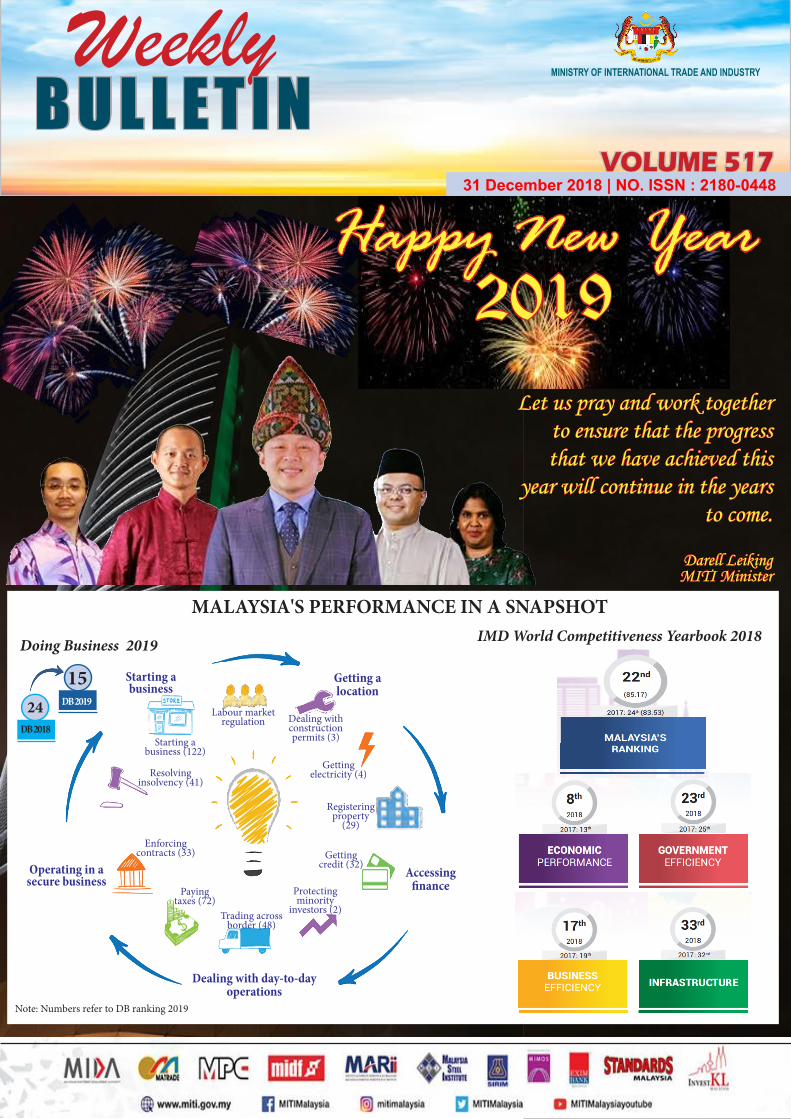
1 MITI Tower, No. 7, Jalan Sultan Haji Ahmad Shah, 50480 Kuala Lumpur, Malaysia Tel: +603 - 8000 8000 Fax: +603 - 6202 9446 VOLUME 517 MINISTRY OF INTERNATIONAL TRADE AND INDUSTRY Weekly BULLETIN 31 December 2018 | NO. ISSN : 2180-0448 Happy New Year 2019 Let us pray and work together to ensure that the progress that we have achieved this year will continue in the years to come. Darell Leiking MITI Minister IMD World Competitiveness Yearbook 2018 MALAYSIA'S PERFORMANCE IN A SNAPSHOT Doing Business 2019 24 DB 2018 15 DB 2019 Starting a business (122) Dealing with construction permits (3) Getting electricity (4) Registering property (29) Getting credit (32) Protecting minority investors (2) Paying taxes (72) Trading across border (48) Enforcing contracts (33) Resolving insolvency (41) Dealing with day-to-day operations Operating in a secure business Starting a business Accessing finance Getting a location Labour market regulation Note: Numbers refer to DB ranking 2019
Transcript of Weekly MINISTRY OF INTERNATIONAL TRADE AND … Weekly Bulletin/MITI_Weekly... · MITI Tower, No. 7,...
1MITI Tower, No. 7, Jalan Sultan Haji Ahmad Shah, 50480 Kuala Lumpur, Malaysia Tel: +603 - 8000 8000 Fax: +603 - 6202 9446
VOLUME 517
MINISTRY OF INTERNATIONAL TRADE AND INDUSTRYWeekly
B U L L ET I N31 December 2018 | NO. ISSN : 2180-0448
Happy New Year 2019
Let us pray and work together to ensure that the progress that we have achieved this
year will continue in the years to come.
Darell Leiking MITI Minister
IMD World Competitiveness Yearbook 2018
MALAYSIA'S PERFORMANCE IN A SNAPSHOT
Doing Business 2019
24DB 2018
15DB 2019
Starting a business (122)
Dealing with construction permits (3)
Getting electricity (4)
Registering property
(29)
Getting credit (32)
Protecting minority
investors (2)
Paying taxes (72)
Trading across border (48)
Enforcing contracts (33)
Resolving insolvency (41)
Dealing with day-to-dayoperations
Operating in a secure business
Starting abusiness
Accessingfinance
Getting alocation
Labour market regulation
Note: Numbers refer to DB ranking 2019
2MITI Tower, No. 7, Jalan Sultan Haji Ahmad Shah, 50480 Kuala Lumpur, Malaysia Tel: +603 - 8000 8000 Fax: +603 - 6202 9446
MITI Weekly Bulletin | www.miti.gov.myMITI Weekly Bulletin | www.miti.gov.my
Med
ia R
elea
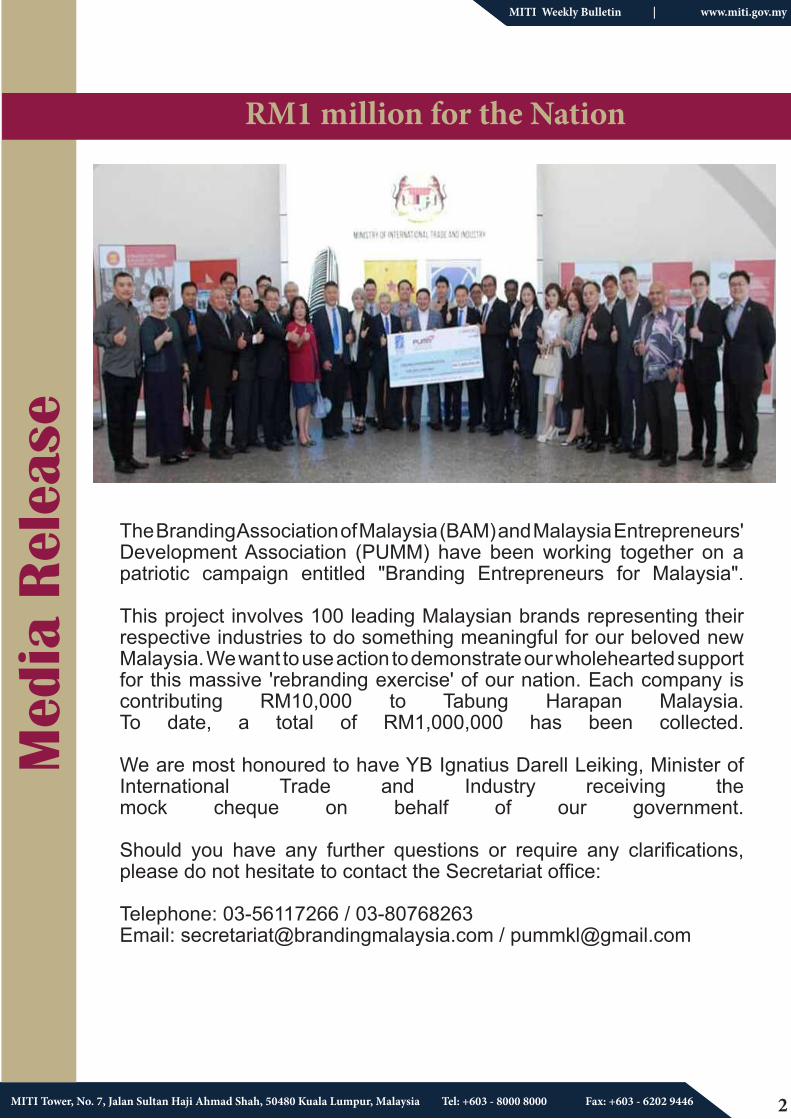
seRM1 million for the Nation
The Branding Association of Malaysia (BAM) and Malaysia Entrepreneurs' Development Association (PUMM) have been working together on a patriotic campaign entitled "Branding Entrepreneurs for Malaysia". This project involves 100 leading Malaysian brands representing their respective industries to do something meaningful for our beloved new Malaysia. We want to use action to demonstrate our wholehearted support for this massive 'rebranding exercise' of our nation. Each company is contributing RM10,000 to Tabung Harapan Malaysia. To date, a total of RM1,000,000 has been collected. We are most honoured to have YB Ignatius Darell Leiking, Minister of International Trade and Industry receiving the mock cheque on behalf of our government. Should you have any further questions or require any clarifications, please do not hesitate to contact the Secretariat office: Telephone: 03-56117266 / 03-80768263 Email: [email protected] / [email protected]
3MITI Tower, No. 7, Jalan Sultan Haji Ahmad Shah, 50480 Kuala Lumpur, Malaysia Tel: +603 - 8000 8000 Fax: +603 - 6202 9446
MITI Weekly Bulletin | www.miti.gov.my
Mal
aysi
a St
atis
tics
Source: Department of Statistics, Malaysia
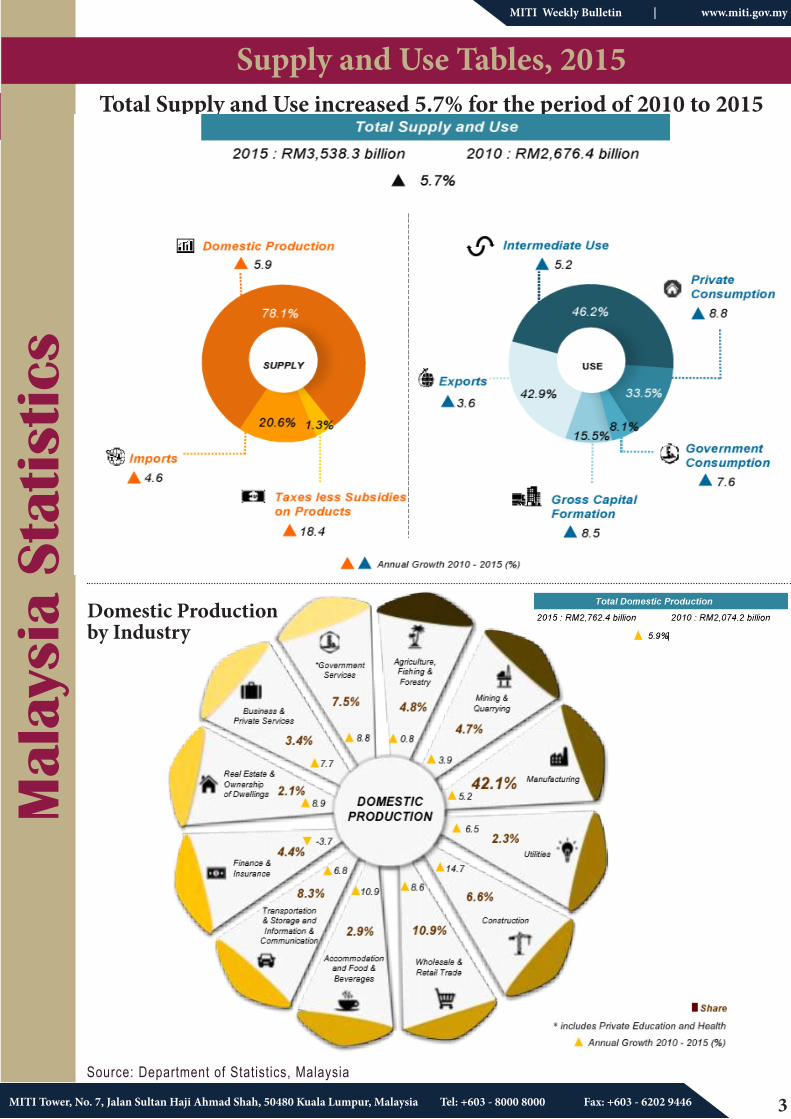
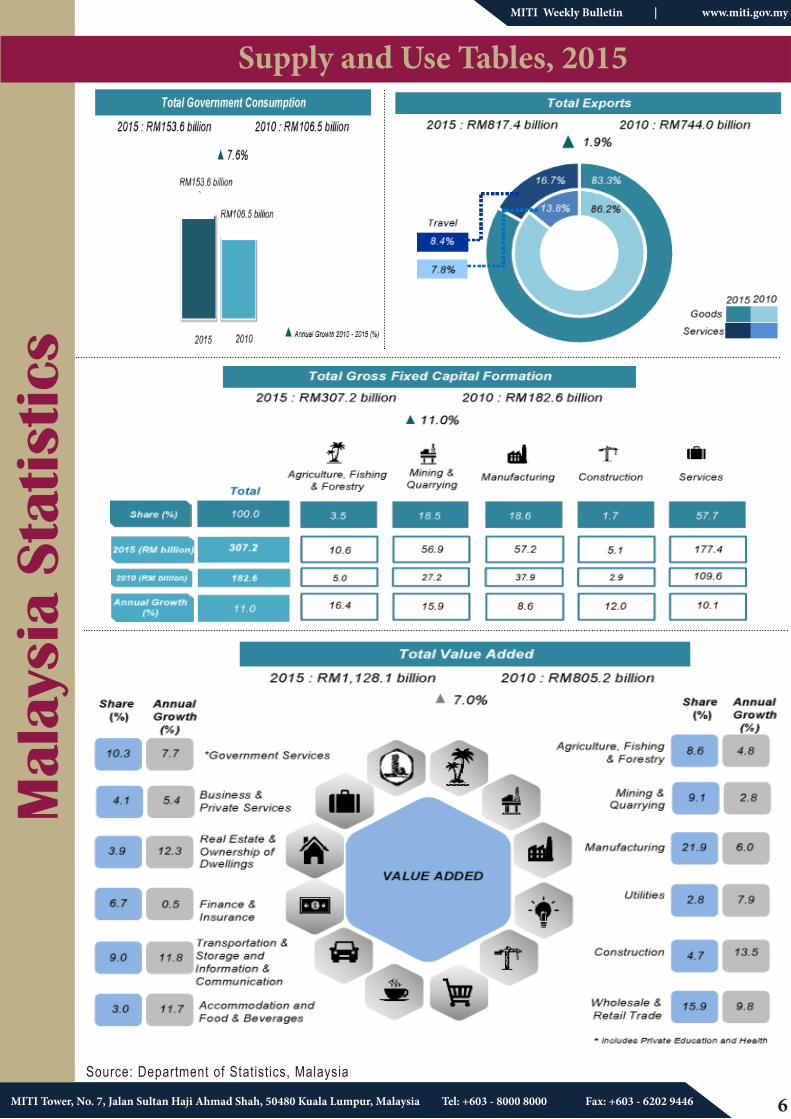
Supply and Use Tables, 2015Total Supply and Use increased 5.7% for the period of 2010 to 2015
Domestic Production by Industry
4MITI Tower, No. 7, Jalan Sultan Haji Ahmad Shah, 50480 Kuala Lumpur, Malaysia Tel: +603 - 8000 8000 Fax: +603 - 6202 9446
MITI Weekly Bulletin | www.miti.gov.my
Mal
aysi
a St
atis
tics
Source: Department of Statistics, Malaysia
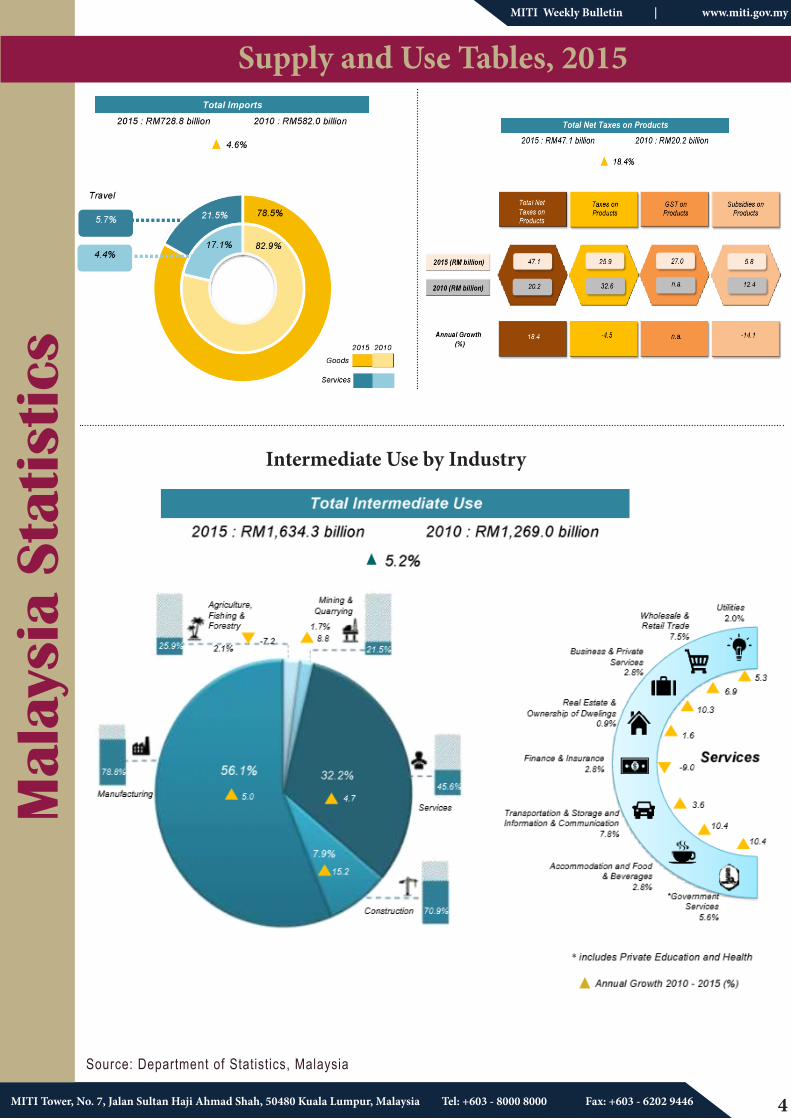
Supply and Use Tables, 2015
Intermediate Use by Industry
5MITI Tower, No. 7, Jalan Sultan Haji Ahmad Shah, 50480 Kuala Lumpur, Malaysia Tel: +603 - 8000 8000 Fax: +603 - 6202 9446
MITI Weekly Bulletin | www.miti.gov.my
Mal
aysi
a St
atis
tics
Source: Department of Statistics, Malaysia
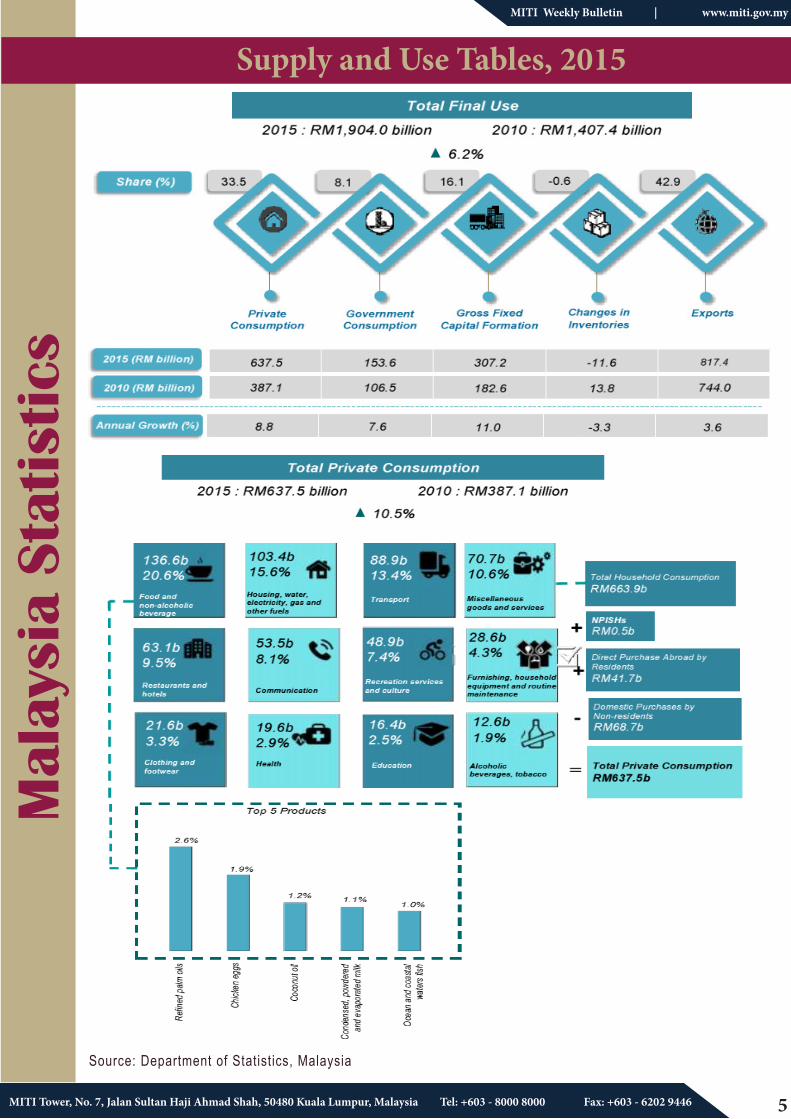
Supply and Use Tables, 2015
6MITI Tower, No. 7, Jalan Sultan Haji Ahmad Shah, 50480 Kuala Lumpur, Malaysia Tel: +603 - 8000 8000 Fax: +603 - 6202 9446
MITI Weekly Bulletin | www.miti.gov.my
Mal
aysi
a St
atis
tics
Source: Department of Statistics, Malaysia
Supply and Use Tables, 2015
7MITI Tower, No. 7, Jalan Sultan Haji Ahmad Shah, 50480 Kuala Lumpur, Malaysia Tel: +603 - 8000 8000 Fax: +603 - 6202 9446
MITI Weekly Bulletin | www.miti.gov.my
Inte
rnat
iona
l M
erch
andi
se T
rade
Sta
tist
ics
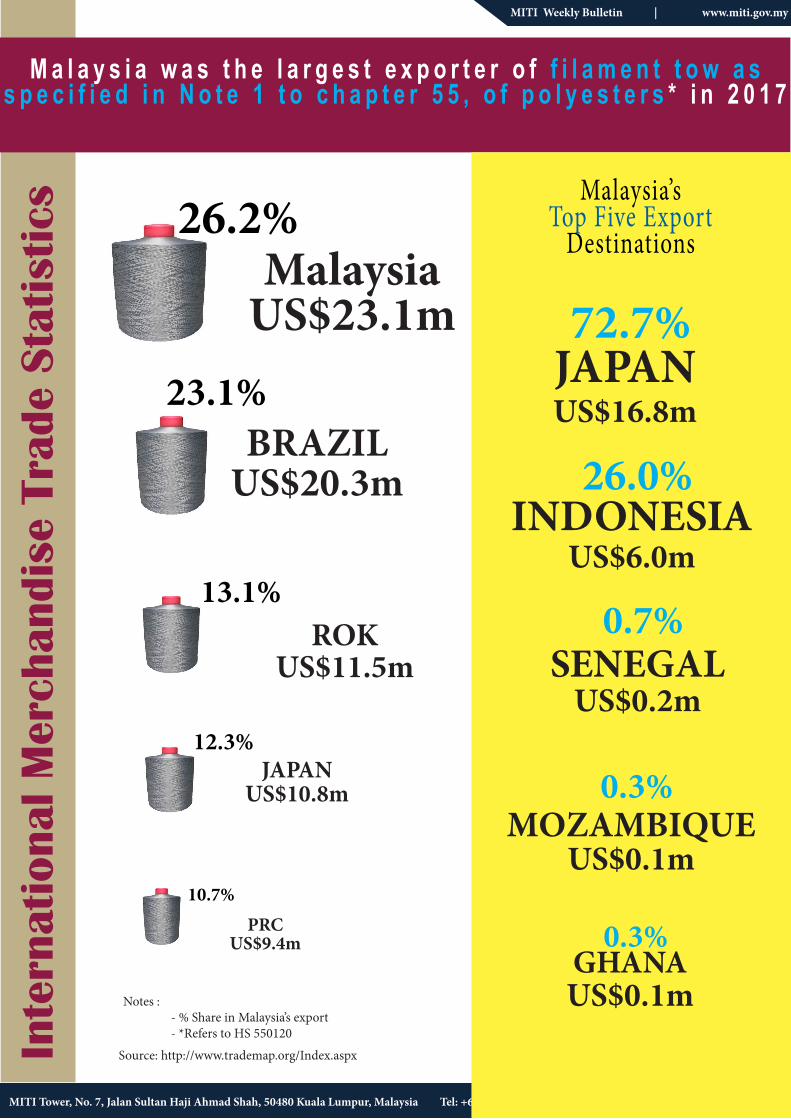
M a l a y s i a w a s t h e l a r g e s t e x p o r t e r o f f i l a m e n t t o w a s s p e c i f i e d i n N o t e 1 t o c h a p t e r 5 5 , o f p o l y e s t e r s * i n 2 0 1 7
Notes : - % Share in Malaysia’s export - *Refers to HS 550120
Source: http://www.trademap.org/Index.aspx
MalaysiaUS$23.1m
26.2%
BRAZILUS$20.3m
23.1%
ROKUS$11.5m
13.1%
JAPANUS$10.8m
12.3%
PRCUS$9.4m
10.7%
Malaysia’s Top Five Export
Destinations
72.7%JAPANUS$16.8m
26.0%INDONESIA
US$6.0m
0.7%SENEGAL
US$0.2m
0.3%MOZAMBIQUE
US$0.1m
0.3%GHANAUS$0.1m
8MITI Tower, No. 7, Jalan Sultan Haji Ahmad Shah, 50480 Kuala Lumpur, Malaysia Tel: +603 - 8000 8000 Fax: +603 - 6202 9446
MITI Weekly Bulletin | www.miti.gov.myMITI Weekly Bulletin | www.miti.gov.my
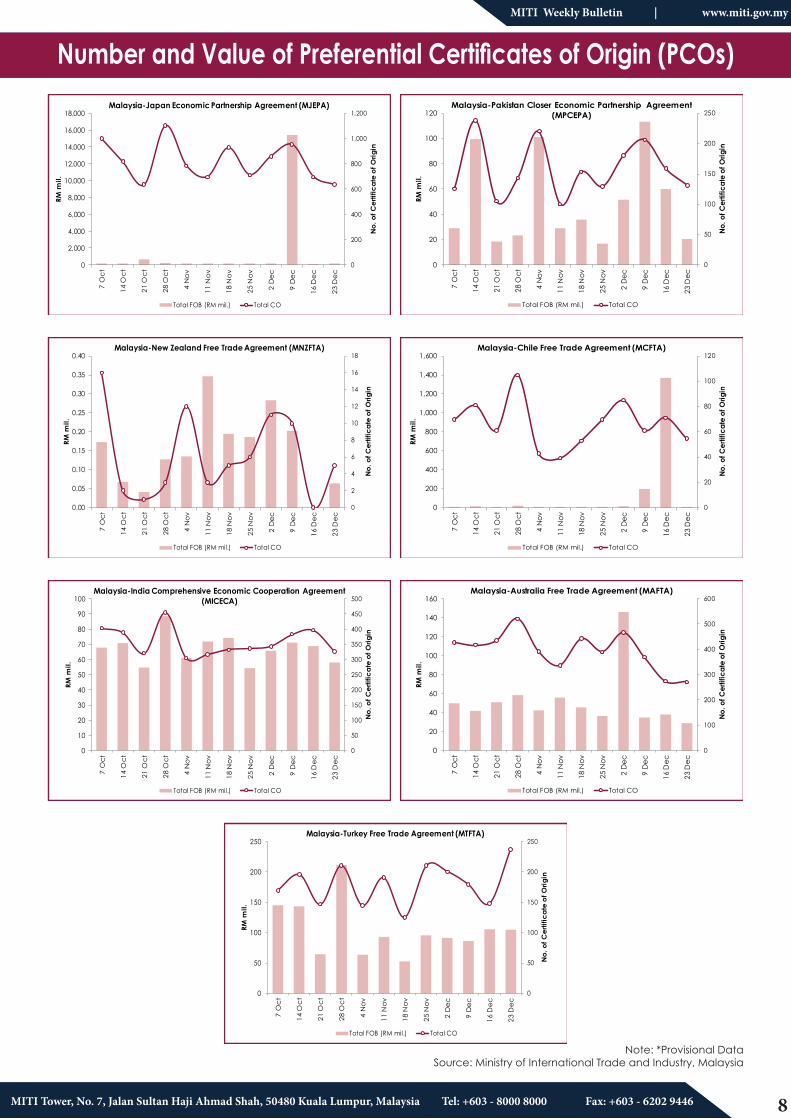
Number and Value of Preferential Certificates of Origin (PCOs)
0
200
400
600
800
1,000
1,200
0
2,000
4,000
6,000
8,000
10,000
12,000
14,000
16,000
18,000
7 O
ct
14 O
ct
21 O
ct
28 O
ct
4 N
ov
11 N
ov
18 N
ov
25 N
ov
2 D
ec
9 D
ec
16 D
ec
23 D
ec
No.
of C
ertif
icat
e of
Orig
in
RM m
il.
Malaysia-Japan Economic Partnership Agreement (MJEPA)
Total FOB (RM mil.) Total CO
0
50
100
150
200
250
0
20
40
60
80
100
120
7 O
ct
14 O
ct
21 O
ct
28 O
ct
4 N
ov
11 N
ov
18 N
ov
25 N
ov
2 D
ec
9 D
ec
16 D
ec
23 D
ec
No. o
f Cer
tific
ate
of O
rigin
RM m
il.
Malaysia-Pakistan Closer Economic Partnership Agreement (MPCEPA)
Total FOB (RM mil.) Total CO
0
2
4
6
8
10
12
14
16
18
0.00
0.05
0.10
0.15
0.20
0.25
0.30
0.35
0.40
7 O
ct
14 O
ct
21 O
ct
28 O
ct
4 N
ov
11 N
ov
18 N
ov
25 N
ov
2 D
ec
9 D
ec
16 D
ec
23 D
ec
No.
of C
ertif
icat
e of
Orig
in
RM m
il.
Malaysia-New Zealand Free Trade Agreement (MNZFTA)
Total FOB (RM mil.) Total CO
0
20
40
60
80
100
120
0
200
400
600
800
1,000
1,200
1,400
1,600
7 O
ct
14 O
ct
21 O
ct
28 O
ct
4 N
ov
11 N
ov
18 N
ov
25 N
ov
2 D
ec
9 D
ec
16 D
ec
23 D
ec
No. o
f Cer
tific
ate
of O
rigin
RM m
il.
Malaysia-Chile Free Trade Agreement (MCFTA)
Total FOB (RM mil.) Total CO
0
50
100
150
200
250
300
350
400
450
500
0
10
20
30
40
50
60
70
80
90
100
7 O
ct
14 O
ct
21 O
ct
28 O
ct
4 N
ov
11 N
ov
18 N
ov
25 N
ov
2 D
ec
9 D
ec
16 D
ec
23 D
ec
No.
of C
ertif
icat
e of
Orig
in
RM m
il.
Malaysia-India Comprehensive Economic Cooperation Agreement (MICECA)
Total FOB (RM mil.) Total CO
0
100
200
300
400
500
600
0
20
40
60
80
100
120
140
160
7 O
ct
14 O
ct
21 O
ct
28 O
ct
4 N
ov
11 N
ov
18 N
ov
25 N
ov
2 D
ec
9 D
ec
16 D
ec
23 D
ec
No. o
f Cer
tific
ate
of O
rigin
RM m
il.
Malaysia-Australia Free Trade Agreement (MAFTA)
Total FOB (RM mil.) Total CO
0
50
100
150
200
250
0
50
100
150
200
250
7 O
ct
14 O
ct
21 O
ct
28 O
ct
4 N
ov
11 N
ov
18 N
ov
25 N
ov
2 D
ec
9 D
ec
16 D
ec
23 D
ec
No.
of C
ertif
icat
e of
Orig
in
RM m
il.
Malaysia-Turkey Free Trade Agreement (MTFTA)
Total FOB (RM mil.) Total CO
Note: *Provisional Data Source: Ministry of International Trade and Industry, Malaysia
9MITI Tower, No. 7, Jalan Sultan Haji Ahmad Shah, 50480 Kuala Lumpur, Malaysia Tel: +603 - 8000 8000 Fax: +603 - 6202 9446
MITI Weekly Bulletin | www.miti.gov.my
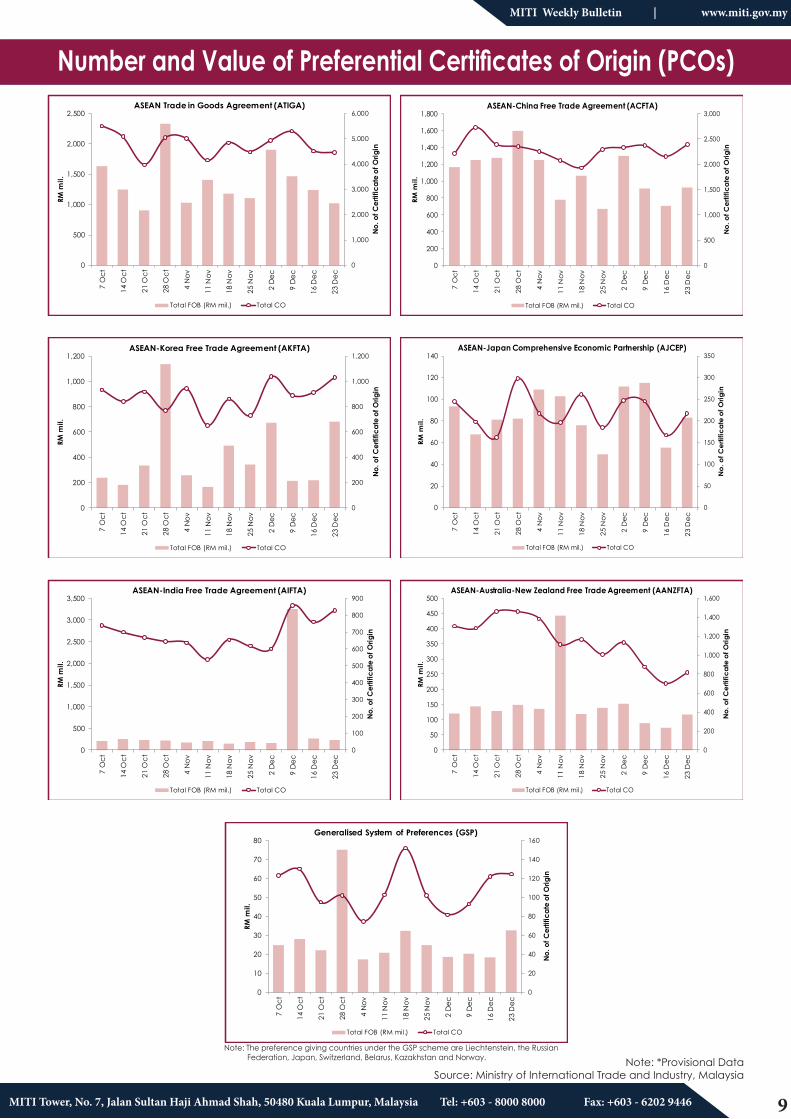
Number and Value of Preferential Certificates of Origin (PCOs)
Note: *Provisional Data Source: Ministry of International Trade and Industry, Malaysia
0
20
40
60
80
100
120
140
160
0
10
20
30
40
50
60
70
80
7 O
ct
14 O
ct
21 O
ct
28 O
ct
4 N
ov
11 N
ov
18 N
ov
25 N
ov
2 D
ec
9 D
ec
16 D
ec
23 D
ec
No. o
f Cer
tific
ate
of O
rigin
RM m
il.
Generalised System of Preferences (GSP)
Total FOB (RM mil.) Total CO
Note: The preference giving countries under the GSP scheme are Liechtenstein, the Russian Federation, Japan, Switzerland, Belarus, Kazakhstan and Norway.
0
1,000
2,000
3,000
4,000
5,000
6,000
0
500
1,000
1,500
2,000
2,500
7 O
ct
14 O
ct
21 O
ct
28 O
ct
4 N
ov
11 N
ov
18 N
ov
25 N
ov
2 D
ec
9 D
ec
16 D
ec
23 D
ec
No. o
f Cer
tific
ate
of O
rigin
RM m
il.
ASEAN Trade in Goods Agreement (ATIGA)
Total FOB (RM mil.) Total CO
0
500
1,000
1,500
2,000
2,500
3,000
0
200
400
600
800
1,000
1,200
1,400
1,600
1,800
7 O
ct
14 O
ct
21 O
ct
28 O
ct
4 N
ov
11 N
ov
18 N
ov
25 N
ov
2 D
ec
9 D
ec
16 D
ec
23 D
ec
No.
of C
ertif
icat
e of
Orig
in
RM m
il.
ASEAN-China Free Trade Agreement (ACFTA)
Total FOB (RM mil.) Total CO
0
200
400
600
800
1,000
1,200
0
200
400
600
800
1,000
1,200
7 O
ct
14 O
ct
21 O
ct
28 O
ct
4 N
ov
11 N
ov
18 N
ov
25 N
ov
2 D
ec
9 D
ec
16 D
ec
23 D
ec
No. o
f Cer
tific
ate
of O
rigin
RM m
il.
ASEAN-Korea Free Trade Agreement (AKFTA)
Total FOB (RM mil.) Total CO
0
50
100
150
200
250
300
350
0
20
40
60
80
100
120
140
7 O
ct
14 O
ct
21 O
ct
28 O
ct
4 N
ov
11 N
ov
18 N
ov
25 N
ov
2 D
ec
9 D
ec
16 D
ec
23 D
ec
No.
of C
ertif
icat
e of
Orig
in
RM m
il.
ASEAN-Japan Comprehensive Economic Partnership (AJCEP)
Total FOB (RM mil.) Total CO
0
100
200
300
400
500
600
700
800
900
0
500
1,000
1,500
2,000
2,500
3,000
3,500
7 O
ct
14 O
ct
21 O
ct
28 O
ct
4 N
ov
11 N
ov
18 N
ov
25 N
ov
2 D
ec
9 D
ec
16 D
ec
23 D
ec
No. o
f Cer
tific
ate
of O
rigin
RM m
il.
ASEAN-India Free Trade Agreement (AIFTA)
Total FOB (RM mil.) Total CO
0
200
400
600
800
1,000
1,200
1,400
1,600
0
50
100
150
200
250
300
350
400
450
500
7 O
ct
14 O
ct
21 O
ct
28 O
ct
4 N
ov
11 N
ov
18 N
ov
25 N
ov
2 D
ec
9 D
ec
16 D
ec
23 D
ec
No.
of C
ertif
icat
e of
Orig
in
RM m
il.
ASEAN-Australia-New Zealand Free Trade Agreement (AANZFTA)
Total FOB (RM mil.) Total CO

10MITI Tower, No. 7, Jalan Sultan Haji Ahmad Shah, 50480 Kuala Lumpur, Malaysia Tel: +603 - 8000 8000 Fax: +603 - 6202 9446
MITI Weekly Bulletin | www.miti.gov.my
Malaysian Ringgit Exchange Rate with Selected Countries,January 2017 - November 2018
Source : Bank Negara Malaysia
US Dollar
Pakistani Rupee
Egyptian Pound
Cambodian Riel
Nepalese Rupee
United Arab Emirates Dirham
4.4596
3.8862
4.1867
3.50
3.60
3.70
3.80
3.90
4.00
4.10
4.20
4.30
4.40
4.50
4.60
Jan
Feb
Ma
rA
prM
ay
Jun Jul
Aug Se
pO
ctN
ovD
ec Jan
Feb
Ma
rA
prM
ay
Jun Jul
Aug Se
pO
ctN
ov
2017 2018
RM
USD 1 = RM
4.2561
3.1202
3.00
3.20
3.40
3.60
3.80
4.00
4.20
4.40
Jan
Feb
Ma
rA
prM
ay
Jun Jul
Aug Se
pO
ctN
ovD
ec Jan
Feb
Ma
rA
prM
ay
Jun Jul
Aug Se
pO
ctN
ov
2017 2018
RM
PKR 100 = RM
0.2391
0.2639
0.2198
0.2337
0.20
0.21
0.22
0.23
0.24
0.25
0.26
0.27
Jan
Feb
Ma
rA
prM
ay
Jun Jul
Aug Se
pO
ctN
ovD
ec Jan
Feb
Ma
rA
prM
ay
Jun Jul
Aug Se
pO
ctN
ov
2017 2018
RM
EGP 1 = RM
0.1108 0.1112
0.0964
0.1035
0.085
0.090
0.095
0.100
0.105
0.110
0.115
Jan
Feb
Ma
rA
prM
ay
Jun Jul
Aug Se
pO
ctN
ovD
ec Jan
Feb
Ma
rA
prM
ay
Jun Jul
Aug Se
pO
ctN
ov
2017 2018RM
KHR 100 = RM
4.0931
4.2657
3.5316
3.6421
3.40
3.50
3.60
3.70
3.80
3.90
4.00
4.10
4.20
4.30
4.40
Jan
Feb
Ma
rA
prM
ay
Jun Jul
Aug Se
pO
ctN
ovD
ec Jan
Feb
Ma
rA
prM
ay
Jun Jul
Aug Se
pO
ctN
ov2017 2018
RM
NPR 100 = RM
121.4188
105.8030
113.9822
95.0
100.0
105.0
110.0
115.0
120.0
125.0
Jan
Feb
Ma
rA
prM
ay
Jun Jul
Aug Se
pO
ctN
ovD
ec Jan
Feb
Ma
rA
prM
ay
Jun Jul
Aug Se
pO
ctN
ov
2017 2018
RM
AED 100 = RM
11MITI Tower, No. 7, Jalan Sultan Haji Ahmad Shah, 50480 Kuala Lumpur, Malaysia Tel: +603 - 8000 8000 Fax: +603 - 6202 9446
MITI Weekly Bulletin | www.miti.gov.my
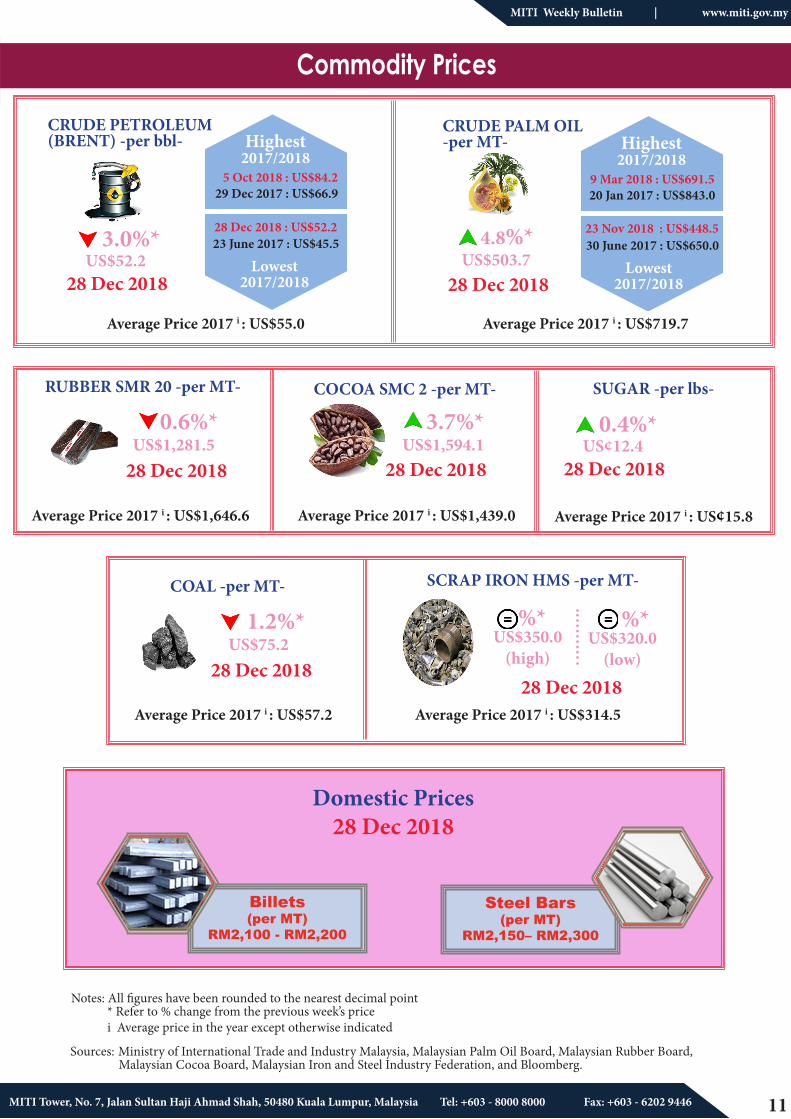
Commodity Prices
%*US$350.0
(high)
28 Dec 2018
%*US$320.0
(low)
Sources: Ministry of International Trade and Industry Malaysia, Malaysian Palm Oil Board, Malaysian Rubber Board, Malaysian Cocoa Board, Malaysian Iron and Steel Industry Federation, and Bloomberg.
Notes: All figures have been rounded to the nearest decimal point * Refer to % change from the previous week’s price i Average price in the year except otherwise indicated
CRUDE PETROLEUM (BRENT) -per bbl-
3.0%*US$52.2
28 Dec 2018
CRUDE PALM OIL -per MT-
4.8%*US$503.7
28 Dec 2018
RUBBER SMR 20 -per MT-
0.6%*US$1,281.5
28 Dec 2018
COCOA SMC 2 -per MT-
3.7%* US$1,594.1
28 Dec 2018
COAL -per MT-
1.2%*US$75.2
28 Dec 2018
SUGAR -per lbs-
0.4%*US¢12.4
28 Dec 2018
SCRAP IRON HMS -per MT-
29 Dec 2017 : US$66.9
Highest2017/2018
5 Oct 2018 : US$84.2
28 Dec 2018 : US$52.2 23 June 2017 : US$45.5
Lowest2017/2018
20 Jan 2017 : US$843.0
Highest2017/2018
9 Mar 2018 : US$691.5
23 Nov 2018 : US$448.5 30 June 2017 : US$650.0
Lowest2017/2018
Average Price 2017 i : US$55.0 Average Price 2017 i : US$719.7
Average Price 2017 i : US$1,646.6 Average Price 2017 i : US$1,439.0 Average Price 2017 i : US¢15.8
Average Price 2017 i : US$314.5Average Price 2017 i : US$57.2
Domestic Prices28 Dec 2018
Steel Bars(per MT)
RM2,150– RM2,300
Billets(per MT)
RM2,100 - RM2,200
12MITI Tower, No. 7, Jalan Sultan Haji Ahmad Shah, 50480 Kuala Lumpur, Malaysia Tel: +603 - 8000 8000 Fax: +603 - 6202 9446
MITI Weekly Bulletin | www.miti.gov.my
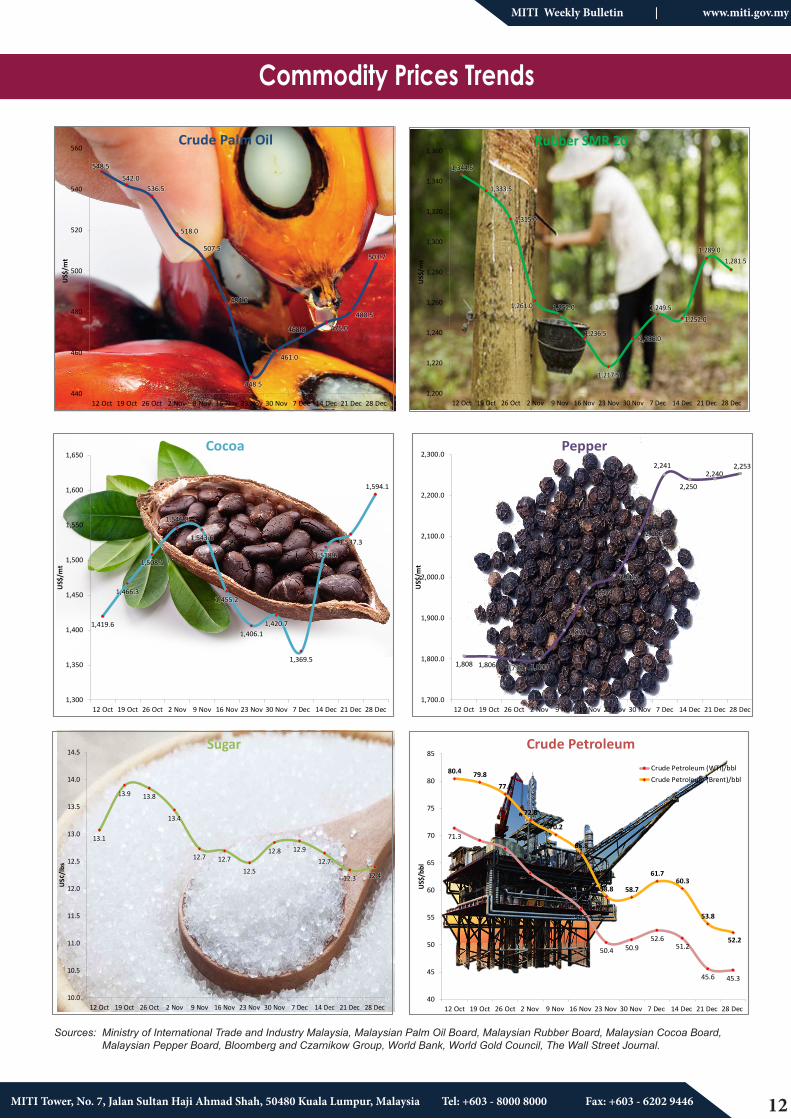
Commodity Prices Trends
Sources: Ministry of International Trade and Industry Malaysia, Malaysian Palm Oil Board, Malaysian Rubber Board, Malaysian Cocoa Board, Malaysian Pepper Board, Bloomberg and Czarnikow Group, World Bank, World Gold Council, The Wall Street Journal.
1,419.6
1,466.3
1,508.1
1,546.8
1,543.6
1,455.2
1,406.11,420.7
1,369.5
1,518.6
1,537.3
1,594.1
1,300
1,350
1,400
1,450
1,500
1,550
1,600
1,650
12 Oct 19 Oct 26 Oct 2 Nov 9 Nov 16 Nov 23 Nov 30 Nov 7 Dec 14 Dec 21 Dec 28 Dec
US$
/mt
Cocoa
1,808 1,806 1,798 1,800
1,871
1,974
2,005
2,106
2,250
2,2402,241 2,253
1,700.0
1,800.0
1,900.0
2,000.0
2,100.0
2,200.0
2,300.0
12 Oct 19 Oct 26 Oct 2 Nov 9 Nov 16 Nov 23 Nov 30 Nov 7 Dec 14 Dec 21 Dec 28 Dec
US$
/mt
Pepper
1,344.5
1,333.5
1,315.0
1,261.0 1,252.0
1,236.5
1,217.5
1,236.0
1,252.01,249.5
1,289.01,281.5
1,200
1,220
1,240
1,260
1,280
1,300
1,320
1,340
1,360
12 Oct 19 Oct 26 Oct 2 Nov 9 Nov 16 Nov 23 Nov 30 Nov 7 Dec 14 Dec 21 Dec 28 Dec
US$
/mt
Rubber SMR 20
71.3
69.167.6
63.1
60.2
56.5
50.4 50.952.6
51.2
45.6 45.3
80.4 79.877.6
72.8
70.2
66.8
58.8 58.7
61.760.3
53.8
52.2
40
45
50
55
60
65
70
75
80
85
12 Oct 19 Oct 26 Oct 2 Nov 9 Nov 16 Nov 23 Nov 30 Nov 7 Dec 14 Dec 21 Dec 28 Dec
US$
/bbl
Crude Petroleum Crude Petroleum (WTI)/bbl Crude Petroleum (Brent)/bbl
548.5
542.0536.5
518.0
507.5
484.0
448.5
461.0
468.0 475.0
480.5
503.7
440
460
480
500
520
540
560
12 Oct 19 Oct 26 Oct 2 Nov 9 Nov 16 Nov 23 Nov 30 Nov 7 Dec 14 Dec 21 Dec 28 Dec
US$
/mt
Crude Palm Oil
13.1
13.9 13.8
13.4
12.7 12.7
12.5
12.8 12.9
12.7
12.3 12.4
10.0
10.5
11.0
11.5
12.0
12.5
13.0
13.5
14.0
14.5
12 Oct 19 Oct 26 Oct 2 Nov 9 Nov 16 Nov 23 Nov 30 Nov 7 Dec 14 Dec 21 Dec 28 Dec
US¢
/lbs
Sugar
13MITI Tower, No. 7, Jalan Sultan Haji Ahmad Shah, 50480 Kuala Lumpur, Malaysia Tel: +603 - 8000 8000 Fax: +603 - 6202 9446
MITI Weekly Bulletin | www.miti.gov.my
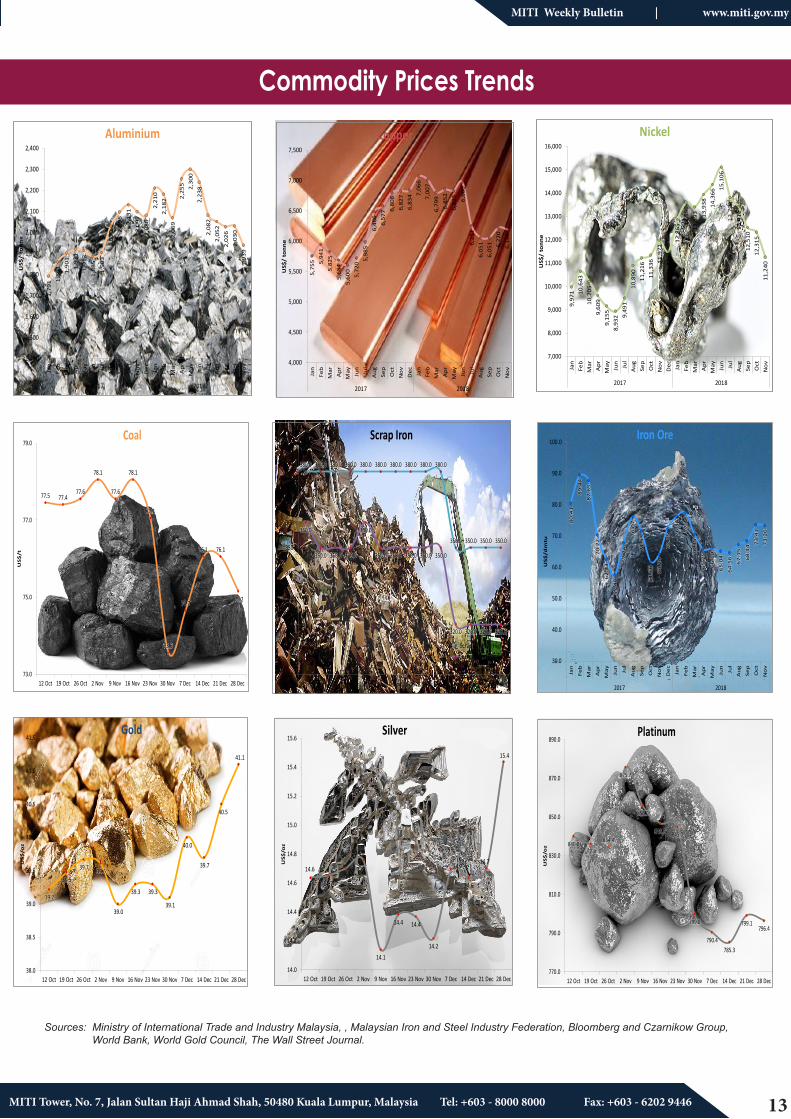
Commodity Prices Trends
14.6
14.714.7
14.8
14.1
14.4 14.4
14.2
14.7
14.6
14.7
15.4
14.0
14.2
14.4
14.6
14.8
15.0
15.2
15.4
15.6
12 Oct 19 Oct 26 Oct 2 Nov 9 Nov 16 Nov 23 Nov 30 Nov 7 Dec 14 Dec 21 Dec 28 Dec
US$
/oz
Silver
39.2
39.5
39.7 39.6
39.0
39.3 39.3
39.1
40.0
39.7
40.5
41.1
38.0
38.5
39.0
39.5
40.0
40.5
41.0
41.5
12 Oct 19 Oct 26 Oct 2 Nov 9 Nov 16 Nov 23 Nov 30 Nov 7 Dec 14 Dec 21 Dec 28 Dec
US$
/oz
Gold
Sources: Ministry of International Trade and Industry Malaysia, , Malaysian Iron and Steel Industry Federation, Bloomberg and Czarnikow Group, World Bank, World Gold Council, The Wall Street Journal.
1,79
1 1,86
1 1,
901
1,92
1 1,
913
1,88
5 1,
903
2,03
0 2,09
6 2,
131
2,09
7 2,
080
2,21
0 2,
182
2,06
9 2,
255 2,30
0 2,
238
2,08
2 2,
052
2,02
6 2,
030
1,93
9
1,400
1,500
1,600
1,700
1,800
1,900
2,000
2,100
2,200
2,300
2,400
Jan
Feb
Mar
Apr
May Jun
Jul
Aug Se
pO
ctN
ov
Dec Jan
Feb
Mar
Apr
May Jun
Jul
Aug Se
pO
ctN
ov
2017 2018
US$
/ to
nn
e
Aluminium
5,75
5 5,94
1 5,
825
5,68
4 5,
600
5,72
0 5,
985
6,48
6 6,
577 6,
808
6,82
7 6,
834 7,
066
7,00
7 6,
799
6,85
2 6,
825 6,96
6 6,
251
6,05
1 6,
051 6,
220
6,19
6
4,000
4,500
5,000
5,500
6,000
6,500
7,000
7,500
Jan
Feb
Mar
Apr
May Jun Jul
Aug Se
pO
ctN
ov
Dec Jan
Feb
Mar
Apr
May Jun Jul
Aug Se
pO
ctN
ov
2017 2018
US$
/ to
nn
e
Copper
9,97
1 10,6
43
10,2
05
9,60
9 9,
155
8,93
2 9,49
1 10
,890
11
,216
11
,336
11
,972
11
,495
12
,865
13,5
96
13,3
93
13,9
38
14,3
66 15
,106
13
,794
13
,411
12
,510
12
,315
11
,240
7,000
8,000
9,000
10,000
11,000
12,000
13,000
14,000
15,000
16,000
Jan
Feb
Mar
Apr
May Jun Jul
Aug Se
pO
ctN
ov
Dec Jan
Feb
Mar
Apr
May Jun Jul
Aug Se
pO
ctN
ov
2017 2018
US$
/ to
nn
e
Nickel
80
.41
89
.44
87
.65
70
.22
62
.43
57
.48
67
.74
76
.07
71
.53
61
.66
64
.24
72
.25 7
6.3
4
77
.46
70
.35
65
.75
66
.10
65
.04
64
.56
67
.15
68
.44 7
3.4
1
73
.26
30.0
40.0
50.0
60.0
70.0
80.0
90.0
100.0
Jan
Feb
Mar
Ap
r
May Jun
Jul
Au
g
Sep
Oct
No
v
De
c
Jan
Feb
Mar
Ap
r
May Jun
Jul
Au
g
Sep
Oct
No
v
2017 2018
US$
/dm
tu
Iron Ore
840.0836.0
834.4
875.7
856.0
846.6 845.0
799.8
790.4785.3
799.1796.4
770.0
790.0
810.0
830.0
850.0
870.0
890.0
12 Oct 19 Oct 26 Oct 2 Nov 9 Nov 16 Nov 23 Nov 30 Nov 7 Dec 14 Dec 21 Dec 28 Dec
US
$/o
z
Platinum
380.0 380.0 380.0 380.0 380.0 380.0 380.0 380.0 380.0 380.0
350.0 350.0 350.0 350.0360.0
350.0 350.0 350.0
360.0
350.0 350.0 350.0 350.0 350.0
320.0 320.0 320.0 320.0
300
310
320
330
340
350
360
370
380
390
28 Sep 5 Oct 12 Oct 19 Oct 26 Oct 2 Nov 9 Nov 16 Nov23 Nov30 Nov 7 Dec 14 Dec 21 Dec 28 Dec
US
$/m
t
Scrap Iron
Scrap Iron/MT (High) Scrap Iron/MT(Low)
77.5 77.477.6
78.1
77.6
78.1
77.1
73.6
74.7
76.1 76.1
75.2
73.0
75.0
77.0
79.0
12 Oct 19 Oct 26 Oct 2 Nov 9 Nov 16 Nov 23 Nov 30 Nov 7 Dec 14 Dec 21 Dec 28 Dec
US
$/t
Coal

14MITI Tower, No. 7, Jalan Sultan Haji Ahmad Shah, 50480 Kuala Lumpur, Malaysia Tel: +603 - 8000 8000 Fax: +603 - 6202 9446
MITI Weekly Bulletin | www.miti.gov.my
MIT
I PR
OG
RAM
MES
Minister had received RM1 million from the Branding Entrepreneurs for Malaysia Project
28 December 2018
15MITI Tower, No. 7, Jalan Sultan Haji Ahmad Shah, 50480 Kuala Lumpur, Malaysia Tel: +603 - 8000 8000 Fax: +603 - 6202 9446
MITI Weekly Bulletin | www.miti.gov.my
Air quality standardsLevels of air pollutants prescribed by regulations that may not be exceeded during a specified time in a defined area.Source : Environment Source Detail : Compedium of Environment, DOSM
Alam sekitarTerm frequently used in reference to global warming due to greenhouse gas emissions from human activities.Source : Environment Source Detail : Compedium of Environment, DOSM
Ammoniacal nitrogenA component of nitrogen which is adopted as an indicator to determine pollution by sewage. It is formed from microbiology activity and usually exists inside surface water and groundwater. The main sources of NH3-N were domestic sewage and livestock farming.Source : Environment Source Detail : Compedium of Environment, DOSM
Ancillary activityAn Ancillary Activity is a supporting activity undertaken within an enterprise in order to create the conditions within which the principal or secondary activities can be carried out.Source : National Accounts Source Detail : Gross Domestic Product (GDP), DOSM
AquacultureAquaculture refer to the production process involving the culturing or farming (including harvesting) of aquatic organisms (fish, molluscs, crustaceans, plant) using techniques designed to increase the production of the organism beyond the natural capacity of the environment.Source : Environment Source Detail : Compedium of Environment, DOSM
AquiferUnderground geologic formation or group of formations, containing groundwater that can supply wells and springs.Source : Environment Source Detail : Compedium of Environment, DOSM
Architectural Services:Refers to the provision of architectural services on a fee or contract basis. These services must be provided by establishments operated by persons registered under Section (A) of the Register of Architects and Section (B) of the Register of Building Draughtsman maintained by the Board of Architects under the provisions of the Architects Act, 1967 (Revised 1973). Architectural consulting activities which concerns building design and drafting and often supervision of construction, town and city planning and landscape architecture.Source : Services Source Detail : Services Statistics,Professional, DOSM
AssetsAssets are entities that must be owned by some unit, or units, and from which economic benefits are derived by their owner(s) by holding or using them over a period of time.Source : National Accounts Source Detail : National Accounts Capital Stock Statistics, DOSM
16MITI Tower, No. 7, Jalan Sultan Haji Ahmad Shah, 50480 Kuala Lumpur, Malaysia Tel: +603 - 8000 8000 Fax: +603 - 6202 9446
MITI Weekly Bulletin | www.miti.gov.my
ANNO
UNCEM
ENTS For more information, kindly click the following links:
http://www.miti.gov.my/miti/resources/Approve%20Permit/AP%20Announcement/Lampiran_GP_Classic_and_Vintage_English.pdf
For more information, kindly click the following links:http://www.miti.gov.my/index.php/pages/view/4761Vintage_English.pdf
PROGRAMME
Issuance of APEC Business Travel Card is temporarily suspendedImmigration Department of Malaysia has issued a notice that due to unavoidable circumstances, the issuance of APEC Business Travel Card is temporarily suspended and ABTC card will not be printed for approved applicants until further notice.
Kindly refer: http://www.imi.gov.my/index.php/en/resources-and-archives/announcement/1784-notice-of-apec-card-production-suspended-time.html
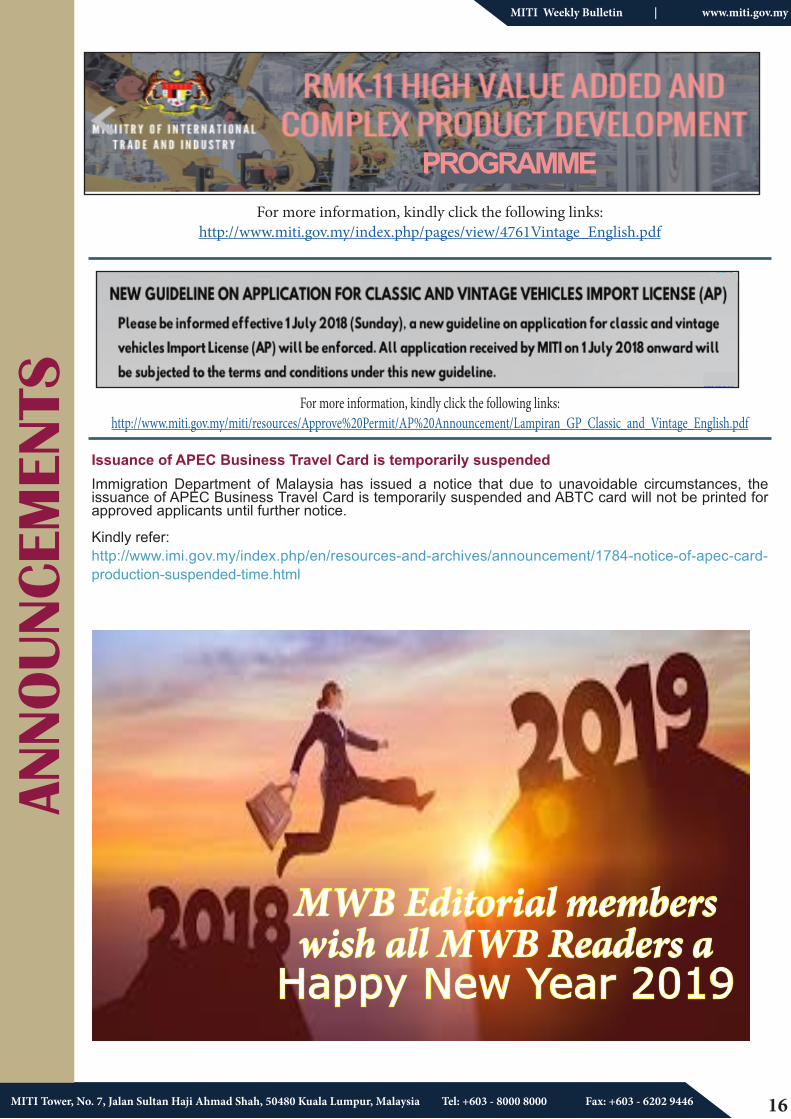
MWB Editorial members wish all MWB Readers a
Happy New Year 2019
17MITI Tower, No. 7, Jalan Sultan Haji Ahmad Shah, 50480 Kuala Lumpur, Malaysia Tel: +603 - 8000 8000 Fax: +603 - 6202 9446
MITI Weekly Bulletin (MWB) Mobile AppsMITI MWB APPs is now available for IOS, Android and Windows platforms. MWB APPs can be download from Gallery of Malaysian Government Mobile APPs (GAMMA) at the link: http://gamma.malaysia.gov.my/#/appDetails/85
Dear Readers,
Kindly click the link below for any comments in this issue. MWB reserves the right to edit and republish letters as reprints. http://www.miti.gov.my/index.php/forms/form/13
MITI Washington@ Your ServiceName : Mohd Firdaus Mohd Ali Designation : First Secretary (Economy) MITI WashingtonContact No : +1-202-572-9739Email : firdausali
For more information, kindly click the following links:http://www.miti.gov.my/miti/resources/Approve%20Permit/AP%20Announcement/Lampiran_GP_Classic_and_Vintage_English.pdf
For more information, kindly click the following links:http://www.miti.gov.my/index.php/pages/view/4761Vintage_English.pdf