Weekly Market Analysis 01 April 2011 - Application...
13
___________________________________________________________________________ AGRI TRENDS Weekly Market Analysis 01 April 2011 What effect has trouble in Africa had on the world? Is Africa become a burden to the rest of the world? Unrest and pirating of ships in Africa becomes a problem for other countries that trade in and outside Africa. Africa is an important continent in the world because most of the trade in the world passes through the African seas. Northern Africa is also an important oil producer together with other Arab states and then there is trade with these countries, some countries also produce products that are important in daily use, such as Cocoa. In return these countries purchase grains and other commodities from Western and European countries. Due to unrest the oil price spiked to record levels since 2008 before the economic melt down. The Suez channel is an important gate-way between Europe, Africa, Oceania and Asian countries together with the route alongside the Cape Point. If the Suez channel is closed down, then ships will have to move past Cape Point which will influence the shipping costs, insurance cost and delays in delivering times. Another factor that needs attention and plays a bigger role is the pirates off the Senegal coast. In 2011 alone they have made more than 60 attempts to hijack ships of which more than 15 were successful. These pirates then claim a ransom which they use to buy weapons. Are Africa and the World strong enough to survive these conditions to provide a better world for all? Beef Market Trends • International: The US and AU beef market prices traded higher during the week compared to the previous week. Top inside was 0,8% higher at 227,02 $/cwt, Rump was 0,9% higher at 285,82 $/cwt, Strip loin was a 5,3% higher at 559,75 $/cwt, Chuck was the same at 226,03 $/cwt, and Brisket 0,4% higher at 172,88 $/cwt. Australian cattle producers welcome the recent kick in cattle prices, which saw the Eastern young cattle indicator hit an all-time high, prices across other major beef producing nations have also risen into record territory. Supported by recovering global beef demand and reduced global supplies, cattle prices in major exporting nations, such as Brazil, Australia and US have all risen significantly in 2011 and are well above year on year levels. US cattle futures prices reached record highs during the past week, fuelled by a low US$ and speculation of increased imported beef demand from Japan. Cattle prices in Brazil are also significantly above the same period than in 2010, with a strong domestic market keeping more beef at home, further tightening available supplies for the export market. A rise in cattle numbers across Queensland and selling returning to Roma in Australia had an positive influence on steer prices. BSE was confirmed in six-and-a-half year old dairy cow in Albert, Canada. This is the first Canadian case in more than a year. The discovery was made as a result of the national BSE surveillance program, which has tested some 313,000 cattle since 2003. There have been 18 cases of mad cow disease in Canada since 2003, a number that peaked at five in 2006. No part of the identified cow's 1,000 1,300 1,600 1,900 2,200 2,500 2,800 Beef Price Trends (c/kg) Class A Class C Contract Weaner calf NZ Import Parity Weeks Months *Last 3 points 3 months forecast
Transcript of Weekly Market Analysis 01 April 2011 - Application...

___________________________________________________________________________
AGRI TRENDS
W Weekly Market Analysis 01 April 2011
What effect has trouble in Africa had on the world?
Is Africa become a burden to the rest of the world? Unrest and pirating of ships in Africa becomes a problem for other countries that trade in and outside Africa. Africa is an important continent in the world because most of the trade in the world passes through the African seas. Northern Africa is also an important oil producer together with other Arab states and then there is trade with these countries, some countries also produce products that are important in daily use, such as Cocoa. In return these countries purchase grains and other commodities from Western and European countries. Due to unrest the oil price spiked to record levels since 2008 before the economic melt down. The Suez channel is an important gate-way between Europe, Africa, Oceania and Asian countries together with the route alongside the Cape Point. If the Suez channel is closed down, then ships will have to move past Cape Point which will influence the shipping costs, insurance cost and delays in delivering times. Another factor that needs attention and plays a bigger role is the pirates off the Senegal coast. In 2011 alone they have made more than 60 attempts to hijack ships of which more than 15 were successful. These pirates then claim a ransom which they use to buy weapons. Are Africa and the World strong enough to survive these conditions to provide a better world for all?
Beef Market Trends
• International: The US and AU beef market prices traded higher during the week compared to the previous week. Top inside was 0,8% higher at 227,02 $/cwt, Rump was 0,9% higher at 285,82 $/cwt, Strip loin was a 5,3% higher at 559,75 $/cwt, Chuck was the same at 226,03 $/cwt, and Brisket 0,4% higher at 172,88 $/cwt. Australian cattle producers welcome the recent kick in cattle prices, which saw the Eastern young cattle indicator hit an all-time high, prices across other major beef producing nations have also risen into record territory. Supported by recovering global beef demand and reduced global supplies, cattle prices in major exporting nations, such as Brazil, Australia and US have all risen significantly in 2011 and are well above year on year levels. US cattle futures prices reached record highs during the past week, fuelled by a low US$ and speculation of increased imported beef demand from Japan. Cattle prices in Brazil are also significantly above the same period than in 2010, with a strong domestic market keeping more beef at home, further tightening available supplies for the export market. A rise in cattle numbers across Queensland and selling returning to Roma in Australia had an positive influence on steer prices. BSE was confirmed in six-and-a-half year old dairy cow in Albert, Canada. This is the first Canadian case in more than a year. The discovery was made as a result of the national BSE surveillance program, which has tested some 313,000 cattle since 2003. There have been 18 cases of mad cow disease in Canada since 2003, a number that peaked at five in 2006. No part of the identified cow's
1,000
1,300
1,600
1,900
2,200
2,500
2,800
Beef Price Trends (c/kg)
Class A Class C Contract Weaner calf NZ Import Parity
Weeks Months
*Last 3 points 3 months forecast

Absa Weekly Market Analysis
carcass entered the human food or animal feed systems and the discovery should not affect exports of Canadian cattle or beef. The age and location of the infected cow were consistent with previous cases detected in Canada. Meat demand in the post-earthquake Japanese market continued to be overshadowed by the ongoing nuclear problems, including food contamination, power rationing and low consumer sentiment. In the Japanese wholesale market, traders showed weak interest in beef. Top grade Japanese Wagyu carcase (A5) prices averaged 1,877 yen/kg this week, the lowest since February 2002. Inquiry for imported beef was also passive, as many foodservice outlets continued to register reduced customer numbers. In the Australian beef export market, most Japanese buyers remained cautious this week, on the back of the high AU$ and uncertain demand during and after a series of public holidays in Japan in April/May called the Golden Week.
The Japanese trade anticipates a gradual recovery in demand and supply in coming months, on the back of improving electricity and the arrival of spring which is traditionally a higher demand season. The Argentinean cattle herd is forecast to return to 2006 levels (58 million head) in approximately seven years. A series of negative policies applied by the Argentinean government which are aimed at increasing domestic supplies and a severe drought which hit the region in 2008/09 resulted in the cattle herd falling by 11 million head over the past four years. The herd could recover based on the assumption of a 3% annual growth in the breeding herd and improvements in the weaning rate which is driven by high weaner prices.
• Domestic: Beef prices traded mixed during the past week compared to the previous week not following the international price trend. There are signs that red meat prices will stay high and not fall back to lower number than last year. The prices of the different meat classes were as follows: Class A prices decreased by 0,6% to R26,70/kg, Class C prices increased by 0,7% to R22,20/kg and Contract prices decreased by 0,3% closing at R26,97/kg. Weaner prices closed lower at R16,40/kg compared to the previous week with more weaners available. Hide prices traded 0,4% lower compared to the previous week closing at R9,01/kg. The landed imported price of beef trimmings from Namibia and Botswana trade at R33,00/kg week on week which was the same as the previous week.
Outlook
Internationally, beef prices are expected to continue the upwards movement in the short to medium term with asideways movement in the long term until world cattle numbers have improved including the Argentinean cattle numbers. The local market, prices for red meat are expected to move downwards in the short to medium term with a sideways movement closer to Easter. Weaner’s prices will stay relative high and will slowly move downwards in the short to medium term to satisfy trade needs.
Mutton Market Trends
• International: Australian lamb prices were higher compared to the previous week. Local import parity for lamb increased by 1,3% and mutton by 0,9% respectively due to higher prices despite of a stronger SA Rand and New Zealand dollar. The past week was drier, after heavy rain fell across most of Australia over the last few months. The northern Australian coastline received decent falls, while the east coast of Australia and Tasmania were the only other regions to receive good rains. Northern Australia is set for more rain, with a tropical low pressure system and potential cyclone set to bring heavy rain to the region in the next few days. Eastern states lamb prices were higher despite more
1,400
1,800
2,200
2,600
3,000
3,400
3,800
4,200
4,600
Mutton Price Trends (c/kg)
Lamb Class C Contract NZ Lamb Parity NZ Mutton Parity
Weeks Months
*Last 3 points 3 months forecast

Absa Weekly Market Analysis
supplies with most indicator grades averaging higher. Competition from restockers remained vibrant. The Merino lamb indicator was the biggest mover and gained 17c. Light lamb prices were again buoyant. Trade lamb supplies have tightened relative to heavy lamb turnoff, which has led to a much stronger price trend as domestic buyers push for numbers. Mutton prices remain at all time highs as the limited numbers and strong export and restocker demand sustains the market. National lamb auctions reported that physical sales during March increased by 14% on the five-year average, with just over 987,500 lambs sold. Sheep numbers sold were 6% higher compared to the same period a year ago, with an influx of heavy lambs boosting auctions in recent weeks. In recent years, lamb turnoff during March has risen, with increasing offerings recorded during the past three years. In 2010/11, this trend was heavily influenced by the above average summer rainfall, with producers opting to shear lambs and then grow stock to heavier weights. The strong seasonal conditions and good price outlook has caused restocking demand to remain high.
• Domestic: This week’s mutton prices traded higher compared to the previous week. Class A2 prices closing at R42,45/kg, 0,3% higher, Class C2 prices closing at R31,00/kg, 0,4% higher while Contract prices closed at R42,30/kg, 0,2% higher. Feeder lamb is still a scarce commodity with the prices lower at R21,40/kg compared to the previous week. The average price for a Dorper skin was higher at R45,63 and a Merino skin higher at a massive R54,13 compared to the previous week. The landed imported price of Mutton, Rib from Australia and New Zealand traded the same compared to the previous week at R24,25/kg but Mutton Shoulder traded lower at R 36,95/kg.
Outlook
Internationally, prices will continue to move sideways with a possible upward movement in the short to medium term due to lower sheep numbers available for slaughtering and more sheep held back for restocking by Australian producers. Locally, the price of mutton will follow the international market and stay relative high due to lower demand as a result of consumer’s resistance against high prices. Prices of feeder lamb are expected to move sideways with a possible downwards movement in the short to medium term also due to consumer pressure for high prices.
Pork Market Trends
• International: US pork prices were higher again during the past week. The price of a Carcass was 1,39% higher at US$ 94,35/cwt, Loin was 1,40% lower at US$ 97,98/cwt, Rib was 0,39% higher at US$ 141,48/cwt, while Ham was 5,17% higher at US$ 80,10/cwt due to better demand. Import parity was 2,90% higher despite of a stronger rand compared to last week. The price of fresh loins was steady but Boston butts were higher. Skinned ham was steady to weak, Sdls bellies were not tested with lean trimmings lower. Trading was slow to moderate with light to moderate demand and offerings. China’s top meat processor has made another apology over the scandal which erupted recently in China, whereby pork meat that had been contaminated with the illegal drug clenbuterol was uncovered. Clenbuterol is fed to pigs so that leaner meat can be produced bringing in more money for the meat. Many retailers as a result recalled products affiliated with the subsidiary. Foot and Mouth disease has been detected in China's
500
800
1,100
1,400
1,700
2,000
2,300
Pork Price Trends (c/kg)
Porker Baconer Import Parity Export Parity
Weeks Months
*Last 3 points 3 months forecast

Absa Weekly Market Analysis
northwestern region. The disease was found in pigs which killed 25 pigs and sickened another 58 pigs. This is the second outbreak in the region in 2011. The recent outbreak was less serious than the one reported in February, when 3,941 pigs were culled. Japan's wholesale pork prices have been particularly volatile since the unprecedented disaster in March. The disruptions to supplies, transport and electricity have all contributed to the fluctuation, with the regional difference in prices reflecting the degree of the earthquake's impact. Wholesale pork carcase prices in both the Tokyo and Osaka markets surged in response to the earthquake, particularly in Osaka where there was no damage to infrastructure. Since then, the Osaka pork market prices have been consistently higher than Tokyo, averaging 536 yen/kg during March which was 31% higher than the March 2010). In contrast, Tokyo market prices fell substantially after their peak on 15 March, with recent prices averaging lower than the pre-quake levels. Many supermarkets in the Kanto region (Tokyo and surrounding six prefectures) were reportedly operating with a reduced number of fresh food items on their shelves, due to uncertain power supplies and unresponsive consumer demand.
• Domestic: The pork prices were mixed the past week not following the international pork market. The price of Porkers decreased by 0,56% to R15,95/kg, while the price of Baconers increased by 0,56% to R16,15/kg and the price of Contract meat stayed the same at R16,05/kg compared to the previous week. The imported landed price of loin from Canada and the US was traded the same at R27,50/kg week on week according to AMIE.
Outlook
Internationally, prices are expected to move upwards in the short to medium term due to an increase in demand especially Japan. Locally, the prices are expected to move sideways in the short term with a possible upward movement in the medium term due to shortages and the higher prices of substitute products. Poultry Market Trends
• International: The poultry prices in the US were lower during the past week compared to the previous week. Whole bird prices was 1,05% lower at 81,0c/lbs due to lower demand. Breasts traded 0,4% lower at 126,5c/lbs and legs quarters traded 2,17% lower at 45c/lbs. Whole broiler fryer prices were trending lower but steady. Majority prices were unchanged in all areas compared to early week prices. Offerings were light with light interest. Retail and food service demand was light to moderate but best in the fast food sectors and where promotions were given. Floor stocks were light to moderate with sizes at desirable to light weight. The market activity was moderate. In the parts structure, movement was moderate for late week business. Prices were trending steady to weak for small wings and boneless skinless breasts. Tenders and most dark meat items were steady to firm with good movement. All remaining items are generally steady. Supplies were light for tenders, moderate to heavy for boneless skinless breasts, and moderate for all other items. Market activity for parts was moderate. In production areas, live supplies were moderate for mixed, but mostly at desirable weights. Chicken fingers also called chicken strips, chicken tenders, or chicken fillets are chicken meat that does not include any bones or skin. Chicken fingers are prepared by dipping chicken meat in a breading mixture and then deep frying them, or by grilling them with
775
975
1,175
1,375
1,575
1,775
1,975
2,175
Poultry Price Trends (c/kg)
Whole Frozen Whole Fresh IQF Import Parity
Weeks Months
*Last 3 points 3 months forecast
Absa Weekly Market Analysis
no breading. Traditionally, chicken fingers are primarily white meat, made from the rib meat trimmed from the breast. A poultry farm in southwest Missouri was quarantined after a case of avian flu was found. US farmers lose billions of dollars in sales each year because of China’s import restrictions on wheat, poultry, pork, cotton and other food and agricultural products. It is estimated that Chinese tariffs and quotas reduced US agricultural exports by as much as $2,1 billion in 2009 with wheat and poultry being generally the most affected. China is the US number one market for US agricultural product exports, but China’s unjustified trade barriers are blocking some of the goods such as wheat and beef.
• Domestic: Poultry prices closed mixed this week compared to the previous week. Frozen birds traded 13c/kg higher at R 15,55/kg (0,84%) compared to last week. Whole fresh medium bird prices traded 9c/kg lower at R 19,65/kg (0,46%) compared to last week but IQF prices traded higher at R 13,13/kg (0,15%) compared to the previous week. The landed price of imported chicken leg quarters and grillers from Brazil traded mixed with leg quarters higher at R 13,00/kg and grillers higher at R17,24/kg week on week according to AMIE.
Outlook
Internationally, the prices will move sideways in the short to medium term with a possible upwards movement because of higher demand and high red meat prices. Locally, the market is expected to move sideways in the short term with a sideways movement in the medium term but the coming holidays and higher feeding cost as a result of higher fuel and grain prices can enhance the prices.
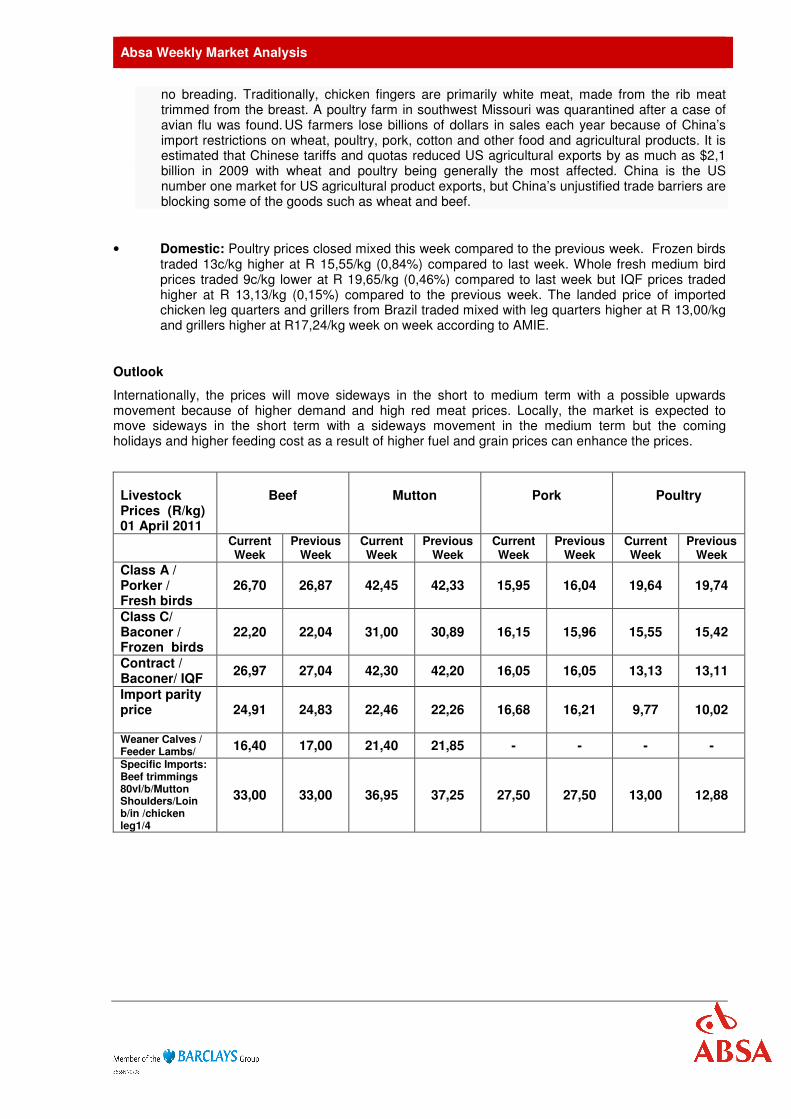
Livestock Prices (R/kg) 01 April 2011
Beef
Mutton
Pork
Poultry
Current Week
Previous Week
Current Week
Previous Week
Current Week
Previous Week
Current Week
Previous Week
Class A / Porker / Fresh birds
26,70 26,87 42,45 42,33 15,95 16,04 19,64 19,74
Class C/ Baconer / Frozen birds
22,20 22,04 31,00 30,89 16,15 15,96 15,55 15,42
Contract / Baconer/ IQF
26,97 27,04 42,30 42,20 16,05 16,05 13,13 13,11
Import parity price
24,91 24,83 22,46 22,26 16,68 16,21 9,77 10,02
Weaner Calves / Feeder Lambs/ 16,40 17,00 21,40 21,85 - - - -
Specific Imports: Beef trimmings 80vl/b/Mutton Shoulders/Loin b/in /chicken leg1/4
33,00 33,00 36,95 37,25 27,50 27,50 13,00 12,88

Absa Weekly Market Analysis
Yellow Maize Trends
• International: The average US yellow maize spot prices closed the week 1,4% or US$ 4,16/t lower compared the previous week. Maize saw spillover support from soybeans and wheat. Two reports which the market had been cautious of was the US plantings intentions for 2011/12 and grain stocks at the beginning of March. The plantings report, which was long awaited for, was less drammatic. Planted acres for maize and soybeans came in near expectations but maize and soybean are still going to be short of numbers needed to rebuild stocks. The USDA’s report for maize was bullish sending futures limit up which also provided support to wheat and soybeans. Maize acres were slightly higher than expected at 92,2 million acres and soybeans came in somewhat below expectations at 76,6 million acres. Quarterly stocks were also lower than expected for maize and soybeans. Stock numbers for maize confirm an extremely tight situation for old crop numbers as March maize numbers came in at 6,52 billion bushels which was below trade expectations. Maize also had very bullish export sales with a marketing year high as old crop export sales came in at 1,914,900 tons. US maize stocks fell at the start of this month to 6,53bn bushels, USDA data showed. That's down 15% year on year and 170m bushels below forecasts or equivalent to production of more than 1m acres of maize. That might not be so bad if prices had done enough to encourage US farmers to max out plantings this year, but prices haven't hit all the right notes. A rise of 8,6m acres allocated to the eight major crops is a big step in the right direction to keep up world supplies but it is 1,2m acres short of the USDA's hopes, and more than 6m acres short of the recent high in plantings. Enough plantings of maize at this level would still leaves a lot to the weather if farmers are to produce enough maize to restore significantly supply pipelines. One-third of the 4m extra maize acres are expected to come in the Dakota area, which have a history of producing below-average yields. Maize, wheat and soybeans prices are high after new government reports did little to ease concerns about global supplies. Meanwhile demand continues to build up.
The quarterly US inventories report data from March did not disappoint, by showing soybean stocks 50m bushels lower than expected and maize 170m bushels below expectations. The maize stocks number was the most bullish scenario that could have been released. On US crop inventories, the concern among maize investors are that a better-quality crop, blessed by high weights per bushel, means that livestock farmers and ethanol plants might have been able to achieve their aims with less grain than had been thought. Shrinkage over the winter has been historically low on maize. This equals to more maize, which will be reflected in the feed and residual numbers with less use than might be expected and greater stocks. Argentina is about to authorize the export of 3 million tons more maize in 2010/11 as the government works to find new markets, including China. The South American country is the world's second-biggest maize exporter after the United States, but the government restricts exports of maize and wheat to ensure the local market doesn’t fall short. It has already allowed shipment of 8,5 million tons of 2010/11 maize, which has been harvested several weeks ago. Three million tons more will be opened up in the near future. The quota system in Argentina for maize and wheat exports are a major complain among farmers, who say the government intervenes too seriously in the sector and drives down the prices they receive by capping exports. Negotiating with China has been done last year and now there are negotiating with Russia. China, already a major market for Argentine soybeans and soyoil, has restrictions on the importation of genetically-modified maize strains, which account for about 80% of the South American’s maize crop. Chinese food health officials arrived in Argentina to work on a protocol that would pave the way for Argentina to start
800
1,050
1,300
1,550
1,800
2,050
2,300
2,550
2,800
Yellow Maize Prices (R/t)
Import Parity Export Parity SAFEX spot
Weeks Months
*Last 3 points 3 months forecast

Absa Weekly Market Analysis
shipping maize to China. Argentina is expected to harvest 20,8 million tons of maize in 2010/11. Once the 3 million tons are approved for export, bringing total authorized exports to 11,5 million tons, most of the 2010/11 will be accounted for, considering that the country consumes about 8 million tons. Argentina is also a major world supplier of soy, wheat and beef. Burning global commodities prices helped stoke economic growth of 9,2% last year in Argentina. Farmers have threatened to resume protests if they struggle to get the full, international price for maize in the domestic market.
• Domestic: The average yellow maize spot price traded 1,4% or R4,16/t lower than the previous week, following the international grain markets. However, The Rand: US dollar exchange rate was 1,2% stronger than last week. The rand strengthened from an average of R6,92/US$ two weeks ago to an average of R6,83/US$ last week. Safex futures traded mostly lower during the past week except Mar-12 which was R1/t higher: May-11 traded 0,36% (R6/t) lower, Jul-11 traded 1,24% (R21/t) lower, Sept-11 traded 1,04% (R18/t) lower, Dec-11 traded 0,9% (R16/t) lower, Mar-12 traded 0,06% (R1/t) higher and Jul-12 traded 2,59% (R47/t) lower compared to the previous week.
Outlook
Internationally, markets will move upwards because of concerns of not enough rain in the US and EU to start the planting season and very low world stocks. Locally, prices will follow the upward trend of the international market but a potential good harvest on land and a stronger rand against the US$ could influence the SA prices to stay lower.
Yellow Maize Futures 01 April 2011
May-11 Jul-11 Sept-11 Dec-11 Mar-12
CBOT ($/t) 289,75 292,50 250,93 258,10 232,03
SAFEX (R/t) 1,664 1,679 1,709 1,752 1,761
Jul-11 Sept-11 Dec-11
Ask Put Call Ask Put Call Ask Put Call
1,720 135 94 1,740 162 131 1,800 213 165
1,680 113 112 1,700 139 148 1,760 190 182
1,640 93 132 1,660 119 168 1,720 168 200
White Maize Trends
• International: The US white maize spot market traded 0,5% or US$ 1,38/t higher in the past week compared to the previous week, not following the downward trend of the yellow maize market and the other grain markets. The local import parity of white maize was 0,9% (R23,93/t) higher than the previous week due to higher prices despite of a stronger Rand. Crop supplies may be even tighter than the USDA stocks data implies, given the impact that the break in prices earlier this month had a arousing demand. China, who was to believe to be behind a 1,25m ton order of US maize, wasn't the only buyer to use lower prices as a buying opportunity. A US Meat giant had
800
1,050
1,300
1,550
1,800
2,050
2,300
2,550
2,800
03/12/10 31/12/10 28/01/11 25/02/11 25/03/11 05-11
White Maize Prices (R/t)
Import Parity Export Parity SAFEX spot
Weeks Months
*Last 3 points 3 months forecast

Absa Weekly Market Analysis
also exploited the tumble to extend its maize coverage into the last quarter of the year. Buyers will face an extremely tight summer to find maize and soybeans, and will have to cross their fingers for a better time in 2011/12.
• Domestic: The local average white maize spot price traded 3,8% (R61,60/ton) lower compared to the previous week with white maize price trading 36,9% higher than the same time a year ago. The white maize futures contracts all traded lower this week: May-11, 1,1% (R18/t) lower, Jul-11, 1,51% (R25/t) lower, Sept-11, 1,72% (R29/t) lower, Dec-11, 1,62% (R28/t) lower, Mar-1,38% (R24/t) lower and Jul-12, 0% (R0/t) traded the same.
Outlook
Internationally, the white maize price trend will follow the upward possible upward trend of the yellow maize markets due to unrest in North Africa and Japan’s needs after the Tsunami. Local prices will follow the international grain markets but exports from SA and the good harvest that will be harvested soon will keep prices down.
White Maize Futures 01 April 2011
May-11 Jul-11 Sept-11 Dec-11 Mar-12
SAFEX (R/t) 1,614 1,627 1,658 1,701 1,715
Jul-11 Sept-11 Dec-11
Ask Put Call Ask Put Call Ask Put Call
1,660 123 90 1,700 164 122 1,740 213 174
1,620 101 108 1,660 141 139 1,700 190 191
1,580 81 128 1,620 120 158 1,660 169 210 Wheat Market Trends
• International: The average weekly wheat spot price traded 2,1% (US$ 6,57/t) higher compared to the previous week. Soft Red Wheat traded 1,2% ($3,74/t) higher and Hard Red traded 3,0% ($9,40/t) higher compared to the previous week. Local import parity increased by 1,9% or R59,38/t. Wheat rallied on poor crop ratings for some areas of the hard red winter region. The USDA report scheduled spring wheat plantings at 14,4 million acres which was above trade expectations. Total wheat plantings for this year was higher up to 58,0 million acres compared with trade estimates of 57,2 million and up from 53,6 million last year. March wheat stocks were placed at 1,425 billion bushels which was higher than trade expectations of near 1,4 billion bushels which was in the range of the estimates. Weekly export sales for wheat came in at 271,500 tons for the current marketing year and 138,000 tons for the next marketing year for a total of 409,500 tons. Wheat, with plantings been set to rise by 10%, are not looking so tight, even if a dry winter has damaged autumn-planted crops as badly as some believe. Wheat is one grain on which the world is not relying on the US so much for a big harvest. Wheat followed maize, tied by their certain interchangeability for many uses, such as feed, even if the reports
1,000
1,400
1,800
2,200
2,600
3,000
3,400
3,800
Wheat Prices (R/t)
Import Parity Export Parity SAFEX spot
Weeks Months
*Last 3 points 3 months forecast

Absa Weekly Market Analysis
for wheat were deemed to be bearish. Wheat stocks were higher than the market had forecast, and it picked up some of the acres missing from other crops too. The surprise comes in the spring wheat area, which estimates increases by 5% to 14,4m acres. It is surprising that spring wheat acreage would expand so much in context where expected maize and soybean returns are much stronger in the northern Midwest region. Wheat acreage to be planted is expected to increase by 8% to 58 million acres.
• Domestic: The average SAFEX wheat future spot price traded 2,8% or R87,05/t lower this week compared to the previous week following the international yellow maize markets. This decreased in the price of international wheat this week was due to a stronger Rand: US dollar exchange rate. Safex future prices were higher during the past week: May-11 traded 0,33% (R10/t) higher, Jul-11 traded 0,65% (R20/t) higher Sept-11 traded 0,42% (R13/t) higher and Dec-11, traded 2,97% (R85/t) higher than the previous week.
Outlook
Internationally, prices will move upwards in the short to medium term with a sideways movement there after because of the higher prices of other grains. Locally, the market will follow the international market in a upward movement in the short term due to higher world prices depending on a stronger rand: US dollar exchange rate to influence prices.
. Wheat Futures 01 April 2011
May-11 Jul-11 Sept-11 Dec-11 Mar-12
KCBT ($/t) 333,63 337,45 343,22 348,48 350,68
SAFEX (R/t) 3,080 3,085 3,080 2,950 -
Jul-11 Sept-11 Dec-11
Ask Put Call Ask Put Call Ask Put Call
3,120 140 105 3,120 197 157 2,980 229 199
3,080 118 123 3,080 175 175 2,940 208 218
3,040 99 144 3,040 154 194 2,900 187 237
Oilseed Market Trends
• International: US soybean prices traded week to week on average 0,6% or US$ 2,97/t higher compared to the previous week. The current price is also still 42,9% higher compared to the same time a year ago. Soybeans saw early gains from renewed buying interest and continuing harvest delays in Brazil due to wet weather. Soybeans had export sales of old crop at 144,800 tons and new crop sales of 113,000 tons. It is difficult to see any relief for soybeans, given a forecast fall in plantings to 76,6m acres. Especially since three of the states set to lose the most acreage – Iowa, Nebraska and Ohio – are high yielders. They were the top three for yields in 2009. Soybean acreage was forecast to decline about 1% to 76,6 million acres. Soybeans supplies fell 2% to 1,25 billion bushels and wheat reserves increased 5% to 1,42 billion bushels. Soybeans got a boost from
3,000
3,250
3,500
3,750
4,000
4,250
4,500
4,750
5,000
5,250
5,500
Oilseed Prices (R/t)
Derived Soya Derived Sunflower Soya Spot Sunflower Spot
Weeks Months
*Last 3 points 3 months forecast

Absa Weekly Market Analysis
the plantings estimates at 76,6m acres which were below that of last year's and market forecasts. It will take a very big yield to keep soybean stocks from going lower, unless demand is ration with a substantially higher price. China needs these imports to keep up economic growth. They will just have to buy and secure them before the values run to much higher. Rationing will have to kick in and rationing occurs when prices are high enough that some sector is losing substantial money using it. We are not even close yet and we still today cannot name a sector that will ration at the higher price levels, given high prices that those that use maize to produce ethanol, beef or pork can achieve. Soybeans supplies fell 2% to 1,25 billion bushels and wheat reserves increased 5% to 1,42 billion bushels. US farmers say they will plant some of the biggest maize and soybean crops ever this spring, racing to keep pace with unrelenting global demand that is rapidly depleting stockpiles and driving up food costs. A government survey found maize plantings would be the second-largest since World War II and soybeans the third highest ever. But traders focused on a companion report that showed unexpectedly small stockpiles, sending maize prices up by 5%. Wheat and soybeans surged more than 3%. We are not going to run out of maize and soybeans but we are in a very tight situation.
The USDA reports stressed that US farmers are reaching the limits of arable land, with increased maize crowding out soybeans and cotton. Spring wheat planting, while among the biggest in decades, could shrink. This year's spring planting season is being watched more closely than ever by countries that are afraid that further increases in already record-high food prices could stoke unrest. Traditionally submissive US food prices are forecast to rise by 3,5%. An analysis of likely plantings and historical yields in the US suggested the maize harvest could be a record at 13,7 billion bushels, and soybeans the third-largest at 3,3 billion bushels.Maize inventories at the end of the 2011/12 season would be equal to a three-week supply. Soybeans would decline to scarcely 10 days' cover. Analysts say prices must raise high enough to reduce demand.
• Domestic: Soybean spot prices traded 4,3% or R 148,95/ton lower compared to the previous week. This decrease was due to lower prices and due to a stronger Rand: US dollar exchange rate. The current price is still 30,1% higher for the corrsponding time a year ago. The soybean futures prices traded lower this week: May-11 traded 1,33% (R45/t) lower, Jul-11 traded 1,52% (R52/t) lower, Sept-11 traded 1,67% (R58/t) lower and Dec-11 traded 1,59% (R56/t) lower compared to the previous week. The average sunflower spot price for the week traded lower and closed 0,3% (R10,65/t) lower. This was still 23,5% higher than the same time a year ago. The sunflower futures prices closed higher compared to the previous week. May-11 traded 4,00% (R159/t) higher and Jul-11 traded 3,82% (R155/t) higher compared to the previous week.
Outlook
Internationally, markets will move sideways with a possible upward movement in the short to medium term until it is sure how many hectares actuallly has been planted in the US. Wet conditions in Brazil is still a concern because it can delay the harvesting process. Locally, the oil seed market will follow the international market with a sideways movement in the short to medium term depending on strength of the rand and the actual harvesting figures.

Absa Weekly Market Analysis
Oilseeds Futures 01 April 2011
May-11 Jul-11 Sept-11 Dec-11 Mar-12
CBOT Soybeans (US $/t) 512,06 515,96 513,31 512,06 510,52
CBOT Soy oil (US c/b) 58,68 59,28 59,62 59,58 59,49
CBOT Soy cake meal (US $/t) 360,90 366,20 367,00 363,20 363,70
SAFEX Soybean seed (R/t) 3,330 3,370 3,405 3,470 -
SAFEX Sunflower seed (R/t) 4,134 4,215 4,280 4,325 -
Sunflower Calculated Option Prices (R/t) Absa Capital Trading Desk: 011 – 895 5524
Apr-11 May-11 Sept-11
Ask Put Call Ask Put Call Ask Put Call
4,260 299 253 4,320 378 338 4,360 512 477
4,220 277 271 4,280 356 356 4,320 489 494
4,180 256 290 4,240 334 374 4,280 467 512
Fibres Market Trends
• International: The EMI closed higher at 1,383AU c/kg this week which is again a 20 year high compared to last week’s 1,379AU c/kg. The Australian market indicator was up 0,29% again compared to last Wednesday's level. The next sale is on 5
th and 6
th April
2011. US cotton price decreased from 197,86 US c/lbs last week to 193,25 US c/lbs this week not following the AU wool market. Cotton total spot transactions for the week were higher at 6,002 bales compared to 4,329 bales last week and 4,496 bales a year ago. In 2010/11 season 572,191 bales of cotton was sold so far compared to 831,657 bales of cotton in the corresponding period a year ago. Cottons estimating plantings at 12,57m acres, is a big jump on last year's plantings, but some 640,000 acres short of the figure that the market had expected. Record prices have seen expanding plantings expectations for other major producers such as China, India and Pakistan. The rally in cotton futures is not finished yet, despite evidence that farmers are reacting to high prices by raping up plantings, with Pakistan targeting a record crop. Indications from all of the big-four cotton growers China, India, Pakistan and the US indicate higher plantings but the crop still faces a long growing season. Physical supplies from these harvests would not start to emerge onto the market until the fourth quarter, with crops from southern hemisphere producers Australia and Brazil providing only a little bit of help in easing tight market conditions. It was likely that the market had reached something of a ceiling, supported by tough physical demand.
• Domestic: The last sale of the current wool season was on the 29th and 30
th March 2011 with
the next sale that is scheduled for 5th and 6
th March 2011. The SA wool indicator price
increased by 0,8% from a week ago closing at R 86,26/kg, following the Australian wool market for the week. There were 10,646 bales of wool on offer of which 93,5% or 9,954 were sold. The derived domestic cotton prices was 5,06% lower than last week due to lower demand but was still 42,26% higher than a year ago.
2,500 2,600 2,700 2,800 2,900 3,000 3,100 3,200 3,300 3,400
3,500 3,600 3,700
7,800 7,950 8,100 8,250 8,400 8,550 8,700 8,850 9,000 9,150 9,300 9,450 9,600 9,750 9,900
03/12/10 07/01/11 11/02/11 18/03/11 05-11
Co
tto
n (
c/k
g)
Wo
ol
(c/k
g)
Wool & Cotton Price Trends
Australia Wool SA Wool SA Cotton
*Last 3 points 3 months forecast
Weeks Months

Absa Weekly Market Analysis
Outlook
Internationally, wool and fibre prices are rising all the time. The price of the fibres wool and cotton has not reached their ceiling and we still expect these commodities to move upwards in the short to medium term with a sideways movement due to the fact that prices getting to high. The local wool market will follow the international market in an upward trend in the short to medium term because of a shortage on world markets.
Fibres Market Trends Week ending 01 April 2011
Wool prices *SA prices
(R/kg)
Australian prices (R/kg)
Australian future May - 11
(AU$/kg)
Australian Future Jul - 11
(AU$/kg)
Wool market indicator 86,26 95,43 - -
19µ micron 114,40 119,31 15,88 15,63
21µ micron 87,30 92,37 12,50 12,30
23µ micron - 88,93 12,18 11,93
Cotton prices
SA derived Cotton (R/kg)
New York A-Index (US$/kg)
New York future May-
2011 (US$/kg)
New York future Jul-2011
(US$/kg)
Cotton Prices 33,35 4,89 4,25 4,41
Vegetables Market Trends
• Local Markets:
• Cabbages: Cabbage prices decreased by 9,7% w/w and was 10,2% lower y/y for the week under review and 39,4% lower than two years ago. The price decreased due to a 16,1% increased in volumes w/w. Prices are expected to decrease in the short term with a sideways movement in the medium term.
• Carrots: Carrot prices decreased by 4% w/w and was 41,0% lower y/y and 35,8% lower than two years ago. The prices decreased due to a 13,3% increased in supplies. Prices are expected to sideways in the short to medium term due to normal demand in the next few months.
• Onions: Onion prices increased again by 6,5% w/w but were 16,6% lower y/y and 38,6% lower than two years ago for the corresponding week. The prices increased despite of a 21,1% increase in volumes. Prices are expected to move upwards in the short to medium term due to lower supplies during winter.
• Potatoes: Potato prices decreased by 4,9% w/w and were 38,7% lower y/y and 42,4% lower than two years ago. Prices decreased due to a massive 22,2% increase in volumes compared to the previous week. Prices are expected to move upwards in the short to medium term due to higher demand.
• Tomatoes: Tomato prices decreased by a massive 6,2% w/w and was 30,3% lower y/y and 42,3% lower than two years ago. The decreased in prices were due to a 17,6% increased in volumes compared to the previous week. Prices are expected to move upwards in the short to medium term due to higher demand and lower quantities.
500
1,500
2,500
3,500
4,500
5,500
6,500
7,500
Selected Fresh Produce Markets -Average Vegetable Prices (R/t)
Cabbages Carrots Onions Potatoes Tomatoes
*Last 3 points 3 months forecast
Weeks Months

Absa Weekly Market Analysis
Vegetable Prices: Fresh Produce Market (Averages on the Pretoria, Bloemfontein, Johannesburg, Cape Town and Durban markets) Week ending 01 April 2011
This week’s Average Price (R/t)
Previous week’s Average Price (R/t)
This week’s Total Volumes (t)
Previous week’s Total Volumes (t)
Cabbages 1,498 1,658 1,440 1,240 Carrots 3,186 3,320 1,345 1,187 Onions 2,364 2,220 5,501 4,541
Potatoes 1,882 1,978 15,031 12,305 Tomatoes 3,100 3,304 4,895 4,161
Enquiries: Dawid Snyman Sector Intelligence Specialist Absa AgriBusiness E-mail: [email protected]
Disclaimer: Although everything has been done to ensure the accuracy of the information, Absa Bank takes no responsibility for actions or losses that might occur due to the usage of this information.