Week 5 – Microsoft Project 2007 Tutorial - Samuel...
21
Project Management Week 5 – Microsoft Project 2007 Tutorial
Transcript of Week 5 – Microsoft Project 2007 Tutorial - Samuel...

Project Management
Week 5 – Microsoft Project 2007 Tutorial

Project Activities ID TASK NAME DURATION PREDECESSORS
1 A1 CLIENT WORKSHOP 10 -
2 A2 CASE MODEL 15 1
3 A3 USER REVIEW 10 2
4 B1 Db DEFINITION 10 2 FS + 5 days
5 B2 FORMS DESIGN 20 4
6 B3 REPORT DESIGN 5 3,5
7 C1 SYSTEM TESTING 20 5
8 C2 HANDOVER TO CLIENT 5 6,7

Using MS Project • On each row enter:
– Task Name – Duration and – Predecessor – Leave out Start Date and Finish Date

Entering Lag Time
• Double click on the Task
• The Task Information Dialog Box appears
• Choose the Predecessor Tab
• Enter the Lag time in the table

Entering a Start Date
• Go to Project menu
• Select Project Information
• Top left hand corner you will see: – Project Start Date
– Project Finish Date
– Schedule from
(default is Project Start Date, but you can actually work backwards given a constraint of a finish date)

• Click on the Pull down menu
• Scroll to your month and year
• Choose date: 1st March 2010
• Click on OK to the bottom of the dialogue box
• Should get a Finish Date: 25th June 2010
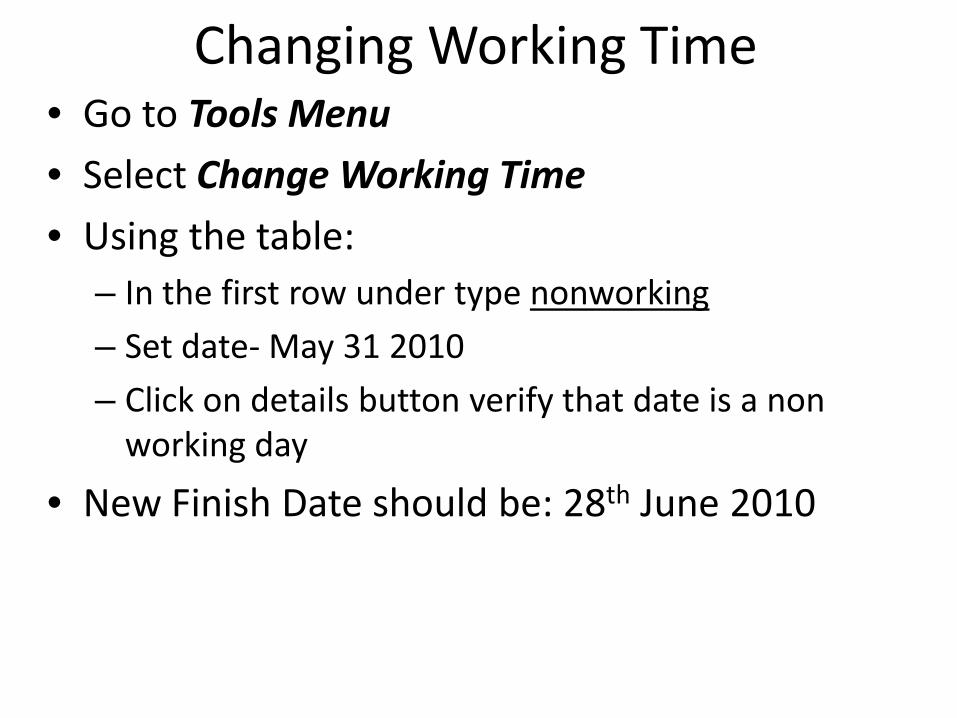
Changing Working Time • Go to Tools Menu
• Select Change Working Time
• Using the table: – In the first row under type nonworking
– Set date- May 31 2010
– Click on details button verify that date is a non working day
• New Finish Date should be: 28th June 2010

Formatting the bars to show Critical Tasks
• Go to Format menu
• Select Bar Styles
• Scroll to end of table and on a new row – Enter Critical in ‘Name column’
– Use drop down menu in the ‘Show For column’ select critical
• Click on Bars Tab
• In middle section change ‘Color’ to red
• Click OK

Resource Allocation ID TASK NAME Resources
1 A1 CLIENT WORKSHOP SA [2], PG[0]
2 A2 CASE MODEL SA[1], PG[0]
3 A3 USER REVIEW SA[3], PG[1]
4 B1 Db DEFINITION SA[2], PG[2]
5 B2 FORMS DESIGN SA[0], PG[3]
6 B3 REPORT DESIGN SA[1], PG[3]
7 C1 SYSTEM TESTING SA[2], PG[2]
8 C2 HANDOVER TO CLIENT SA[2],PG[1]
RATES: SA- $400.00/DAY PG- $300.00/DAY

Adding resources for a task • Double click on the first task • Select the Resources Tab from the Task
Information Dialogue Box • Under Resource Name column type in the
name of the resource to be used. Eg. Systems Analyst
• Under Units enter the number of resources required. 100%=1 person
• Repeat for use of more than one resource for a task

Repeat for each task • Repeat the previous procedure for each task
• Remember once you have entered a resource once, there is no need to type it again, just use the drop down menu in the Resource Name column to select the resource.
• Remember to be consistent. Don’t enter SA, sa, Sa to mean the same, because they are in fact different resource as they are spelt differently.

Entering the Rates for Resources
• Go to View menu
• Select Resource Sheet
• Enter the rates in the Std. Rate column for the respective resource
• Be sure to put in the time factor, $/day (per day), $/hr (per hour)
• If there are unwanted resource you can delete by right clicking on the ID number of the resource in question and select Delete Resource.

Inserting a New Column • Make sure you are on the Gantt Chart View.
– View Menu, select Gantt Chart
• Right click on the column heading that you want the new column to go next to
• Select Insert Column OR
– Click on the column next to were you want the new column to go
– Use the Insert Menu choose Column
• In the Column Definition Box, change the Field Name from ID to the name of the new field you want

• Use the drop down menu to choose from the list provided.
• Commonly used fields are: Fixed Cost, Cost, Total Slack, Free Slack

Generating Reports MS Project 2003
• Go to View menu
• Select Reports
• Click on the Category e.g. Costs
• Click on Select
• Click on the type e.g. Budget
• Choose Select

Generating Reports MS Project 2007
• Go to Reports Menu
• Click on Reports
• Click on the Category e.g. Costs
• Click on Select
• Click on the type e.g. Budget
• Choose Select

Work Completed as at 15 May 2009
ID TASK NAME % Complete
1 A1 CLIENT WORKSHOP 100 %
2 A2 CASE MODEL 60%
3 A3 USER REVIEW 100%
4 B1 Db DEFINITION 40%
5 B2 FORMS DESIGN 80%
6 B3 REPORT DESIGN 0%
7 C1 SYSTEM TESTING 0%
8 C2 HANDOVER TO CLIENT 0%
Reschedule Finish Date: 15th May 2010

Adding Work Completed for a task
• Double click on the first task
• Select the General Tab from the Task Information Dialogue Box
• Enter the % complete in the Percentage Complete Box
• Repeat for each task

Rescheduling Uncompleted Work to start after a particular date
• Go to Tools menu
• Select Tracking then Update Project
• On the Update Project dialogue box select Reschedule uncompleted work to start after
• Enter date using drop down menu 15th May 2009
• Select entire project
• Click on OK

• Look at the last task on the Gantt chart you will see the new finish date
• Notice on the blue bars of the task that were uncompleted but should have been completed to date, are now split using……… to show that we have reschedule to uncompleted work to start after a certain date

Viewing Project Statistics
• Go to Project menu
• Select Project information
• Click on the Statistics button to the bottom left corner
• The Statistics dialogue box shows a summary of the project